
Alternative analytical methods for ibrutinib quantification in pharmaceutical formulation: A statistical comparison
-
Erten Akbel
 ,
Serdar Güngör
,
Serdar Güngör

Abstract
Ibrutinib is a drug used for the treatment of marginal zone lymphoma, mantle cell lymphoma, lymphocytic leukemia, chronic graft, and Waldenstrom macroglobulinemia. A simple, sensitive, and fast liquid chromatographic and spectrophotometric method for the quantification of ibrutinib in pharmaceutical forms and bulk was developed and validated. The chromatographic technique was developed using an ODS 3 C 18 (250 mm × 4.6 mm i.d., 5 µm) column. The mobile phase was a mixture of 0.1% trifluoroacetic acid in water and acetonitrile (50/50, v/v) at a flow rate of 1.0 mL·min−1. Eluent detection was carried out at a wavelength of 260 nm using a ultraviolet detector. The retention time of ibrutinib was found to be 5.27. On the other hand, Ibrutinib was determined using a spectrophotometric technique by measuring the absorbance of the solutions at a wavelength of 260 nm. The developed techniques were validated in accordance with the protocols outlined in International conference on harmonisation of technical requirements for registration of pharmaceuticals for human (ICH) guidelines Q2(R1). Correlation coefficients for both methods were greater than 0.999 in the concentration range of 5–30 mg·mL−1. The relative standard deviation values were low in intraday and interday precision tests. The accuracy of the developed techniques ranged 99.74–100.23% for the chromatographic method and 99.32–100.76% for the spectrophotometric method. The limits of detection and quantitation were 0.90 and 2.80 µg·mL−1 for the chromatographic method and 1.10 and 3.20 µg·mL−1 for the spectrophotometric method. The developed and validated analytical methods can be safely used in quality control tests for the determination of the amount of ibrutinib in pharmaceutical products.
1 Introduction
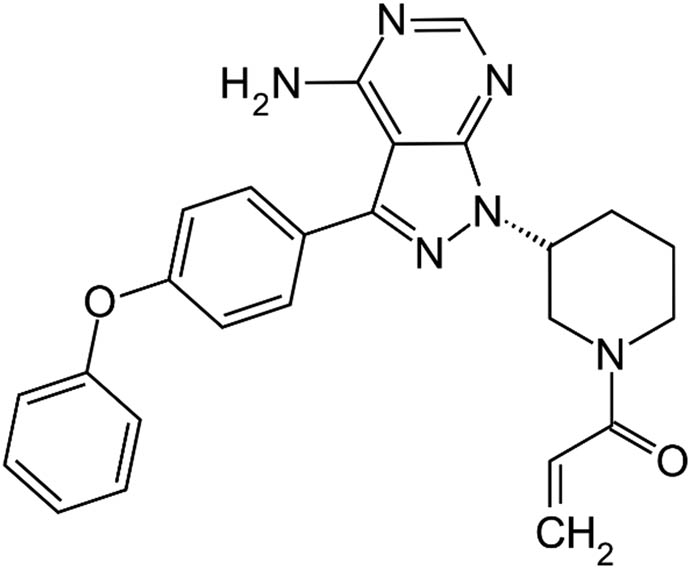
Ibrutinib belongs to a family of drugs known as kinase inhibitors. It is used in the treatment of marginal zone lymphoma, mantle cell lymphoma, Waldenstrom macroglobulinemia, small lymphocytic lymphoma, chronic lymphocytic leukemia, and chronic graft-versus-host disease. It works by stopping the function of the abnormal protein that sends a proliferation signal to cancer cells. This slows the spread of cancer cells. It was first approved by the FDA for the treatment of mantle cell lymphoma (2013) and chronic lymphocytic leukemia (2014). It has also shown efficacy in patients with Waldenström macroglobulinemia. It has a high rate of plasma protein binding, which has a big impact on drug distribution and pharmacokinetics. This suggests that Ibrutinib has a reasonably high affinity for plasma proteins [1,2,3,4,5]. The chemical properties of galantamine are given in Table 1 [6].
Chemical properties of ibrutinib
| Property | Value | |
|---|---|---|
| Chemical formula | C25H24N6O2 | |
| Molecular weight | 440.50 | |
| Melting point | 149–158°C | |
| Log P | 3.63 | |
| pK a | Strongest acidic | 19.70 |
| Strongest basic | 6.58 | |
| Solubility | It is practically insoluble in water, soluble in methanol, freely soluble in dimethyl sulfoxide | |
| Chemical structure |
|
|
There are several articles on the detection of ibrutinib in pharmaceutical formulation and biological fluids; the methodologies used herein include liquid chromatography-tandem mass spectrometry (LC-MS-MS) [7], liquid chromatographic methods [8,9,10,11,12,13], and ultra-high-performance liquid chromatography coupled to photodiode array detection method [14]. The ibrutinib monograph is not yet available in pharmacopeias and has not been reported in the spectrophotometric method for the quantification of ibrutinib.
However, these methods had limitations such as sample preparation, gradient elution, and run time. These techniques also need the use of expensive equipment, specialized reagents, and a large amount of organic solvents. Some of these techniques are quite complex.
This study aims to develop simple, fast, inexpensive, well-validated alternative chromatographic and spectrophotometric methods for the quantification of ibrutinib in pharmaceutical formulations. Also, these methods are less time-consuming and cheaper compared to other published methods. The results obtained from these analytical techniques were compared statistically using the least-squares method. Furthermore, the applicability and reliability and of these methods have been assessed by concentrating on routine quality control analyses. Therefore, the current study can be used for the quantification of drugs in bulk and pharmaceutical dosage forms, and successfully applied for routine quality control analysis. In addition, analytical methods developed for ibrutinib quantification were assessed statistically.
2 Materials and methods
2.1 Chemical and reagents
Ibrutinib reference standard (≥98.0%), trifluoroacetic acid (≥99.0%), acetonitrile (≥99.9%), and methanol (≥99.9%) were purchased from Sigma-Aldrich Chemie GmbH. Imbruvica® extended-release capsule (140 mg) was purchased from the local pharmacy. Ultrapure water was produced using a water purification system (Merck Millipore, USA).
2.2 Analytical instruments
Chromatographic analyses were performed using an Agilent 1260 system consisting of a quaternary pump, autosampler, UV detector, and ChemStation software. Spectrophotometric analyses were carried out using a Shimadzu UV 1800 spectrophotometer with UV-Probe software and 1 cm quartz cuvette.
2.3 Chromatographic separation
Chromatographic separation was carried out using an ODS 3 C 18 (250 mm × 4.6 mm i.d., 5 µm) column. Before analysis, all solvents and solutions were sonicated and filtered through 0.45 µm membrane filters. A mixture of 0.1% trifluoroacetic acid (TFA) in water and acetonitrile (50/50, v/v) was used as the diluents at a flow rate of 1.0 mL·min−1. Eluent detection was carried out at a wavelength of 260 nm using a ultraviolet (UV) detector.
2.4 Standard solutions
To prepare a stock solution of ibrutinib (500 µg·mL−1), 25 mg of reference standard was weighed precisely and transferred to a 50 mL volumetric flask, and a 15 mL diluent was added. The volumetric flask contents were sonicated for 5 min, and the volume was filled up to the mark with diluent. The standard solution series (5–30 µg·mL−1, n = 6) was prepared by diluting the stock solution with diluent.
2.5 Sample solution
The contents of ten capsules were weighed precisely and ground into powder in a mortar. The capsule powder containing 50 mg of ibrutinib was weighed precisely into a 100 mL beaker, 75 mL of diluent was added to it and dissolved. The contents of the beaker were transferred to a 100 mL volumetric flask and sonicated for 10 min in a sonicator, then the diluent was added to make up the volume to 100 mL. By diluting this solution with diluent, a sample solution was prepared at a concentration of 20 µg·mL−1 and filtered through a 0.45 µm filter.
2.6 Method development
Chromatographic conditions were optimized by various factors such as the composition of the mobile phase, flow rate of the mobile phase, pH of the mobile phase, and column type. Optimization of chromatographic conditions was carried out to obtain good peak parameters, such as a good peak shape, a short retention time, and queuing factor, as well as the theoretical number of plates. Different ratios of water:methanol, water:acetonitrile, and methanol:acetonitrile were tested as mobile phase. Columns of different lengths of C18 and C8 were tested. However, both defective peak shape and weak system compliance parameters were obtained. The retention time rose as the water content of the mobile phase increased, resulting in a higher tailing factor and the creation of asymmetric peaks. To develop and validate an efficient method for quantification of ibrutinib in pharmaceutical formulations, chromatographic conditions were optimized. First, the wavelength at which the ibrutinib standard solution absorbs UV rays to the maximum was determined. A reference solution at a concentration of 25 µg·mL−1 was scanned in the 200–800 nm region for this purpose. A wavelength of 260 nm was chosen to reduce baseline noise at maximum absorption of ibrutinib; there was no interference from solvents, excipients, or contaminants in the pharmaceutical formulation at this wavelength. The mobile phase consisted of various acetonitrile and water compositions, initially kept as 20–80, v/v. Very long analysis times were obtained. The mobile phase was then acidified with tetrahydrofuran, and different flow rates were used to determine the assay method. Columns with many different properties were tested, and good peak shapes (sharp peaks) and good resolution were obtained with the ODS 3 C 18 (250 mm × 4.6 mm i.d., 5 µm) column. A long column was used both to see impurities that could interfere with an ibrutinib peak in sample solutions and to ensure that there were no matrix components left in the column for much longer under the specified conditions, and the sample solution was analyzed for 60 min. However, continuing the analysis after 10 min will increase both the analysis time and the cost of the analysis. As a result of the sample analysis, which was injected into the system consecutively with a 10-min analysis time, no interference peaks were found. Due to all this, the analysis time was determined to be 10 min. The chromatographic analysis was carried out at 25°C, which has several advantages, including superior chromatographic peak shape, increased column efficiency, and reduced column pressure, in addition to being cost-effective. The reasonable retention time and best separation were obtained with a mobile phase ratio of 0.1% TFA in water and acetonitrile (50:50, v/v), a flow rate of 1.0 mL·min−1, a column temperature of 25°C, and an injection volume of 20 µL.
The spectral pattern and maximum absorbance values of ibrutinib were extensively analyzed. Different solvents (ultrapure water, methanol, ethanol, and isopropyl alcohol) were used for UV spectrophotometric analysis. The best spectra of ibrutinib were obtained in methanol, and this solvent was used in UV spectrophotometric analyses.
2.7 Method validation
Selectivity, linearity, accuracy, precision, robustness, limit of detection (LOD), and limit of quantification (LOQ) are all validation parameters. The International conference on harmonisation of technical requirements for registration of pharmaceuticals for human (ICH) guidelines were used as a guide for the validation of analytical methods [15,16,17,18,19,20,21,22]. Parameters such as selectivity, linearity, accuracy, precision, robustness, and LOD and LOQ were validated.
2.8 System suitability test
Six replicates of ibrutinib standard solution (20 µg·mL−1) were injected to determine system suitability. Peak area, retention time, theoretical plate number, and tailing factor were measured. The RSD% values of six injections were calculated. Chemstation software was used to calculate system suitability parameters (tailing factor <2.0, theoretical plate number >2,000, and RSD% <2.0).
2.9 Selectivity
The selectivity of the analytical methods was evaluated by comparing the chromatograms and spectra obtained from the analysis of standard and sample solutions. To evaluate the selectivity of the chromatographic method, a sample and a standard solution were prepared and injected into the chromatographic system. The obtained chromatograms were compared, and the presence of interfering peak(s) was examined. To evaluate the selectivity of the spectrophotometric method, a sample and a standard solution were prepared, and spectra of both solutions were taken in the spectrophotometer device in the wavelength range of 200–800 nm. The obtained spectrums were compared, and the presence of interfering bands was examined.
2.10 Linearity
Stock standard solutions (500 μg·mL−1) were prepared in triplicate. Six standard solutions were diluted from stock standard solutions in the concentration range of 5–30 µg·mL−1 for both methods. These solutions were injected into the chromatography column in triplicate; 20 µL of the volume of injection remained constant. Methanol was utilized as a solvent for the spectrophotometric analyses. UV spectrum of standard solutions was recorded between 200 and 800 nm, and absorbance values were measured on the spectrophotometer. The linearity was examined by analyzing six standard solutions (n = 3) in the range of 5–30 µg·mL−1 for both methods. The calibration curve was created for standard solutions by plotting the responses against concentrations. Regression analysis was carried out using the least-squares method with the data obtained from both analytical methods.
2.11 Precision
The precision of analytical methods was assessed both in terms of method and system precision. Method precision was evaluated in two different ways, both intra-day precision and inter-day precision. System precision was evaluated by analyzing six commercial ibrutinib sample solutions on the same day and under the same chromatographic conditions. The RSD% values of peak area were computed. Six test results from three consecutive days were analyzed to determine intermediate decisiveness. Six test solutions at the same concentration were analyzed on the same day to determine repeatability. The results were reported in the form of an average, standard deviation, and RSD% values.
2.12 Accuracy
The method’s accuracy was determined by adding three different quantities of the ibrutinib standard to the sample solution and amplifying it. The amounts added were 80%, 100%, and 120% of the target concentration (20 mg·mL−1), respectively. At each concentration, these samples were made in triplicate, and the % recovery quantities were calculated.
2.13 Sensitivity
To assess the sensitivity of chromatographic and spectrophotometric techniques, the detection and quantification limits were utilized. They were calculated separately depending on the standard deviation of the slope and intercept of the calibration curve using the equations:
where S is the slope of the calibration curve and σ is the standard deviation of the y-intercept.
2.14 Robustness
To evaluate the robustness of the chromatographic method, minor changes at a flow rate (0.9 and 1.1), acetonitrile content of the mobile phase (48:52 and 52:48 v/v), column temperature (20°C and 30°C), and detection wavelength (257 and 263 nm) were made. The effect of these changes on the results of the analysis was investigated. Minor changes in organic solvent (ethanol and isopropyl alcohol) and detection wavelength (257 and 263 nm) were made to evaluate the robustness of the spectrophotometric method. The effect of these changes on the results of the analysis was investigated.
2.15 Analysis of pharmaceutical formulation
Recommended methods were used for quantification of ibrutinib in the capsule dosage form. The sample solution was prepared from capsules and processed as a test solution. The obtained peak area (n = 6) and absorbance value were compared with an ibrutinib standard solution at the same concentration level and the amount specified on the drug package.
2.16 Solution stability
Throughout 24 h, the stability of the standard solution (20 µg·mL−1) was examined. During the stability research, standard solutions were kept at room temperature (25°C) and shielded from light. For this purpose, the standard solution was analyzed by chromatographic method with 8-h periods, and the peak area was determined and recorded. The standard solution was analyzed using the spectrophotometric method with 8-h periods, and the absorbance values were determined and recorded. RSD% values were calculated for the absorbance values of ibrutinib standard solutions.
2.17 Comparative analysis
After validation, the developed analytical techniques were determined to be suitable for quantifying ibrutinib in pharmaceuticals. The recovery percentages were statistically compared when both analytical techniques were employed on commercial pharmaceuticals. For this, the F-test and the t-test were utilized.
3 Results
3.1 Determination of detection wavelength
To determine the λ max value, the standard solution (25 µg·mL−1) was scanned on a spectrophotometer device in the spectral mode in the range of 200–800 nm. Measurements were obtained against methanol as a blank. As shown in Figure 1, it was observed that the ibrutinib standard solution had maximum absorption at 260 nm wavelength. Therefore, a wavelength of 260 nm was chosen for ibrutinib quantification. The absorbance values of the standard solution series at the wavelength of 260 nm were recorded, and it was shown that the absorbance values were proportional to the concentration of standard solutions.
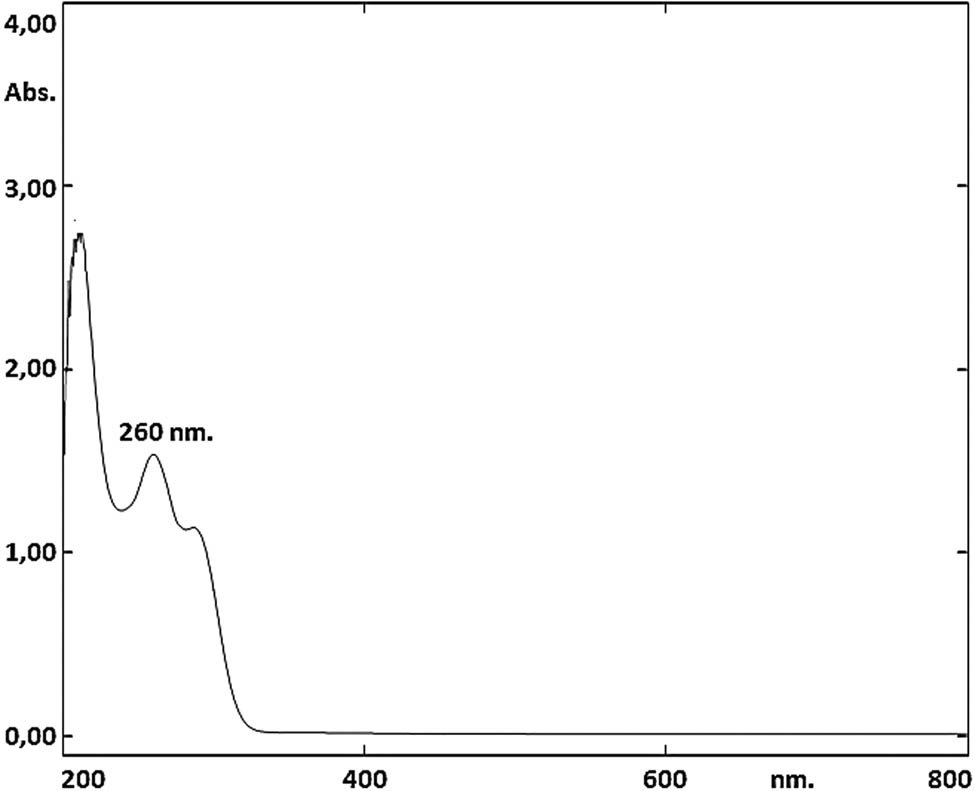
UV spectrum of ibrutinib standard solution (25 µg·mL−1).
3.2 Development of methods
The goal in developing the chromatographic method was to achieve good performance of the analytical method in a short run time. After various tests, the method was optimized as a mixture of 0.1% TFA in water and acetonitrile (50:50, v/v) at a flow rate of 1.0 mL·min−1 at 260 nm for a run time of 5.17 min. An ODS 3 C 18 (250 mm × 4.6 mm i.d., 5 µm) column was used in an isocratic mode These chromatographic conditions provided a reasonable retention time and good tailing factor for ibrutinib. On the other hand, Ibrutinib was determined by a spectrophotometric technique by measuring the absorbance of the solutions at a wavelength of 260 nm. Chromatograms obtained by the HPLC method are given in Figure 2. Spectra obtained by the spectrophotometric method are given in Figure 3.
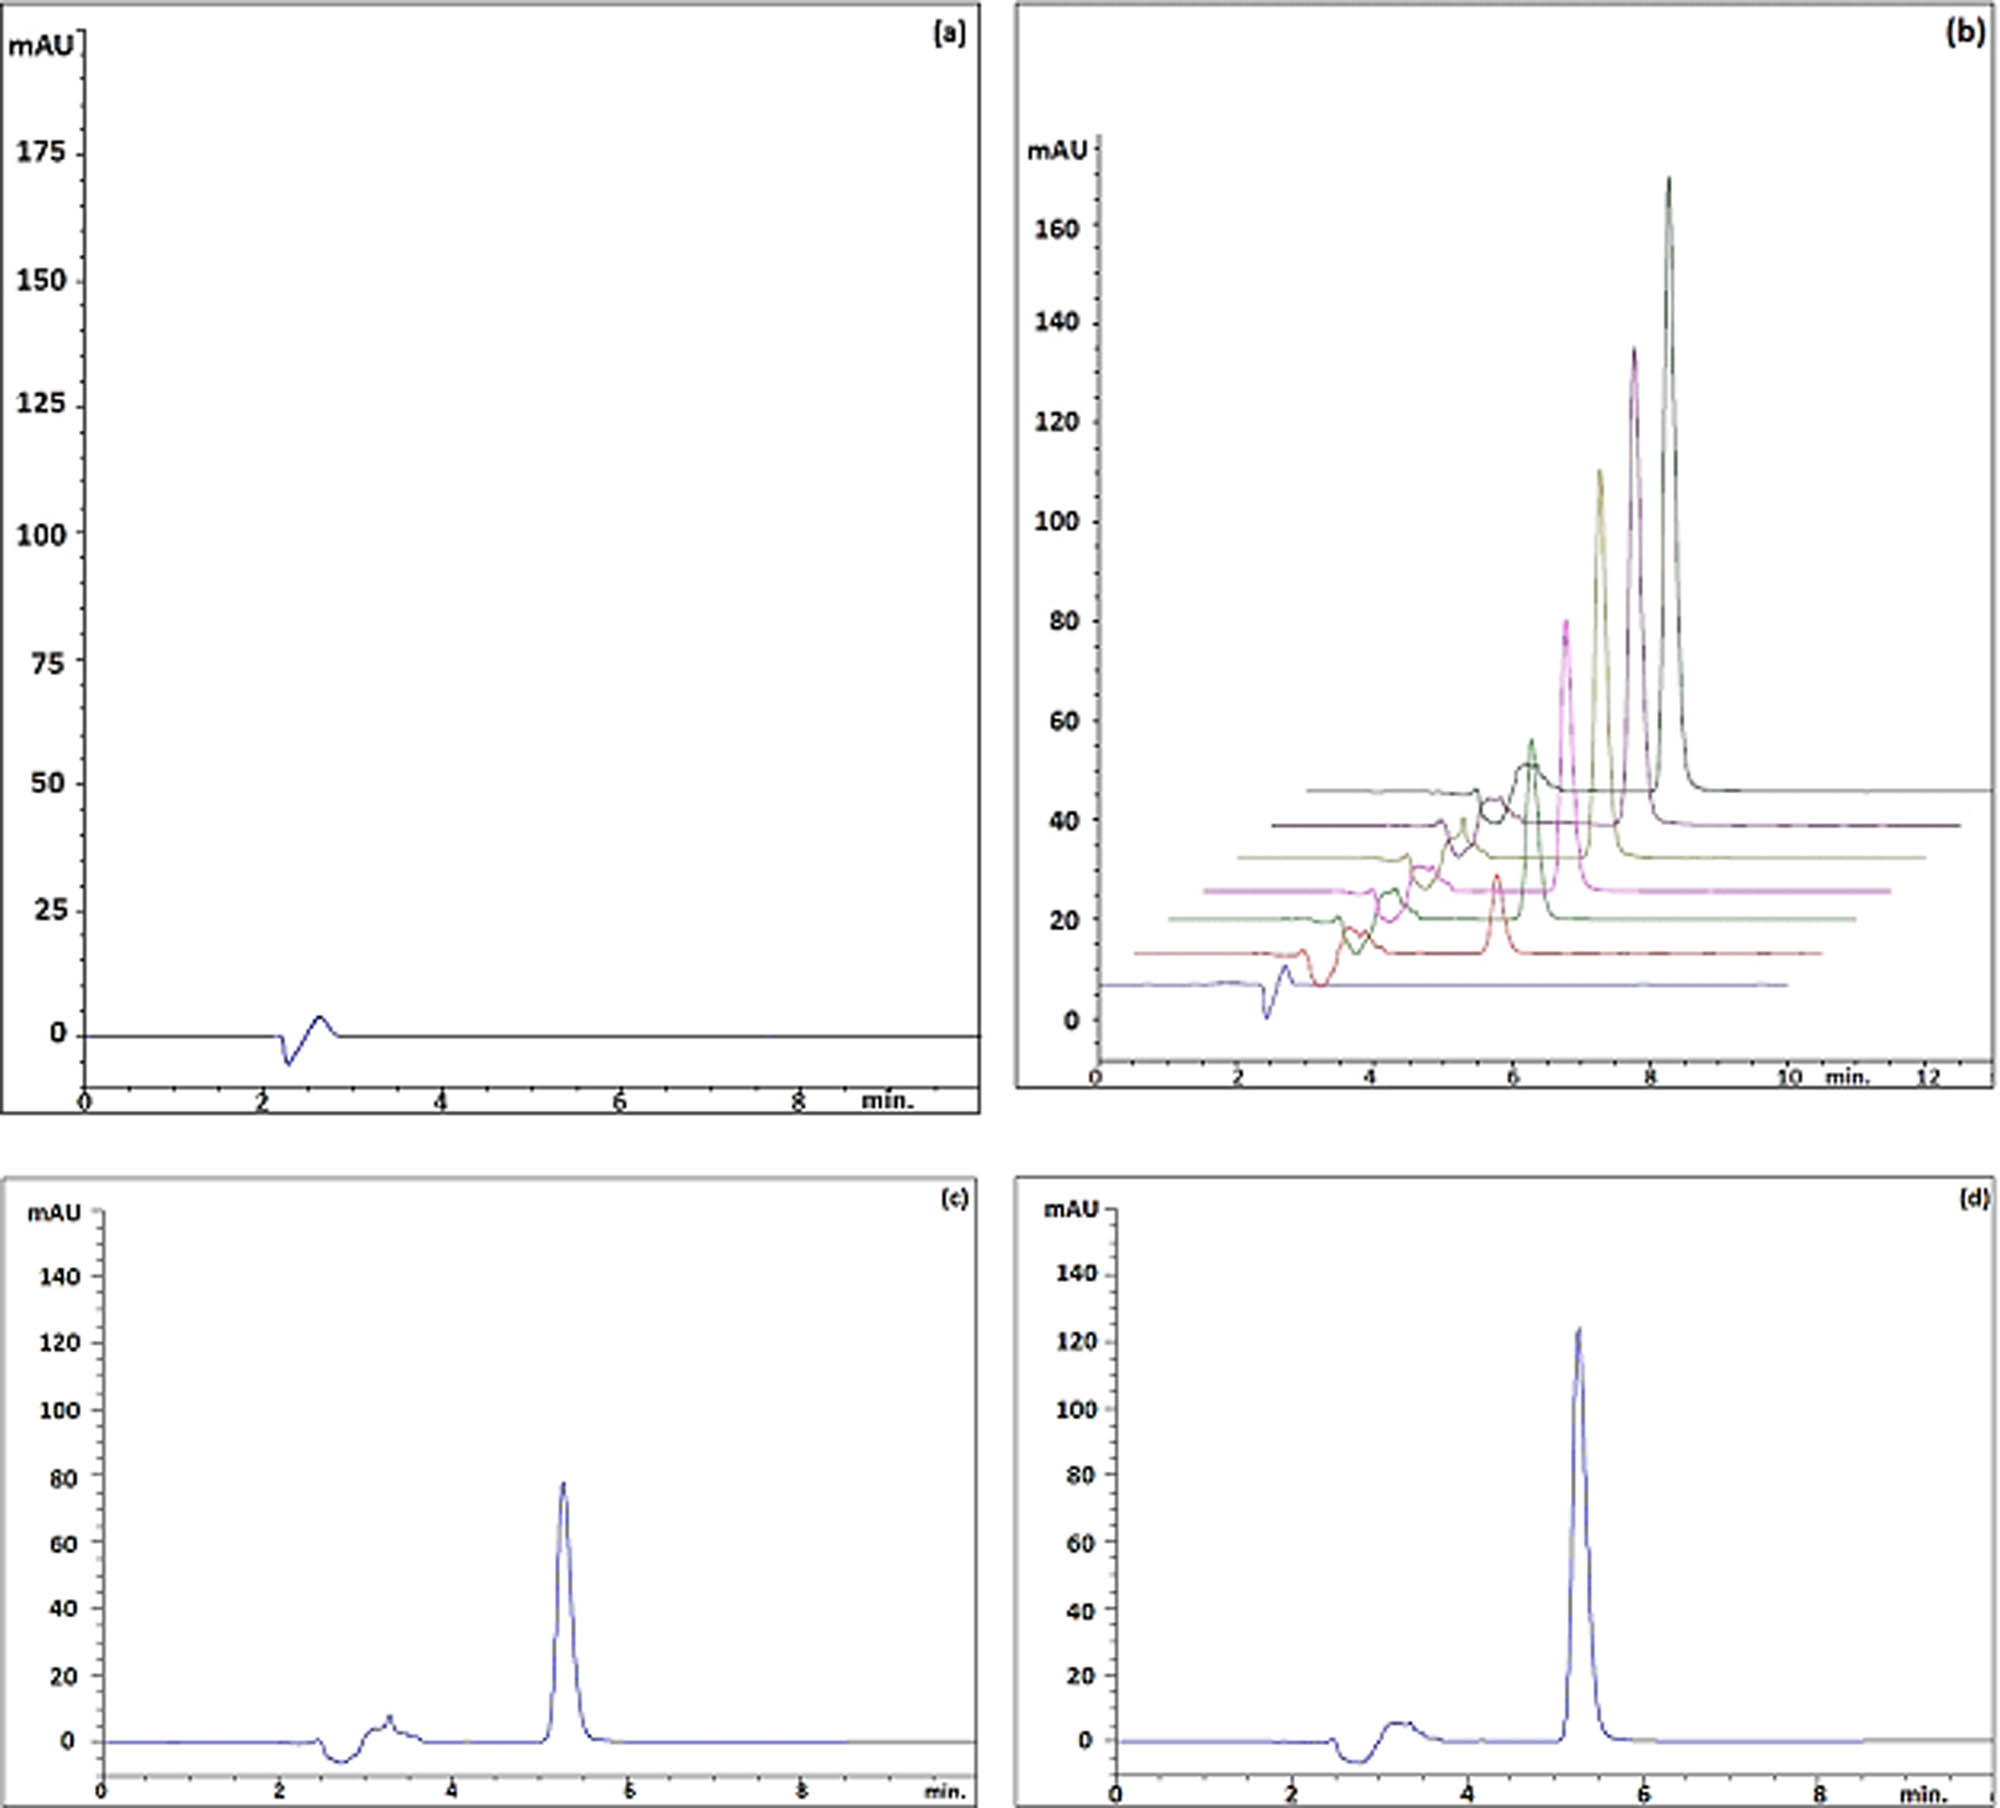
(a) HPLC chromatogram of blank, (b) standard solutions (5–30 µg·mL−1), (c) pharmaceutical product (20 µg·mL−1), and (d) standard solution (30 µg·mL−1).
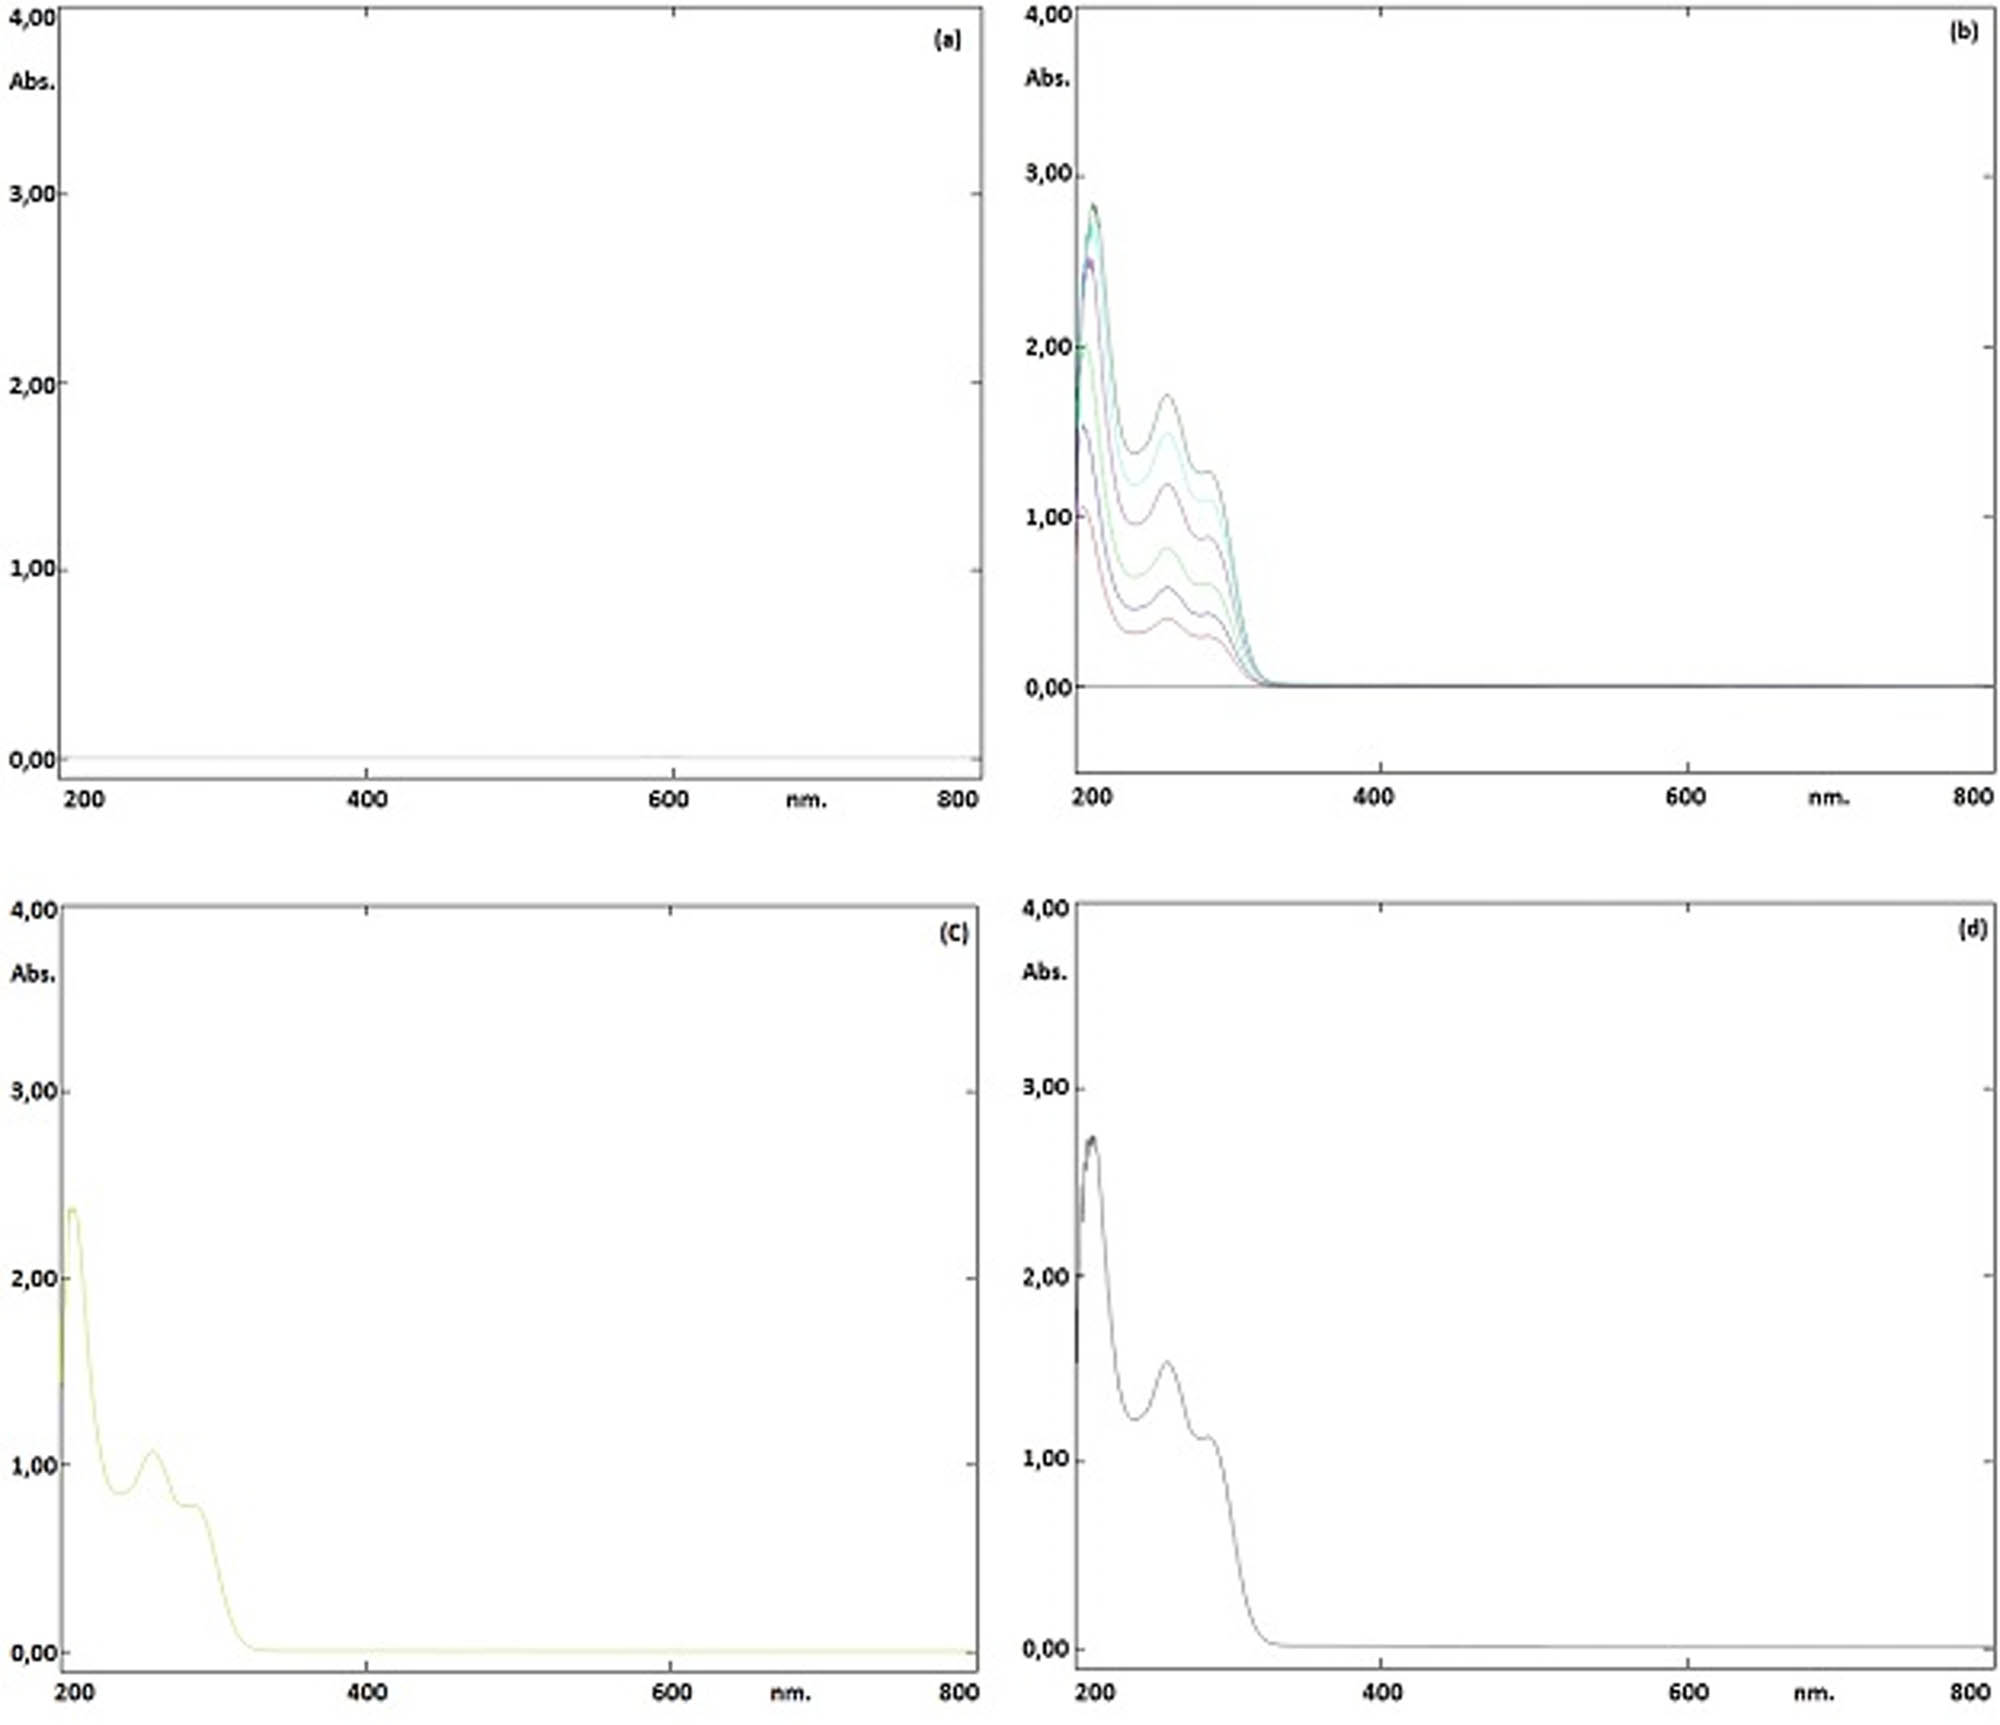
(a) UV spectrum of blank, (b) standard solutions (5–30 µg·mL−1), (c) pharmaceutical product (20 µg·mL−1), and (d) standard solution (25 µg·mL−1).
3.3 Validation of the chromatographic method
After the chromatographic method was successfully developed, it was validated by ICH guidelines. Selectivity, accuracy, precision, sensitivity, and robustness were identified as validation parameters [15,16,17,18,19,20,21,22]. Verification was also performed to ensure that the established approach may produce consistent and trustworthy results when employed by laboratories of varying sizes.
3.4 System suitability
Six standard solutions (20 µg·mL−1) were injected into the chromatographic system to assess system suitability. The peak area, retention time, tailing factor, and theoretical plate number were all taken into account. RSD% was calculated for six injections and was less than 2.0%. System suitability test results are given in Table 1.
3.5 Selectivity
To test the selectivity of the chromatographic method, chromatograms obtained from the standard and sample solution were compared in the area of the ibrutinib peak, and no interfering peaks were detected. To test the selectivity of the spectrophotometric method, the spectra obtained from the standard and sample solution were compared and no interference bands were detected.
3.6 Linearity
The linearity of the methods was established using linear regression analysis and least-squares method. The concentration ranged between 5 and 30 µg·mL−1. Regression analysis revealed a strong correlation coefficient (0.999). The RSD% value for each point (n = 3) was less than 2%; the results are shown in Table 2.
The results of regression analysis
| No. | Concentration (μg·mL−1) | Chromatographic method (peak area) | Spectrophotometric method (absorbance) |
|---|---|---|---|
| 1 | 5 | 235.0 | 0.302 |
| 2 | 10 | 463.0 | 0.581 |
| 3 | 15 | 697.0 | 0.882 |
| 4 | 20 | 940.0 | 1.194 |
| 5 | 25 | 1185.0 | 1.491 |
| 6 | 30 | 1415.0 | 1.767 |
| Slope | 47.09 | 0.0592 | |
| Intercept | 0.0000 | 0.0000 | |
| Correlation coefficient (r 2) | 0.9999 | 0.9999 | |
3.7 Precision
Both precisions had RSD% values less than 2.0%. The precision research results demonstrate that the suggested methods are precise. Table 3 displays the results of the method precision and system precision research.
The results of the precision study
| No. | Concentration (μg·mL−1) | Chromatographic method | Spectrophotometric method | ||||
|---|---|---|---|---|---|---|---|
| Retention time (min) | Peak area | Assay (%) | Absorbance | Assay (%) | |||
| Method precision | 1 | 20 | 5.268 | 941.30 | 100.08 | 1.197 | 100.11 |
| 2 | 5.270 | 940.10 | 99.97 | 1.193 | 99.78 | ||
| 3 | 5.271 | 941.21 | 100.09 | 1.196 | 100.03 | ||
| 4 | 5.271 | 940.32 | 100.00 | 1.195 | 99.94 | ||
| 5 | 5.274 | 939.86 | 99.95 | 1.196 | 100.03 | ||
| 6 | 5.267 | 940.35 | 100.00 | 1.197 | 100.11 | ||
| Average | 5.270 | 940.52 | 100.02 | 1.196 | 100.00 | ||
| SD | 0.0025 | 0.5942 | 0.0587 | 0.0015 | 0.1259 | ||
| RSD (%) | 0.0480 | 0.0632 | 0.0632 | 0.1259 | 0.1259 | ||
| System precision | 1 | 20 | 5.273 | 940.80 | 100.08 | 1.194 | 100.04 |
| 2 | 5.268 | 939.30 | 99.92 | 1.192 | 99.87 | ||
| 3 | 5.269 | 941.21 | 100.13 | 1.196 | 100.21 | ||
| 4 | 5.274 | 939.32 | 99.93 | 1.190 | 99.71 | ||
| 5 | 5.276 | 939.15 | 99.91 | 1.196 | 100.21 | ||
| 6 | 5.278 | 940.35 | 100.03 | 1.193 | 99.96 | ||
| Average | 5.273 | 940.02 | 100.00 | 1.194 | 100.00 | ||
| SD | 0.0039 | 0.8830 | 0.0939 | 0.0023 | 0.1965 | ||
| RSD (%) | 0.0754 | 0.0939 | 0.0939 | 0.1965 | 0.1965 | ||
3.8 Accuracy
The mean recovery percentages for the standard additions of 80%, 100%, and 120% to the sample solution were 99.40%, 99.83%, and 99.78%, respectively. This suggests that the described methods are appropriate for quantifying ibrutinib in pharmaceutical formulations. Table 4 displays accuracy data.
The results of the accuracy study
| Spiked level | Added (μg·mL−1) | Recovered (μg·mL−1) | Recovery (%) | Average (%) | SD | RSD (%) |
|---|---|---|---|---|---|---|
| 80% | 16 | 15.96 | 99.75 | 99.40 | 0.344 | 0.346 |
| 16 | 15.90 | 99.38 | ||||
| 16 | 15.85 | 99.06 | ||||
| 100% | 20 | 19.98 | 99.90 | 99.83 | 0.076 | 0.077 |
| 20 | 19.97 | 99.85 | ||||
| 20 | 19.95 | 99.75 | ||||
| 120% | 24 | 23.96 | 99.83 | 99.78 | 0.064 | 0.064 |
| 24 | 23.93 | 99.71 | ||||
| 24 | 23.95 | 99.79 |
3.9 Detection and quantitation limit
The detection and quantitation limit values were calculated separately depending on the standard deviation of the slope and intercept of the calibration curves. The detection and quantitation limit values for the chromatographic method were calculated as 0.90 and 2.80 µg·mL−1, respectively. In spectrophotometric analysis, the detection and quantitation limit values were calculated as 1.40 and 4.30 µg·mL−1, respectively. The chromatogram of the sample solution at a concentration close to the quantification limit of the analyte (2.5 µg·mL−1) is presented in Figure 4.
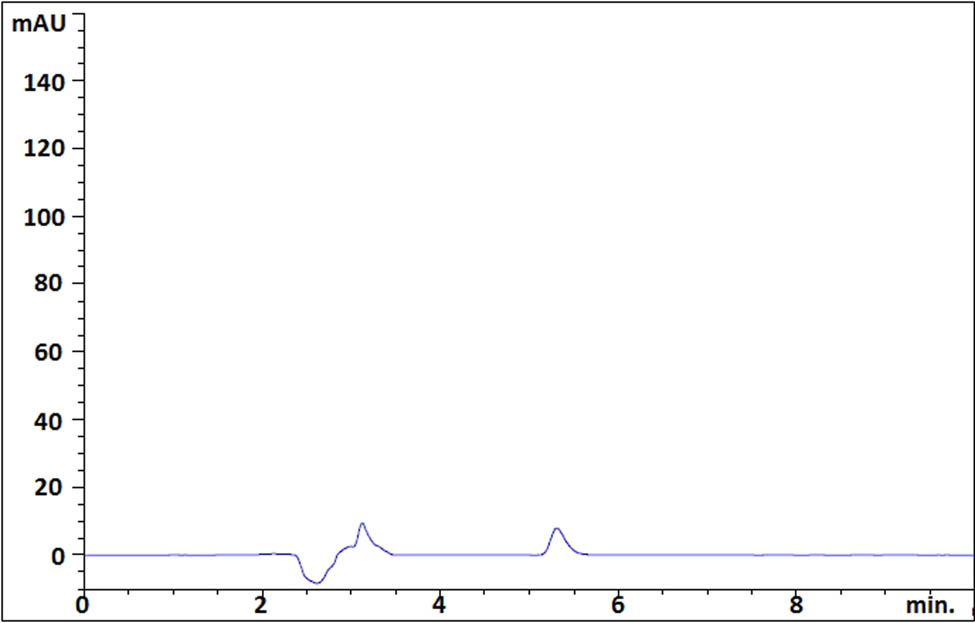
HPLC chromatogram of the sample solution at a concentration close to the quantification limit of the analyte (2.5 mg·mL−1).
3.10 Robustness
The robustness of both techniques was verified by each variable condition. Table 5 shows that the obtained values are within the acceptable limit.
The results of the robustness study
| Method | Method conditions | Retention time (min) | Tailing | Plate count | RSD (%) | |
|---|---|---|---|---|---|---|
| Chromatographic method | Control (no change) | 5.270 | 1.204 | 7,694 | 0.82 | |
| Flow rate of the mobile phase | 1.1 mL·min−1 | 4.755 | 1.182 | 7,350 | 0.91 | |
| 0.9 mL·min−1 | 5.810 | 1.225 | 8,309 | 0.98 | ||
| Organic content of mobile phase | 48:52 | 5.085 | 1.198 | 7,662 | 0.86 | |
| 52:48 | 5.433 | 1.214 | 7,724 | 0.75 | ||
| Column temperature | 22°C | 5.268 | 1.204 | 7,693 | 0.83 | |
| 28°C | 5.271 | 1.204 | 7,694 | 0.81 | ||
| Detection wavelength | 257 nm | 5.268 | 1.205 | 7,691 | 0.83 | |
| 263 nm | 5.271 | 1.204 | 7,698 | 0.82 | ||
| Absorbance (20 µg·mL−1, n = 3) | RSD (%) | |||||
| Spectrophotometric method | Control (no change) | 1.194 | 1.007 | |||
| Organic solvent | Ethanol | 1.193 | 1.012 | |||
| Isopropyl alcohol | 1.192 | 1.014 | ||||
| Detection wavelength | 257 nm | 1.191 | 1.010 | |||
| 263 nm | 1.192 | 1.013 | ||||
3.11 Analysis of the commercial formulation
The newly prepared sample solution was filtered using a filter with a pore size of 0.45 µm and then analyzed by chromatographic and spectrophotometric methods. Ibrutinib quantification in pharmaceutical formulations has been successfully applied using both developed and validated methods. The analysis results of the pharmaceutical formulation sold commercially in pharmacies are presented in Table 6.
Analysis results of the marketed pharmaceutical formulation
| Label claim (mg·capsule−1) | Spectrophotometric method, found ibrutinib (mg·capsule−1) | Chromatographic method, found ibrutinib (mg·capsule−1) |
|---|---|---|
| 140 | 139.21 ± 0.51 | 139.74 ± 0.27 |
3.12 Solution stability
Throughout 24 h, the stability of ibrutinib standard solution (20 µg·mL−1) was examined. For this purpose, the standard solution was analyzed using the chromatographic method with 8-h periods and the peak area was determined and recorded. The standard solution was analyzed by the spectrophotometric method, and the absorbance value was determined and recorded. Table 7 shows the results of the stability study. The RSD% was determined as 0.272 for peak area using the chromatographic method and as 0.491 for absorbance using the spectrophotometric method. The concentration of ibrutinib in the reference solution did not vary significantly.
The results of standard solution stability (n = 3, 20 μg·mL−1)
| Time (h) | Chromatographic method | Spectrophotometric method | ||||||
|---|---|---|---|---|---|---|---|---|
| Peak area | Mean | SD | RSD (%) | Absorbance | Mean ± SD | SD | RSD (%) | |
| 0 | 937.3 | 938.3 | 1.323 | 0.141 | 1.194 | 1.193 | 0.004 | 0.349 |
| 939.8 | 1.196 | |||||||
| 937.8 | 1.188 | |||||||
| 8 | 941.7 | 940.1 | 1.650 | 0.176 | 1.189 | 1.193 | 0.005 | 0.378 |
| 940.1 | 1.198 | |||||||
| 938.4 | 1.193 | |||||||
| 16 | 938.4 | 940.4 | 1.955 | 0.208 | 1.192 | 1.193 | 0.004 | 0.302 |
| 940.6 | 1.197 | |||||||
| 942.3 | 1.190 | |||||||
| 24 | 941.7 | 941.4 | 2.563 | 0.272 | 1.196 | 1.194 | 0.006 | 0.491 |
| 943.8 | 1.187 | |||||||
| 938.7 | 1.198 | |||||||
3.13 Statistical comparison of methods
The F-test and the t-test were used to compare developed and validated procedures statistically. Statistical analyses revealed no statistically significant differences between the results obtained from the analyzes using both methods.
The F-value and t-value were calculated, and they were found to be lower than the table values of both techniques at the 95% confidence range. It is clear that the analytical methods described can be used to measure ibrutinib in pharmaceutical formulations. The statistical comparison results of described methods are presented in Table 8.
Statistical comparison (n = 6)
| Statistical data | Chromatographic method | Spectrophotometric method |
|---|---|---|
| Value on average | 99.89 | 99.67 |
| SD | 0.32 | 0.63 |
| RSD (%) | 0.32 | 0.63 |
| Standard error | 0.34 | 0.75 |
| F-Test | 0.27/0.51 | |
| F calculation/F table | ||
| t-Test | 1.40/2.62 | |
| t calculation/t table | ||
4 Discussion
Spectrophotometric and chromatographic methods have been developed for the quantification of ibrutinib in pharmaceutical formulations. Various analytical methods have been reported in the literature to determine the amount of ibrutinib in pharmaceutical products. Some of these techniques are quite complex, requiring long analysis times, expensive apparatus, special reagents, and large amounts of organic solvents. Furthermore, the approaches described in the literature involve lengthy and difficult sample preparation procedures. In all these studies, there is no study yet on the comparison of two different analysis techniques and their results. The developed methods are very simple in terms of both the detection (UV) of the analyte and the elution of the mobile phase (isocratic). The characteristics of the previously reported HPLC methods and the proposed method are presented in Table 9.
Characteristics of previously reported HPLC methods and the proposed method
| Mobile phase | Column | Concentration range | Correlation coefficient (R 2) | Precision (RSD, %) | LOD/LOQ | Retention time (min) | Application | Reference |
|---|---|---|---|---|---|---|---|---|
| Potassium dihydrogen phosphate buffer and acetonitrile (40:60 v/v) pH 3.0 | Symmetry C8 × Terra column (150 mm × 4.6 mm, 5 µm particle size) | 5–30 mg·mL−1 | 0.9994 | Intraday: 0.134 | 0.64 mg·mL−1 | 3.40 | Bulk and pharmaceutical formulations | [8] |
| Interday: 0.243 | 1.95 mg·mL−1 | |||||||
| A mixture (40:60) of 0.1% ortho phosphoric acid and acetonitrile | Kromasil C18 column (150 mm × 4.6 mm, 5 µm particle size) | 35–210 mg·mL−1 | 0.9990 | Intraday: 1.01 | 0.394 mg·mL−1 | 3.06 | Bulk and pharmaceutical dosage forms | [9] |
| Interday: 1.50 | 1.194 mg·mL−1 | |||||||
| A mixture of acetonitrile-0.1% trifluoroacetic acid water (43:27:30) | Agilent ZORBAX SB-C18 (4.6 mm × 125 mm, 5 μm) | 5.0–500 ng·mL−1 | 0.9996 | Intraday: 7.30 | 5 ng·mL−1 | 5.07 | Rabbit plasma | [10] |
| Interday: 7.60 | 14 ng·mL−1 | |||||||
| 0.1% Orthophosphoric acid buffer and acetonitrile in the ratio 70:30 %v/v | Inertsil ODS (100 mm × 4.6 mm, 5 μm) column | 3.5–21.0 mg·mL−1 | 0.9997 | Intraday: 1.06 | 0.03 mg·mL−1 | 2.52 | Pharmaceutical dosage form | [11] |
| Interday: 1.73 | 0.10 mg·mL−1 | |||||||
| A mixture of 0.1% TFA in water and 0.1% TFA in acetonitrile (50/50, v/v) | ODS C18 (250–4.6 mm, particle size 5 µm) | 5–30 mg·mL−1 | 0.9999 | Intraday: 0.05 | 0.90 mg·mL−1 | 5.17 | Bulk and pharmaceutical dosage forms | Proposed method |
| Interday: 0.08 | 2.80 mg·mL−1 |
5 Conclusion
The spectrophotometric method has advantages over the chromatographic method because the spectrophotometric method generally does not require detailed processes and procedures as in the chromatographic method. The spectrophotometric technique is more economical and consumes less time than the chromatographic technique. However, the statistical evaluation of both methods shows that the chromatographic method is more precise and accurate than the spectrophotometric method. The results show that the chromatographic and spectrometric methods are sufficient methods for the quantification of ibrutinib in pharmaceutical formulations. No interfering peaks were observed during the retention time of ibrutinib in the chromatographic method, and no interfering absorption bands were observed at 260 nm in the spectrophotometric method. These analytical techniques may be used effectively for regular quality control analysis of ibrutinib in pharmaceutical preparations because they are quick, simple, precise, specific, and accurate.
Acknowledgments
The authors are also grateful to Uşak University for providing the necessary facilities to perform the research study.
-
Funding information: Authors state no funding is involved.
-
Author contributions: Erten Akbel: writing – original draft, writing – review and editing; İbrahim Bulduk: chemical analysis; Serdar Güngör: writing– original draft, writing – review and editing. This work was carried out in collaboration among all authors. All authors read and approved the final manuscript.
-
Conflict of interest: Authors state no conflict of interest.
-
Data availability statement: The files used to support the data findings of this study are available from the corresponding author on request.
References
[1] Novero A, Ravella PM, Chen Y, Does G, Liu D. Ibrutinib for B cell malignancies. Exp Hematol Oncol. 2014;3:1–7.10.1186/2162-3619-3-4Search in Google Scholar PubMed PubMed Central
[2] Honigberg LA, Smith AM, Sirisawad M, Verner E, Loury D, Chang B, et al. The Bruton tyrosine kinase inhibitor PCI-32765 blocks B-cell activation and is efficacious in models of autoimmune disease and Bcell malignancy. Proc Natl Acad Sci. 2010;107:13075–80.10.1073/pnas.1004594107Search in Google Scholar PubMed PubMed Central
[3] Kim ES, Dhillon S. Ibrutinib: a review of its use in patients with mantle cell lymphoma or chronic lymphocytic Leukaemia. Drugs. 2015;75:769–76.10.1007/s40265-015-0380-3Search in Google Scholar PubMed
[4] Treon SP, Tripsas CK, Meid K, Warren D, Varma G, Green R, et al. Ibrutinib in pretreated Waldenström’s macroglobulinaemia. N Engl J Med. 2015;372:1430–40.10.1056/NEJMoa1501548Search in Google Scholar PubMed
[5] Lee CS, Rattu MA, Kim SS. A review of a novel, Bruton’s tyrosine kinase inhibitor, ibrutinib. J Oncol Pharm Pract. 2014;22:92–104.10.1177/1078155214561281Search in Google Scholar PubMed
[6] https://go.drugbank.com/drugs/DB09053.Search in Google Scholar
[7] Rood JJM, van Hoppe S, Schinkel AH, Schellens JHM, Beijnen JH, Sparidans RW. Liquid chromatography-tandem mass spectrometric assay for the simultaneous determination of the irreversible BTK inhibitor ibrutinib and its di-hydrodiol-metabolite in plasma and its application in mouse pharmacokinetic studies. J Pharm Biomed Anal. 2016;118:123–31.10.1016/j.jpba.2015.10.033Search in Google Scholar PubMed
[8] Vykuntam U, Divya N, Charishma E, Harshavardan K, Shyamamla M. Validated stability-indicating RP-HPLC method for determination of Ibrutinib. Indo Am J Pharma Sci. 2016;3(4):324–30.Search in Google Scholar
[9] Vykuntam U, Ayesha T, Lavanya K, Neeraja V, Sharma VCJ. Method development and validation of Ibrutinib by RP-HPLC in bulk and pharmaceutical dosage form. World J Pharmacy Pharm Sci. 2016;5(5):868–74.Search in Google Scholar
[10] Li-min W, Zhen-xing X, Peng-fei L, Yong-le X, Xiang-xiang W, Min Z. A simple HPLC method for the determination of Ibrutinib in rabbit plasma and its application to a pharmacokinetic study. Latin Am J Pharmacy. 2016;35(1):130–4.Search in Google Scholar
[11] Chintala R, Golkonda R, Kapavarapu S. Validation of stability indicating RP-HPLC method for the assay of ibrutinib in pharmaceutical dosage form. Ana Chem. 2016;16(1):7–19.Search in Google Scholar
[12] de Vries R, Huang M, Bode N, Jejurkar P, Jong Jd, Sukbuntherng J, et al. Challenge, Bioanalysis of ibrutinib and its active metabolite in human plasma: selectivity issue, impact assessment and resolution. Bioanalysis. 2015;7:2713–24.10.4155/bio.15.159Search in Google Scholar PubMed
[13] Veeraraghavan S, Viswanadha S, Thappali S, Govindarajulu B, Vakkalanka S, Rangasamy M. Simultaneous quantification of lenalidomide, ibrutinib and its active metabolite PCI-45227 in rat plasma by LC–MS/MS: Application to a pharmacokinetic study. J Pharm Biomed Anal. 2015;107:151–8.10.1016/j.jpba.2014.11.041Search in Google Scholar PubMed
[14] Fouad M, Helvenstein M, Blankert B. Ultra high performance liquid chromatography method for the determination of two recently FDA approved TKIs in human plasma using diode array detection. J Anal Methods Chem. 2015;2015:215128. 10.1155/2015/215128.Search in Google Scholar PubMed PubMed Central
[15] Validation of analytical procedures: text and methodology Q2(R1)-ICH harmonized tripartite guideline. International Conference on Harmonization of Technical Requirements for Registration of Pharmaceuticals for Human Use; 2005.Search in Google Scholar
[16] Center for Drug Evaluation and Research (CDER). Reviewer Guidance: Validation of Chromatographic Methods; 1994.Search in Google Scholar
[17] United State Pharmacopeia and National Formulary. The United State Pharmacopeia. Rockville, MD: U.S. Pharmacopeia Convention. USP 32–NF 27; 2009 <621>.Search in Google Scholar
[18] International Conference on Harmonization (ICH). ICH Q2 Validation of analytical procedures: text and methodology international conference on harmonization of technical requirements for registration of pharmaceutical for human use. ICH Harmonized, Tripartite Guideline. Canada; 2005. Guideline.pdf [accessed January 12, 2020].Search in Google Scholar
[19] AOAC International. Appendix F: Guidelines for Standard Methods Performance Requirements. AOAC Official Method of Analysis AOAC International; 2016. p. 1–18.Search in Google Scholar
[20] Ahuja S, Dong MW. Handbook of pharmaceutical analysis by HPLC. The Netherlands: Elsevier; 2005. p. 20–5.Search in Google Scholar
[21] Ehmer J, Miller JH. Method validation in pharmaceutical analysis: a guide to best practice. Weinheim, Germany: Wiley-VCH; 2005.10.1002/3527604685Search in Google Scholar
[22] Ravisankar P, Navya CN, Pravallika D, Sri DN. A review on step-by-step analytical method validation. IOSR J Pharm. 2015;5:7–19.Search in Google Scholar
© 2022 Erten Akbel et al., published by De Gruyter
This work is licensed under the Creative Commons Attribution 4.0 International License.
Articles in the same Issue
- Research Articles
- Abnormal retention of s-triazine herbicides on porous graphitic carbon
- One-factor-at-a-time method combined with ICP-MS for determining 11 elements in soy sauce and their migration from the containing glass bottles
- Analysis of initiator content of prepreg by near-infrared spectroscopy
- Simultaneous MEKC-DAD and smart spectrophotometric assays of thiocolchicoside and etoricoxib in challenging concentration ratio mixtures
- Alternative analytical methods for ibrutinib quantification in pharmaceutical formulation: A statistical comparison
- Chemometric determination of common cold infection drugs in human urine
- An effective, novel, and cheap carbon paste electrode for naproxen estimation
- Fabrication of ultra-sensitive carbon paste electrode with nanocomposite CdS modification for electroanalysis of rafoxanide in dosage form and biological fluids
- Purification and characterisation of phytochemicals extracted from Rhizophora mucronata: Their efficacy against Pseudomonas aeruginosa infection in Catla catla
- Review Articles
- Recent applications of quantitative analytical FTIR spectroscopy in pharmaceutical, biomedical, and clinical fields: A brief review
- Review of characteristics and analytical methods for determination of indomethacin
- A review of the application of comprehensive two-dimensional gas chromatography MS-based techniques for the analysis of persistent organic pollutants and ultra-trace level of organic pollutants in environmental samples
- Enrichment and analysis of glycated proteins
- Round robin tests of secondary raw materials: A systematic review of performance parameters
- Paper-based microfluidic devices: Fabrication, detection, and significant applications in various fields
- Applications of headspace solid-phase microextraction in human biological matrix analysis
- Chemometrics and infrared spectroscopy – A winning team for the analysis of illicit drug products
- Canagliflozin: A review with specific focus on analytical methods in biological matrices and pharmaceuticals
- RNA-based isothermal amplification technology and its clinical application in pathogen infection
- Detection of diarrheal shellfish toxins
- Special Issue: Nanomaterials with mimetic enzymatic properties for label-free sensors and biosensors (Guest Editors: Gang Wei and Zhiqiang Su)
- Preparation of cuprous oxide-supported silver-modified reduced graphene oxide nanocomposites for non-enzymatic electrochemical sensor
- Recent advances in matrix metalloproteinases-responsive nanoprobes for cancer diagnosis and therapy
- A simple salicylaldehyde-bearing pyrazine as a turn-on fluorescent chemosensor for Al3+ and Zn2+ recognition and its applications
- Preparation of silver nanosheet-assembled film as a surface-enhanced Raman scattering substrate
- Synthesis of group I–III–VI semiconductor quantum dots and its application in food safety testing