Nonlinear molecular weight dependency in polystyrene and its nanocomposites: deciphering anomalous gas permeation selectivity in water vapor-oxygen-hydrogen barrier systems
-
 ,
,
 und
und

Abstract
Polystyrene (PS) and its nanocomposites have shown considerable potential as selective barriers for gas permeation, yet the influence of molecular weight (MW) on their gas transport behavior remains insufficiently understood. In this study, three PS samples with ascending MWs (PS1–PS3) and their reduced graphene oxide (rGO) nanocomposites (PS1-G–PS3-G) were prepared via hot pressing. Notably, the water vapor transmission rate (WVTR) exhibited a non-monotonic dependence on MW, increasing from 1.50 g/m2·day (PS1) to 1.59 g/m2·day (PS2), then decreasing to 1.27 g/m2·day (PS3). A similar trend was observed in the nanocomposites, which displayed lower WVTR values (0.54, 0.61, and 0.48 g/m2·day, respectively). In contrast, the oxygen transmission rate (OTR) rose sharply with MW – from 509.41 g/m2·day (PS1) to 1,119.8 g/m2·day (PS2) and further to 4,586.11 g/m2·day (PS3) – while rGO incorporation substantially suppressed oxygen permeability (40.72, 58.09, and 138.32 g/m2·day, respectively). Hydrogen transmission rates (HTR) varied only slightly among the PS samples (830, 842, and 907 cm2/(m2·day·0.1 MPa), and the addition of rGO induced minimal changes. Among all samples, PS1 and PS1-G exhibited the most favorable barrier selectivity, combining strong water and oxygen resistance with retained hydrogen permeability. These results demonstrate that MW plays a decisive role in governing gas barrier selectivity and provide design insights for optimizing polymer nanocomposites in advanced barrier applications.
1 Introduction
Polystyrene (PS) [1], [2], [3], a widely used packaging polymer known for its cost-effectiveness, easy of processing, and excellent thermal stability, also exhibits favorable barrier properties against oxygen and water vapor while maintaining hydrogen permeability [4], [5], [6], [7]. These combined characteristics make PS and its nanocomposites attractive candidates for selective gas barrier applications, where effective resistance to oxygen/water vapor is required without compromising hydrogen permeation [8], 9].
Abolghasemi Fakhri et al. [10] developed PS-based nanocomposites incorporating zinc oxide (ZnO) nanoparticles and organically modified montmorillonite (OMMT), demonstrating that oxygen permeability decreases with increasing ZnO content, consistent with trends observed in poly (vinyl alcohol)/ZnO composites [11]. In particular, the PS/4.47 % OMMT/1.16 % ZnO composite exhibited a 60 % reduction in oxygen permeability compared to pure PS. In another study, Ghanem et al. [12] synthesized hydrophobic poly (4-vinylbenzyl chloride) (p (VBC))-functionalized graphene oxide (GO) via in situ radical polymerization to obtain GO/p (VBC) (GP(VBC)) nanocomposites. Incorporation of GP(VBC) into PS at various filler loadings (5–25 wt%) significantly improved the barrier performance; specifically, the water vapor permeability of the PS composite containing 5 wt% GP(VBC) decreased by approximately 70 % relative to pure PS. Similarly, Merritt et al. [13] fabricated PS microsphere capsules encapsulated within multilayered GO nanosheets using the Pickering suspension polymerization method. This approach enabled precise control of GO nanosheet dispersion and orientation within the polymer matrix, markedly enhancing barrier properties. The resulting GO/PS composite containing 2 wt% GO achieved an oxygen permeability of 526.02 ± 55.78 cm3 m−2·24 h−1 – a 96 % reduction compared to neat PS – highlighting its superior oxygen barrier performance. Furthermore, Patel et al. [14] incorporated GO into PS/polymethyl methacrylate (PMMA) blends to form GO/PS/PMMA nanocomposites, which exhibited enhanced hydrogen permeability relative to those without GO filler. Gas selectivity studies for H2/CO2, H2/N2, and H2/CH4 pairs revealed that the nanocomposites possessed excellent hydrogen selectivity, demonstrating their potential for selective gas separation applications.
Increasing the molecular weight (MW) of polymers generally reduces gas permeability, primarily due to enhanced chain entanglement and restricted segmental mobility within the polymer matrix [15], 16]. Consequently, most previous studies have focused on improving the barrier performance of PS by incorporating nanomaterials such as GO, ZnCu-BTC nanorods, nanoclays, and carbon nanofibers [8], [17], [18], [19], [20], while the intrinsic effect of PS MW on its gas barrier characteristics has received limited attention – particularly regarding its selective permeability toward oxygen, water vapor, and hydrogen. In this study, three PS samples with distinct MWs were fabricated using the hot-pressing technique [21], [22], [23] to systematically investigate the influence of MW on their selective gas barrier properties. The samples were comprehensively characterized in terms of surface wettability, morphology, chemical composition, and thermal stability. The permeation behavior of oxygen, water vapor, and hydrogen was then analyzed to evaluate how variations in MW influence selective barrier performance. Furthermore, to further validate MW-dependent effects, three corresponding PS nanocomposites containing identical amounts of reduced graphene oxide (rGO) – a GO derivative with fewer structural defects and greater hydrophobicity – were fabricated using the same hot-pressing process for comparative analysis.
2 Materials and methods
2.1 Materials
Three types of PS (PS1, PS2, and PS3, with MWs of 192,000, 280,000, and 350,000 g mol−1, respectively), high-purity rGO (with a particle size range between 2 and 10 μm), and polyimide film (PI) were purchased from Sigma Aldrich, Chengdu Organic Chemicals Co. Ltd., and Shandong Wanda Microelectronics Materials Co., Ltd., respectively.
2.2 Sample preparation
Initially, the PS particles were dispersed using mechanical stirring (Figure 1a and b), after which they were uniformly distributed to ensure homogeneous dispersion within a 10 × 10 cm metal mold encapsulated in a PI film (Figure 1c). Another layer of PI film was then applied on top of the sample, which was placed in a hot press at 220 °C and 6 MPa for 2 h (Figure 1d). Finally, as shown in Figure 1e and f, the sample was removed from the metal mold after a 24-h period at room temperature and subsequently subjected to further characterization.
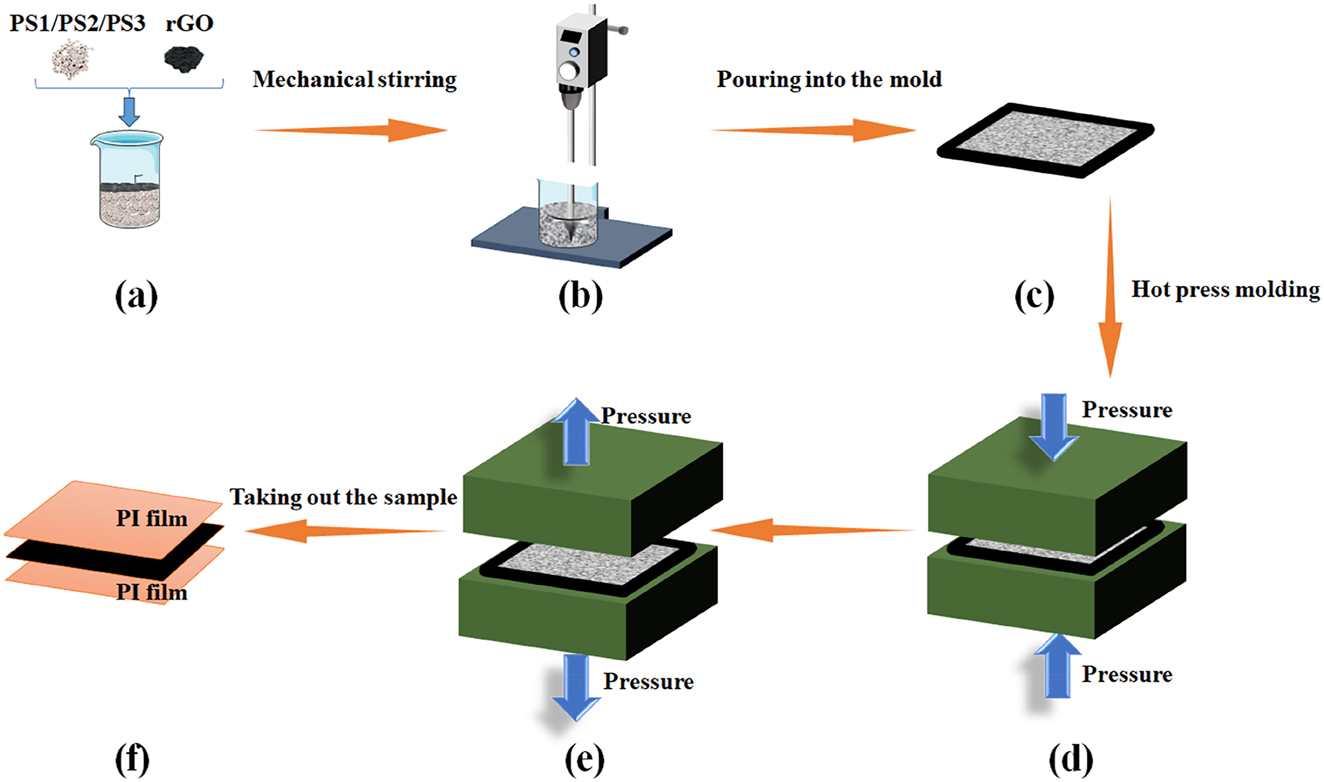
Preparation processes of PS and their corresponding rGO-incorporated nanocomposites (PS-G): (a) Accurately weigh the raw materials and transfer them to a beaker; (b) Stir the raw materials via mechanical stirring; (c) Uniformly spread the homogeneous mixture into a metal mold; (d) Subject the mixture to hot-pressing molding; (e) After hot-pressing, allow the sample to cool at ambient temperature for 24 h; (f) Following the 24-h curing period, demold the sample from the PI film.
Additionally, within the comparative study, PS nanocomposites containing 1 wt% rGO (PS1-G, PS2-G, and PS3-G) were fabricated under conditions identical to those employed for the PS samples. Comprehensive details regarding the composition of each sample are provided in Table 1.
The compositions of PS and rGO in various samples.
| Sample | Mw of PS(g·mol−1) | PS(weight/g) | rGO(weight/g) |
|---|---|---|---|
| PS1 | 192,000 | 100 | 0 |
| PS2 | 280,000 | 100 | 0 |
| PS3 | 350,000 | 100 | 0 |
| PS1-G | 192,000 | 99 | 1 |
| PS2-G | 280,000 | 99 | 1 |
| PS3-G | 350,000 | 99 | 1 |
2.3 Characterization
Physical properties: At room temperature, the transmittance of PS within the 190–1,100 nm wavelength range was measured using a UV–Vis spectrometer (model P5, manufactured by Shanghai Mapada Instrument Co., Ltd.). To comprehensively evaluate transparency, three samples were tested for each specimen. The results revealed typical transparency characteristics for each sample. Additionally, optical photographs of the material were captured using a smartphone camera.
The water contact angle (WCA) of the sample surface was accurately determined using an automatic contact angle measuring instrument (SDC-350, manufactured by Dongguan SINDIN Precision Instrument Co., Ltd.). A 5 μL volume of deionized water at room temperature was applied, and measurements were performed at five separate sites on both the PS material and PS-G composite material surfaces. The result was derived by averaging these five individual measurements.
To enhance the electrical conductivity of the material prior to testing, a gold spray treatment was applied. The surface morphologies of the samples were meticulously examined using a scanning electron microscope (SEM) at an accelerating voltage of 20 kV. To ensure precise representation, detailed scans were conducted on three distinct areas of each sample. Furthermore, energy dispersive spectroscopy (EDS) mapping was performed on the surfaces of PS materials and PS-G nanocomposites to conduct a comprehensive elemental analysis.
Chemical properties: Fourier transform infrared spectroscopy (FTIR) was employed to investigate the chemical groups present on the surfaces of both PS materials and PS-G nanocomposites. The spectral analysis was conducted within a wavelength range of 400–4,000 cm−1. To ensure precision and accuracy, multiple data points were meticulously collected three distinct areas on each sample surface. The results presented here represent typical FTIR spectra for each sample, illustrating their characteristic chemical composition.
The X-ray diffraction (XRD) analyzer was used to examine the characteristic peaks three times on the surface of both pure PS materials and PS-G nanocomposites, with scanning angles ranging from 5° to 90°.
Raman spectroscopy was employed to analyze the molecular vibrational patterns and chemical composition of the surface of PS materials and PS-G nanocomposites three times, with a test wavelength range from 50 to 3,300 cm−1.
Thermogravimetric analysis (TGA) was performed three times under nitrogen protection. The temperature was increased from 30 °C to 800 °C at a uniform rate of 10 K min−1. TGA curves for both the PS material and the PS-G composite material were generated, enabling a comprehensive examination of their thermal characteristics.
Barrier properties: The water vapor barrier characteristics of PS materials and PS-G composite materials were meticulously assessed using the water vapor transmission rate (WVTR) test system (C360 M) produced by Labthink, China, in compliance with GB/T 1037–2021. The evaluation was conducted at a temperature of 23.0 °C and a relative humidity (RH) of 90 %. Additionally, the oxygen barrier properties of these materials were examined using an oxygen transmission rate (OTR) tester, at a temperature of 23.0 °C and a humidity of 0 % RH. The hydrogen transmission rate (HTR) of the PS material and PS-G composite material was accurately determined at 23.0 °C and 0 % RH using the flammable and explosive gas permeameter (GPT-H21) provided by Saicheng, China. The showed barrier property for each sample was the averaged results of three samples.
3 Results and discussion
Transparency is a crucial property of polymeric materials, governing their suitability for applications such as optical lenses, optical fibers, medical devices, flexible displays, and other optoelectronic components [24], 25]. The transparency of PS can be influenced by several factors, including internal voids, structural defects, impurities, and sample thickness. To minimize the influence of these non–MW-related variables on optical performance, all PS samples in this study were fabricated using the same mold to ensure consistent thickness and comparable processing conditions.
The optical images of the fabricated samples are shown in Figure 2(a). As observed, the PS1, PS2, and PS3 samples without rGO nanofillers exhibit a uniformly white and transparent appearance. However, the clarity of the “Chengdu University” text beneath the PS3 sample is slightly reduced compared with that of PS1 and PS2, suggesting a minor decline in optical transparency with increasing PS MW. Owing to the inherent black color of the rGO nanofiller, all PS1-G, PS2-G, and PS3-G nanocomposites in Figure 2(a) appear distinctly black, making direct transparency measurements infeasible. Although the dark coloration may limit their suitability for optical or packaging applications, the unique gas permeation characteristics of these nanocomposites broaden their potential in functional barrier materials.

Transparency results of PS and PS-G. (a) Optical photos of PS1, PS2, PS3, PS1-G, PS2-G, and PS3-G nanocomposites, and (b) Transparency analysis of PS1, PS2, and PS3 materials.
Furthermore, the optical transmittance of PS1, PS2, and PS3 was analyzed using a UV–Vis spectrometer to systematically compare the influence of MW on their transparency. As shown in Figure 2(b), the light transmittance of all PS samples gradually increases with wavelength across the 300–1,100 nm range. However, PS3 exhibits slightly lower transmittance than PS1 and PS2 throughout the spectrum. This phenomenon can be attributed to the higher MW of PS3, which corresponds to longer polymer chains that are more prone to irregular packing and increased structural disorder within the matrix [26], 27]. Such irregularities and defects enhance light scattering during transmission, thereby reducing overall transparency [28].
As illustrated in Figure 2(a), the surfaces of PS and PS-G nanocomposites with different MWs exhibit clear hydrophobic character. To further evaluate the influence of MW on the surface wettability, the WCA of each sample was measured, as shown in Figure 3. The surfaces of PS1, PS2, and PS3, as well as their corresponding PS-G nanocomposites, display noticeable specular reflection, producing mirror-like images in the WCA measurement photographs. For clarity, the solid-liquid-gas three-phase contact line [29] is highlighted with red dashed lines in Figure 3.

WCA results and water drop profiles of PS samples. (a) PS1, (b) PS2, (c) PS3, (d) PS1-G, (e) PS2-G, and (f) PS3-G.
The WCAs of PS1, PS2, and PS3 are shown in Figure 3(a)–(c). These results indicate that the static WCAs of PS2 and PS3 decrease to approximately 88.7° and 86.6°, respectively, compared with that of PS1 (≈94.0°). This trend suggests a gradual reduction in surface hydrophobicity with increasing PS MW. To further verify this observation, additional WCA measurements were conducted for the PS1-G, PS2-G, and PS3-G nanocomposites, as presented in Figure 3(d)–(f). The results show that the static WCAs of the PS2-G and PS3-G decrease to about 92.0° and 90.4°, respectively, compared with the PS1-G (≈95.5°). These findings further confirm that a slight decline in hydrophobicity with increasing PS MW.
The surface microstructures of pristine samples (PS1, PS2, and PS3) and their corresponding rGO nanocomposites (PS1-G, PS2-G, and PS3-G) were systematically characterized using SEM. As shown in Figure 4, comparative analysis reveals distinct differences in surface morphology. PS2 and PS3 exhibit smoother and more homogeneous surfaces comparing with PS1, which is consistent with their relatively lower WCAs shown in Figure 3(a)–(c). This trend is also observed in the composite samples, where PS2-G and PS3-G display improved surface uniformity relative to PS1-G, thereby maintaining lower WCA values. Meanwhile, the incorporation of rGO leads to a pronounced increase in surface roughness across all nanocomposites compared with their pristine counterparts, resulting in a corresponding increase in WCA [30]. These results emphasize the dual influence of intrinsic polymer morphology and rGO-induced microstructural modifications on surface wettability behavior.

Surface SEM results of PS samples. (a) PS1, (b) PS2, (c) PS3, (d) PS1-G, (e) PS2-G, and (f) PS3-G.
The uniformity of surface chemical composition plays a crucial role in determining material wettability [31], 32]. To further characterize the elemental composition and spatial distribution of the main elements, EDS was performed on the corresponding surface morphologies of PS1, PS2, and PS3, along with their rGO-based nanocomposites (PS1-G, PS2-G, and PS3-G), as shown in Figure 5. The figure also presents EDS overlay images and elemental mapping for carbon (C) and oxygen (O). Table 2 summarizes the atomic percentages of the surface elements obtained from EDS analysis. Based on the combined results from Figure 5 and Table 2, there is no significant variation in the C and O contents among PS1, PS2, and PS3, and both elements exhibit uniform surface distribution. Similarly, the C and O elements in the PS nanocomposites containing rGO are also uniformly dispersed, confirming the homogeneous distribution of rGO within the PS matrix.

EDS superposition diagram of elements carbon (C) and oxygen (O), and mapping diagram of elements C and O. (a) PS1, (b) PS2, (c) PS3, (d) PS1-G, (e) PS2-G, and (f) PS3-G.
Atomic percentage of different samples obtained from EDS results.
| Atomic percentage (%) Sample |
C | O |
|---|---|---|
| PS1 | 97.11 | 2.89 |
| PS2 | 98.04 | 1.96 |
| PS3 | 97.38 | 2.62 |
| PS1-G | 97.78 | 2.22 |
| PS2-G | 98.37 | 1.63 |
| PS3-G | 96.64 | 3.06 |
To conduct a comprehensive analysis of the molecular structure, chemical composition, functional groups, and bond vibrations within materials, FTIR spectroscopy provides valuable insights into their chemical structure and physical characteristics. As shown in Figure 6, the FTIR spectra of PS1, PS2, and PS3 are largely consistent with those of their corresponding nanocomposites (PS1-G, PS2-G, and PS3-G). In the PS spectrum, a distinct absorption peak appears at 3,030 cm−1, corresponding to the C–H stretching vibration of the benzene ring. Additional peaks at 2,910 cm−1 and 2,840 cm−1 are assigned to the asymmetric and symmetric stretching vibrations of the–CH2 groups in the PS backbone, respectively [33]. The C–H bending vibrations are observed at 1,490 cm−1 and 1,450 cm−1, while the C=C stretching vibration of the benzene ring is evident at 1,600 cm−1 [34]. Furthermore, the peak at 694 cm−1 indicates the presence of a mono-substituted benzene ring [35], and the peak at 537 cm−1 is likely associated with the axial deformation of the CH group within the aromatic ring [36].

FTIR analysis for (a) PS1, PS2, and PS3, and (b) PS1-G, PS2-G, and PS3-G.
Figure 7 presents the XRD patterns of PS1, PS2, and PS3, as well as their corresponding PS1-G, PS2-G, and PS3-G nanocomposites. As shown in Figure 7(a), the XRD patterns of the PS samples with different MWs exhibit two broad, flat peaks resembling steamed buns, located at 2θ = 9.9° and 2θ = 19.3°, with no additional distinct crystalline peaks observed [36], 37]. In Figure 7(b), the diffraction patterns of the PS-G nanocomposites, regardless of MW, closely resemble those of the pristine PS samples after rGO incorporation. These observations suggest that neither the variation in PS MW nor the addition of rGO nanofillers significantly affects the amorphous structure or overall diffraction characteristics of the PS matrix.

XRD analysis for (a) PS1, PS2, and PS3, and (b) PS1-G, PS2-G, and PS3-G.
Further analysis of the PS materials and their nanocomposites was performed using Raman spectroscopy. Figure 8 presents the Raman spectra of PS1, PS2, and PS3, along with their corresponding PS1-G, PS2-G, and PS3-G nanocomposites. As shown in Figure 8, the Raman spectra of PS samples with different MWs display highly similar peak profiles. Notably, a sharp peak around 1,000 cm−1 is attributed to the symmetric vibration of the benzene ring, while a significant peak at 1,600 cm−1 corresponds to the C=C stretching vibration within the benzene ring. Additionally, the intense peak at approximately 3,052 cm−1 is assigned to the C–H stretching vibration of the aromatic ring [38], 39].

Raman analysis for (a) PS1, PS2, and PS3, and (b) PS1-G, PS2-G, and PS3-G.
In the Raman spectra of PS nanocomposites containing rGO nanofillers, the spectral features remain nearly identical across all MWs [33], indicating that MW variation does not significantly influence the chemical structure of the materials.
These findings further demonstrate that, although the surface morphology of pristine PS and its nanocomposites vary with MW, their chemical composition remains essentially unchanged. Therefore, the observed decrease in WCA with increasing MW is primarily attributed to morphological differences rather than compositional variations. Consequently, samples with MWs exhibit larger contact angles, reflecting enhanced hydrophobicity.
Figure 9 presents the results of WVTR, OTR, and HTR for PS1, PS2, and PS3, along with their corresponding nanocomposites (PS1-G, PS2-G, and PS3-G). As shown in Figure 9(a), the WVTR increases slightly from 1.50 g/m2·day for PS1 to 1.59 g/m2·day for PS2, indicating a slight deterioration in the water vapor barrier property. Conversely, the WVTR of PS3 decreases to 1.27 g/m2·day. These results suggest that, with increasing MW, the water vapor barrier property of PS materials first decreases and then improves. A similar trend is observed for the nanocomposites, where the WVTR rises from 0.54 g/m2·day in PS1-G to 0.61 g/m2·day in the PS2-G, and subsequently decreases to 0.48 g/m2·day in the PS3-G.

Gas permeation selectivity in water vapor-oxygen-hydrogen barrier systems. (a) WVTR, (b) OTR, and (c) HTR of PS1, PS2, PS3, PS1-G, PS2-G, and PS3-G, respectively.
In Figure 9(b)–a pronounced variation in OTR is observed among the PS samples. The OTR increases from 509.41 g/m2·day for PS1 to 1,119.8 g/m2·day for PS2, and further escalates to 4,586.11 g/m2·day for PS3. This suggests that a positive correlation between OTR and MW, with lower-MW PS exhibiting better oxygen barrier properties. Similarly, the OTR values for PS1-G, PS2-G, and PS3-G nanocomposites are 40.72 g/m2·day, 58.09 g/m2·day, and 138.32 g/m2·day, respectively, demonstrating a consistent trend in oxygen barrier properties.
Figure 9(c) reveals that the HTR for PS1, PS2, and PS3 are 830 cm2/(m2·day·0.1 MPa), 842 cm2/(m2·day·0.1 MPa), and 907 cm2/(m2·day·0.1 MPa), respectively. The change in MW exerts only a minor influence on their HTR, suggesting that the permeation of hydrogen through PS materials is relatively unaffected by molecular weight. Moreover, the incorporation of rGO nanofillers into the PS nanocomposites results in a slight increase in HTR [14], with values of 920 cm2/(m2·day·0.1 MPa), 857 cm2/(m2·day·0.1 MPa), and 912 cm2/(m2·day·0.1 MPa) for PS1-G, PS2-G, and PS3-G, respectively. However, the hydrogen permeation properties of the PS nanocomposites remain largely unchanged across the different MWs, indicating that MW does not significantly influence hydrogen permeation in the nanocomposites.
Intuitively, increased MW should lead to greater chain entanglement and reduced free volume, making gas transmission more difficult. The WVTR results generally support this expectation, with PS3 exhibiting the lowest WVTR and the best water vapor barrier performance. Additionally, the enhanced hydrophilicity of PS3 may further hinder water vapor diffusion, contributing to its superior water vapor barrier properties. However, the data suggests that lower-MW PS materials exhibit lower permeability for oxygen and hydrogen. This could be attributed to the fact that higher-MW PS has reduced molecular chain mobility, which requires higher temperatures or longer durations to achieve an orderly arrangement and reduce free volume. As a result, PS1, with the lowest MW, as well as PS1-G, demonstrates superior barrier selectivity compared to higher MW systems. These materials exhibit exceptional properties in terms of water vapor barrier, oxygen barrier, and hydrogen permeability characteristics.
Finally, TGA was employed to assess the thermal stability of the PS nanocomposites, with a particular focus on the effect of changes in PS MW on its thermal properties. Figure 10 presents the TGA curves for PS1, PS2, and PS3 materials, along with their corresponding nanocomposites PS1-G, PS2-G, and PS3-G. As shown in Figure 10(a), within the temperature range of 350–400 °C, the thermal degradation of PS1 begins first, followed by PS2, and then PS3. This trend suggests that the thermal stability of PS materials improves with increasing MW. The thermal degradation process accelerates as the polymer chain ruptures, resulting in the formation of volatile low-MW products such as styrene monomers and other aromatic compounds. This results in significant mass loss, and by approximately 475 °C, all PS samples – regardless of MW – are essentially fully degraded. At 800 °C, the final residues of PS1, PS2, and PS3 materials are 0.38 %, 0.30 %, and 0.35 %, respectively. In contrast, as seen in Figure 10(b), the thermal degradation of PS1-G, PS2-G, and PS3-G nanocomposites occurs nearly simultaneously, with minimal influence from changes in MW. This behavior is primarily attributed to the incorporation of rGO nano-fillers into the PS matrix, which enhances the thermal stability of the PS1-G nanocomposites with lower MW.

TGA curves for (a) PS1, PS2, and PS3, and (b) PS1-G, PS2-G, and PS3-G.
4 Conclusions
This study successfully fabricated three PS materials (PS1, PS2, and PS3) and their corresponding rGO nanocomposites (PS1-G, PS2-G, and PS3-G) via simple hot-pressing. The WCA of both PS materials and PS-G composites decreased with higher MW, indicating reduced hydrophobicity. Variations in MW had minimal impact on the chemical composition of the PS materials and PS-G composites. The WVTR exhibited a non-monotonic dependence on MW, increasing from 1.50 g/m2·day for PS1 to 1.59 g/m2·day for PS2, and then decreasing to 1.27 g/m2·day for PS3. The OTR of PS materials increased with MW, and the same trend was observed in PS-G composites. The HTR of PS1, PS2, and PS3 remained largely unaffected by MW or rGO incorporation. The low-molecular-weight PS1 and PS1-G composites demonstrated optimal barrier selectivity, combining high water vapor barrier performance, high oxygen barrier performance, and high hydrogen permeability.
However, the incorporation of rGO rendered all PS-G composites black, and this limitation may restrict the application fields of this material in some packaging applications. Moreover, long-term stability testing, performance under varying humidity/temperature, or exploration of other nanofillers will be under consideration in future research.
-
Funding information: The authors would like to acknowledge the Sichuan Science and Technology Program (No. 2024NSFSC0246), the Stomatology Key Program of Southwest Medical University in 2024 (No. 2024KQZX01), the Undergraduate Innovation and Entrepreneurship Training Program of Southwest Medical University (No. S202410632178), the Luzhou Science and Technology Program (No. 2022-GYF-12), the Undergraduate Innovation Training Program Incubation and Cultivation Projects of Chengdu University (No. CDUCX2025018), the Talent Introduction Program of The Affiliated Stomatological Hospital of Southwest Medical University (No. 2022BS02), and the Innovative Leading Talents Program of The Affiliated Stomatological Hospital of Southwest Medical University (No. 2022LJ02).
-
Author contribution: All authors have accepted responsibility for the entire content of this manuscript and approved its submission.
-
Conflict of interest: The authors state no conflict of interest.
-
Data availability statement: The datasets generated and/or analysed during the current study are available from the corresponding author on reasonable request.
References
1. Tai, X, Si, M, Saad, S, Li, X, Zhao, X, Guo, J. Cold sintered ZnO-Polystyrene (PS) composites with modified interfacial structures and properties. ACS Appl Mater Interfaces 2024;16:64995–5003. https://doi.org/10.1021/acsami.4c12761.Suche in Google Scholar PubMed
2. Akanji, IO, Iwarere, SA, Sani, BS, Mukhtar, B, Jibril, BE-Y, Daramola, MO. Polystyrene-reduced graphene oxide composite as sorbent for oil removal from an oil-water mixture. Chem Eng Sci 2024;298:120383. https://doi.org/10.1016/j.ces.2024.120383.Suche in Google Scholar
3. Cherednichenko, K, Bardina, K, Vishnevich, A, Gablina, M, Gataulina, A, Nikolaev, Y, et al.. A facile one-step synthesis of polystyrene/cellulose (PS@MFC) biocomposites for the preparation of hybrid water-absorbing sponge materials. Polymers 2023;15:4328. 152023.10.3390/polym15214328Suche in Google Scholar PubMed PubMed Central
4. Pilevar, Z, Bahrami, A, Beikzadeh, S, Hosseini, H, Jafari, SM. Migration of styrene monomer from polystyrene packaging materials into foods: characterization and safety evaluation. Trends Food Sci Technol 2019;91:248–61. https://doi.org/10.1016/j.tifs.2019.07.020.Suche in Google Scholar
5. Rehim, MHA, Youssef, AM, Ghanem, A. Polystyrene/hydrophobic TiO2 nanobelts as a novel packaging material. Polym Bull 2015;72:2353–62. https://doi.org/10.1007/s00289-015-1408-2.Suche in Google Scholar
6. Saleem, W, Nazir, R, Chaudhry, MN, Saleem, M, Abidi, SH. Packaging material-based polystyrene ZnFe2O4/clay nanocomposite: preparation, characterization and degradation studies. Appl Nanosci 2022;12:1459–73. https://doi.org/10.1007/s13204-021-02316-2.Suche in Google Scholar
7. Yan, J, Cheng, W, Ding, C, Qiu, Z, Lu, X, Li, X. Research on the stability and response of food packaging polystyrene resin materials to γ-ray irradiation. ACS Omega 2024;9:38668–77. https://doi.org/10.1021/acsomega.4c04407.Suche in Google Scholar PubMed PubMed Central
8. Mahand, SN, Yazdanbakhsh, A, Tayouri, MI, Zarei, A, Nouranian, S, Ruckdäschel, H, et al.. Theoretical and experimental investigation of selective gas permeability in polystyrene/polyolefin elastomer/nanoclay nanocomposite films. Polym Test 2023;120:107960. https://doi.org/10.1016/j.polymertesting.2023.107960.Suche in Google Scholar
9. Tayouri, MI, Estaji, S, Mousavi, SR, Yazdanbakhsh, A, Nouranian, S, Ruckdäschel, H, et al.. Polystyrene/polyolefin elastomer blends loaded with halloysite nanotubes: morphological, mechanical, and gas barrier properties. Macromol Mater Eng 2023;308:2300080. https://doi.org/10.1002/mame.202300080.Suche in Google Scholar
10. Fakhri, LA, Ghanbarzadeh, B, Dehghannya, J, Dadashi, S. Central composite design based statistical modeling for optimization of barrier and thermal properties of polystyrene based nanocomposite sheet for packaging application. Food Packag Shelf Life 2021;30:100725. https://doi.org/10.1016/j.fpsl.2021.100725.Suche in Google Scholar
11. Channa, IA, Ashfaq, J, Gilani, SJ, Shah, AA, Chandio, AD, Jumah, MN. UV blocking and oxygen barrier coatings based on polyvinyl alcohol and zinc oxide nanoparticles for packaging applications. Coatings 2022;12:897. 122022.10.3390/coatings12070897Suche in Google Scholar
12. Ghanem, AF, Youssef, AM, Abdel Rehim, MH. Hydrophobically modified graphene oxide as a barrier and antibacterial agent for polystyrene packaging. J Mater Sci 2020;55:4685–700. https://doi.org/10.1007/s10853-019-04333-7.Suche in Google Scholar
13. Merritt, SMJ, Wemyss, AM, Farris, S, Patole, S, Patias, G, Haddleton, DM, et al.. Gas barrier polymer nanocomposite films prepared by graphene oxide encapsulated polystyrene microparticles. ACS Appl Polym Mater 2020;2:725–31. https://doi.org/10.1021/acsapm.9b01041.Suche in Google Scholar
14. Patel, HD, Acharya, NK. Transport properties of polymer blends and composite membranes for selective permeation of hydrogen. Int J Hydrogen Energy 2023;48:37796–810. https://doi.org/10.1016/j.ijhydene.2022.11.304.Suche in Google Scholar
15. Azizi, N, Mahdavi, HR, Isanejad, M, Mohammadi, T. Effects of low and high molecular mass PEG incorporation into different types of poly(ether-b-amide) copolymers on the permeation properties of CO2 and CH4. J Polym Res 2017;24:141. https://doi.org/10.1007/s10965-017-1297-1.Suche in Google Scholar
16. Inada, A, Kumagai, K, Matsuyama, H. Effect of the molecular weights of thermoresponsive polyalkylene glycol draw solutes on forward osmosis performance. Separat Purif Technol 2020;252:117462. https://doi.org/10.1016/j.seppur.2020.117462.Suche in Google Scholar
17. Palen, B, Iverson, ET, Rabaey, MG, Kulatilaka, S, Grunlan, JC. Graphene oxide nanobrick wall for gas barrier and fire protection of polystyrene. J Mater Sci 2023;58:7594–601. https://doi.org/10.1007/s10853-023-08491-7.Suche in Google Scholar
18. Wang, P, Qin, H, He, D, Zou, Z, Xu, L, Tang, Q. Developing colorimetric ammonia-sensing nanocomposite films based on potato starch/PVA and ZnCu-BTC nanorods for real-time monitoring food freshness. Int J Biol Macromol 2024;277:134376. https://doi.org/10.1016/j.ijbiomac.2024.134376.Suche in Google Scholar PubMed
19. Guo, Z, Lee, LJ, Tomasko, DL. CO2 permeability of polystyrene nanocomposites and nanocomposite foams. Ind Eng Chem Res 2008;47:9636–43. https://doi.org/10.1021/ie8000088.Suche in Google Scholar
20. Ashfaq, J, Channa, IA, Memon, AG, Chandio, IA, Chandio, AD, Shar, MA, et al.. Enhancement of thermal and gas barrier properties of graphene-based nanocomposite films. ACS Omega 2023;8:41054–63. https://doi.org/10.1021/acsomega.3c02885.Suche in Google Scholar PubMed PubMed Central
21. Huang, Q, Tong, Y, Hu, B, Huang, J, Cao, X, Yang, Z, et al.. High-performance polybenzoxazine based composites PEMFC bipolar plates with a multi-layer structure for surface enrichment of conductive phase. Int J Hydrogen Energy 2023;48:32540–52. https://doi.org/10.1016/j.ijhydene.2023.05.039.Suche in Google Scholar
22. Lee, W, Hong, J, Song, J, Yang, W, Kim, J. Fabrication of high-performance thermally conductive phase change material composites with porous ceramic filler network for efficient thermal management. Compos Sci Technol 2023;240:110092. https://doi.org/10.1016/j.compscitech.2023.110092.Suche in Google Scholar
23. Dai, M, Cheng, A, Lim, L-T, Xiao, Q. Properties and application of antioxidant and antibacterial composite films based on methylcellulose and spine grape pomace fabricated by thermos-compression molding. Food Chem 2024;453:139683. https://doi.org/10.1016/j.foodchem.2024.139683.Suche in Google Scholar PubMed
24. Lv, S, Wang, D, Tang, J, Liu, Z, Inoue, H, Tang, B, et al.. Transparent composites for efficient neutron detection. Nat Commun 2024;15:6746. https://doi.org/10.1038/s41467-024-51119-w.Suche in Google Scholar PubMed PubMed Central
25. Tan, D, Jiang, C, Li, Q, Bi, S, Wang, X, Song, J. Development and current situation of flexible and transparent EM shielding materials. J Mater Sci Mater Electron 2021;32:25603–30. https://doi.org/10.1007/s10854-021-05409-4.Suche in Google Scholar
26. Chen, X, Hou, G, Chen, Y, Yang, K, Dong, Y, Zhou, H. Effect of molecular weight on crystallization, melting behavior and morphology of poly(trimethylene terephalate). Polym Test 2007;26:144–53. https://doi.org/10.1016/j.polymertesting.2006.08.011.Suche in Google Scholar
27. Kim, HH, Song, DW, Kim, MJ, Ryu, SJ, Um, IC, Ki, CS, et al.. Effect of silk fibroin molecular weight on physical property of silk hydrogel. Polymer 2016;90:26–33. https://doi.org/10.1016/j.polymer.2016.02.054.Suche in Google Scholar
28. Bandyopadhyay, S, Srinivasan, A. Polymer nanocomposites: from synthesis to applications. In: Cuppoletti, J, editor. Nanocomposites and Polymers with Analytical Methods. Rijeka: IntechOpen; 2011.Suche in Google Scholar
29. Zhang, L, Wang, Y, Wang, Z, Liu, G, Guo, Y, Liu, X, et al.. Liquid/Air dynamic behaviors and regulation mechanisms for bioinspired surface. Appl Phys Rev 2022;9:041315. https://doi.org/10.1063/5.0102883.Suche in Google Scholar
30. Wenzel, RN. Resistance of solid surfaces to wetting by water. Ind Eng Chem 1936;28:988–94. https://doi.org/10.1021/ie50320a024.Suche in Google Scholar
31. Liu, S, Li, S, Song, K, Guo, X, Song, H, Qi, K, et al.. Effect of cold deformation on the microstructural and property uniformity of Al2O3/Cu composites. Materials 2025;18:125. 182025.10.3390/ma18010125Suche in Google Scholar PubMed PubMed Central
32. Chen, G, Wan, J, He, N, Zhang, H-m, Han, F, Zhang, Y-m. Strengthening mechanisms based on reinforcement distribution uniformity for particle reinforced aluminum matrix composites. Trans Nonferrous Metals Soc China 2018;28:2395–400. https://doi.org/10.1016/s1003-6326(18)64885-x.Suche in Google Scholar
33. Gabriel, GMF, Lada, DL, Nelly, FR, Leandro, GG, Luis, ZP, Lourdes, MSM. Composite films from polystyrene with hydroxyl end groups and carbon nanotubes %J Mater Res. 2016;19:133-8.10.1590/1980-5373-mr-2016-0783Suche in Google Scholar
34. Alcaraz-Espinoza, JJ, Chávez-Guajardo, AE, Medina-Llamas, JC, Andrade, CAS, de Melo, CP. Hierarchical composite Polyaniline–(Electrospun polystyrene) fibers applied to heavy metal remediation. ACS Appl Mater Interfaces 2015;7:7231–40. https://doi.org/10.1021/acsami.5b00326.Suche in Google Scholar PubMed
35. Huan, S, Bai, L, Liu, G, Cheng, W, Han, G. Electrospun nanofibrous composites of polystyrene and cellulose nanocrystals: manufacture and characterization. RSC Adv 2015;5:50756–66. https://doi.org/10.1039/c5ra06117b.Suche in Google Scholar
36. Botan, R, Nogueira, T, Lona, L, Wypych, F. Synthesis and characterization of exfoliated polystyrene-layered double hydroxide nanocomposites via in situ polymerization. Polímeros 2010;21:34–8.10.1590/S0104-14282011005000017Suche in Google Scholar
37. de Farias, LMS, Ghislandi, MG, de Aguiar, MF, Silva, DBRS, Leal, ANR, de, AO, et al.. Electrospun polystyrene/graphene oxide fibers applied to the remediation of dye wastewater. Mater Chem Phys 2022;276:125356. https://doi.org/10.1016/j.matchemphys.2021.125356.Suche in Google Scholar
38. Granadino-Roldán, JM, Fernández-Gómez, M, Navarro, A. The vibrational analysis of styrene, revisited. Chem Phys Lett 2003;372:255–62. https://doi.org/10.1016/s0009-2614(03)00416-0.Suche in Google Scholar
39. Hong, PP, Boerio, FJ, Clarson, SJ, Smith, SD. An investigation of the interdiffusion of polystyrene and deuterated polystyrene using surface-enhanced raman scattering. Macromolecules 1991;24:4770–6. https://doi.org/10.1021/ma00017a007.Suche in Google Scholar
© 2026 the author(s), published by De Gruyter, Berlin/Boston
This work is licensed under the Creative Commons Attribution 4.0 International License.
Artikel in diesem Heft
- Research Articles
- A green and sustainable biocomposite materials: environmentally robust, high performance, low-cost materials for helicopter lighter structures
- Microstructural and UCS behavior of clay soils stabilized with hybrid nano-enhanced additives
- Optimization of microstructure and mechanical properties of microwave-sintered V/Ta/Re-doped tungsten heavy alloys
- Experimental and numerical study on the axial compression behavior of circular concrete columns confined by BFRP spirals and ties
- Effect of A-site calcium substitution on the energy storage and dielectric properties of ferroelectric barium titanate system
- Comparative analysis of aggregate gradation variation in porous asphalt mixtures under different compaction methods1
- Thermal and mechanical properties of bricks with integrated phase change and thermal insulation materials
- Nonlinear molecular weight dependency in polystyrene and its nanocomposites: deciphering anomalous gas permeation selectivity in water vapor-oxygen-hydrogen barrier systems
- ZnO nanophotocatalytic solution with antimicrobial potential toward drug-resistant microorganisms and effective decomposition of natural organic matter under UV light
- Predicting fracture energy and durability parameters of concrete through hybrid machine learning models
- α-hemihydrate gypsum crystal concerning the anionic surfactants with vary chain structure: syntheses, morphology controlling, formation mechanisms
- Advanced machine learning-driven prediction in construction materials: comparative analysis and software implementation for fiber-reinforced graphene nano-engineered concrete
- Innovative development of self-healing high-strength concrete using a polymeric air-entraining agent and Bacillus sphaericus: durability performance in aggressive saline environments
- Influence of welding speed on the microstructure and mechanical properties of CMT+P WAAM-based 205C aluminum alloy
- EcoMarble: macro-performance and carbon footprint optimization of concrete using cement-substituted Al-Kharj marble dust
- Predicting properties of lightweight strain-hardening ultra-high-performance concrete using smart hybrid AI-based framework
- Microstructural evolution and dry sliding wear behavior of composite shear flow casting M50 steel under different tempering conditions
- Long-term durability and microstructure of advanced high-performance concrete with cement kiln dust, boiler slag and PP fibers: flexural response and sustainability assessment
- Development of lightweight roof tiles using spent mushroom material: enhancing thermal insulation and sustainability
- Tailoring rheology and mechanical properties of 3D printed mortars with nanoclays and superplasticizer
- Review Articles
- Granite powder in concrete: a review on durability and microstructural properties
- Properties and applications of warm mix asphalt in the road construction industry: a comprehensive review and insights toward facilitating large-scale adoption
- Artificial Intelligence in the synthesis and application of advanced dental biomaterials: a narrative review of probabilities and challenges
- Recycled tire rubber as a fine aggregate replacement in sustainable concrete: a comprehensive review
- Performance evaluation of blended cement mortar with supplementary cementitious materials: from pozzolans to industrial wastes
- A review on rutting in asphalt concrete in Saudi Arabia: mitigation strategies, innovations, and future directions
- Rapid Communication
- Recent advances in resistive strain sensors: from materials and fabrication to applications in plant wearables
- Special Issue on AI-Driven Advances for Nano-Enhanced Sustainable Construction Materials - Part II
- Sustainable approach to control autogenous shrinkage in low water–cement ratio concretes
- Use of explainable symbolic regression approaches for predicting nanomaterial-enhanced concrete performance