Microstructural and UCS behavior of clay soils stabilized with hybrid nano-enhanced additives
-
Nagihan Doğan
 and
Müge Elif Fırat
and
Müge Elif Fırat


Abstract
In this study, both individual and hybrid effects of industrial wastes (silica fume, fly ash), fibers (glass and basalt) and nanoparticles (nano SiO2, nanoclay) mixed with clay at different ratios were investigated in detail at macro and micro levels at different water contents and curing times. The efficiency of stabilization in clay soils was determined using Gray Correlation Analysis (GCA). A predictive model for the stress-strain relationship of stabilized soils with hybrid material was proposed. Results showed negligible changes in dry density and optimum moisture content with silica fume and fly ash, while nano SiO2 and nanoclay induced significant variations. The unconfined compressive strength (UCS) tests showed a significant increase in soil strength with the addition of nanomaterials, especially after long curing times. The presence of nano SiO2 and nanoclay in the composite specimens increased the UCS by 87.15 % and 63.83 % before curing, respectively, while it increased to 317.50 % and 219.74 % after the maximum curing time. GCA identified curing time as the most influential factor, followed by silica fume, glass fiber, and nanoclay, due to progressive bonding development. Nanoclay demonstrated superior UCS enhancement compared to nano SiO2, underscoring its effectiveness in soil stabilization. The study contributes to the literature to realize the full benefits of these additives to improve soil stability and the UCS performance, and to address waste recycling, increase the strength of subgrade soils under different environmental conditions, and reduce the costs associated with the use of waste.
1 Introduction
In geotechnical engineering, clayey soils can cause significant challenges in both infrastructure and superstructure projects due to their high swelling–shrinking potential, low permeability, low shear strength, and heterogeneity. These properties can lead to deformation and damage in pipelines, tunnels, underground structures, foundations, pavements, and transportation infrastructure such as roads and railways [1], [2], [3], [4], [5], [6], [7], [8], [9], [10]. Changes in water content further intensify these issues by causing swelling, shrinkage, differential settlement, reduced shear strength, and even landslides, thereby threatening the long-term stability of constructions [11], [12], [13], [14], [15], [16], [17].
To mitigate these problems, soil improvement methods such as chemical stabilization are widely applied, where additives including lime, cement, fly ash, silica fume, and industrial by-products enhance strength, reduce swelling, and improve durability [18], [19], [20], [21], [22], [23], [24], [25], [26], [27]. More recently, industrial waste materials, fibers, and nanoparticles have gained attention due to their efficiency, sustainability, and environmental benefits [28], [29], [30]. In addition to wastes such as fly ash, silica fume, marble powder, plastics and various forms of slag, fibers are also preferred to achieve various results in soil stabilization [31], [32], [33], [34], [35], [36], [37], [38], [39], [40]. Fibers enhance liquefaction resistance, reduce swelling and fragility, and provide resilience against freeze–thaw cycles, while fly ash and plastic wastes improve compaction and shear properties [41], 42]. Nanomaterials such as silica, alumina, calcium carbonate, and lime offer further advantages by improving soil microstructure, increasing reactivity, and enabling eco-friendly stabilization [43], [44], [45], [46], [47], [48], [49]. When compared to conventional grouting methods, the use of nanomaterials for soil improvement is more economic, eco-friendly and reduces soil degradation. The characteristics and performance of nanomaterials in stabilization mechanisms are greatly affected by their complex properties, including particle size, microstructure, micro-composition, interfacial reactions between nanoparticles and soil [50], [51], [52], [53].
The stabilization of a clay soil using industrial waste materials, fibers and nanoparticles is of great importance both in terms of improving engineering performance and environmental sustainability. The use of industrial waste materials reduces environmental pollution by recycling waste and provides economic benefits. Fibers improve the mechanical properties of soil, increasing its bearing capacity and stability. In addition, the use of fibers reduces the tendency of the soil to swell and shrink, providing resistance to differential settlement and structural damage. Nanoparticles, because of their large surface area and high reactivity, strengthen the bonds between soil particles and improve the microstructural features of the soil. These combined additives increase the shear strength of clay soils, reducing the risk of landslides and collapses, while improving the durability and performance of the soil over time. Such innovative enhancement methods enable the realization of safer, more durable and environmentally friendly construction projects. However, previous research has primarily focused on the individual effects of the additives used in this study and the utilization of traditional waste materials, leaving a gap in understanding the combined effect of all these additives.
In this research, the unconfined compressive strength (UCS) behavior of clayey soils enhanced with varying amounts of industrial by-products (silica fume and fly ash), fibers (glass and basalt), and nanoparticles (nano SiO2 and nanoclay), both individually and in hybrid combinations, was comprehensively investigated at both macroscopic and microscopic scales. The UCS tests were conducted to evaluate the strength performance of optimized mixtures under different curing durations and moisture contents. To quantify the relative effectiveness of each additive and experimental parameter, Grey Correlation Analysis (GCA) was employed-a rarely applied method in similar studies. Furthermore, a predictive model was developed to describe the stress–strain behavior of the stabilized soils, with potential applicability in geotechnical design. Microstructural analyses using scanning electron microscopy (SEM) were also carried out to explain the bonding mechanisms induced by the additives at particle level.
The novelty of this study lies in its integrated approach, where industrial wastes, fibers, and nanomaterials are used together in a multi-scale investigation. Unlike prior research focusing on individual or binary additives, this work explores the combined effects of all three material types in a unified framework, highlighting the synergetic mechanisms of hybrid stabilization. Moreover, the use of GCA for quantifying influence levels, the introduction of a stress–strain prediction model, and the detailed microstructural evaluation collectively distinguish this study from existing literature. In contrast to previous studies that mainly examined binary additive combinations, this research advances the field by simultaneously incorporating industrial wastes, fibers, and nanoparticles, thereby revealing their synergistic effects on the strength and microstructural behavior of clayey soils.
2 Materials and methods
2.1 Materials
Clay soils from the East Anatolian region of Turkey, specifically from the province of Elazig, were used in this study. Index properties of the clayey soils, including specific gravity, Atterberg limits, and compaction tests, were determined. The obtained results are presented in Table 1, while the particle size distribution [54], 55] is shown in Figure 1.
The index properties of clay.
| Physical properties | Value | Test standard |
|---|---|---|
| Specific gravity | 2.66 | ASTM D854 (2017) [56] |
| Liquid limit (%) | 49.45 | ASTM D 4318 (2017) [57] |
| Plastic limit (%) | 24.04 | |
| Plasticity index (%) | 25.41 | |
| Maximum dry density (g/cm3) | 1.72 | ASTM D698 (2017) [58] |
| Optimum water content (%) | 17.30 | |
| Gravel (%) | 5.59 | ASTM D6913 (2017) [54] ASTM D7928 (2017) [55] |
| Sand (%) | 43.44 | |
| Silt (%) | 24.77 | |
| Clay (%) | 26.20 | |
| USCS soil classification | CL |

The particle size distribution.
In this study, microsilica fume supplied by Antalya Eti Metallurgy and F-class fly ash from Bursa Power Plant (Turkey) were used to stabilize the clay soil. The general view and chemical compounds of the industrial wastes are shown in Figure 2 and Table 2, respectively.

The general view of the industrial wastes.
Chemical compounds of industrial waste materials.
| Chemical compound | F-class fly ash | Micro silica fume |
|---|---|---|
| CaO | 9.48 | 0.40 |
| SiO2 | 48.53 | 94.10 |
| Fe2O3 | 7.59 | 1.50 |
| Al2O3 | 24.61 | 0.90 |
| SiO3 | – | 94.10 |
| Na2O | – | 0.40 |
| K2O | – | 0.90 |
| MgO | 2.28 | 0.10 |
In addition, the glass and basalt fibers used in this study are readily available commercially (Figure 3). The samples were mixed with basalt and glass fibers at 0 %, 1 %, 1.5 % and 2 %. The fibers were provided by AlgıLAB, Elazığ (Turkey). The mechanical and physical properties of basalt and glass fibers are shown in Table 3.

Fibers used in the study.
The mechanical and physical properties of basalt and glass fibers.
| Basalt fiber | Glass fiber | |
|---|---|---|
| Fiber length | 6 mm | 6 mm |
| Breaking strength | 3,900 MPa | 3,400 MPa |
| Breaking extension | 3.1 % | 4.7 % |
| Modulus of elasticity | 86.2 GPa | 77 GPa |
2.2 Experimental method
The objective of this study was to compare the changes in the unconfined compressive strength (UCS) performance of clayey soils when industrial wastes, fibers, and nanomaterials were added in different proportions. Clay specimens were mixed with different proportions of silica fume, fly ash, nano SiO2, nanoclay, glass fiber, and basalt fiber. The specimens prepared according to the determined optimum water content were stored for curing periods of 0, 3, 7, and 14 days and UCS test was performed. In addition, to determine the effect of the change in water content of the untreated and treated specimens on the UCS behavior, specimens with water content greater than the optimum water content determined by the Proctor test (20 %, hereafter > w opt) and specimens with water content less than the optimum water content (13 %, hereafter <w opt) were prepared and UCS values were determined. The experimental design is presented in Table 4.
The experimental design.
| Test no | Tested material* | Water contents (%) | Dimension of the test specimen | Curing period (day) | |
|---|---|---|---|---|---|
| D** | H** | ||||
| Z1 | S | 13.0 %; 17.30 %; 20.0 % | 38.0 | 76.0 | 0; 3; 7; 14 |
| Z2 | S+5 % SF | 13.0 %; 16.78 %; 20.0 % | |||
| Z3 | S+10 % SF | 13.0 %; 16.95 %; 20.0 % | |||
| Z4 | S+20 % SF | 13.0 %; 16.84 %; 20.0 % | |||
| Z5 | S+5 % FA | 13.0 %; 16.20 %; 20.0 % | |||
| Z6 | S+10 % FA | 13.0 %; 16.39 %; 20.0 % | |||
| Z7 | S+20 % FA | 13.0 %; 16.81 %; 20.0 % | |||
| Z8 | S+1 % GF | 13.0 %; 17.30 %; 20.0 % | |||
| Z9 | S+1.5 % GF | 13.0 %; 17.30 %; 20.0 % | |||
| Z10 | S+2 % GF | 13.0 %; 17.30 %; 20.0 % | |||
| Z11 | S+1 % BF | 13.0 %; 17.30 %; 20.0 % | |||
| Z12 | S+1.5 % BF | 13.0 %; 17.30 %; 20.0 % | |||
| Z13 | S+2 % BF | 13.0 %; 17.30 %; 20.0 % | |||
| Z14 | S+0.5 % NS | 13.0 %; 18.01 %; 20.0 % | |||
| Z15 | S+0.7 % NS | 13.0 %; 19.61 %; 20.0 % | |||
| Z16 | S+1 % NS | 13.0 %; 19.21 %; 20.0 % | |||
| Z17 | S+0.5 % NC | 13.0 %; 16.25 %; 20.0 % | |||
| Z18 | S+0.7 % NC | 13.0 %;17.13 %; 20.0 % | |||
| Z19 | S+1 % NC | 13.0 %; 16.20 %; 20.0 % | |||
| Z20 | S+20 % SF+1 % NS+2 % GF | 18.50 % | 0; 7; 14 | ||
| Z21 | S+20 % SF+1 % NC+2 % GF | 17.85 % | |||
-
*S, clayey soil; SF, silica fume; FA, fly ash; GF, glass fiber; BF, basalt fiber; NS, nano SiO2; NC, nanoclay; **H, height (mm); D, diameter (mm).
2.2.1 Compaction test
A standard Proctor compaction test according to ASTM D698 [58] was conducted to evaluate the relationship between optimum water content (w opt) and maximum dry density (γ kmax) for both pure and stabilized soil samples. The test first determined wopt and γ kmax for clay soil. The clay soil was then mixed with various additives, including silica fume, fly ash, nano SiO2, and nanoclay, for further compaction testing. During preparation, the soil and additives were carefully mixed until a uniform mixture was achieved. Water was also added to the mixture of soil and additives to aid in the mixing and compaction processes. In this study, based on the optimum water content, three different water levels were selected: the peak point of the Proctor curve (optimum), as well as one lower and one higher than this point, for both treated and untreated samples. The optimum water content (w opt) represents the water content at which the soil reaches its maximum dry density. It was selected as the reference point to evaluate additive performance under ideal compaction conditions. A lower water content (w <w opt, 13 %) may limit additive efficiency due to insufficient water for proper binding and reaction, though its impact on early strength is still significant. A higher water content (w > w opt, 20 %) may enhance additive dissolution and reaction but can also cause strength loss due to excess pore water. Therefore, comparing different water levels helps assess both beneficial and adverse effects on soil stabilization.
2.2.1.1 Unconfined compression strength test (UCS)
Unconfined compression tests are often used in experimental studies to investigate the effectiveness of powder stabilization or the effect of certain factors on the strength of soil-powder mixtures [59], 60]. This preference is largely due to the extensive experience with such tests in concrete analysis. The UCS clay soil test was conducted in accordance with ASTM D2166 [61]. Specimens were prepared according to the procedures specified in the standard. The UCS of the specimens was measured using a triaxial testing machine at the Soil Mechanics Laboratory, Faculty of Technology, Firat University (as shown in Figure 4). Tests were conducted to failure or 20 % strain, with the maximum load (UCS) accurately recorded for each specimen. Due to the variability typically associated with UCS test results, three specimens were tested for each condition. A loading strain rate of 0.760 mm per minute was applied.

The UCS test machine.
2.2.1.2 Microstructural analysis (SEM images)
The study of the microstructural properties of soils requires the use of a critical instrument, the scanning electron microscope (SEM), which provides high resolution imaging. The advantages of SEM in soil microstructural analysis have led to its extensive use in clay studies [62], 63]. In this study, microstructural analyses were performed at the Nanotechnology and Biomaterials Application and Research Center of Marmara University. SEM images were obtained using a Zeiss EVO MA10 instrument at the university (Figure 5). The soil samples were individually processed into powder form and then packaged. The SEM images were taken at different magnifications.
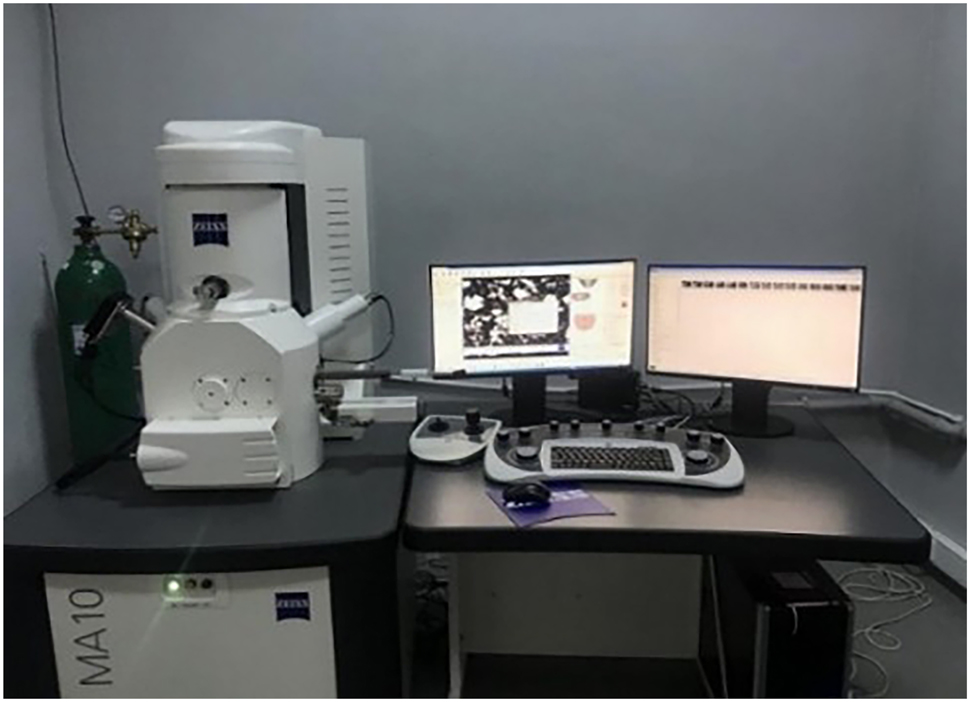
Scanning electron microscope.
2.2.1.3 Specimen preparation procedure and curing period
In this study, the phrase “individual and hybrid effects” denotes two levels of investigation conducted in the study:
Individual effects, where the performance of each additive type (e.g., fly ash alone, nano SiO2 alone) was evaluated separately to understand its standalone impact on the strength and microstructure of the soil.
Hybrid effects, where different additives from more than one class (e.g., nano SiO2 or nanoclay + fly ash or silica fume + fiber) were combined to assess their combined influence and potential synergistic behavior.
This distinction was crucial in identifying not only the effectiveness of each material on its own but also the enhanced or modified behavior when used in combination, especially under varying curing times and water contents.
The soil sample was first allowed to air dry at room temperature, and then the additives were carefully mixed into the dry soil. The optimum water content (wopt) for the mix was then added and mixed to achieve a uniform paste and sealed in double layer plastic bags for 24 h to ensure optimum water content within the mixes. Soil samples were collected using miniature Harvard samplers. The water content of the sample was checked prior to compaction. The prepared specimens were carefully removed from the mold and immediately wrapped in plastic to preserve their water content. The UCS specimens were formed by compacting the mixes in three layers using the apparatus shown in Figure 6a. The first layer was placed in the mold and compacted, followed by the addition and compaction of the second and third layers to form a complete specimen. The final soil samples had dimensions of 38 mm in diameter and 76 mm in length, maintaining a length to diameter ratio of 2.0. The sample preparation process is detailed in Figure 6a through 6c. After preparation, samples were cured in an airtight container at an ambient temperature of approximately 22 °C for periods of 0, 3, 7, and 14 days.
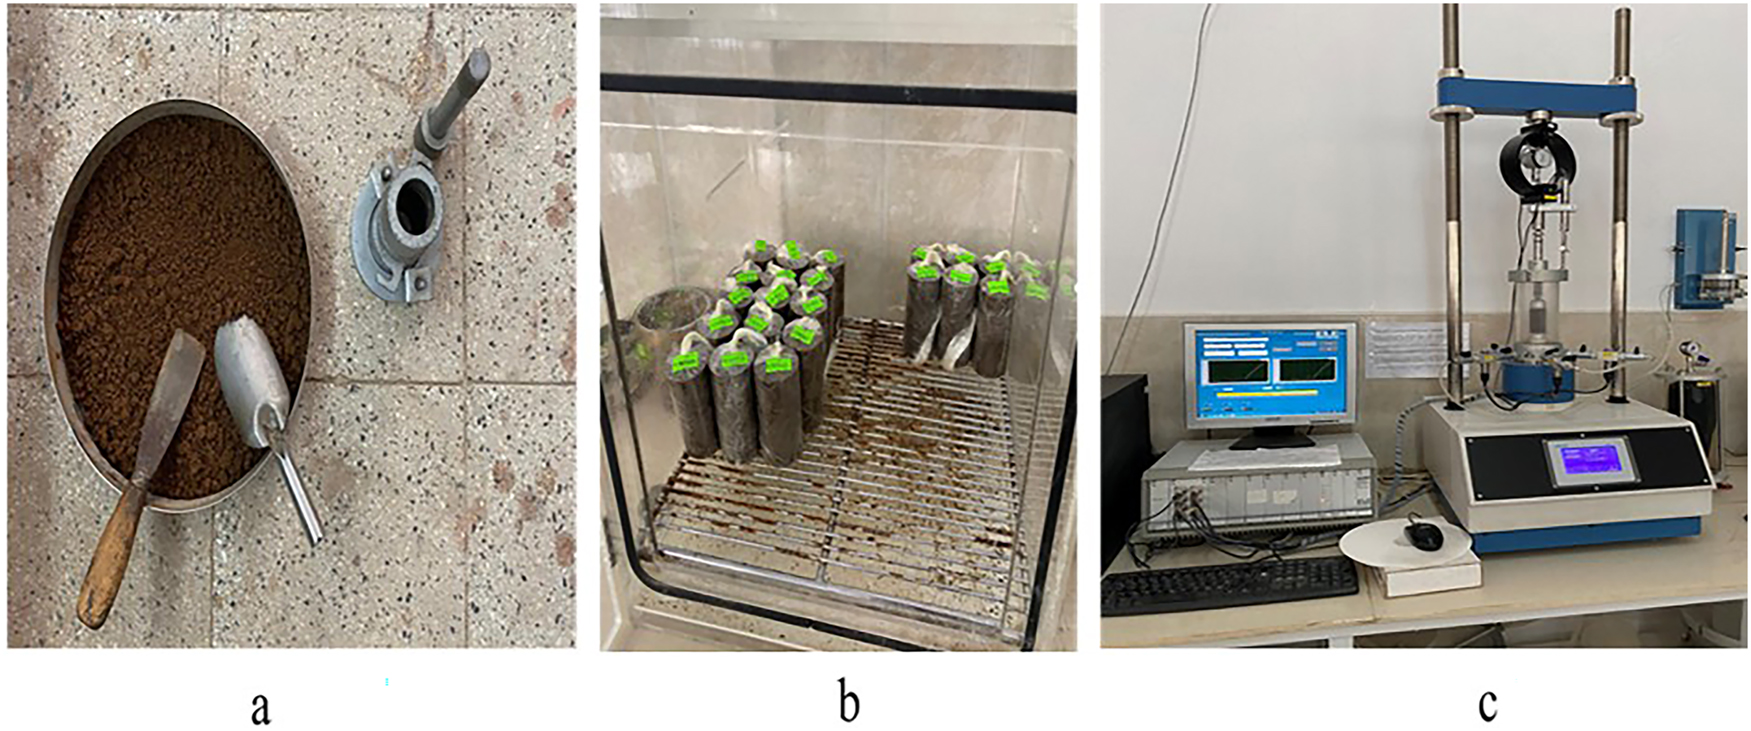
Stages of specimen preparation, curing, and UCS testing in clay soil stabilization. (a) Preparation of test specimens, (b) curing of the UCS soil specimens, (c) UCS test machine.
3 Results and discussion
3.1 The effects of additives on compaction parameters
Soils that are transported to the fill site in a loose state undergo compaction at varying levels of compaction energy. This process increases their dry density, making them suitable for use in various construction applications, such as highways, railroads, embankments, and other structures. The Proctor compaction test, a common laboratory method, is used to determine the maximum dry density (γ kmax) and optimum water content (w opt). Standard Proctor compaction tests were performed for each admixture level to determine the w opt and γ kmax required for sample preparation. Figures 7 and 8 show the compaction curves and test parameters for different proportions of pure and stabilized soils.

Compaction curves of pure and stabilized soil specimens.

Compaction parameters for pure and stabilized soil specimens.
As shown in Figures 7 and 8, there is no significant change in the γ kmax values at the maximum amounts of silica fume and fly ash. There is a slight increase in the w opt. This can be attributed to the lower specific gravity of the silica fume compared to the soil, and thus the additional dispersion volume resulting from the lower specific gravity of the stabilizing samples and the reduced particle size. A reduction in the bilayer and consequent agglomeration of the grains resulted from the replacement of sodium cations in the dispersive soil by silicon cations in the silica fume. These results are consistent with the studies of [64],65].
Conversely, the inclusion of nano SiO2 resulted in more pronounced changes in all additive ratios. This resulted in a decrease in the γ kmax values, while the w opt values increased. This behavior is explained by the higher surface area of the nano SiO2 particles, which requires more water for adequate compaction, as supported by previous studies [66], [67], [68]. Furthermore, the addition of nanoclay powders, despite their increasing proportion, resulted in a decrease in the w opt due to their high surface area. These results are consistent with those of [69],70]. In addition, Bowles [71] found that the reduction in water content was due to a decrease in void volume within the soil matrix, which was observed with increasing nano SiO2 content. For conventional additions such as fly ash and silica fume, the γ kmax decreases, whereas for nanomaterials, the γ kmax increases with the addition of these materials, as shown in Figure 8. In the case of conventional materials, the decrease in γ kmax is due to the fact that the soil particles are coated with a mixture of compounds that form large particles with significant voids, resulting in a lower density [72]. The increase in γ kmax for nanomaterials is due to the fact that nanoparticles have a higher density than natural particles.
3.2 The stress-strain behavior and failure mechanism
Determining the stress-strain behavior of soils through UCS testing is important in many aspects such as strength capacity, stability analysis, material properties, design decisions, effectiveness of additives, and project safety. This test is a fundamental tool for understanding the engineering properties of soils and designing safe structures.
The UCS of the clay and stabilized soil specimens showed a maximum value for the specimens at the water content on the dry side of the Proctor curve and decreased as the water content increased to the wet side. Arabani and Haghsheno [73] and Mirzababaei et al. [74] reported a similar behavior with water content, while Patel and Singh [75] and Nataraj and McManis [76] found that the UCS initially increases and then decreases with increasing in water content. On the dry side, soil particles may be more densely compacted and therefore have a higher degree of compaction, resulting in greater internal friction due to increased contact points between particles, which increases the strength of the soil. In addition, soils on the dry side have a greater interlocking effect between particles due to the low water content. This interlocking effect can increase UCS values by increasing mechanical strength.
On the other hand, for powdered materials (such as nanoparticles or industrial waste powders), the interfacial force and frictional resistance are generated by filling the gaps between clay particles in the presence of additives, and the contact between additives and clay particles by wrapping the clay particles in fiber materials [77]. In general, frictional resistance and interfacial force decrease with increasing water content. This decrease is likely due to the decrease in soil suction with increasing water content and the potential for excess pore water pressure.
Figures 9 and 10 present the unconfined compressive strength (UCS) values and failure behavior of untreated clayey soil under axial loading, respectively. The UCS values of the untreated clayey soil were determined to be 310.365 kPa at water contents below the optimum, 261.537 kPa at the optimum water content, and 126.499 kPa at water contents above the optimum. The corresponding failure mode followed a swelling-type pattern, characterized by ductile deformation and pronounced bulging, which became increasingly prominent with higher water contents. These results highlight the sensitivity of clayey soils to water variation and the resulting reduction in particle interlock and strength at higher water levels.
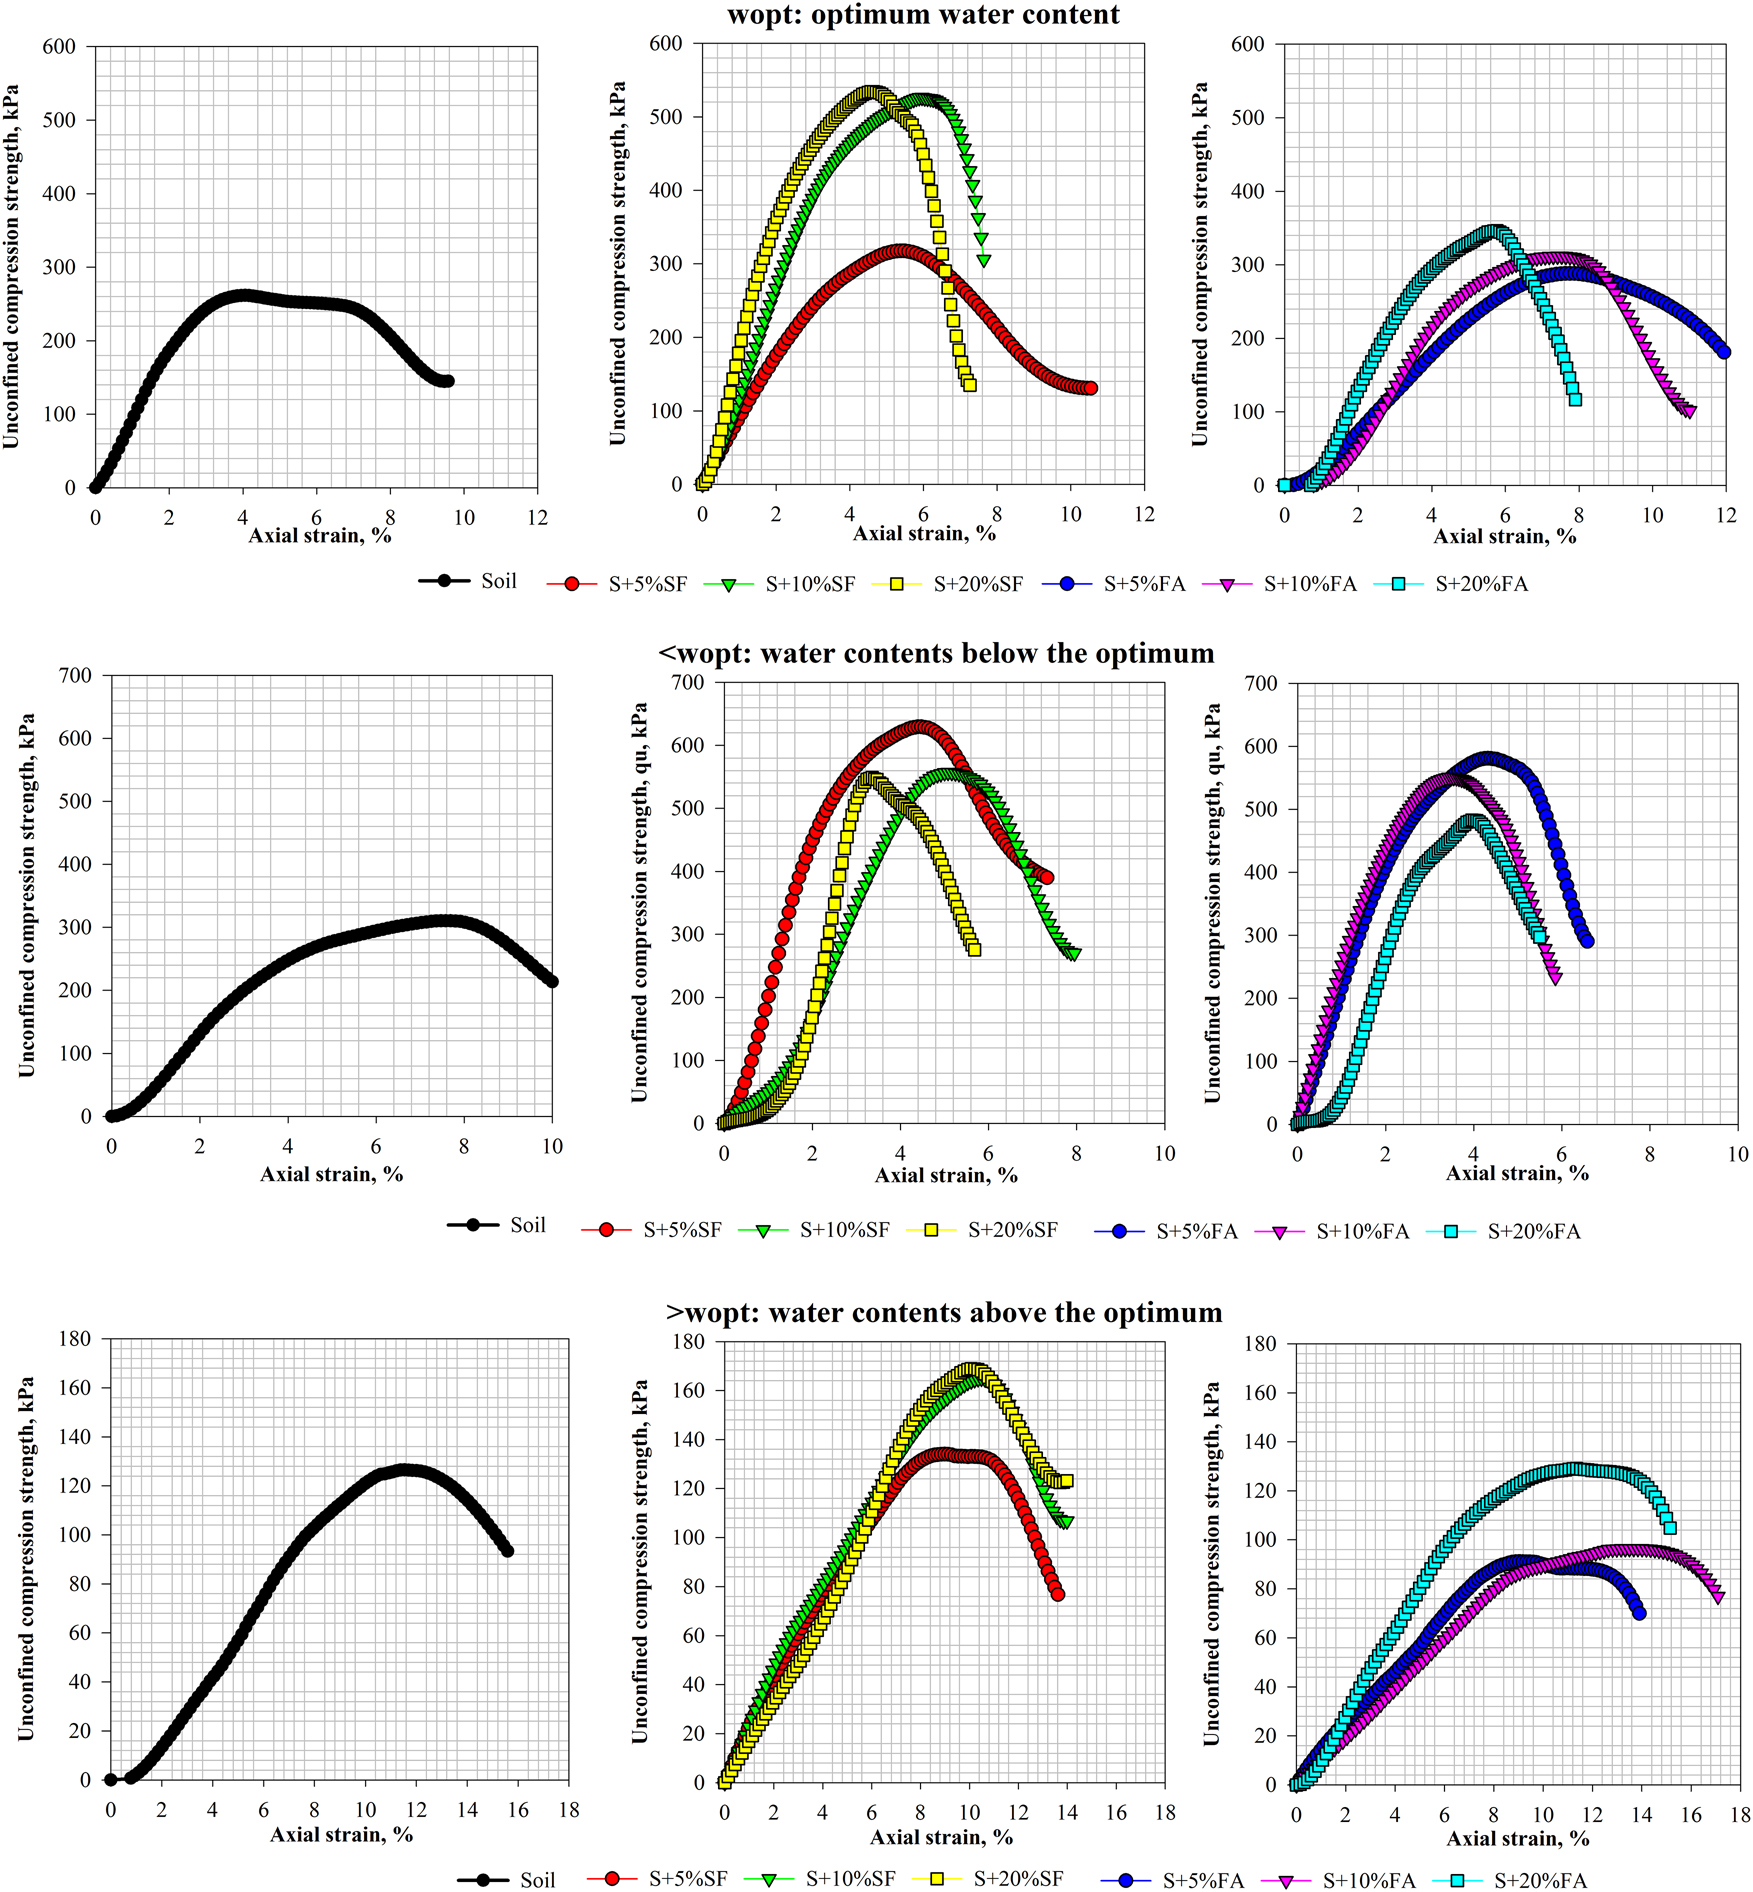
UCS behavior of soil specimens with different water contents and various proportions of silica fume and fly ash.
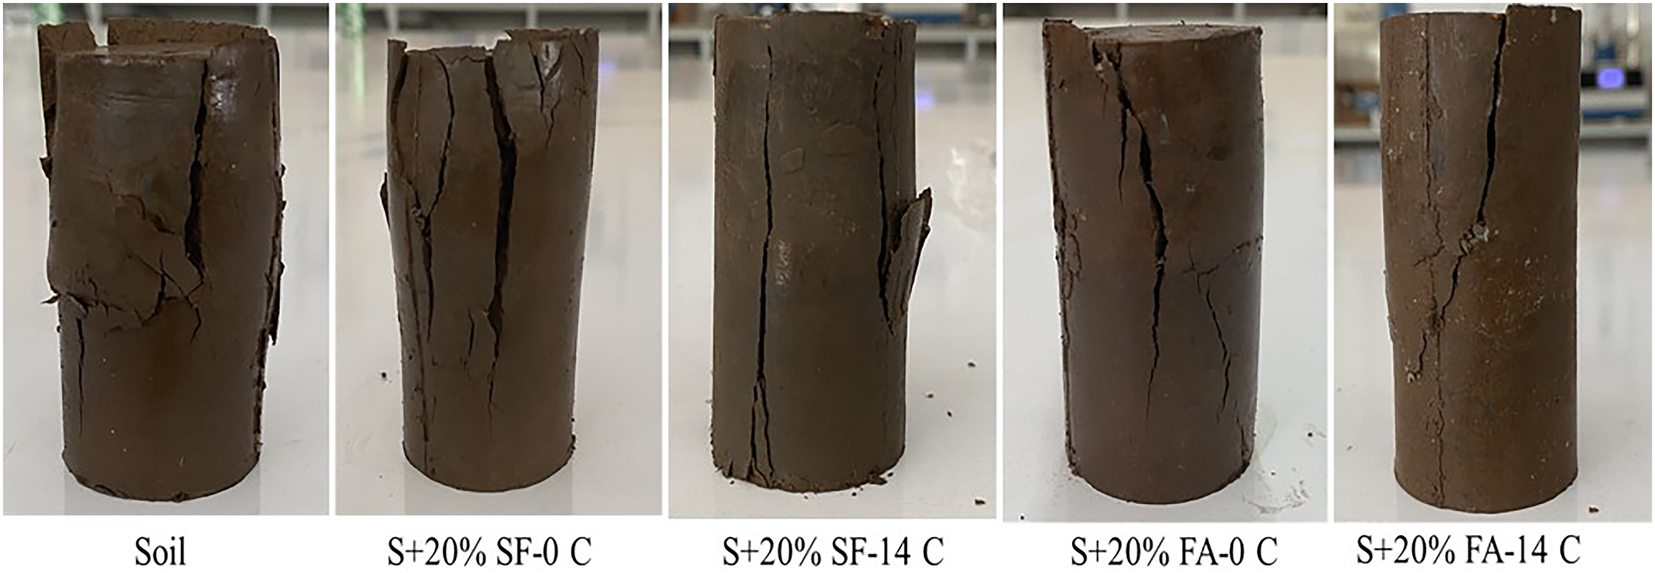
Failure patterns of soil specimens with varying ratios of silica fume (SF) and fly ash (FA) additives.
As shown in Figure 9, the stress-strain curves of the stabilized soil specimens with different proportions of silica fume and fly ash demonstrated a noticeably more brittle behavior, with higher UCS values reached at lower strain levels compared to untreated clay. This brittle behavior is supported by the failure modes observed in Figure 10, where silica fume and fly ash stabilized specimens failed predominantly by vertical shear cracks extending from the top to the bottom of the samples both before curing. The development of such vertical shear failure planes aligns with the higher stiffness and reduced ductility inferred from the UCS curves, illustrating that the soil structure becomes more prone to sudden fracture as strength increases.
The maximum increases in the stabilized soil specimens at the optimum water content were obtained at the maximum addition rates with an increase of 85.88 % and 26.74 % for silica fume and fly ash, respectively. The results are in agreement with the findings of Kumar et al. [78]. Sengul et al. [41] also reported UCS increases with fly ash additions, though noting strength reductions at higher contents due to incomplete pozzolanic reactions-factors which may explain the comparatively lower UCS improvements versus silica fume.
For silica fume stabilized specimens prepared at w opt and <wopt water contents, a rapid post-peak stress decrease was observed with increasing strain, reflecting the brittle failure mode noted above. Specimens with >w opt water content exhibited more strain hardening after peak stress, indicating some ductility increase due to higher water content. Fly ash stabilized specimens showed similar behaviors at w opt and >w opt water contents, exhibiting more elastic behavior than those at < w opt water content.
The fiber-reinforced clay soils exhibited a change in stress-strain behavior from strain softening to strain hardening (Figure 11), reflecting the influence of fibers on failure mechanisms. As shown in Figure 12, fiber-reinforced specimens at maximum blend ratios failed with a lateral cracking mode, especially pronounced in glass fiber reinforced samples. This lateral failure mode, as opposed to vertical shear in powdered additive specimens, indicates improved ductility and crack arresting ability, consistent with the tensile properties of fibers detailed in Table 2. Basalt fibers induced vertical cracking accompanied by specimen expansion under load, reflecting a somewhat stiffer but less ductile response compared to glass fibers. These results are consistent with the results of the study conducted by Orakoglu and Liu [79], Zhang et al. [80] and Rutzen et al. [81].

UCS behavior of soil specimens with different water contents and various proportions of glass fiber and basalt fiber.

Failure patterns of soil specimens with maximum ratios of glass (GF) and basalt (BF) fibers.
The increase in UCS became more pronounced as the amount of nano-SiO2 and nanoclay increased for all water contents. Figure 13 shows that increasing nano SiO2 and nanoclay content caused significant UCS improvements across all water contents, reaching increases of 78.89 % and 55.01 % at w opt, respectively. Correspondingly, failure modes transitioned from bulging or swelling typical of untreated clay to distinct shear fracture planes (Figure 14), evidencing a shift to more brittle and defined failure mechanisms. This change can be attributed to nanomaterials’ alteration of the particle contact structure, promoting stronger interparticle bonds and rearrangements under shear loading [82]. After 14 days curing, specimens with nano SiO2 and nanoclay exhibited compressive V-shaped failure patterns and, in some cases, drum-shaped plastic extrusion, reflecting increased stiffness and decreased ductility.

UCS behavior of soil specimens with different water contents and various proportions of nano SiO2 (NS) and nanoclay (NC).
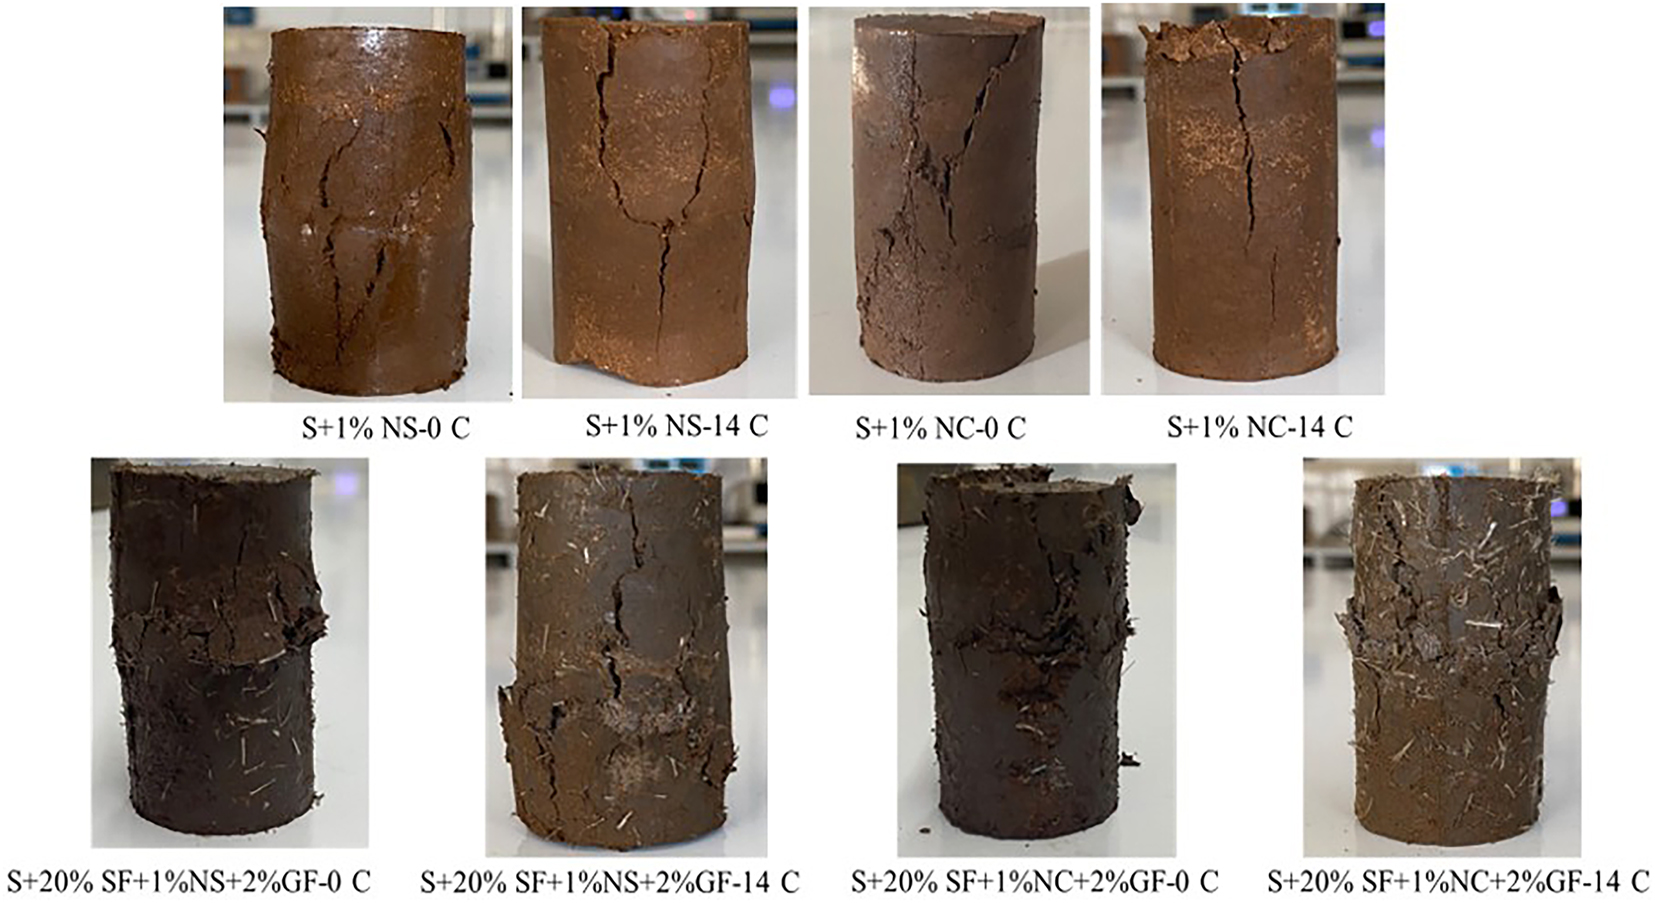
Failure patterns of soil specimens with varying ratios of nano SiO2 (NS) and nanoclay (NC).
On the other hand, the rate of increase was highest for the specimens with water content on the wet side of the Proctor curve. The reason for this increase is due to the absorption of excess water by nano-SiO2 and nanoclay, which makes the soil less compressible due to the reduction of water in the soil/nanoparticle mixtures, resulting in a further increase in qu strength at maximum nanoparticle content. The results of the studies are consistent with the results of the study conducted by Changizi and Haddad [83] and Khazaleh et al. [84]. On the other hand, the higher UCS values for specimens containing nano SiO2 and nanoclay after longer curing times indicate the importance of curing time in maximizing the benefits of these additives, confirming findings from several studies [85], [86], [87].
In addition, when the stress-strain curves were analyzed, the specimens containing nano-SiO2 generally showed a higher increase. Munda et al. [88] reported that the presence of siliceous or aluminous materials in the soil matrix or binder causes the development of cementitious and pozzolanic reactions, calcium silicate hydrate (C–S–H) and calcium aluminate silicate hydrate (C-A-S-H). They emphasized that the strength variation of stabilized soils is greatly influenced by the stabilizer components, especially calcium oxide (CaO). They also noted that the engineering properties of specimens reinforced with materials containing SiO2 and Al2O3 were significantly affected after longer curing times.
3.3 Curing effect on the UCS
UCS test results of silica fume and fly ash stabilized clay specimens prepared at different water contents are shown in Figure 15. In this study, for each curing period and mixture condition, three replicate UCS tests were performed, and the mean values are presented in the figures. The error bars in the graphs indicate the standard deviation of these triplicates. In this study, the results show a gradual increase in UCS of the clay with higher silica fume and fly ash contents and longer curing times. The increase in UCS of 14-day cured specimens containing silica fume and fly ash prepared at wopt was determined to be 208.28 % and 37.12 %, respectively. Silica fume showed better strength than fly ash with increasing curing time at all water contents. Silica fume significantly alters the internal structure of the specimen, resulting in increased strength. This change is due to the reactive silica in silica fume, which can chemically react with clay particles in an alkaline environment to form a binder [33], [89], [90], [91], [92], [93]. This chemical reaction is directly related to the observed increase in specimen strength [92], 94].

UCS versus curing time curve for silica fume and fly ash stabilized soil with error bars.
In addition, Figure 16 shows the UCS test results on stabilized clay specimens with nano SiO2 and nanoclay prepared at different water contents. The results show a steady increase in the UCS of the clay with increasing nano SiO2 and nanoclay contents and longer curing times. The UCS of 14-day cured specimens containing maximum nano SiO2 and nanoclay at optimum water content increased by 31.02 % and 72.12 %, respectively. Nanoclay showed better strength than nano SiO2 with increasing curing time despite increasing water content. Abbasi et al. [95] found in their study that the use of nanoclay as a stabilizer changes the soil structure from a disperse structure to a more flocculated and stable non-disperse structure. This means that the adhesion force between the soil particles and thus the strength is increased due to the interactions between the soil particles and the nanoclay in the presence of water.

UCS versus curing time curve for nano SiO2 and nanoclay stabilized soil with error bars.
To complement the experimental findings, an analysis of variance (ANOVA) was conducted to assess the statistical significance and relative impact of the selected parameters on unconfined compressive strength (UCS) and the results are presented in Table 5. The results indicated that water content was the most dominant factor influencing UCS, followed by curing time, silica fume (SF) content, nanoclay (NC) content, fly ash (FA) content, and nano-silica (NS) content. Specifically, water content and curing time exhibited exceptionally high F-values (71.09 and 90.58, respectively), with corresponding p-values well below 0.001, confirming their strong statistical significance. Among the additives, silica fume content demonstrated the most pronounced effect (F = 97.70, p < 0.0001), while nanoclay and fly ash also contributed significantly to strength development (p < 0.01). These findings underscore that although various additives enhance the mechanical behavior of clay, the magnitude of improvement is primarily governed by the water conditions during specimen preparation and the duration of curing.
ANOVA results showing the statistical significance of additive types, water content, and curing time on UCS.
| Source* | DF | F-value | P-value |
|---|---|---|---|
| FA | 3 | 4.2856 | 0.0054 |
| SF | 3 | 97.6987 | 1.3685 × 10−47 |
| NS | 3 | 3.2926 | 0.0206 |
| NC | 3 | 4.3165 | 0.0051 |
| w | 12 | 71.0901 | 9.2245 × 10−92 |
| ct | 3 | 90.5777 | 7.2447 × 10−45 |
-
*FA, fly ash; SF, silica fume; NS, nano-silika; NC, nanoclay; w, water content; ct, curing period.
3.4 The combined effect of silica fume-nanoparticles-glass fiber on UCS
The results showed that silica fume is a highly reactive compound that chemically reacts with clay particles to form binders that increase soil strength. Nanoparticles such as nano SiO2 and nanoclay make the internal structure of the soil more homogeneous and durable due to their large surface area and high reactivity. Glass fibers also increase the tensile strength of the soil and reduce the risk of cracking and deformation.
In this study, to investigate the effects of optimum ratios of silica fume-nanoSiO2 -glass fiber and silica fume-nanoclay-glass fiber combinations on the UCS of clay soils, hybrid mixtures prepared at optimum water contents were subjected to a series of UCS tests under different curing times. It was found that there was insufficient time for ion exchange and chemical reactions to increase the UCS at the end of the 3-day curing period for silica fume and nanomaterials, whose individual effects were discussed in the previous section. Since the effect of 3 days curing time on UCS was less than the longer curing times studied, it was concluded that 7 and 14 days curing times were sufficient to study the combined effects of the additives.
Figure 17 shows the effect of hybrid mixtures prepared at optimum water content for different curing times on UCS. With increasing strain, the axial stress increased rapidly and reached maximum peaks at strain rates of about 5 % for the hybrid mixtures prepared with both nanoparticles before curing. As the curing time increased, the maximum peaks were reached at strain rates between 2 % and 4 %. On the other hand, as shown in Figure 17, a significant increase in strength was observed for the specimens prepared with the optimum mixture ratios compared to the pure clay. This increase became more evident as the curing time was increased. Before curing, nano SiO2 and nanoclay admixtures increased the UCS strength by 87.15 % and 63.83 %, respectively, while these increases reached 317.50 % and 219.74 % at the end of the maximum curing periods. These results are in agreement with the findings of Jafari et al. [96]. In their study, the authors showed that the addition of nano-SiO2 and lime up to a certain level (1 % nano SiO2 and 7 % lime) to the mixture resulted in a significant improvement in small strain properties and strength. On the other hand, this study also showed similar results to the studies conducted by Kalhor et al. [97] and Liu et al. [98]. The researchers stated that the stress-strain curves showed a more brittle behavior with the addition of nano SiO2 to the clay. In addition, Tomar et al. [99] investigated the effect of adding both polypropylene fiber (PPF) and nano SiO2 to the soil on the UCS strength. It was found that the UCS increased with increasing fiber content and the maximum UCS value was obtained at 0.7 % PPF with 7 % nano SiO2. The authors stated that the bridging effect of the fiber reinforcement in the soil prevents the further development of tensile cracks, and that the mixing of the fiber with the soil acts as a reinforcing material to bind the soil particles. On the other hand, Arabani et al. [100] reported that the compressive strength of clay increased significantly with the addition of nanoclay and rice fiber to the kaolin. In the stress-strain analysis, they found that the soil behavior became more brittle with increasing nanoclay content because nanoclay and viscous gel formed more interlocking between solid soil particles; they stated that failure occurred at lower stress. The results of this study are consistent with those of Arabani et al. [100].

Effect of hybrid mixtures with different curing times on UCS.
As shown in Figure 17, the stress-strain curves of the clay samples stabilized with different additives showed a linear behavior up to the elastic limit and showed a nonlinear softening trend after the yield point. This behavior can be explained as follows:
The model describes the linear behavior of soil or similar materials in the elastic region:
where E is modulus of elasticity, ε y is elastic yield point.
The model describes the softening behavior of the material by a nonlinear function when the elastic limit is exceeded:
where A, B, C, D are model constants derived from experimental data and determined as a function of the UCS performance of the material used. Eq. (2) also explains the softening effect of stress in the plastic region and the decrease in strength of the material with increasing strain.
After substituting of A-D in Eq. (2), the strength is given by:
where R is a model parameter and is represented by:
In the model, the calculation is performed by considering three basic points in the stress-strain diagram: elastic yield point, peak point and ultimate point. The stress and strain in the elastic yield region are defined as σ y , ε y ; σ f , ε f at the peak point and σ u , ε u at the ultimate point, respectively. Es is the secant modulus at the peak point.
Statistical analysis was used to evaluate the accuracy of the model. To validate the UCS of stabilized soil with hybrid mixtures, root mean square error (RMSE), maximum relative error (MRE) and coefficient of determination (R2) were used to compare the tested and predicted data. The results of the analysis are shown in Table 5. The RMSE and MRE can be determined using Eqs. (5) and (6):
q fp is the predicted UCS value, q ft is the tested UCS value and n is the number of tested data.
For small RMSE and MRE values, the relationship between the predicted and tested values is strong for small differences.
The results showed that the model was able to simulate the UCS values of the stabilized soil samples with a good correlation in the range R2 = 0.9445 to 0.9927. R2 showed that the predicted and experimental results were in good agreement for both properties. According to the RMSE and MRE results, the relatively significant coefficients of determination showed a significant correlation between the model results and the experimental results. This was confirmed by the RMSE (in the range of 1.14 × 10⁻¹⁴–1.80 × 101) and MRE (in the range of 1.17 × 10⁻¹⁶–2.45 × 10⁻⁴).
The predicted RMSE and MRE results show good agreement with the tested values with small deviations. The lowest RMSE and MRE are S+20 % SF+1 % NS+2 % GF: 7-d and S+20 % SF+1 % NC+2 % GF: 14-d specimens. The model used provides a powerful mathematical framework for a detailed analysis of the UCS performance of soils. The distinction between elastic and plastic behavior is critical to in understanding the performance under load, especially in the stabilization of weak soils. When calibrated with experimental data, this model provides reliable and consistent results in geotechnical engineering applications. The model results are also in agreement with those obtained by Liu and Peng [101].
The stress-strain model developed in this study was calibrated using a subset of mixtures incorporating nano- and hybrid additives at different curing times. Although the fitting results show a good agreement with the experimental curves, the model parameters such as peak stress, modulus, and strain at failure are inherently material- and curing-dependent. Therefore, while the proposed framework can be extended to other stabilized soils, parameter recalibration is essential to capture the effects of different soil mineralogy, additive chemistry, and curing mechanisms. This indicates that the model has the potential for broader applicability, but its predictive capability outside the tested combinations should be considered with caution. Future work could focus on validating the model across a wider range of stabilization systems and loading conditions to assess its generalizability.
3.5 Energy absorption capacity (EAC)
The distinct advantage of the additives used in the study over alternative materials is their enhanced ability to fill voids and absorb energy when used as composites in engineering applications. The key metric for evaluating this enhancement is the cumulative mechanical energy absorbed per unit volume when the material is subjected to a specific strain threshold [102].
The energy absorption capacity of a material is assessed by the area under the stress-strain curve in a compression test or the load-deflection curve in a flexure test [103], 104]. In the present study, unconfined compression test curves were used to determine the energy absorption capacity of the specimens. For example, Figure 18 illustrates the calculation of the energy absorption capacity for the pure clay.
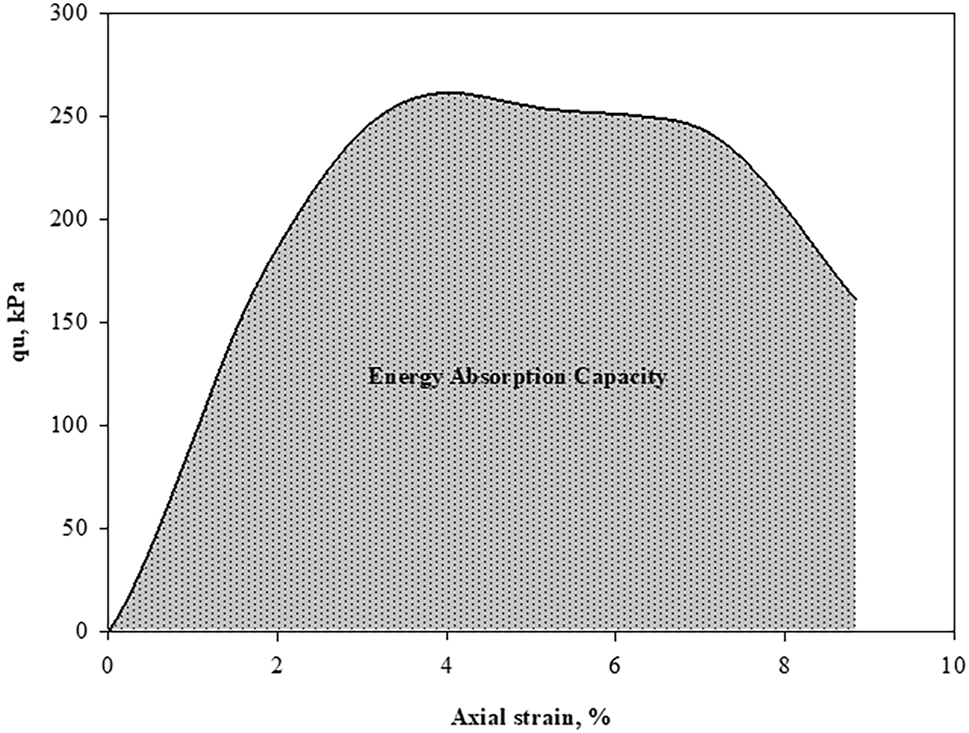
The calculation of the energy absorption capacity.
The effect of various additives on the EAC of clay soils is shown in Figure 19. In this graph, the red line represents the EAC value of the pure clay. While the EAC shows an increasing trend with the presence of hybrid mixtures, it shows higher values as the curing time is increased.

EAC of specimens with different additive combinations.
As a result, the EAC values increased as a function of the additives and this trend is more pronounced with increasing curing time. This increase is due to the increase in peak and ultimate stress. While the pre-cure EACs of the nanoclay blends were 7.86 % higher than those of the nano-SiO2 blends, the EACs of the nano SiO2 blends were 37.92 % and 6.66 % higher with increasing curing times (7 and 14 days), respectively.
This can be explained by the strengthening and densification of the bonding structure of nano SiO2 in the clay matrix. Extending the curing time allows the nano SiO2 particles to interact more effectively with the clay minerals, resulting in a more stable and dense structure. These interactions improve the mechanical properties of the material and increase its energy absorption capacity. In addition, the longer cure time allows microcracks in the material to heal and porosity to decrease, increasing the overall strength and toughness of the material. For these reasons, the energy absorption capacity of the nano SiO2 stabilized clays will be higher as the curing time is increased [97], [98], [99].
The increase in energy absorption capacity (EAC) is not only an indicator of improved strength and toughness but also has direct implications for geotechnical performance. Soils with higher EAC can dissipate and redistribute energy more effectively, which enhances their resilience under seismic and cyclic loading. This improved ability to delay crack initiation and stiffness degradation suggests that stabilized clays incorporating nano-SiO2 and hybrid additives may provide better performance in foundations, embankments, and retaining structures subjected to earthquake loading or traffic-induced vibrations.
3.6 SEM-based analysis of soil stabilization mechanisms
Figure 20 shows the SEM images of the specimens prepared with the best performing additives before and after 14 days of curing. Next to each SEM image are black and white shapes obtained using the image processing software ImageJ version 1.54f [105]. The black areas represent grains and the white areas represent voids. These figures show the average size and porosity values. In addition to the porosity and average pore size of selected mixtures before and after 14 days of curing obtained from ImageJ are summarized in Table 6.

SEM image processing steps using ImageJ (SEM images and pore information).
Model parameters and statistical analysis results.
| Sample | R | A | B | C | D | R2 | MRE | RMSE | |
|---|---|---|---|---|---|---|---|---|---|
| Max. | Min. | ||||||||
| S | 0.3065 | 1 | −0.0601 | 0.0235 | 0.0046 | 0.9705 | 2.28E-05 | 5.12 E+00 | 6.42E-04 |
| S+20 % SF+1 % NS +2 % GF: 0-d | 1.1628 | 1 | 0.1103 | −0.0390 | 0.0059 | 0.9860 | 2.45E-04 | 8.38 E+00 | 1.20E-02 |
| S+20 % SF+1 % NS +2 % GF: 7-d | 0.2109 | 1 | −0.2366 | 0.0941 | 0.0139 | 0.9857 | 1.17E-16 | 1.35 E+01 | 1.14E-14 |
| S+20 % SF+1 % NS +2 % GF: 14-d | 0.5336 | 1 | −0.1681 | −0.0195 | 0.0832 | 0.9927 | 2.29E-04 | 9.09 E+00 | 2.70E-02 |
| S+20 % SF+1 % NC +2 % GF: 0-d | −0.0335 | 1 | −0.1097 | 0.0340 | −0.0002 | 0.9907 | 9.89E-05 | 4.34 E+00 | 4.62E-03 |
| S+20 % SF+1 % NC +2 % GF: 7-d | 0.2598 | 1 | −0.2949 | 0.1076 | 0.0275 | 0.9445 | 3.84E-05 | 1.27 E+01 | 2.97E-03 |
| S+20 % SF+1 % NC +2 % GF: 14-d | −0.0066 | 1 | −0.4060 | 0.0945 | −0.0002 | 0.9822 | 1.36E-16 | 1.80 E+01 | 1.14E-14 |
Porosity and average pore size of soil mixtures before and after curing (ImageJ analysis).
| Sample | Curing period (day) | Porosity (%) | Average pore size (µm) |
|---|---|---|---|
| Clay soil | 0 | 5.94 | 57.44 |
| S+20 % SF | 0 | 4.92 | 42.03 |
| S+1 % NS | 0 | 2.30 | 51.36 |
| S+1 % NC | 0 | 1.32 | 52.37 |
| S+20 %S F+1%NC+2 % GF | 0 | 1.45 | 53.12 |
| S+20 % SF+1%NS+2 % GF | 0 | 0.97 | 53.97 |
| S+20 % SF | 14 | 2.85 | 15.33 |
| S+1 % NS | 14 | 1.05 | 19.79 |
| S+1 % NC | 14 | 0.33 | 20.46 |
| S+20 % SF+1%NC+2 % GF | 14 | 1.04 | 49.26 |
| S+20 % SF+1%NS+2 % GF | 14 | 1.63 | 31.48 |
The results show a clear reduction in both porosity and pore size with the addition of different additives and with curing (Table 7). For example, clay soil initially exhibited a porosity of 5.94 % and an average pore size of 57.44 µm. In contrast, specimens containing additives such as S+20 % SF+1 %NC+2 %GF showed substantially lower initial porosity (1.45 %) and pore size (53.12 µm), indicating the densifying effect of the additives even at day 0.
After 14 days of curing, this trend became more pronounced. The porosity of S+1 % NC reduced to 0.33 %, with an average pore size of 20.46 µm, while S+20 % SF+1 % NS+2 % GF exhibited a porosity of 1.63 % and a pore size of 31.48 µm. These reductions are significantly lower than the untreated clay, confirming the effectiveness of nano- and hybrid additives in filling voids and refining the pore structure.
The SEM image of the clay specimen examined in the study is plate-shaped. These plates are generally large in surface area and thin in thickness. The spaces between the plates show that it has a porous structure and water permeability. When the clay particles were stabilized with 20 % SF, it was observed that the micropores were filled and a more floc-like structure was dominant. A similar pattern was observed in the soil specimens stabilized with 1 % nanoclay. This leads to increased contact and adhesion between the clay particles, resulting in higher UCS values. These results are in agreement with the results of the study conducted by Ghavami et al. [106]. On the other hand, it is observed that the agglomeration phenomenon observed in silica fume is reduced in nano SiO2 stabilized structures because it has a denser structure.
After 14 days of curing, the prepared specimens showed both a reduction in porosity and a smoother structure in the SEM images. On the other hand, the texture of the soil specimens with nanoparticles was smoother and denser compared to the mixtures without nanoparticles. The addition of nanoclay densified the clay structure and eliminated even very small voids. The SEM images of the nano-based hybrid mixtures stabilized specimens show that the silica fume is deposited on the smaller sized nanoparticles, forming and growing clusters with nanoparticles as the core. SEM images of 0-day cured samples (e.g., S+20 % SF, S+1 % NS, and S+1 % NC) revealed that the particles were not fully bonded, the microstructure exhibited more pronounced voids (porosity), and the structures were looser. Conversely, the samples obtained after 14 days of curing (e.g., S+20 % SF + 1 % NS + 2 % GF) showed strengthened bonds between particles, a more compact matrix, and reduced porosity.
Furthermore, by the end of the 14-day curing period, the hydration products had developed better and the microstructure had become more homogeneous, especially in the samples containing nano-additives (NS and NC). This suggests that extending the curing time enables the binder materials to fully react, resulting in a more durable and dense structure. As a result, silica fume is a very fine-grained material with high pozzolanic properties. The fine particles of silica fume fill the gaps between the clay particles, making the soil structure firmer and more homogeneous. This reduces the porosity and water permeability of the soil. In addition, nano SiO2 and nano-clay interact more effectively with clay particles due to their large surface area and high reactivity. These interactions improve the mechanical properties of the soil by increasing the binding forces between the clay particles. In addition, the nanoparticles increase electrostatic attraction by creating positive charges on the surface of the clay particles. This helps to hold the clay particles closer together and increases the stability of the soil structure. The presence of glass fibers in the hybrid mixtures increases the bearing capacity and improves the tensile strength of the soil. The fibers protect the integrity of the soil structure by preventing the formation and propagation of cracks. It allows stresses to be distributed over a larger area. This prevents the formation of localized weaknesses and cracks.
3.7 The optimization process
To support and interpret the experimental findings further, an optimization approach was used to evaluate the influence and interact with various parameters on unconfined compressive strength. This analysis aims to determine the optimal combination of additive content and curing conditions to maximize strength performance.
In a design context, Grey Correlation Analysis (GCA) is used to evaluate the dimensional relationships between different parameters [107]. In this study, the relationship between industrial waste addition rates (Xw), fiber addition rates (Xf), and nanoparticles addition rates (Xn), experimental parameters such as cure time (ct) and water content (w), and unconfined compression strength (UCS) was investigated and optimal gradation rates were determined. The unconfined compressive strength (UCS) was designated as the reference sequence, and the other variables (Xw, Xf, Xn, ct, w) served as comparison sequences. To determine the gray relation order and gray relation degree, the following steps were implemented (presented in Figure 21 for a schematic flowchart of the procedure).
The reference sequences (f o(r)) and the comparison sequences (f i(r)) were denoted as:
The correlation coefficient was determined using Eq. (10).
where, the differentiation coefficient (ρ) is typically assigned a value in the range of 0–1 (ρ∈[0, 1]). In most cases, a value of 0.5 is chosen for ρ, as it provides an effective balance between stability and differentiation effects [107].
The degree of gray correlation (di) is calculated by Eq. (11):
In all optimization processes, the degree of proximity (|f 0(m)-f i (m)|) between the reference and comparison sequences was calculated using Eq. (5), and it has been shown that

A schematic flowchart of the grey correlation analysis (GCA).
Grey correlation analysis was performed to evaluate the effect of industrial waste additives (fly ash; X-FA, silica fume; X–SF), fiber additives (glass fiber; X-GF and basalt fiber; X–BF), nanoparticle materials additives (nano silica; XN-NS and nanoclay; XN-NC), curing time (ct) and water content (w) on the UCS behavior of the clay samples and the grey relational degrees and grey relational rankings are presented in Figure 22.

Optimization process.
As shown in Figure 22, the gray correlation order is X–SF > ct > X-GF > X–BF > X-FA > XN-NC > XN-NS > w for UCS. According to the results of Gray correlation analysis, the most effective parameters on unconfined compressive strength of clay samples were determined as silica fume (X–SF), curing time (ct), glass fiber (X-GF), basalt fiber (X–BF), fly ash (X-FA), nanoclay (XN-NC), nanosilica (XN-NS) and water content (w). Cure time (ct) was the factor that improved the clay/additive bonding mechanisms over time and increased strength the most. Silica fume (X–SF) and fly ash (X-FA) significantly increased strength by inducing pozzolanic reactions and creating a denser and more stable matrix in the clay structure. The fiber additives (X-GF and X–BF) imparted tensile strength to the specimens and prevented the formation of microcracks, thus showing a positive effect on the UCS. Among the nanomaterials, nanoclay (XN-NC) increased the surface area due to its small particle size and improved the strength by reducing the voids in the clay matrix. Although nano-silica (XN-NS) has more effective binding properties, its effect is lower compared to other additives, indicating the need to optimize the additive ratio and distribution. Water content (w) was identified as the parameter with the least influence on strength, because an appropriate amount of water is necessary for binding reactions, but excessive water can reduce strength. The results are consistent with the research of Ikeagwuani et al. (2020), who used Taguchi-based Gray correlation analysis to determine the most effective mixing ratios. Their study highlighted the importance of using Gray correlation analysis to determine optimal proportions, especially in experiments with many variables.
This ranking provides a comprehensive perspective on how the contribution of each parameter affects the UCS performance, providing guidance for optimal additive selection and mix design.
4 Conclusions
In this study, both individual and hybrid effects of industrial wastes (silica fume, fly ash), fibers (glass and basalt), and nanoparticles (nano SiO2, nanoclay) mixed with clay in different proportions were investigated in detail at the macro and micro levels at different water contents and curing times. The UCS tests were conducted to evaluate the mechanical behavior of the optimal additive proportions on clay soils. The study investigated the performance of stabilized clay soils at different curing times and water contents. The microstructure was analyzed by scanning electron microscopy (SEM). Grey correlation analysis was used to evaluate the effectiveness of additives in stabilizing clay soils. A model was developed to explain the stress-strain relationship of clays stabilized with nano-based hybrid materials. The results were as follows:
Compaction test results showed minimal change in γ kmax values with maximum addition of silica fume and fly ash. However, there was a slight increase in the w opt due to dispersion effects caused by the lower specific gravity of silica fume. Conversely, inclusion of nano SiO2 resulted in significant changes, decreasing the γ kmax values while increasing the w opt due to increased fines and water demand. Similar trends were observed for the nanoclay powders.
UCS test results indicated increased strength of clay soils with higher industrial addition rates at all water contents. Clay soil specimens exhibited maximum UCS values on the dry side of the Proctor curve, which was attributed to denser packing and increased interparticle bonding. Powdered materials such as nanoparticles filled gaps between clay particles, creating frictional resistance and interfacial force, resulting in increased strength. Prior to curing, the UCS strength increased by 87.15 % and 63.83 % with the addition of nano SiO2 and nanoclay, respectively. These increases escalated to 317.50 % and 219.74 %, respectively, by the end of the maximum cure periods.
Fiber-reinforced clay soils showed increased strength and changed stress-strain behavior from strain softening to strain hardening, with glass fibers showing more brittleness. Basalt fibers exhibited vertical cracking while glass fibers caused lateral failures. Nano SiO2 and nanoclay materials changed the failure mode from bulging to shear, reducing swelling behavior.
Longer curing times improved UCS values, especially for silica fume and nanomaterials, as chemical reactions and bonding structures increased strength. Combined effects of additives showed significant increases in UCS, with nano SiO2 and nanoclay blends showing notable improvements.
Overall, the SEM images corroborate the Gray correlation analysis by visually confirming the improved microstructure and reduced porosity produced by the most effective additives. These results underscore the importance of optimizing curing time, silica fume content, and nanomaterials to achieve maximum strength improvements, while utilizing fibers to improve tensile performance and crack resistance. This integrated understanding guides the design of more durable and stable clay-based composites.
EAC increased with the presence of additives, and curing times increased due to increases in peak and ultimate stress. SEM analysis revealed reduced porosity and softened structures in the presence of additives, particularly silica fume and nanoclay, resulting in denser soil structures.
This study has several limitations that should be acknowledged. Firstly, all experiments were conducted at the laboratory scale; therefore, the results should be considered as preliminary findings that require further validation under field conditions to assess their practical applicability. Scaling up the mixing and application processes may present challenges in ensuring homogeneous distribution of additives and consistent quality under variable site conditions. Secondly, microstructural analysis was limited to scanning electron microscopy (SEM). Although SEM provided insights into particle interactions and morphology, the absence of X-ray diffraction (XRD) and X-ray fluorescence (XRF) analyses due to equipment and resource constraints restricts a deeper understanding of the chemico-mineralogical changes in the stabilized soils. These techniques are essential for fully elucidating the stabilization mechanisms and are recommended for future studies. In addition, the long-term environmental durability of stabilized soils, particularly their resistance to weathering, freeze-thaw cycles, and groundwater interactions, remains to be investigated. Economic feasibility, including the costs of additive procurement, transportation, and implementation, also needs to be evaluated to confirm the sustainability and practicality of the proposed methods. Finally, the findings are based on a specific clay type and controlled curing conditions, which may limit their generalizability to other soil types or environmental conditions.
Funding source: Firat University (in Turkey) Science Research Projects (FUBAP)) (Project no.
Award Identifier / Grant number: TEKF.25.03
Award Identifier / Grant number: TEKF.23.52
-
Funding information: This study was supported by Firat University (in Turkey) Science Research Projects (FUBAP) (Project no. TEKF.23.52 and TEKF.25.03). We appreciate the financial assistance from FUBAP.
-
Author contribution: All authors have accepted responsibility for the entire content of this manuscript and approved its submission.
-
Conflict of interest: The authors state no conflict of interest.
-
Data availability statement: The datasets generated and/or analysed during the current study are available from the corresponding author on reasonable request.
References
1. Liu, S, Du, K, Wen, K, Armwood-Gordon, C, Li, Y, Navarro, I, et al.. Stabilization of expansive clayey soil through hydrogel for mechanical improvements. Int J Civ Eng 2023;21:1423–31. 219 2023 https://doi.org/10.1007/S40999-023-00835-3.Search in Google Scholar
2. Li, Y, Goh, A, Zhang, R, Zhang, W. Stability charts for undrained clay slopes considering soil anisotropic characteristics. Bull Eng Geol Environ 2023;82:52. 822 2023 https://doi.org/10.1007/S10064-023-03067-W.Search in Google Scholar
3. Wang, S, Zhang, Y, Liu, D, Yuan, P, Li, M, Du, P, et al.. Adsorption behaviors and atomistic mechanisms of iodate and iodide on hollow spherical allophane nanoparticles. Appl Clay Sci 2024;250:107293. https://doi.org/10.1016/J.CLAY.2024.107293.Search in Google Scholar
4. Luzu, B, Duc, M, Djerbi, A, Gautron, L. High performance illitic clay-based geopolymer: influence of thermal/mechanical activation on strength development. Appl Clay Sci 2024;258:107445. https://doi.org/10.1016/J.CLAY.2024.107445.Search in Google Scholar
5. Guo, P, Gong, X, Wang, Y, Lin, H, Zhao, Y. Analysis of observed performance of a deep excavation straddled by shallowly buried pressurized pipelines and underneath traversed by planned tunnels. Tunn Undergr Sp Technol 2023;132:104946. https://doi.org/10.1016/J.TUST.2022.104946.Search in Google Scholar
6. He, H, Wang, S, Shen, W, Zhang, W. The influence of pipe-jacking tunneling on deformation of existing tunnels in soft soils and the effectiveness of protection measures. Transp Geotech 2023;42:101061. https://doi.org/10.1016/J.TRGEO.2023.101061.Search in Google Scholar
7. Lodato, F, Colonna, N, Pennazza, G, Praticò, S, Santonico, M, Vollero, L, et al.. Analysis of the spatiotemporal urban expansion of the rome coastline through GEE and RF algorithm, using landsat imagery. ISPRS Int J Geo-information 2023, Vol 12, 2023;12. https://doi.org/10.3390/IJGI12040141.Search in Google Scholar
8. Zhang, Y, Zhang, Y, Wang, X, Zhu, H, Guo, C. Influence of soil parameter spatial variability on railway loess-filled embankment settlement. Bull Eng Geol Environ 2024;83:295. 837 2024 https://doi.org/10.1007/S10064-024-03797-5.Search in Google Scholar
9. Ukor, KP, Igwe, O, Onwuka, OS, Nzereogu, SK, Eze, KN, Echezona, PE. Integrated geotechnical and mineralogical evaluation of the subgrade of some failed pavements along enugu-onitsha expressway southeastern Nigeria. Sci Rep 2023;13:14001. 131 2023 https://doi.org/10.1038/s41598-023-41289-w.Search in Google Scholar PubMed PubMed Central
10. He, W, Ishikawa, T, Nguyen, BT. Effect evaluation of grass roots on mechanical properties of unsaturated coarse-grained soil. Transp Geotech 2023;38:100912. https://doi.org/10.1016/J.TRGEO.2022.100912.Search in Google Scholar
11. Narmandakh, D, Butscher, C, Doulati Ardejani, F, Yang, H, Nagel, T, Taherdangkoo, R. The use of feed-forward and cascade-forward neural networks to determine swelling potential of clayey soils. Comput Geotech 2023;157:105319. https://doi.org/10.1016/J.COMPGEO.2023.105319.Search in Google Scholar
12. Zhang, ZH, Chen, ML, Zhang, JX, Xi, BL, Yang, JQ. A novel creep-damage constitutive model of clay–gravel composite considering the effect of water content and saturation-undersaturation cycles and its engineering application. Bull Eng Geol Environ 2024 8310 2024;83:408. https://doi.org/10.1007/S10064-024-03910-8.Search in Google Scholar
13. Paprocki, J, Stark, N, Wadman, H. A framework for assessing the bearing capacity of sandy coastal soils from remotely sensed moisture contents. J Geotech Geoenviron Eng 2023;149:04023083. https://doi.org/10.1061/jggefk.gteng-11339.Search in Google Scholar
14. Ahmad, W, Uchimura, T, Ahmad, W, Uchimura, T. The effect of moisture content at compaction and grain size distribution on the shear strength of unsaturated soils. Sustain 2023, Vol 15, 2023;15. https://doi.org/10.3390/SU15065123.Search in Google Scholar
15. Ma, S, Yao, Y, Bao, P, Guo, C. Effects of moisture content on strength and compression properties of foundation soils of cultural relics in areas flooded by the yellow river. Front Mater 2023;10:1186750. https://doi.org/10.3389/FMATS.2023.1186750/BIBTEX.Search in Google Scholar
16. Liu, W, Huang, X, Feng, X, Xie, Z. Compaction and bearing characteristics of untreated and treated lateritic soils with varying moisture content. Constr Build Mater 2023;392:131893. https://doi.org/10.1016/J.CONBUILDMAT.2023.131893.Search in Google Scholar
17. Yang, X, Yang, Z, Zhang, X, Jiang, Y, Hou, G, Shao, X, et al.. Experimental study on the influences of water content, consolidation time, and soil conditioning on the adhesion of clay in EPB shields. Bull Eng Geol Environ 2022 8110 2022;81:426. https://doi.org/10.1007/S10064-022-02941-3.Search in Google Scholar
18. Patel, A. Geotechnical investigations and improvement of ground conditions. India: Matthew Deans; 2019.10.1016/B978-0-12-817048-9.00009-3Search in Google Scholar
19. Murmu, AL, Jain, A, Patel, A. Mechanical properties of alkali activated fly ash geopolymer stabilized expansive clay. KSCE J Civ Eng 2019;23:3875–88. https://doi.org/10.1007/s12205-019-2251-z.Search in Google Scholar
20. Murmu, AL, Dhole, N, Patel, A. Stabilisation of black cotton soil for subgrade application using fly ash geopolymer. Road Mater Pavement Des 2020;21:867–85. https://doi.org/10.1080/14680629.2018.1530131.Search in Google Scholar
21. Lai, HJ, Cui, MJ, Chu, J. Effect of pH on soil improvement using one-phase-low-pH MICP or EICP biocementation method. Acta Geotech 2022;18:3259–72. 186 2022 https://doi.org/10.1007/S11440-022-01759-3.Search in Google Scholar
22. Alimohammadi, H, Amirmojahedi, M, Tahat, JN. A case history of application of deep compaction method with comparison to different ground improvement techniques. Transp Infrastruct Geotechnol 2022;10:543–68. 104 2022 https://doi.org/10.1007/S40515-022-00229-3.Search in Google Scholar
23. Parik, P, Patra, NR. Effect of bio-enzyme on strength and microstructure of Banda clay soil, India. Int J Civ Eng 2022;21:135–48. 211 2022 https://doi.org/10.1007/S40999-022-00764-7.Search in Google Scholar
24. Zada, U, Jamal, A, Iqbal, M, Eldin, SM, Almoshaogeh, M, Bekkouche, SR, et al.. Recent advances in expansive soil stabilization using admixtures: current challenges and opportunities. Case Stud Constr Mater 2023;18:e01985. https://doi.org/10.1016/J.CSCM.2023.E01985.Search in Google Scholar
25. Bozyigit, I, Zingil, HO, Altun, S. Performance of eco-friendly polymers for soil stabilization and their resistance to freeze–thaw action. Constr Build Mater 2023;379:131133. https://doi.org/10.1016/J.CONBUILDMAT.2023.131133.Search in Google Scholar
26. Chaiyaput, S, Kotkhangphlu, P, Chao, KC, Chanin, C, Ayawanna, J. Microstructure investigation of soft clay after a vacuum PVD second improvement: a case study in Bangkok area Thailand. Bull Eng Geol Environ 2023;82:392. 8210 2023 https://doi.org/10.1007/S10064-023-03398-8.Search in Google Scholar
27. Kandalai, S, Patel, A. Alkali activation of red mud and GGBS blends for expansive soil stabilization: strength, durability and leachate studies. Indian Geotech J 2025;2025:1–26. https://doi.org/10.1007/S40098-025-01183-W.Search in Google Scholar
28. Anburuvel, A. The engineering behind soil stabilization with additives: a state-of-the-art review. Geotech Geol Eng 2023;42:1–42. 421 2023 https://doi.org/10.1007/S10706-023-02554-X.Search in Google Scholar
29. Driss, AAE, Harichane, K, Ghrici, M, Sert, S, Bol, E. Effect of natural pozzolana on the unconsolidated undrained shear strength of a lime-stabilized clay soil. Int J Civ Eng 2023;21:1007–26. 216 2023 https://doi.org/10.1007/S40999-023-00817-5.Search in Google Scholar
30. Lal Mohammadi, E, Khaksar Najafi, E, Zanganeh Ranjbar, P, Payan, M, Jamshidi Chenari, R, Fatahi, B. Recycling industrial alkaline solutions for soil stabilization by low-concentrated fly ash-based alkali cements. Constr Build Mater 2023;393:132083. https://doi.org/10.1016/J.CONBUILDMAT.2023.132083.Search in Google Scholar
31. Ramezani, SJ, Mohammad, Toufigh, M, Toufigh, V. Utilization of glass powder and silica fume in sugarcane bagasse ash-based geopolymer for soil stabilization. J Mater Civ Eng 2023;35:04023042. https://doi.org/10.1061/(ASCE)MT.1943-5533.0004704.Search in Google Scholar
32. Syamsul, M, Zaini, I, Hasan, M. Effect of optimum utilization of silica fume and lime on the stabilization of problematic soils. Int J Integr Eng 2023;15:352–66. https://doi.org/10.30880/ijie.2023.15.01.032.Search in Google Scholar
33. Zaini, MSI, Hasan, M, Almuaythir, S, Hyodo, M. Experimental investigations on physico-mechanical properties of kaolinite clay soil stabilized at optimum silica fume content using clamshell ash and lime. Sci Rep 2024;14:10995. 141 2024 https://doi.org/10.1038/s41598-024-61854-1.Search in Google Scholar PubMed PubMed Central
34. Ilman, B, Balkis, AP. Mechanical properties of clays stabilized with glass powder and silica fume. Int J Geosynth Gr Eng 2023;9:50. 94 2023 https://doi.org/10.1007/S40891-023-00463-W.Search in Google Scholar
35. Chiu, ACF, Mamoudou Ibrahim, M, Al-Ajamee, M, Mary, BM. Slope stability analysis of cement and silica fume stabilized expansive soil slope. IOP Conf Ser Earth Environ Sci 2024;1336:012002. https://doi.org/10.1088/1755-1315/1336/1/012002.Search in Google Scholar
36. Karami, H, Pooni, J, Robert, D, Costa, S, Li, J, Setunge, S. Use of secondary additives in fly ash based soil stabilization for soft subgrades. Transp Geotech 2021;29:100585. https://doi.org/10.1016/J.TRGEO.2021.100585.Search in Google Scholar
37. Sharma, V, Singh, S. Modeling for the use of waste materials (bottom ash and fly ash) in soil stabilization. Mater Today Proc 2020;33:1610–4. https://doi.org/10.1016/J.MATPR.2020.05.569.Search in Google Scholar
38. Sivrikaya, O, Uysal, F, Yorulmaz, A, Aydin, K. The efficiency of waste marble powder in the stabilization of fine-grained soils in terms of volume changes. Arab J Sci Eng 2020;C:8561–76. https://doi.org/10.1007/s13369-020-04768-0.Search in Google Scholar
39. Zhao, Y, Lu, Z, Zhang, R, Liu, J, Hu, C, Tabaroei, A, et al.. Combined utilization of slag, fly ash, and polyacrylamide for sustainable saline soil improvement: a win-win strategy. Bull Eng Geol Environ 2024;83:455. 8311 2024 https://doi.org/10.1007/S10064-024-03938-W.Search in Google Scholar
40. Murmu, AL, Patel, A. Studies on the properties of fly ash–rice husk ash-based geopolymer for use in black cotton soils. Int J Geosynth Gr Eng 2020;6:38. 63 2020 https://doi.org/10.1007/S40891-020-00224-Z.Search in Google Scholar
41. Sengul, T, Akray, N, Vitosoglu, Y. Investigating the effects of stabilization carried out using fly ash and polypropylene fiber on the properties of highway clay soils. Constr Build Mater 2023;400:132590. https://doi.org/10.1016/J.CONBUILDMAT.2023.132590.Search in Google Scholar
42. Al Bitar, M, Alhakim, G, Jaber, L. Using fly ash-plastic mesh bags wastes mixture as a recoverable resource for soil stabilization. Int J Geotech Eng 2024;18:316–31. https://doi.org/10.1080/19386362.2024.2345460.Search in Google Scholar
43. Firoozi, AA, Naji, M, Dithinde, M, Firoozi, AA. A review: influence of potential nanomaterials for civil engineering projects. Iran J Sci Technol Trans Civ Eng 2020;45:2057–68. 454 2020 https://doi.org/10.1007/S40996-020-00474-X.Search in Google Scholar
44. Zeng, L, Xiao, L, Zhang, J, Fu, H. The role of nanotechnology in subgrade and pavement engineering: a review. J Nanosci Nanotechnol 2020;20:4607–18. https://doi.org/10.1166/JNN.2020.18491.Search in Google Scholar PubMed
45. Behboudi, M, Zad, AA, Yazdi, M, Tohidi, A. Effect of cellulose nanofibers and recycled glass powder on the geotechnical and microstructural parameters of dispersive soil. Bull Eng Geol Environ 2024;83:290. 837 2024 https://doi.org/10.1007/S10064-024-03785-9.Search in Google Scholar
46. Samala, HR, Mir, BA. Some studies on microstructural behaviour and unconfined compressive strength of soft soil treated with SiO2 nanoparticles. Innov Infrastruct Solut 2020;5:34. 51 2020 https://doi.org/10.1007/S41062-020-0283-3.Search in Google Scholar
47. Thomas, G, Rangaswamy, K. Dynamic soil properties of nanoparticles and bioenzyme treated soft clay. Soil Dyn Earthq Eng 2020;137:106324. https://doi.org/10.1016/J.SOILDYN.2020.106324.Search in Google Scholar
48. Khodabandeh, MA, Nagy, G, Török, Á. Stabilization of collapsible soils with nanomaterials, fibers, polymers, industrial waste, and microbes: current trends. Constr Build Mater 2023;368:130463. https://doi.org/10.1016/J.CONBUILDMAT.2023.130463.Search in Google Scholar
49. Seiphoori, A, Zamanian, M. Improving mechanical behaviour of collapsible soils by grouting clay nanoparticles. Eng Geol 2022;298:106538. https://doi.org/10.1016/J.ENGGEO.2022.106538.Search in Google Scholar
50. Xu, X, Chu, H, Wang, Q, Li, J, Yuan, X, Niu, C, et al.. Dispersion, mechanical, hydrophysical properties and mechanistic analysis of improved dispersive soil using guar gum. Bull Eng Geol Environ 2025;84:56. 841 2025 https://doi.org/10.1007/S10064-024-04082-1.Search in Google Scholar
51. Zhang, G. Soil nanoparticles and their influence on engineering properties of. Soils 2007:1–13. https://doi.org/10.1061/40917(236)37.Search in Google Scholar
52. Tsao, T, Chen, Y, Sheu, H, Tzou, Y, Chou, Y, Wang, M. Separation and identification of soil nanoparticles by conventional and synchrotron X-ray diffraction. Appl Clay Sci 2013;85:1–7. https://doi.org/10.1016/J.CLAY.2013.09.005.Search in Google Scholar
53. Wang, J, Chen, G, Chen, Y, Ye, Z, Lin, M, Su, R, et al.. Intelligent mixture optimization for stabilized soil containing solid waste based on machine learning and evolutionary algorithms. Constr Build Mater 2024;445:137794. https://doi.org/10.1016/J.CONBUILDMAT.2024.137794.Search in Google Scholar
54. ASTM D6913/D6913M-17. Standard test methods for particle-size distribution (gradation) of soils using sieve analysis. Annu Book ASTM Stand 2009;04–9.Search in Google Scholar
55. ASTM International. ASTM D7928-16e1, standard test method for the particle-size distribution (gradation) of fine-grained soils using the sedimentation (hydrometer) analysis. West Conshohocken. PA: ASTM International; 2017.Search in Google Scholar
56. ASTM International. ASTM D854-02, standard test method for specific gravity of soil solids by water pycnometer. West Conshohocken. PA: ASTM International; 2017.Search in Google Scholar
57. ASTM International. ASTM D4318-10e1, standard test methods for liquid limit. plastic limit. and plasticity index of soils. West Conshohocken. PA: ASTM International; 2017.Search in Google Scholar
58. ASTM International. ASTM D698-00ae1, standard test methods for laboratory compaction characteristics of soil using standard effort (12.400 ft-lbf/ft3 (600 kN-m/m3)). West Conshohocken. PA: ASTM International; 2017.Search in Google Scholar
59. Tajaddini, A, Saberian, M, Kamalzadeh Sirchi, V, Li, J, Maqsood, T. Improvement of mechanical strength of low-plasticity clay soil using geopolymer-based materials synthesized from glass powder and copper slag. Case Stud Constr Mater 2023;18:e01820. https://doi.org/10.1016/J.CSCM.2022.E01820.Search in Google Scholar
60. Kannan, G, Sujatha, ER. Effect of nano additive on mechanical properties of natural fiber reinforced soil. J Nat Fibers 2023;20:2143980. https://doi.org/10.1080/15440478.2022.2143980.Search in Google Scholar
61. ASTM International. ASTM D2166. Standard test method for unconfined compressive strength of cohesive soil. West Conshohocken. PA: ASTM International; 2010.Search in Google Scholar
62. Baldin, CRB, Kawanami, MY, Costa, WGS, Bordignon, VR, Luz, CCda, Izzo, RLdos S. Mechanical properties of a clay soil reinforced with rice husk under drained and undrained conditions. J Rock Mech Geotech Eng 2023;15:2676–86. https://doi.org/10.1016/J.JRMGE.2023.02.022.Search in Google Scholar
63. Yarbaşı, N, Kalkan, E, Kartal, HO. The effect of curing time and temperature change on strength in high plasticity clay soils reinforced with waste egg shell powder. Geotech Geol Eng 2022;41:383–92. 411 2022 https://doi.org/10.1007/S10706-022-02289-1.Search in Google Scholar
64. Al-Azzawi, AA, Daud, KA, Sattar, MAA. Effect of silica fume addition on the behavior of silty-clayey soils. J Econ Sustain Dev 2012;16:92–105.Search in Google Scholar
65. Türköz, M, Umu, SU, Öztürk, O, Türköz, M, Umu, SU, Öztürk, O. Effect of silica fume as a waste material for sustainable environment on the stabilization and dynamic behavior of dispersive soil. Sustain 2021;13:13. https://doi.org/10.3390/SU13084321.Search in Google Scholar
66. Kumar, A, Baljit ;, Walia, S, Bajaj, A. Influence of fly ash, lime, and polyester fibers on compaction and strength properties of expansive soil. J Mater Civ Eng 2007;19:242–8. https://doi.org/10.1061/(ASCE)0899-1561(2007)19:3(242).10.1061/(ASCE)0899-1561(2007)19:3(242)Search in Google Scholar
67. Bazarbekova, A, Naik, SR, Kim, YR, Little, D, Jung, JS, Park, YB. One-part alkali-activated soil stabilization with sodium metasilicate: mechanical-geochemical-mineralogical characterization. Transp Geotech 2024;44:101163. https://doi.org/10.1016/J.TRGEO.2023.101163.Search in Google Scholar
68. Kannan, G, Sujatha, ER. Geotechnical behaviour of nano-silica stabilized organic soil. Geomech Eng 2022;28:239–53. https://doi.org/10.12989/GAE.2022.28.3.239.Search in Google Scholar
69. Taha, MR, Taha, OM. Crack control of landfill liner and cap materials using nano alumina powder. In: Mario, M, Andrea, D, Sebastiano, F, Guido, M, editors. Coupled Phenom. Environ. Geotech. London: CRC Press, Taylor & Francis Group; n.d.Search in Google Scholar
70. Tarsh, NM, Al-Neami, MA, Al-Soudany, K. Variation of consistency limits and compaction characteristics of clayey soil with nanomaterials. Eng Technol J 2021;39:1257–64. https://doi.org/10.30684/etj.v39i8.1930.Search in Google Scholar
71. Bowles, JE. Engineering properties of soils and their measurement. New York, USA: McGraw-Hill, Inc; 1992.Search in Google Scholar
72. Al-Neami, MA, Rahil, FH, Al-Ani, HY. Behavior of cohesive soil reinforced by polypropylene fiber. Eng Technol J 2020;38:801–12. Part A (2020).10.30684/etj.v38i6A.109Search in Google Scholar
73. Arabani, M, Haghsheno, H. The effect of water content on shear and compressive behavior of polymeric fiber-reinforced clay. SN Appl Sci 2020;2:1759. 211 2020 https://doi.org/10.1007/S42452-020-03568-3.Search in Google Scholar
74. Mirzababaei, M, Miraftab, M, Mohamed, M, McMahon, P. Unconfined compression strength of reinforced clays with carpet waste fibers. J Geotech Geoenviron Eng 2013;139:483–93. https://doi.org/10.1061/(ASCE)GT.1943-5606.0000792.Search in Google Scholar
75. Patel, SK, Singh, B. Strength and deformation behavior of fiber-reinforced cohesive soil under varying moisture and compaction states. Geotech Geol Eng 2017;35:1767–81. 354 2017 https://doi.org/10.1007/S10706-017-0207-Y.Search in Google Scholar
76. Nataraj, MS, McManis, KL. Strength and deformation properties of soils reinforced with fibrillated fibers. Geosynth Int 1997;4:65–79. https://doi.org/10.1680/GEIN.4.0089.Search in Google Scholar
77. Tang, C, Shi, B, Gao, W, Chen, F, Cai, Y. Strength and mechanical behavior of short polypropylene fiber reinforced and cement stabilized clayey soil. Geotext Geomembranes 2007;25:194–202. https://doi.org/10.1016/J.GEOTEXMEM.2006.11.002.Search in Google Scholar
78. Kumar, P, Dipti, C, Biswal, R, Chandra, U. Effect of moulding water content on strength characteristics of a cement - stabilized granular lateritic soil. Innov Infrastruct Solut 2021;6:1–10. https://doi.org/10.1007/s41062-020-00410-y.Search in Google Scholar
79. Orakoglu, ME, Liu, J. Effect of freeze-thaw cycles on triaxial strength properties of fiber-reinforced clayey soil. KSCE J Civ Eng 2017;21:2128–40. https://doi.org/10.1007/s12205-017-0960-8.Search in Google Scholar
80. Zhang, T, Wang, Cjin, Liu, Syu, Zhang, N, Zhang, Twei. Assessment of soil thermal conduction using artificial neural network models. Cold Reg Sci Technol 2020;169:102907. https://doi.org/10.1016/J.COLDREGIONS.2019.102907.Search in Google Scholar
81. Rutzen, M, Lauff, P, Niedermeier, R, Fischer, O, Raith, M, Grosse, CU, et al.. Influence of fiber alignment on pseudoductility and microcracking in a cementitious carbon fiber composite material. Mater Struct 2021;54:58. 542 2021 https://doi.org/10.1617/S11527-021-01649-2.Search in Google Scholar
82. Li, M, Ma, C, Sun, ZM, Yao, XY. Mechanical properties distribution of lime-fly ash solidified oil contaminated soil in a coastal environment. Eur J Environ Civ Eng 2022;26:3027–42. https://doi.org/10.1080/19648189.2020.1781695.Search in Google Scholar
83. Changizi, F, Haddad, A. Effect of Nano-SiO2 on the geotechnical properties of cohesive soil. Geotech Geol Eng 2015;34:725–33. 342 2015 https://doi.org/10.1007/S10706-015-9962-9.Search in Google Scholar
84. Khazaleh, MA, Karumanchi, M, Bellum, RR. Stabilization of soils with nanoclay subjected to freeze-thaw cycles. Nanotechnol Environ Eng 2022;8:237–51. 81 2022 https://doi.org/10.1007/S41204-022-00290-W.Search in Google Scholar
85. James, J, Sivapriya, SV, Ali, S, Madhu, TR, Singh, B. Wetting and drying resistance of lime-stabilized expansive soils modified with nano-alumina. Electron J Fac Civ Eng Osijek-e-GFOS 2021;12:70–80. https://doi.org/10.13167/2021.22.6.Search in Google Scholar
86. Mohammed, M, Rasidi, MSM, Mohammed, AM, Rahman, R, Osman, AF, Adam, T, et al.. Interfacial bonding mechanisms of natural fibre-matrix composites: an overview. BioResources 2022;17:7031–90. https://doi.org/10.15376/BIORES.17.4.MOHAMMED.Search in Google Scholar
87. Torabi-Kaveh, M, Heidari, A. Investigation of engineering characteristics of marly soils treated by lime and nanocomposite (case study: marly soil of sonqor region). Iran J Eng Geol Summer 2019;12.Search in Google Scholar
88. Munda, J, Ram, AK, Mohanty, S. Small-strain shear modulus and strength characteristics of clayey soil treated with Nano-SiO2 and fly ash. Int J Civ Eng 2023;21:1813–33. 2111 2023 https://doi.org/10.1007/S40999-023-00857-X.Search in Google Scholar
89. Tran, TQ, Ju, H, Nguyen, T-N, Hoang, TP, Abdelaziz, SL, Brand, AS. Effects of curing temperature on cement-stabilized soils. IOP Conf Ser Mater Sci Eng 2023;1289:012097. https://doi.org/10.1088/1757-899X/1289/1/012097.Search in Google Scholar
90. Banu, SA, Attom, MF, Banu, SA, Attom, MF. Effect of curing time on lime-stabilized sandy soil against internal erosion. Geosci 2023;13:13. https://doi.org/10.3390/GEOSCIENCES13040102.Search in Google Scholar
91. Ohadian, A, Khayat, N, Mokhberi, M, Horpibulsuk, S. Soft clay modified with municipal solid waste and stabilized with Nano-MgO for pavement subgrade and embankment fill applications. Transp Geotech 2024;46:101261. https://doi.org/10.1016/J.TRGEO.2024.101261.Search in Google Scholar
92. Ishak, MF, Zolkepli, MF, Yunus, MYM, Ali, N, Kassim, A, Zaini, MSI. Verification of tree induced suction with numerical model. Phys Chem Earth, Parts A/B/C 2021;121:102980. https://doi.org/10.1016/J.PCE.2021.102980.Search in Google Scholar
93. Zaini, MSI, Hasan, M, Pahang, M, Abdullah, A-S, Tun, P, Yaakob, K. Stabilization of expansive soil using silica fume and lime. Construction 2024;4:45–51. https://doi.org/10.15282/CONSTRUCTION.V4I1.10484.Search in Google Scholar
94. Goh, JR, Ishak, MF, Zaini, MSI, Zolkepli, MF. Stability analysis and improvement evaluation on residual soil slope: building cracked and slope failure. IOP Conf Ser Mater Sci Eng 2020;736:072017. https://doi.org/10.1088/1757-899X/736/7/072017.Search in Google Scholar
95. Abbasi, N, Farjad, A, Sepehri, S. The use of nanoclay particles for stabilization of dispersive clayey soils. Geotech Geol Eng 2017;36:327–35. 361 2017 https://doi.org/10.1007/S10706-017-0330-9.Search in Google Scholar
96. Jafari, SH, Lajevardi, SH, Sharifipour, M, Kamalian, M. Evaluation of small strain stiffness characteristics of soft clay treated with lime and nanosilica and correlation with UCS (qu). Bull Eng Geol Environ 2021;80:3163–75. 804 2021 https://doi.org/10.1007/S10064-021-02115-7.Search in Google Scholar
97. Kalhor, A, Ghazavi, M, Roustaei, M, Mirhosseini, SM. Influence of nano-SiO2 on geotechnical properties of fine soils subjected to freeze-thaw cycles. Cold Reg Sci Technol 2019;161:129–36. https://doi.org/10.1016/J.COLDREGIONS.2019.03.011.Search in Google Scholar
98. Liu, C, Zhang, Q, Zhao, C, Deng, L, Fang, Q. Assessment of strength development of soil stabilized with cement and nano SiO2. Constr Build Mater 2023;409:133889. https://doi.org/10.1016/J.CONBUILDMAT.2023.133889.Search in Google Scholar
99. Tomar, A, Sharma, T, Singh, S. Strength properties and durability of clay soil treated with mixture of nano silica and polypropylene fiber. Mater Today Proc 2020;26:3449–57. https://doi.org/10.1016/J.MATPR.2019.12.239.Search in Google Scholar
100. Arabani, M, Shalchian, MM, Majd Rahimabadi, M. The influence of rice fiber and nanoclay on mechanical properties and mechanisms of clayey soil stabilization. Constr Build Mater 2023;407:133542. https://doi.org/10.1016/J.CONBUILDMAT.2023.133542.Search in Google Scholar
101. Liu, Jkun, Peng, Lyun. Experimental study on the unconfined compression of a thawing soil. Cold Reg Sci Technol 2009;58:92–6. https://doi.org/10.1016/J.COLDREGIONS.2009.03.008.Search in Google Scholar
102. Shukla, SK. Basic description of fibre-reinforced soil. Fundamentals of fibre-reinforced soil engineering. Developments in geotechnical engineering. Singapore: Springer Nature; 2017:23–44 pp. https://doi.org/10.1007/978-981-10-3063-5_2.Search in Google Scholar
103. Khandani, FS, Atapour, H, Rad, MY, Khosh, B. An experimental study on the mechanical properties of underground mining backfill materials obtained from recycling of construction and demolition waste. Case Stud Constr Mater 2023;18:e02046. https://doi.org/10.1016/J.CSCM.2023.E02046.Search in Google Scholar
104. Zhao, Y, Soltani, A, Taheri, A, Karakus, M, Deng, A, Zhao, Y, et al.. Application of slag–cement and fly ash for strength development in cemented paste backfills. Miner 2019;9:2018–9. https://doi.org/10.3390/MIN9010022.Search in Google Scholar
105. Schneider, CA, Rasband, WS, Eliceiri, KW. NIH image to ImageJ: 25 years of image analysis. Nat Methods 2012;9:671–5. 97 2012 https://doi.org/10.1038/nmeth.2089.Search in Google Scholar PubMed PubMed Central
106. Ghavami, S, Farahani, B, Jahanbakhsh, H, Moghadas Nejad, F. Effects of silica fume and nano-Silica on the engineering properties of kaolinite clay. AUT J Civ Eng 2018;2:135–42. https://doi.org/10.22060/AJCE.2018.14203.5462.Search in Google Scholar
107. Julong, D. Introduction to grey system theory. J Grey Syst 1989;1:1–24.Search in Google Scholar
© 2026 the author(s), published by De Gruyter, Berlin/Boston
This work is licensed under the Creative Commons Attribution 4.0 International License.
Articles in the same Issue
- Research Articles
- A green and sustainable biocomposite materials: environmentally robust, high performance, low-cost materials for helicopter lighter structures
- Microstructural and UCS behavior of clay soils stabilized with hybrid nano-enhanced additives
- Optimization of microstructure and mechanical properties of microwave-sintered V/Ta/Re-doped tungsten heavy alloys
- Experimental and numerical study on the axial compression behavior of circular concrete columns confined by BFRP spirals and ties
- Effect of A-site calcium substitution on the energy storage and dielectric properties of ferroelectric barium titanate system
- Comparative analysis of aggregate gradation variation in porous asphalt mixtures under different compaction methods1
- Thermal and mechanical properties of bricks with integrated phase change and thermal insulation materials
- Nonlinear molecular weight dependency in polystyrene and its nanocomposites: deciphering anomalous gas permeation selectivity in water vapor-oxygen-hydrogen barrier systems
- ZnO nanophotocatalytic solution with antimicrobial potential toward drug-resistant microorganisms and effective decomposition of natural organic matter under UV light
- Review Articles
- Granite powder in concrete: a review on durability and microstructural properties
- Properties and applications of warm mix asphalt in the road construction industry: a comprehensive review and insights toward facilitating large-scale adoption
- Artificial Intelligence in the synthesis and application of advanced dental biomaterials: a narrative review of probabilities and challenges
- Recycled tire rubber as a fine aggregate replacement in sustainable concrete: a comprehensive review