A green sorptive extraction method (HiSorb-TD-GC-MS) for determining the extra virgin olive oil (EVOO) aroma profile
-
Panagiota Fella


Abstract
A headspace high sorptive extraction (HS-HiSorb) Thermal Desorption-Gas Chromatography-Mass Spectrometry (TD-GC-MS) method was developed and optimized for the determination of the volatile profile of extra virgin olive oil (EVOO). The HS-HiSorb extraction parameters of temperature, sample mass, stirring rate, and adsorption time were optimized by applying the one-factor-at-a-time (OFAT) approach. A total of 21 multi-varietal olive oil samples were collected from four different olive mills in Cyprus during the harvesting period 2020–2021. Seventy-six volatile organic compounds (VOCs) were identified and semi-quantified, belonging to several chemical categories such as hydrocarbons (31) three of which are terpenes, aldehydes (22), carboxylic acids (6), ketones (5), esters (4), alcohols (3), ethers (2), furans (2), and others (1). Aldehydes (40.20 %) and hydrocarbons (41.08 %) represented the main components of olive oil’s volatile profile. The overall concentrations of VOCs in the samples ranged from 8.73 to 39.81 mg/kg. The HiSorb-TD-GC-MS method was evaluated in terms of repeatability and linearity for selected VOCs. Repeatability was performed at three different concentrations (1, 10, and 100 ppbv), and the relative standard deviation (RSD) ranged from 2.21 to 15.86 %. The calibration curves of (E)-2-hexenal, 1-penten-3-one, nonanal, and hexanal were developed to evaluate the linearity range. The results were satisfactory, with the correlation coefficient (R2) greater than 0.98. Finally, the limitations of the method are mentioned and discussed.
Introduction
The International olive oil council (IOOC) defines virgin olive oil (VOO) as the oil obtained from the fruits of the olive tree (Olea europaea L.) exclusively by mechanical or other natural methods that does not alter and has not undergone any treatment other than washing, decantation, centrifugation, and filtration [1]. The corresponding physicochemical and organoleptic characteristics are the main criteria for olive oil classification per quality category, based on the related official standards [2].
Extra virgin olive oil (EVOO) is the highest quality category of olive oil and is considered the most popular vegetable oil consumed in the world due to its pleasant flavour and aroma, as well as its beneficial properties to health. Olive oil quality as defined by IOOC depends on its physicochemical characteristics that include free fatty acid (FFA) content, peroxide value (PV), UV specific extinction coefficients (K232 and K270), as well as its sensory properties. The latter properties are due to volatile organic compounds (VOCs), but also to phenolic compounds and other molecules. At the same time, VOCs mainly affect the aroma. According to Directive 2010/75/EU “VOC is any organic compound having an initial boiling point less than or equal to 250 °C measured at a standard atmospheric pressure of 101.3 kPa” [3]. VOCs reach the olfactory epithelium through inhaled air and bind to specific proteins of the olfactory receptors, creating the sense of smell [4].
According to previous studies, the volatile profile of olive oil consists of a wide variety of compounds such as aldehydes, alcohols, esters, hydrocarbons, ketones, furans, terpenes, ethers, and other compounds. The aliphatic C6 and C5 compounds are produced from the lipoxygenase (LOX) pathway, which is the main biochemical pathway that contributes to the formation of the most important VOCs and leads to the oxidation of polyunsaturated acid through a series of enzymatic reactions [5], [6], [7]. Other sources of VOCs are originating by oxidation and microbial activities.
The large number of VOCs in olive oil, their variation in concentration (from μg/kg to mg/kg), as well as their categories, constitute olive oil a complex matrix [8]. The analytical procedure for the determination of olive oil's volatile profile includes sample preparation for the extraction and preconcentration of VOCs, their analytical separation, identification, and quantification. Sample preparation plays an important role in the precision and accuracy of results, as well as the time and cost of the analysis.
Several techniques have been developed for studying the flavor profiles of foods and beverages. However, interest in the volatile fraction of olive oil remains high. Towards this, a comprehensive review summarized the current knowledge on virgin olive oil VOCs (e.g., composition, characteristics, interaction, analytical methods), as well as the related aspects of quality and authenticity [9]. Solid-phase microextraction (SPME) is considered the first miniaturised non-exhaustive sample extraction technique. Simplicity, high speed, versatility of use (direct immersion (DI) or headspace (HS)), solventless, and the fact that it combines simultaneous extraction, preconcentration, and sampling in a single step are the main reasons that constitute SPME as the dominant extraction technique for VOC analysis [10]. HS-SPME has been applied in several studies in combination with gas chromatography (GC) for separation and mass spectrometry (MS) for identification [11], [12], [13], [14], [15], [16]. Dynamic headspace (DHS) in combination with Thermal Desorption (TD-GC-MS) is another analytical method for the detection of VOCs from olive oil [17], [18], [19]. In DHS extraction, the continuous flow of inert gas through or over the sample enables VOCs to be adsorbed into a sorbent tube. Then, the tube is thermally desorbed, and the analytes are driven through a GC column for separation [10]. Table 1 presents the most widely applied analytical methods for the analysis of VOCs in olive oil samples. In particular, as presented in Table 1, different mass analyzers have been employed, including quadrupole (Q), ion trap (IT), and time of flight (TOF).
GC-MS methods for the analysis of VOCs in olive oil samples.
| Samples | Extraction technique | Analytical instrumentation | Column | Quantification | References |
|---|---|---|---|---|---|
| EVOOs (n = 43) (i) Monovarietal (ii) Commercial from different areas of Italy |
HS-SPME | GC-Q-MS | VF-wax (30 m × 0.25 mm, 0.25 µm) | Internal standard (IS) (menthol) | [11] |
| GC × GC-TOF-MS | 1D: VF-wax (30 m × 0.25 mm, 0.25 µm) 2D: RTX-200MS (1.50 m × 0.25 mm, 0.25 µm) |
||||
| EVOOs (n = 9) from Morocco (variety: Arbequina, Arbosana, Koroneiki) | HS-SPME | GC-Q-MS | DB-wax (30 m × 0.25 mm, 0.25 μm) | % Peak area | [12] |
| EVOOs (n = 82) from seven different EU and non-EU countries: Croatia, Slovenia, Spain, Italy, Greece, Morocco and Turkey | HS-SPME | GC-IT-MS | Supelcowax-10 (60 m × 0.25 mm, 0.25 μm) | IS (indene) | [13] |
| EVOOs (n = 600) and VOOs (n = 617) from Spain, Greece, Portugal, Tunisia and other countries | HS-SPME | GC-Q-MS | HP-innowax (50 m × 0.2 mm, 0.4 μm) | Calibration curves and IS: (acetic acid-2,2,2-d3, 6-chloro-2-hexanone, butanol-d10, 4-methyl-2-pentanol, 3-octanone, ethyl acetate-d8, 3,4-dimethylphenol, toluene-d8, trimethylacetaldehyde | [14] |
| Monovarietal VOOs from dalmatia region in Croatia 4 different varieties: Oblica, Lastovka, Levantinka and Krvavica |
HS-SPME | GC-IT-MS | Rtx-WAX (60 m × 0.25 mm, 0.25 μm) | % Peak area | [15] |
| EVOOs (n = 19) of different varieties from 3 locations in Brazil | HS-SPME | GC-Q-MS | Rtx-5MS (30 m × 0.25 mm, 0.25 μm) | Calibration curves, IS (4-methyl-2-pentanone and 1-octanol) | [16] |
| EVOOs (n = 3) from Galicia in Spain | DHS | TD-GC-IT-MS | ZB-WAX (60 m × 0.32 mm, 0.50 μm) | IS (2-octanol) | [17] |
| EVOOs (n = 25) from different locations in Italy | DHS | TD-GC-Q-MS | Mega (50 m × 0.32 mm, 3 μm) | IS (isooctane) | [18] |
| EVOOs (n = 18), VOOs (n = 48), lampante olive oil (n = 19), unknown quality (n = 21) of different varieties in Italy | DHS | TD-GC-Q-MS | Supelcowax-10 (30 m × 0.25 mm, 0.25 μm) | IS (toluene-d8) | [19] |
| EVOOs (n = 2) from Spain, varieties Picual and Hojiblanca | TF-SPME | TD-GC-Q-MS | CPWax-57CB (50 m × 0.25 mm, 0.20 μm) | Peak area | [20] |
The need for green chemistry continues to grow due to the rise of environmental problems; therefore the development of greener and more sensitive miniaturized sample preparation techniques is necessary. In 2003, based on the same principle as SPME a novel device was introduced, called thin film-solid phase microextraction (TF-SPME). The adsorption of VOCs takes place in a thin film, which consists of a carbon mesh sheet that is impregnated with the adsorbent phase (originally Polydimethylsiloxane (PDMS)). TF-SPME has a larger adsorbent surface area than HS-SPME and allows for increased extraction efficiency and enhanced sensitivity. The latter extraction technique was applied to the determination of olive oil VOCs [20]. In 2016, another green and labour-saving extraction technique was launched by Markes International Ltd (Llantrisant, UK) and called HiSorb™. HiSorb sorptive extraction probe consists of a stainless-steel metal rod, coated with a short sleeve of sorbent phase. Sampling with HiSorb probe can be either performed to the HS of the sample or DI. At the end of sampling, the HiSorb module is placed in an empty sorbent tube and inserted into the TD unit, where the analytes are thermally desorbed to the cryo trap and then to the GC column (TD-GC-MS). Compared to SPME, the HiSorb™ extraction technique shows increased sensitivity, due to the larger volume and surface area of the sorbent phase. At the same time, the metal design of the HiSorb carrier makes it more robust, compared to the fragile fiber. The whole extraction process can become even fully automated using the Centri™ commercial robotic system. Furthermore, through the multi-step enrichment (MSE) process, which allows multiple extracts to be preconcentrated in the cryofocus trap prior to analysis, extraction efficiency is increased due to the greater number of analytes driven onto the column. Thus, the sensitivity and the number of compounds detected is increased. To date, only a small number of articles have been published applying the HiSorb™ technique for VOCs analysis in food matrices such as milk powder [21]. According to our knowledge, a study focused on the aroma profile of olive oil using HiSorb extraction is still missing.
Although Cyprus is a traditional olive oil producer country, there are no studies on the aroma profile of Cyprus olive oil. Therefore, the aim of the present study was the development of an HS-HiSorb-TD-GC-MS method for the analysis and characterisation of Cyprus origin olive oil derived from different olive mills. The parameters of extraction temperature, sample mass, stirring rate, and sampling time were investigated. The optimized method was then applied for the analysis of 21 olive oil samples from different regions of Cyprus.
Experimental section
Chemicals and standard solutions
Six chemicals were selected for method development and validation based on the availability of standards and the occurrence of molecules in the samples: 1-penten-3-one, hexanal, (E)-2-hexenal, nonanal, octanal, and hexanoic acid (Sigma Aldrich, USA). The standard solutions were prepared in methanol (LC/MS grade, Carlo Erba) at different concentration levels. In addition, two internal standards (IS) were used at a concentration of 2000 μg/mL each; 4-methyl-2-pentanone (>99 %, Fluka Chemica) and chlorobenzene-d5 (Supelco).
Samples
A total of 21 multi-varietal olive oil samples, produced during the harvesting year 2020–2021, were supplied from four different olive mills (three phase centrifugation system) of Cyprus. Table 2 provides more detailed information about the sample’s origin. The samples were stored in amber glass vials at −20 °C and headspace was filled with nitrogen gas (N2, 99.999 % Linde) to avoid potential sample oxidation by the atmosphere until their analysis.
Olive oil samples and their origin.
| Α/Α | Sample code | Production date | Orchard location/district | Code of olive mill/location |
|---|---|---|---|---|
| 1 | Ο1 | 9/11/2020 | Athalassa/Nicosia | Α1/Nicosia |
| 2 | Ο2 | 9/11/2020 | Aglantzia/Nicosia | |
| 3 | Ο3 | 9/11/2020 | Mathiatis/Nicosia | |
| 4 | Ο4 | 9/11/2020 | Latsia/Nicosia | |
| 5 | Ο5 | 9/11/2020 | Athienou/Larnaca | |
| 6 | Ο6 | 16/9/2020 | Kalo Chorio/Larnaca | Α2/Larnaca |
| 7 | Ο7 | 16/9/2020 | Anafotia/Larnaca | |
| 8 | Ο8 | 16/9/2020 | Klavdia/Larnaca | |
| 9 | Ο9 | 16/9/2020 | Kalo Chorio/Larnaca | |
| 10 | Ο10 | 16/9/2020 | Avgorou/Ammochostos | |
| 11 | Ο11 | 8/11/2020 | Mazotos/Larnaca | Α3/Larnaca |
| 12 | Ο12 | 20/12/2020 | Mosfiloti/Larnaca | |
| 13 | Ο13 | 20/12/2020 | Lefkara/Larnaca | |
| 14 | Ο14 | 30/12/2020 | Filousa and Kelokedara/Pafos | Α4/Limassol |
| 15 | Ο15 | 30/12/2020 | Ipsonas/Limassol | |
| 16 | Ο16 | 30/12/2020 | Letimpou/Pafos | |
| 17 | Ο17 | 30/12/2020 | Kivides/Limassol | |
| 18 | Ο18 | 30/12/2020 | Ipsonas/Limassol | |
| 19 | Ο19 | 30/12/2020 | Agios Nikolaos/Pafos | |
| 20 | Ο20 | 30/12/2020 | Apesia/Limassol | |
| 21 | Ο21 | 30/12/2020 | Ipsonas/Limassol |
Optimization of HS-HiSorb extraction
The design of the experiment followed the one-factor-at-a-time (OFAT) approach. In particular, the effect of four crucial extraction parameters was investigated to optimise the HS-HiSorb sampling extraction technique. One variable was investigated each time, while the other parameters remained constant. Extraction temperature was studied in the range of 25–60 °C (25, 40, and 60 °C) and optimised considering both desirable and undesirable VOCs. Also, the effect of sample mass was investigated (2.5, and 5 g) to reveal the potential saturation effect. Furthermore, the stirring rate of the sample was examined (0, 200, 400, and 800 rpm). Finally, four different sampling times (30, 60, 90, and 120 min) of the HiSorb probe were tested to evaluate the effect of adsorption time on the extraction of VOCs. The total peak area and the number of detected VOCs were used for the selection of the optimised parameters. Back in time (2016–2017), the only commercially available HiSorb probe was coated with PDMS (Markes International Ltd., UK).
Sample preparation
The samples were defrosted at ambient temperature in a dark place. The procedure for the sample preparation was as follows: 2.5 g of each olive oil sample were weighed into a 20 mL headspace glass vial (Agilent). Internal standard (IS) solutions of chlorobenze-d5 (Sigma-Aldrich) and 4-methyl-2-pentanone (Fluka Chemika) at 2000 μg/mL in methanol were added (2 and 1 μL, respectively) to each sample to monitor the performance of preparation, extraction, and analytical procedures. The sample was sealed with a HiSorb septum, capped, and placed in the dark for 24 h to equilibrate.
Headspace-high capacity sorptive extraction (HS-HiSorb)
The sample was vortexed for 3 min and pre-incubated in a water bath maintained at 40 °C under magnetic stirring at 800 rpm for 15 min prior to the extraction process. A HiSorb probe (Markes International Ltd., UK) comprised of a 75 mm PDMS inert-coated stainless steel rod with 65 μL sorptive phase was applied for headspace sampling. The sampling was performed under magnetic stirring at 800 rpm and 40 °C for 2 h. As recommended by the manufacturer, the HiSorb probes were preconditioned before use by heating at 260 °C for 25 min with a flow rate of helium at 75 mL/min in the UNITY-xr Thermal Desorption system (Markes International Ltd., UK).
Thermal desorption-gas chromatography-mass spectrometry (TD-GC-MS) analysis
Thermal desorption
The HiSorb probe was then placed into a clean, empty TD tube (Markes International Ltd., UK) and desorbed using the TD unit. The parameters of TD-GC-MS are listed in Table 3. The analysis of VOCs was performed in an Agilent GC-7890B coupled to quadrupole mass spectrometer MSD-5977B (Agilent Technologies, USA). The separation of compounds was carried out on an SPB™-624 (60 m × 250 μm, 1.4 μm film thickness) capillary column with cyanopropylmethyl phenylmethyl polysiloxane stationary phase (Supelco). Helium (99.999 %, Linde) was used as carrier gas at a flow rate of 1.7 mL/min. The oven temperature was held at 35 °C for 5 min, then increased to 180 °C at 4 °C/min and remained for 20 min. The overall GC run time was 61.25 min. The temperatures of MS transfer line, quadrupole, ion source were set at 250, 150, 230 °C, respectively. The electron impact was 70 eV and the scan range was set at 35–350 atomic mass units (amu) in full scan mode. Each sample was analysed in triplicate.
TD-GC-MS operating parameters.
| Operating step | Parameter | Value (units) |
|---|---|---|
| Pre-desorption | Dry purge time | 3 min |
| Split ratio | Splitless | |
| Purge flow | 50 mL/min | |
| Tube desorption | Split ratio | Splitless |
| Time | 10 min | |
| Temperature | 250 °C | |
| Flow rate | 50 mL/min | |
| Cold trap settings | Cryotrap | General type (graphitized carbon) |
| Trap flow | 40 mL/min | |
| Trap purge time | 1 min | |
| Low temperature | −10 °C | |
| Injection | Trap desorb time | 3 min |
| High temperature | 320 °C | |
| Carrier gas | He | |
| Split ratio | Splitless |
Qualitative and quantitative analysis
The identification of compounds was based both on validated and putative levels (mass spectra matching against the library spectra database of NIST20 with a minimum matching factor over 80 %). The VOCs were semi-quantified by normalised the peak area of each compound in respect to the area of internal standard (4-methy-2-pentanone). The concentration of compounds was calculated according to Equation (1) and expressed in micrograms per kg (mg/kg) equivalent of 2-methyl-4-pentanone:
whereas,
Evaluation of the HS-HiSorb-TD-GC-MS method
Repeatability
The repeatability of the HS-Hisorb-TD-GC-MS method was evaluated for six VOCs: 1-penten-3-one, hexanal, (E)-2-hexenal, octanal, hexanoic acid, and nonanal, at three different concentrations (1, 10, and 100 ppbv). Octanal, hexanoic acid, and nonanal were prepared only at 100 ppbv. Therefore, a mixture of analytical standards was prepared by adding equal amounts of compounds diluted in methanol. For each concentration level, five replicates of the analytical standards of the mixture were performed within the same day (intra-day), and the relative standard deviation (RSD) (%) was calculated for each of the 6 analytes.
Calibration curves
The calibration curves of 1-penten-3-one, hexanal, (E)-2-hexenal, and nonanal were developed to evaluate the optimized HiSorb-TD-GC-MS method. Towards this, different amounts of VOC standard solution (prepared in methanol) was added in an empty 20 mL glass vial. A fixed concentration (same as added to the samples) of IS 4-methyl-2-pentanone was also added. The vial was then placed on the heated plate for evaporation of the compounds. Three replicates were carried out for each concentration level and calibrations curves were drawn by plotting the ratio of the peak area of the analyte compare to the IS (Ai/AIS) for the different analyte concentrations. The method linearity was determined by evaluating the regression curves and expressed by the squared determination coefficient (R2).
Results and discussion
Optimisation of HS-HiSorb extraction process
The effect of the different extraction parameters was evaluated independently and optimized. The behaviour of extraction temperature, adsorption time, stirring rate, and sample mass were investigated.
Extraction temperature
The extraction temperature affects the extraction efficiency of the analytes. Due to its nature, olive oil is sensitive to temperature, so high extraction temperatures should be avoided to prevent the oxidation of the sample and the release of unwanted oxidation VOCs. Therefore, various extraction temperatures (25, 40, and 60 °C) were examined during the sampling process. This experiment was performed using a 2.5 g sample without stirring, and the applied sampling time was 120 min. As shown in Fig. 1(a), by increasing the extraction temperature, the total area of all VOCs increased. The increase in extraction temperature to 60 °C resulted in a higher number of compounds with 7–12 carbon atoms in their molecular structure (C7–C12), in contrast to oil samples heated at lower temperatures. The VOCs with C7–C12 are less volatile than the C5–C6 ones; this is mainly the reason why their areas were higher at higher extraction temperatures. Also, these compounds are related to olive oil oxidation processes (Fig. 1(b)) and therefore must be kept to a minimum during sample heating [22]. This observation agrees with previous studies in which the extraction temperature was set lower, at 55 °C. Therefore, 40 °C was selected as the optimum extraction temperature, as this is the closest temperature to the human body [23, 24].
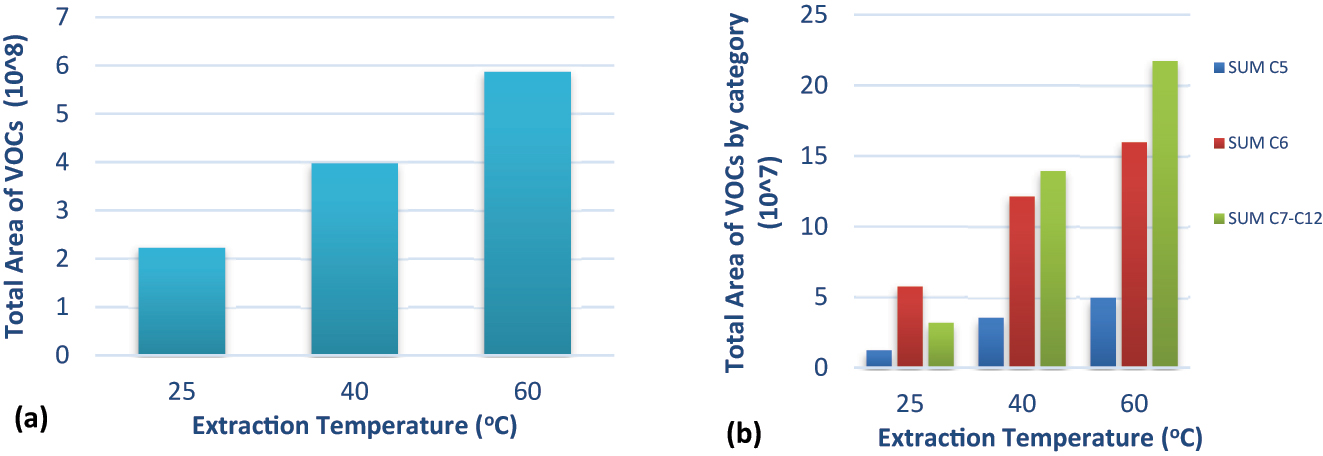
Effect of extraction temperature (a) on the total area of VOCs, (b) on the total area of VOCs by category (C5- and C6-compounds derived from the LOX biochemical pathway, whereas C7- to C12-compounds are related to oxidation processes).
Extraction time
The exposure time of the sorbent probe in the headspace of the sample also affects the number of analytes extracted. Several adsorption times (30, 60, 90, and 120 min) of the HiSorb-PDMS probe were evaluated. The total area, as well as the number of compounds detected, showed an upward trend with the increasing of adsorption time, as shown in Fig. 2(a) and (b), respectively. Hence, the time of 120 min was selected as the optimum sampling time.

Effect of adsorption time (a) on the total area of all VOCs, (b) on the number of detected VOCs.
Stirring rate
The stirring rate during the extraction process creates a positive effect on the mass transfer from the sample to the headspace of the vial and to the adsorbent material. In addition, it assists homogenize the sample and the headspace phase, reducing the equilibration time. Therefore, the diffusion of VOCs and especially of semi-VOCs from the matrix to the adsorbent material is enhanced. For the optimisation of stirring, four different speeds were studied: 0 (no stirring), 200, 400, and 800 rpm. The total area of VOCs showed a maximum value at the stirring rate of 800 rpm, so it was selected as the optimum stirring speed (Fig. 3).

Effect of stirring rate on the total area of VOCs.
Sample amount
The effect of sample amount on extraction efficiency was also examined. In Fig. 4, the total area of extracted VOCs for two different amounts of sample (2.5, and 5 g) is plotted. As illustrated, the amount of extracted compounds (total area) did not change significantly as the amount of sample increased; this observation was also noticed by other authors [25]. Considering this and the limited availability of the sample, the smallest volume (2.5 g) was selected for the experiments.

Effect of sample amount on total area.
In summary, the optimum HS-HiSorb extraction conditions that were selected for the subsequent VOCs analysis of the olive oil samples were 40 °C extraction temperature, 120 min of adsorption time, 800 rpm of stirring rate, and 2.5 g of olive oil sample.
Analysis of VOCs
The optimized HiSorb-TD-GC-MS method was applied for the analysis of 21 olive oil samples, which were obtained from different olive mills in Cyprus during the 2020–2021 harvest season. A total of 76 VOCs were identified and semi-quantified; these were classified into different chemical categories such as aldehydes (22), ketones (5), acids (6), alcohols (3), esters (4), ethers (2), hydrocarbons (28, and 3 terpenes), furans (2), and others (1). In Fig. 5, the percentages of each chemical category for the respective olive oil samples are presented. Aldehydes (40.20 %) and hydrocarbons (41.08 %) represented quantitatively and qualitatively the majority of the VOCs profile of olive oil (81.28 %). The high amount of hydrocarbons is not particularly common in the aromatic profile of olive oil, although the Argentine variety Arauco represented 62.8 % of the total aromatic profile [7]. The high concentration of hydrocarbons can be explained by the non-polar sorbent phase of HiSorb-PDMS. The proposed method appears to be useful for the analysis of hydrocarbons and aldehydes but less suitable for alcohols and esters, which are usually reported in the literature to be present in higher numbers and amounts. To overcome this limitation, the triple coating divinylbenzene/carboxen/polydimethylsiloxane (DVB/CAR/PDMS) is proposed in SPME as the most sensitive for VOO VOCs analysis [9]. An example of a headspace HiSorb-TD-GC-MS full-scan chromatogram of EVVO is shown in Fig. 6.

Main classes of volatile compounds in olive oil samples (n = 21). The average of three replicates of each sample was used for the calculations.

Indicative headspace HiSorb-TD-GC-MS full-scan chromatogram of EVOO (4-methyl-2-pentanone and chlorobenzene-d5 served as IS).
Aldehydes
Aldehydes are usually the most abundant chemical class in the aroma of olive oil. Most aldehydes, especially those with 5 and 6 carbons in their molecular structure (C5- and C6-), are produced by the LOX biosynthetic pathway, which is activated during the crushing of olive fruit tissue by the release of several fruit enzymes. Some aldehydes also arise from other endogenous biochemical pathways, such as the metabolism of amino acids, carbohydrates, vitamins, and steroids. Others derive from exogenous sources, such as abiotic and biotic stress.
(E)-2-hexenal was the most abundant aldehyde found on average of the examined samples, with a concentration ranging from 0.91 ± 0.05 mg/kg to 4.97 ± 0.64 mg/kg. Its highest concentration was observed in the O12 sample. (E)-2-hexenal contributes positively to the organoleptic characteristics of olive oil, providing the sensation of green, fruity, and bitter almond. In particular, considering each sample separately, it was observed that (E)-2-hexenal was the most abundant aldehyde for most samples (10 out of 21), whereas other samples showed nonanal (6) and hexanal (2) as the most dominant aldehydes. Only in one sample (O11), 2-undecenal was the most abundant aldehyde.
The concentration range of nonanal and hexanal was 0.73 ± 0.16 mg/kg to 4.80 ± 3.06 mg/kg and 0.48 ± 0.14 mg/kg to 3.70 ± 1.29, respectively. Nevertheless, (E)-2-hexenal was still found in high concentrations in all samples. These results are in agreement with previous studies, which showed that (E)-2-hexenal is the major aldehyde in the olive oils of European cultivars [26], [27], [28], [29], [30], [31], [32], [33]. Furthermore, according to a study by Fernandez et al. where Argentinian cultivars were examined, hexanal was revealed as the most abundant aldehyde for the Arbequina cultivar, while for the Empeltre and Farga cultivars it was (E)-2-hexenal [7]. Similarly, P. Reboredo-Rodríguez et al. found (E)-2-hexenal as the major aldehyde, followed by hexanal [17]. Regarding nonanal, its high concentration is associated with a bitter taste [34]. In Fig. 7, the concentration of aldehydes is plotted for each sample.

Concentration of aldehydes (mg/kg) in the examined olive oil samples.
Hydrocarbons
Hydrocarbons were detected in a significant proportion in the aromatic profile of the examined olive oils, representing on average 41.08 %. Methyl-cyclodecane was the major hydrocarbon, with a concentration ranging from 1.45 ± 0.41 mg/kg to 13.55 ± 2.76 mg/kg. In addition, several aliphatic and aromatic hydrocarbons were detected. The major aliphatic hydrocarbons detected in the majority of samples were heptane, pentane dimers, and octane. Pentene dimers are produced during olive oil production via side reactions of the LOX pathway. Aromatic hydrocarbons can be highly modified oils due to their lipophilic nature and their wide distribution in the environment. Four aromatic hydrocarbons were detected in the examined samples: toluene, p-xylene, ethylbenzene, and mesitylene. Their origin is attributed to various endogenous and exogenous factors such as the biological processes in the fruit, the extraction system, contamination from fuel vapors, etc. [35]. Figure 8 shows diagrammatically the concentrations of hydrocarbons (mg/kg) in the examined samples.

Concentration of hydrocarbons (mg/kg) in the analysed samples.
Acids
The carboxylic acids were the third most prominent chemical class and contributed on average 7.16 % to the aromatic profile of the samples. A total of six carboxylic acids were detected, including acetic acid, butanoic acid, hexanoic acid, octanoic acid, benzoic acid, and nonanoic acid [32]. Figure 9 shows the concentrations of the acids (mg/kg) determined in the examined samples. Carboxylic acids with 2–3 carbon atoms derive from microbial processes such as the acetic acid that is produced during anaerobic fermentation by certain bacteria, which convert glucose directly into acetic acid. High acid concentrations are associated with olive oil oxidation and yield sensory defects such as rancid taste. The main carboxylic acid found in the examined samples was nonanoic acid.

Concentration of acids (mg/kg) in the examined samples.
Terpenes
The terpenes contributed 6.61% of the total aroma profile and were considered the fourth most abundant chemical class in the anaysed olive oil samples. Their total content ranged from 0.49 ± 0.10 mg/kg to 3.47 ± 0.73 mg/kg. The following terpenes were identified and semi-quantified in most of the examined samples: D-limonene, beta-ocimene and (E)-4,8-dimethylnona-1,3,7-triene (Fig. 10). These compounds were also detected in virgin olive oil samples from Crete [36]. According to previous studies, terpenes depend on the variety and are important indicators of olive oil quality and geographic origin [37, 38].

Concentration of terpenes (mg/kg) in the examined samples.
Table 4 shows the semi-quantified VOCs concentrations expressed in mg/kg, based on the IS of 4-methyl-2-pentanone. The total concentration of VOCs (TVOCs) in the samples ranged from 8.73 to 39.81 mg/kg.
Mean, standard deviation (SD), minimum, and maximum values of VOCs (mg/kg) from Cyprus olive oil samples (n = 21, triplicate analysis).
| VOCs | Mean (mg/kg) | ±SD (%) | Min | Max |
|---|---|---|---|---|
| Aldehydes | ||||
| 2-Propenal | 0.01 | 0.01 | 0.00 | 0.05 |
| Propanal | 0.003 | 0.008 | 0.00 | 0.03 |
| Butanal | 0.03 | 0.02 | 0.00 | 0.06 |
| Pentanal, C5 | 0.08 | 0.06 | 0.00 | 0.21 |
| (E)-2-Pentenal, C5 | 0.007 | 0.014 | 0.00 | 0.04 |
| 3-Hexenal, C6-LnA | 0.006 | 0.020 | 0.00 | 0.09 |
| Hexanal, C6-LA | 1.52 | 0.98 | 0.48 | 3.70 |
| (E)-2-Hexenal, C6-LnA | 2.67 | 1.17 | 0.91 | 4.97 |
| Heptanal | 0.19 | 0.09 | 0.06 | 0.36 |
| (E,E)-2,4-Hexadienal, C6-LnA | 0.003 | 0.015 | 0.00 | 0.07 |
| (E)-2-Heptenal | 0.20 | 0.17 | 0.00 | 0.69 |
| Benzaldehyde | 0.007 | 0.022 | 0.00 | 0.09 |
| Octanal | 0.46 | 0.21 | 0.00 | 0.93 |
| (E,E)-2,4-Heptadienal | 0.02 | 0.09 | 0.00 | 0.40 |
| 2-Octenal (E) | 0.05 | 0.09 | 0.00 | 0.30 |
| Nonanal | 2.63 | 1.15 | 0.73 | 4.80 |
| (E)-2-Nonenal | 0.04 | 0.11 | 0.00 | 0.36 |
| Decanal | 0.10 | 0.15 | 0.00 | 0.43 |
| (Z)2-Decenal | 0.94 | 1.01 | 0.00 | 3.82 |
| (E,Ζ)-2,4-Decadienal | 0.04 | 0.14 | 0.00 | 0.59 |
| (E,E)-2,4-Decadienal | 0.28 | 0.56 | 0.00 | 2.30 |
| 2-Undecenal | 0.42 | 1.05 | 0.00 | 4.68 |
| Sum | 9.70 | 4.54 | ||
| Ketones | ||||
| Acetone | 0.11 | 0.22 | 0.00 | 0.87 |
| 1-penten-3-one, C5 | 0.08 | 0.06 | 0.00 | 0.22 |
| 2-Pentanone, C5 | 0.0005 | 0.002 | 0.00 | 0.01 |
| 3-Pentanone, C5 | 0.03 | 0.03 | 0.00 | 0.09 |
| 2-Heptanone | 0.004 | 0.013 | 0.00 | 0.05 |
| Sum | 0.22 | 0.25 | ||
| Acids | ||||
| Acetic acid | 0.12 | 0.09 | 0.00 | 0.32 |
| Butanoic acid | 0.04 | 0.04 | 0.00 | 0.14 |
| Hexanoic acid | 0.20 | 0.13 | 0.00 | 0.49 |
| Octanoic acid | 0.27 | 0.29 | 0.00 | 1.01 |
| Benzoic acid | 0.25 | 0.37 | 0.00 | 1.28 |
| Nonanoic acid | 0.85 | 0.55 | 0.00 | 2.57 |
| Sum | 1.73 | 1.05 | ||
| Alcohols | ||||
| (E)-3-Hexen-1-ol, C6-LnA | 0.07 | 0.17 | 0.00 | 0.62 |
| 1-Hexanol, C6-LA | 0.01 | 0.06 | 0.00 | 0.30 |
| 2-Ethyl-1-butanol, C6 (isohexyl alcohol) | 0.01 | 0.04 | 0.00 | 0.14 |
| Sum | 0.10 | 0.20 | ||
| Esters | ||||
| Acetic acid, methyl ester | 0.001 | 0.004 | 0.00 | 0.02 |
| Ethyl acetate | 0.003 | 0.011 | 0.00 | 0.05 |
| (Z)-3-Hexen-1-ol, acetate, C6-LnA ((Z)-3Hexen-1-yl, acetate) | 0.54 | 0.68 | 0.00 | 2.87 |
| Acetic acid, hexyl ester, C6-LA (hexyl acetate) | 0.16 | 0.16 | 0.00 | 0.53 |
| Sum | 0.70 | 0.79 | ||
| Ethers | ||||
| 1-Methoxyhexane, C6 | 0.09 | 0.09 | 0.00 | 0.32 |
| (3Z)-1-Methoxy-3-hexene, C6 | 0.04 | 0.05 | 0.00 | 0.13 |
| Sum | 0.13 | 0.13 | ||
| Hydrocarbons | ||||
| 1-Pentene | 0.02 | 0.02 | 0.00 | 0.07 |
| Pentane, C5 | 0.11 | 0.13 | 0.00 | 0.43 |
| (Z)-2-pentene, C5 | 0.003 | 0.007 | 0.00 | 0.02 |
| 1,4-Pentadiene, C5 | 0.003 | 0.007 | 0.00 | 0.02 |
| (E)-1,3-pentadiene, C5 | 0.001 | 0.006 | 0.00 | 0.03 |
| n-hexane, C6 | 0.02 | 0.02 | 0.00 | 0.09 |
| Cyclohexane | 0.02 | 0.06 | 0.00 | 0.25 |
| Heptane | 1.57 | 1.85 | 0.47 | 8.54 |
| Toluene | 0.05 | 0.10 | 0.00 | 0.40 |
| 1-Octene | 0.08 | 0.06 | 0.00 | 0.19 |
| Octane | 0.52 | 0.39 | 0.06 | 1.65 |
| Ethylbenzene | 0.004 | 0.016 | 0.00 | 0.08 |
| Nonane | 0.01 | 0.03 | 0.00 | 0.12 |
| p-Xylene | 0.11 | 0.12 | 0.00 | 0.46 |
| Pentene dimer 1, C5 | 0.25 | 0.13 | 0.00 | 0.52 |
| Pentene dimer I2, C5 | 0.27 | 0.17 | 0.00 | 0.58 |
| Nonane,4-methyl | 0.003 | 0.011 | 0.00 | 0.05 |
| Nonane, 2-methyl | 0.004 | 0.017 | 0.00 | 0.08 |
| Nonane, 3-methyl | 0.006 | 0.026 | 0.00 | 0.12 |
| 3-Ethyl-1,5-octadiene, isomer I, C5 (pentene dimer 3) | 0.16 | 0.08 | 0.00 | 0.33 |
| Decane | 0.15 | 0.41 | 0.00 | 1.88 |
| 3-Ethyl-1,5-octadiene, isomer II, C5 (pentene dimer 4) | 0.33 | 0.17 | 0.00 | 0.70 |
| 3-Ethyl-1,5-octadiene, isomer III, C5 (pentene dimer 5) | 0.25 | 0.12 | 0.00 | 0.49 |
| Benzene, 1,2,4-trimethyl (Mesytilene) | 0.03 | 0.07 | 0.00 | 0.20 |
| Undecane | 0.02 | 0.05 | 0.00 | 0.21 |
| 4,7-Methano-1H-indene, octahydro | 0.04 | 0.11 | 0.00 | 0.50 |
| Dodecane | 0.03 | 0.10 | 0.00 | 0.45 |
| Cyclodecane, methyl | 5.83 | 3.40 | 1.45 | 13.55 |
| Sum | 9.89 | 4.59 | ||
| Terpenes | ||||
| D-limonene | 0.07 | 0.12 | 0.00 | 0.44 |
| Beta-Ocimene | 0.60 | 0.48 | 0.00 | 2.16 |
| (E)-4,8-Dimethylnona-1,3,7-triene | 0.93 | 0.58 | 0.19 | 2.50 |
| Sum | 1.60 | 0.88 | ||
| Furans | ||||
| Furan | 0.001 | 0.004 | 0.00 | 0.02 |
| Furan, 2-pentyl | 0.04 | 0.09 | 0.00 | 0.40 |
| Sum | 0.04 | 0.09 | ||
| Others | ||||
| Dimethyl sulfide | 0.002 | 0.006 | 0.00 | 0.02 |
| Sum | 0.002 | 0.006 | ||
| Total VOCs (mg/kg) | 24.11 | 8.12 | ||
| C5 | 1.59 | 0.70 | ||
| C6 | 5.14 | 1.47 | ||
| C5 + C6 | 6.73 | 1.92 | ||
-
Where C5: compounds with 5 carbons in their molecular structure produced from the secondary LOX pathway, C6-LA: compounds with 6 carbons derived from the LOX pathway during the degradation of linoleic acid, and C6-LnA: compounds derived from the LOX pathway during linolenic acid degradation. The semi-quantitative concentrations (mg/kg) were calculated based on 4-methyl-2-pentanone (IS). The bold values are highlight the sum per chemical category.
Evaluation of the HS-HiSorb-TD-GC-MS method
Repeatability and calibration curves
Table 5 presents the intra-day results, indicating satisfactory repeatability for the examined compounds as SD ranged from 2.22–15.86 %. The repeatability of the HiSorb-TD-GC-MS method was evaluated for selected compounds, at three different concentrations (1, 10, and 100 ppbv).
Intra-day repeatability results.
| VOCs | Repeatability (intra-day, n = 5) (RSD %) | ||
|---|---|---|---|
| 100 ppbv | 10 ppbv | 1 ppbv | |
| 1-Penten-3-one | 2.22 | 2.44 | 3.09 |
| Hexanal | 2.36 | 5.27 | 9.38 |
| (E)-2-Hexenal | 13.29 | 7.77 | 15.86 |
| Octanal | 6.46 | – | – |
| Hexanoic acid | 4.39 | – | – |
| Nonanal | 7.66 | – | – |
The results of the calibration curves of compounds (E)-2-hexenal, 1-penten-3-one, hexanal, and nonanal are summarized in Table 6. The linearity range of the examined VOCs was estimated, and the results were satisfactory, with a coefficient of determination (R2) greater than 0.97, except for nonanal (R2 = 0.94) which is emitted in relatively small amounts.
Linearity, limit of detection (LOD), and limit of quantification (LOQ) for selected EVOO compounds.
| VOCs | Equation | Correlation coefficient (R2) | Linearity range (ppbv) | LOD (ppbv) | LOQ (ppbv) |
|---|---|---|---|---|---|
| (Ε)-2-Hexenal | Y = 0.0185x − 0.1904 | 0.97 | 92–200 | 30.46 | 92.32 |
| 1-Penten-3-one | Y = 0.0047x − 0.0018 | 0.98 | 20–50 | 6.51 | 9.72 |
| Hexanal | Y = 0.0113x + 0.0228 | 0.98 | 20–100 | 15.93 | 48.28 |
| Nonanal | Y = 0.0488x + 0.4896 | 0.94 | 36–50 | 11.75 | 35.60 |
The analytical results in Tables 5 and 6 show the importance of sample pretreatment in the analytical process. HiSorb-PDMS is more suitable for non-polar VOCs (it was the first commercially available high sorptive product from Markes International Ltd. in 2016), while other multiphase sorptive products are available nowadays to extend the sensory applications. This observation is in agreement with previous SPME studies that found a low sensitivity of PDMS to the polar molecules in olive oil [39]. In this context, recent studies have highlighted the application of three-phase coatings (DVB/CAR/PDMS) for the identification of VOCs in EVOO [9, 36, 40].
Conclusions
In conclusion, an analytical method based on HS-HiSorb-TD-GC-MS was created, improved upon, and used to analyse EVOO VOCs derived from olive oil mills. Aldehydes, hydrocarbons (both saturated and unsaturated, terpenes), short-chain carboxylic acids, ketones, esters, alcohols, ethers, furans, and sulfur compounds make up this extremely complex mixture of VOCs, which is present in very small concentrations (between a few tens of mg/kg and a few ng/kg). As it directly affects the results, the extraction technique (suitability of the sorptive coating material) is the main bottleneck. In comparison to hydrocarbons and aldehydes, which could both be identified using a single non-polar coating material (PDMS), alcohols and esters were less easy to detect. The market now provides a number of multi-phase HiSorb coating materials, such as PDMS/CWR (carbon wide range), PDMS/DVB, and DVB/CWR/PDMS. The stir bar sorptive extraction (SBSE) as well as the TF-SPME are additional green solid sorbent media that can be used with the TD-GC-MS. To fully verify and decode the volatile profile of Cyprus olive oils, additional research with a larger sample size, the use of more sensitive mass analyzers such as TOF, and chemometric support are required.
References
[1] IOC (International Olive Council). Int. Olive Counc. 15, 1 (2019).Search in Google Scholar
[2] L. Conte, A. Bendini, E. Valli, P. Lucci, S. Moret, A. Maquet, F. Lacoste, P. Brereton, D. L. García-González, W. Moreda, T. Gallina Toschi. Trends Food Sci. Technol. 105, 483 (2020), https://doi.org/10.1016/j.tifs.2019.02.025.Search in Google Scholar
[3] Off. J. Eur. Comm., L85/1 (1999).Search in Google Scholar
[4] F. Angerosa. Eur. J. Lipid Sci. Technol. 104, 639 (2002), https://doi.org/10.1002/1438-9312(200210)104:9/10<639::AID-EJLT639>3.0.CO;2-U.10.1002/1438-9312(200210)104:9/10<639::AID-EJLT639>3.0.CO;2-USearch in Google Scholar
[5] I. Kosma, A. Badeka, K. Vatavali, S. Kontakos, M. Kontominas. Eur. J. Lipid Sci. Technol. 118, 849 (2016), https://doi.org/10.1002/ejlt.201500293.Search in Google Scholar
[6] F. Peres, H. H. Jele, M. M. Majcher, M. Arraias, L. L. Martins, S. Ferreira-dias. Food Res. Int. 54, 1979 (2013), https://doi.org/10.1016/j.foodres.2013.06.015.Search in Google Scholar
[7] M. de los Angeles Fernandez, M. Assof, V. Jofre, M. F. Silva. Food Anal. Methods 7, 2122 (2014), https://doi.org/10.1007/s12161-014-9854-2.Search in Google Scholar
[8] R. Aparicio, J. L. (Ed.) Harwood. in Handbook of Olive Oil: Analysis and Properties, pp. 163–218, Springer, New York, 2nd ed. (2013).10.1007/978-1-4614-7777-8Search in Google Scholar
[9] L. Cecchi, M. Migliorini, N. Mulinacci. J. Agric. Food Chem. 69, 2013 (2021), https://doi.org/10.1021/acs.jafc.0c07744.Search in Google Scholar
[10] V. Jalili, A. Barkhordari, A. Ghiasvand. Microchem. J. 152, 104319 (2020), https://doi.org/10.1016/j.microc.2019.104319.Search in Google Scholar
[11] A. D. Ros, D. Masuero, S. Riccadonna, K. B. Bubola, N. Mulinacci, F. Mattivi, I. Lukić, U. Vrhovsek. Molecules 24, 1 (2019), https://doi.org/10.3390/molecules24162896.Search in Google Scholar
[12] F. Mansouri, A. B. Moumen, G. Richard, M. Fauconnier, M. Sindic, H. S. Caid, A. Elamrani. Oilseeds Fats Crop. Lipids 24, A501 (2017), https://doi.org/10.1051/ocl/2017012.Search in Google Scholar
[13] B. Quintanilla-Casas, S. Bertin, K. Leik, J. Bustamante, F. Guardiola, E. Valli, A. Bendini, T. Gallina Toschi, A. Tres, S. Vichi. Food Chem. 307, 125556 (2020), https://doi.org/10.1016/j.foodchem.2019.125556.Search in Google Scholar PubMed
[14] L. Cecchi, M. Migliorini, E. Giambanelli, A. Rossetti, A. Cane, N. Mulinacci, F. Melani. Food Control 112, 107156 (2020), https://doi.org/10.1016/j.foodcont.2020.107156.Search in Google Scholar
[15] M. Žanetić, M. J. Špika, M. M. Ožić, K. B. Bubola. Plants 10, 1995 (2021), https://doi.org/10.3390/plants10101995.Search in Google Scholar PubMed PubMed Central
[16] J. R. O. da Costa, S. M. Dal Bosco, R. C. d. S. Ramos, I. C. K. Machado, J. Garavaglia, S. S. Villasclaras. J. Food Sci. 85, 3764 (2020), https://doi.org/10.1111/1750-3841.15467.Search in Google Scholar PubMed
[17] P. Reboredo-Rodríguez, C. González-Barreiro, B. Cancho-Grande, J. Simal-Gándara. Food Control 25, 684 (2012), https://doi.org/10.1016/j.foodcont.2011.12.005.Search in Google Scholar
[18] G. Procida, A. Cichelli, C. Lagazio, L. S. Conte. J. Sci. Food Agric. 96, 311 (2016), https://doi.org/10.1002/jsfa.7096.Search in Google Scholar PubMed
[19] C. Sales, T. Portolés, L. G. Johnsen, M. Danielsen, J. Beltran. Food Chem. 271, 488 (2019), https://doi.org/10.1016/j.foodchem.2018.07.200.Search in Google Scholar PubMed
[20] M. P. Segura-Borrego, R. Rios-Reina, C. Ubeda, R. M. Callejon, M. Lourdes Morales. Foods 9, 1 (2020), https://doi.org/10.3390/foods9060748.Search in Google Scholar PubMed PubMed Central
[21] Z. Cheng, D. T. Mannion, M. G. O’sullivan, S. Miao, J. P. Kerry, K. N. Kilcawley. Foods 10, 1 (2021), https://doi.org/10.3390/foods10092061.Search in Google Scholar PubMed PubMed Central
[22] A. Bendini, L. Cerretani, M. D. Salvador, G. Fregapane, G. Lercker. Ital. J. Food Sci. 21, 389 (2009).Search in Google Scholar
[23] P. Zunin, R. Boggia, S. Lanteri, R. Leardi, R. De Andreis, F. Evangelisti. J. Chromatogr. A 1023, 271 (2004), https://doi.org/10.1016/j.chroma.2003.10.035.Search in Google Scholar PubMed
[24] M. T. Morales, J. J. Rios, R. Aparicio. J. Agric. Food Chem. 45, 2666 (1997), https://doi.org/10.1021/jf960585+.10.1021/jf960585+Search in Google Scholar
[25] B. D. Page, G. Lacroix. J. Chromatogr. Sci. 873, 79 (2000), https://doi.org/10.1016/S0950-3293(03)00061-2.Search in Google Scholar
[26] A. K. Kiritsakis. JAOCS, J. Am. Oil Chem. Soc. 75, 673 (1998), https://doi.org/10.1007/s11746-998-0205-6.Search in Google Scholar
[27] F. Peres, H. H. Jeleń, M. M. Majcher, M. Arraias, L. L. Martins, S. Ferreira-Dias. Food Res. Int. 54, 1979 (2013), https://doi.org/10.1016/j.foodres.2013.06.015.Search in Google Scholar
[28] A. Gómez-Rico, G. Fregapane, M. D. Salvador. Food Res. Int. 41, 433 (2008), https://doi.org/10.1016/j.foodres.2008.02.003.Search in Google Scholar
[29] S. Vichi, L. Pizzale, L. S. Conte, S. Buxaderas, E. López-Tamames. J. Agric. Food Chem. 51, 6564 (2003), https://doi.org/10.1021/jf030268k.Search in Google Scholar PubMed
[30] M. Šarolić, M. Gugić, E. Friganović, C. I. G. Tuberoso, I. Jerković. Molecules 20, 4395 (2015), https://doi.org/10.3390/molecules20034395.Search in Google Scholar PubMed PubMed Central
[31] E. Pouliarekou, A. Badeka, M. Tasioula-Margari, S. Kontakos, F. Longobardi, M. G. Kontominas. J. Chromatogr. A 1218, 7534 (2011), https://doi.org/10.1016/j.chroma.2011.07.081.Search in Google Scholar PubMed
[32] J. F. Cavalli, X. Fernandez, L. Lizzani-Cuvelier, A. M. Loiseau. Food Chem. 88, 151 (2004), https://doi.org/10.1016/j.foodchem.2004.04.003.Search in Google Scholar
[33] M. Campus, P. Sedda, D. Delpiano, S. Secci, G. Damasco, R. Zurru, G. Bandino. Rivista Italiana delle Sostanze Grasse 90, 237 (2013).Search in Google Scholar
[34] H. Zhu, S. C. Wang, C. F. Shoemaker. Flavour Fragrance J. 31, 22 (2016), https://doi.org/10.1002/ffj.3264.Search in Google Scholar
[35] B. Gilbert-López, J. Robles-Molina, J. F. García-Reyes, A. Molina-Díaz. Talanta 83, 391 (2010), https://doi.org/10.1016/j.talanta.2010.09.052.Search in Google Scholar PubMed
[36] A. Lioupi, I. Sampsonidis, C. Virgiliou, V. T. Papoti, K. G. Zinoviadou, A. Spyros, G. Theodoridis. Metabolites 12, 114 (2022), https://doi.org/10.3390/metabo12020114.Search in Google Scholar PubMed PubMed Central
[37] I. Kosma, M. Vavoura, S. Kontakos, I. Karabagias, M. Kontominas, K. Apostolos, A. Badeka. JAOCS, J. Am. Oil Chem. Soc. 93, 837 (2016), https://doi.org/10.1007/s11746-016-2822-9.Search in Google Scholar
[38] T. Cecchi, B. Alfei. Food Chem. 141, 2025 (2013), https://doi.org/10.1016/j.foodchem.2013.05.090.Search in Google Scholar PubMed
[39] A. Kanavouras, A. Kiritsakis, R. J. Hernandez. Food Chem. 90, 69 (2005), https://doi.org/10.1016/j.foodchem.2004.03.025.Search in Google Scholar
[40] S. Vichi, A. I. Castellote, L. Pizzale, L. S. Conte, S. Buxaderas, E. López-Tamames. J Chromatogr. A 983, 19 (2003), https://doi.org/10.1016/s0021-9673(02)01691-6.Search in Google Scholar PubMed
© 2023 IUPAC & De Gruyter. This work is licensed under a Creative Commons Attribution-NonCommercial-NoDerivatives 4.0 International License. For more information, please visit: http://creativecommons.org/licenses/by-nc-nd/4.0/
Articles in the same Issue
- Frontmatter
- In this issue
- Preface
- Preface for special issue of ICGC-9 in Athens, Greece
- Conference papers
- HOME-Chemistry: hydrazone as organo-metallic equivalent
- Towards lignin valorization: lignin as a UV-protective bio-additive for polymer coatings
- How the physio-chemical properties of char from the pyrolysis of Automotive Shredder Residue (ASR) influences its future uses
- Plant based fabrication of CuO/NiO nanocomposite: a green approach for low-level quantification of vanillin in food samples
- Synthesis and characterization of new polycarbonates free of bisphenol A components (BPA-free) based on dimethyl/diphenyl carbonate and diphenylmethane derivative
- Adsorption capacity of biocarbons from residue of supercritical extraction of raw plants
- Cd(II) and As(V) removal from the multicomponent solutions in the presence of ionic polymers using carbonaceous adsorbents obtained from herbs
- Synthesis and thermal characterization of composites based on Epidian 601 with flame retardants compounds
- A green sorptive extraction method (HiSorb-TD-GC-MS) for determining the extra virgin olive oil (EVOO) aroma profile
- Synthesis, aging and antimicrobial tests of (di)acrylate composites