Plant based fabrication of CuO/NiO nanocomposite: a green approach for low-level quantification of vanillin in food samples
-
Shuaibul-Zaman Shah


Abstract
Metal oxide nanoparticles have a wide range of potential applications due to their unique properties, including their high surface area-to-volume ratio, enhanced reactivity, and unique electronic and magnetic properties. They are widely used in industries such as electronics, energy, catalysis, and medicine, where their small size and unique properties can be utilized for a variety of purposes. Fabrication of bi-metal oxide nanocomposite through green synthesis routes is of great importance. The plant leaves are being used as a prominent source for reducing/capping or functionalization of metal oxide nanoparticles. Thus, engineering of CuO/NiO nanocomposite has been carried out via exploiting Java plum leaves’ extract as reducing and capping source. After successful green synthesis, the CuO/NiO nanocomposite was directed for characterization through advanced analytical tool viz XRD, FTIR and TEM. The FTIR spectra confirm the stretching frequencies of Cu–O and Ni–O bonds at 587.1 and 647.3 cm−1 which witnesses the surface functionalities of prepared nanocomposite. XRD analysis confirms the diffraction patterns of CuO/NiO nanocomposite with exceptional crystalline structure and phase purity. TEM images evaluate the nanometric size of fabricated CuO/NiO nanocomposite with nanoflower like internal texture having size below 100 nm. The as-prepared CuO/NiO nanocomposite was used as green electrocatalyst for the determination of vanillin (VN) in food samples. The redox current response and charge transfer kinetics of CuO/NiO/GCE was examined via cyclic voltammetry (CV) and electrochemical impedance spectroscopy (EIS). Under the optimal conditions such as potential window (0.2–1.3 V), PBS electrolyte pH 7, scan rate 60 mV/s, the engineered modified electrode exhibited excellent response for VN. The LOD of prepared electrocatalyst for VN was examined as 0.0087 µM. The potential of applicability of CuO/NiO/GCE was tested in ice-cream and chocolate samples. The obtained recovery values of real samples were found in acceptable range which highlights analytical potential of prepared modified electrode for VN.
Introduction
Vanillin (VN) chemically known as (4-hydroxy-3-methoxybenaldyde, C8H8O3) is one of the world’s most flavoring agent which is obtained primarily from vanilla, a specie of tropical climbing [1, 2]. Because of its aroma and flavoring properties, VN widely used in the several industrial products such as beverage, perfume, confectionary, pharmaceuticals products, cosmetics, bread, candies, chocolate, biscuits, ice-cream, tobaccos, noodles, animal feed and wine products 3. Moreover, VN shows antioxidant and anti-microbial properties depending upon its initial concentration in the different industrial products [4, 5]. The excessive intake of VN can cause various dangerous human diseases including headache, vomiting, allergic reactions, nausea, kidney and liver issues [6, 7]. Therefore, it is very important to develop a simple, accurate and cost-effective method for the determination of VN in many industrial products such as food, medicine and perfume products. Several analytical methods have been employed to determine the accurate amount of VN in many industrial products including UV-Visible spectrophotometry [8], high performance liquid chromatography (HPLC) [9], gas-chromatography (GC) [10], electrophoresis (EC) [11], and GC-MS [12, 13]. These conventional analytical techniques have several drawbacks such as high running cost, use of too many organic solvents, time consuming, skilled persons are required to run these instruments and tedious sample pre-treatment. Amongst, these analytical techniques, the electrochemical tools have lot of advantages like time saving, on-site detection, simple operations, fast response, high sensitivity, and more cost-effective [14–19].
Nanotechnology has gained much interest nowadays as well as in the past due to the distinctive properties of the nanomaterials. The nanomaterials work more efficiently and possess a better and enriched reactivity when compared to the bulk materials due to the presence of high surface-to-volume ratio [20, 21]. The metal oxide nanoparticles can be synthesized by the top-down approach which includes laser ablation, mechanical milling/ball milling, sputtering and electro-expulsion, whereas the bottom-up approach possess the chemical vapor deposition method, sol gel processes, laser pyrolysis, atomic/molecular condensation [22, 23]. The structural characteristics of metal oxide nanomaterials can be controlled or modified by varying experimental conditions like temperature, pH and the concentration of chemicals used. These synthesized nanomaterials may be found expensive, toxic to the environment as they cannot be recycled. These limitations are undesirable in today’s world but this can lead to exploration of more opportunities in the research fields [24–26]. Thus, to overcome these limitations, green methods can be employed for the nanomaterial synthesis which is of much importance nowadays in the research and development. Green synthesis is basically defined as environment friendly synthesis route, which utilizes non-toxic chemicals, preventing waste, and hazardous by-products formation. The green synthesis requires the use of natural resources like fungi, bacteria, and plants as well as other biological materials. The metallic nanoparticles when synthesized using plant materials are very easy and taken into consideration because of the presence of effective phytochemicals in plant extracts such as terpenoids, flavones, aldehydes, and ketones. These phytochemicals have the ability to reduce the metal salts into metallic nanoparticles [21, 27–29]. In present study, we are using bimetal oxide nanocomposites, which is a blend of two or more materials combined to produce a different material. The CuO and NiO nanoparticles are of great importance in the research field due to their unique thermal, electro catalytic, and magnetic properties [30–34]. There are many plant materials which can be employed for the green synthesis of CuO/NiO nanocomposite like ginger powder [35, 36], and Crataegus azarolus var. aronia L. and Syzygium cumini’s leaf extract [37]. The nanomaterials especially bimetal oxide nanoparticles have great interest in electrochemistry for the fabrication of chemically modified electrochemical sensors. The metal oxide nanoparticles possess extended surface to volume ratio which ultimately increase the reactive site of materials and involve them in the as sensing probe in the modified sensors. Moreover, the bare electrodes usually lack sensitivity and selectivity parameters. To overcome this bottleneck the bare electrodes are modified which various nanomaterials especially metal oxide nanoparticles to enhance their sensitivity and selectivity. Hence, the metal oxide nanoparticles has very important role in electrochemical sensors [38–43].
In the current experiment, we report the green synthesis of CuO/NiO nanocomposite by aqueous chemical growth method using the leaves extract of Java plum (Syzygium cumini) plant and their utilization as chemically modified electrochemical sensor for the determination of vanillin in ice-cream and chocolate samples.
Experimental
Chemicals and solutions
Copper acetate (CH3COO)2Cu·H2O and nickel acetate tetrahydrate (CH3COO)2Ni·4H2O, vanillin, potassium chloride, magnesium chloride and hesperidin were purchased from Merck (Germany). Ascorbic acid, methanol, vitamin B6, naringenin was brought from Merck (Switzerland). All the chemicals and reagents were of analytical grades and used without any further purification. All the glassware were thoroughly washed with deionized water to make them impurity free.
Instrumentation
The exceptional phase purity and crystallinity of prepared nanocomposite was examined through powder X-ray Diffractometer (XRD-7000-Shimadzu scientific-instrument). In order to investigate different functionalities in the synthesized CuO/NiO nanocomposite, Fourier Transform Infrared (FTIR) spectroscopy model (Thermo Nicolet-5700) was exploited. The 2D internal topography and internal phase structure of fabricated nanocomposite was examined via Transmission Electron Microscopy (TEM) model (JEM-1400 Flash-Electron Microscope). The electrochemical detection of vanillin was carried out via three electrodes based working assembly of electrochemical workstation (CHI-760 USA).
Green synthesis of CuO/NiO nanocomposite
The Java plum plant leaves were taken from the garden of National Centre of Excellence in Analytical Chemistry. The leaves were properly washed with DI water to remove the impurities and dust particles. For the typical extraction, 30 g of washed leaves were cut into small pieces and added into 100 mL beaker containing deionized (DI) water. The plant leaves containing DI water was heated at 80 °C and left on stirring for hours. After the completion of stirring, a pale green extract of Java plum leaves was obtained and filtered through commonly used Whatman filter paper. Moreover, for the green fabrication of copper oxide/nickel oxide nanocomposite, 0.2 M solution copper acetate and nickel acetate was taken into 100 mL beaker and stirred for 20 min for complete homogenization followed by the addition of pale green extract of Java plum leaves extract. After the through mixing of solution of plant and precursor salts, the solution was heated at 70 °C followed by continuous stirring for 2 h. Afterwards, the obtained particles were filtered and washed several times with DI water to remove the impurities and the sample was dried in an oven at 100 °C. For calcification, the material was kept in the muffle furnace at 500 °C for 4 h. The effectively produced material was then stored in falcon tubes at 5 °C in dark for further characterization.
Results and discussion
Characterization of CuO/NiO nanocomposite
To determine the exceptional phase structure and promising crystalline nature of fabricated CuO/NiO nanocomposite, the as prepared nanocomposite was directed for the XRD analysis. The diffraction patterns at (220), (200) and (111) are XRD characteristic patterns of NiO nanostructures, that clearly directs the crystalline nature of synthesized NiO nanostructures. While other diffraction patterns at (002), (110), (111), (−202) signify the exceptional phase purity and crystallinity of CuO nanostructures. The diffraction patterns at (020), (−311), (−113), (200) and (311) support successful fabrication of CuO nanostructure. Moreover, all the XRD diffraction patterns with extensive sharpness symbolizes the excellent crystallinity of CuO/NiO nanocomposite. The XRD patterns of prepared nanocomposite are shown in Fig. 1(a). The crystal size of CuO/NiO nanocomposite was also calculated by suing Debye Sherer equation which was noticed as 31.3 nm respectively. For the determination of different functionalities present in the prepared CuO/NiO nanocomposite, the FTIR analysis was successfully conducted. FTIR is an outstanding analytical tool used for the functional group determination in the materials. Herein, the FTIR characteristic peaks at 587.1 and 647.3 cm−1 confirm the metal oxygen stretching frequency of Cu–O and Ni–O respectively. However, the peak at 1665.3 cm−1 is characteristic peak of carbonyl (C=O) group from acetate metal precursor salt. While the last broad peak at 3467.7 cm−1 is O–H stretching frequency of surfaced adsorbed water from moisture. The FTIR peaks of CuO/NiO nanocomposite are displayed in Fig. 1(b). Moreover, All the FTIR characteristic peak witnessed the successful fabrication of CuO/NiO nanocomposite. The surface texture of engineered CuO/NiO nanocomposite was evaluated via advanced analytical tool like TEM. The TEM is successfully used to evaluate the internal morphology and nanometric size of CuO/NiO nanocomposite. The high- and low-resolution TEM images of CuO/NiO nanocomposite were captured at 200 and 500 nm as displayed in Fig. 1(c). Though, the TEM analysis clearly demonstrated the internal texture of prepared nanocomposite which exhibited the nanoflower like texture. The internal morphology of CuO/NiO nanocomposite could be easily visualized from Fig. 1(d). The TEM images successfully evaluated the internal texture of CuO/NiO nanocomposite at nanoscale and evidenced the nanometric size of prepared composite material.

Characterization of CuO/NiO nanocompoiste. (a) XRD patterns (b) FTIR characteristics peaks of CuO/NiO nanocomposite, (c and d) low- and high-resolution TEM images of CuO/NiO nanocomposite.
Characterization of electrodes
In an effort to examine the well resolved oxidation/reduction peak current response of CuO/NiO nanocomposite, the fabricated nanocomposite was directed for cyclic voltammetry (CV) analysis. CV is an effective primarily tool exploited for the evaluation of peak current responses of electrode in the analytes/electrolytes. For the determination of conductive nature of bare and green synthesized CuO/NiO/GCE, both electrodes were immersed in 0.1 KCl and 0.4 mM potassium hexa-ferrocyanide3/4 electrolytic solution and the current response of each electrode was recorded as displayed in Fig. 2(a). The current response of electrodes was recorded at 90 mV/s scan rate. The bare electrode manifested irregular redox response. In the comparison of bare/GCE, the green synthesized CuO/NiO nanocomposite showed well resolved redox response. The better redox of green fabricated CuO/NiO/GCE is due to the exceptional nanometric size of nanocomposite which enable it to act as an effective electrocatalyst. Moreover, for evaluation of ohmic resistance and conductive behavior, the electrochemical impedance spectroscopy (EIS) mode of voltammetry was exploited. The EIS response of bare and green CuO/NiO/GCE are plotted in Nyquist plot as displayed in Fig. 2(b). The circuit fitted EIS plot manifested the ohmic resistance 593, 1378 and 4653 Ω for green CuO/NiO/GCE and bare/GCE. The EIS response of electrodes were recorded in electrolytic solution of 0.1 KCl and 0.4 mM potassium hexa-ferrocyanide3/4. The narrower semicircle curve of green CuO/NiO/GCE highlights its effectiveness and more conductive nature than the bare/GCE. The CV and EIS responses are in good agreement with each other and witness conductive nature of green CuO/NiO/GCE.

Characterization of electrodes. (a) CV, (b) EIS Nyquist plot of bare and green CuO/NiO/GCE in solution of supporting electrolyte.
Determination of vanillin (VN) in different supporting mediums
For the detection of VN, the bare and green CuO/NiO/GCE were run in 60 µM solution of VN at 60 mV/s scan rate under the potential window (0.2–1.3 V). It can be easily visualized from Fig. 3(a) that CuO/NiO/GCE exhibited well resolved and enhanced anodic peak current (Ipa) response for VN. For effective and reliable determination of VN, each cycle was repeated five times (n = 5). The electrolytes are very important in electrochemical determination process of different analyte. Therefore, different electrolyte viz phosphate buffers (PBS), borate, Britton Robinson buffer (BRB) and NaOH were successfully exploited. The electrolytes play very crucial role in transformation of ions/proton that facilitate the determination process of analytes. The electrolytic experiment was conducted in 60 µM VN at 60 mV/s at CV mode. The Ipa responses of different CuO/NiO/GCE in electrolytes are displayed in Fig. 3(b). The maximum Ipa response of VN was examined in PBS electrolyte which facilitate better ion transformation and exhibited better Ipa response hence selected for pH experiment.

Optimization of parameters. (a) CV bare and modified electrodes in 60 µM VN and (b) Ipa response of VN in different supporting mediums at 60 mV/s.
Effect of pH and interferants
The effect of different analytes is usually carried out in different electrolytes that have variable pH values. The Ipa response of analytes are purely pH dependant, analytes manifest different peak potentials at different pH values. Thus, for the sensitive detection of VN, different pH values of PBS electrolyte from 3 to 9 were exploited. The pH study was conducted in acidic, neutral and basic medium to examined better and well resolved Ipa response of VN. The pH based Ipa response of VN are displayed in Fig. 4(a). The current response of VN enhanced as the pH increased from 3 to 6, while the enhanced Ipa response of VN was monitored at neutral pH 7. Further increase in the pH to basic medium did not favored the effective detection of VN. Thus, by observing this change, PBS pH 7 was optimized for determination of VN. The pH experiment of VN was conducted at 60 mV/s in 60 µM VN concentration. Moreover, the selectivity of green CuO/NiO/GCE was examined in different co-existing interferants such as vitamin C (VC), vitamin B6, hesperidin, naringin, K+ and Mg+2 ions. The two-fold concentration of interferants were added along with analyte at 60 mV/s in PBS electrolyte pH = 7. The Ipa response of VN and added interferants are shown in Fig. 4(b). The obtained CV results of VN and added interferants manifested that the fabricated green CuO/NiO/GCE is highly selective to the VN. While the modified CuO/NiO/GCE seemed passivated for other interferants which highlights the exceptional selectivity of proposed CuO/NiO/GCE for VN. The CV cycles for VN and interferants were repeated (n = 4).

Optimization of pH and selectivity. (a) pH-based oxidation responses of VN in 60 µM VN, (b) Ipa responses of VN and different interferants.
Scan rate and stability
Scan rate is very crucial parameter in modified sensors which confirms the adsorption-control process of modified sensor. To examine the effect of scan sweeps on the Ipa response of VN at proposed CuO/NiO/GCE, the scan rate study was carried out. The scan sweeps were increased from 10 to 90 mV/s in 60 µM VN in PBS electrolyte pH 7. The Ipa response of VN at different scan rates are highlighted in Fig. 5(a). By observing the change in scan rates from 10 to 90 mV/s, it was examine that by increasing scan rate, the Ipa response of VN linearly increased which symbolized that the fabricated CuO/NiO/GCE is adsorption control. For reliability of electrode each cycle was repeated four time (n = 4). The linearity in the Ipa responses of VN at CuO/NiO/GCE is displayed in Fig. 5(b). Linearity in current response was found R2 = 0.9925. Moreover, the stability study was successfully conducted. For the stability study, the engineered electrode was immersed in 40 µM VN and the cycles were repeated for (n = 25). After 25 cycles, the relative standard deviation was calculated that was found ≤5 % which witness excellent stability of CuO/NiO/GCE.

Scan rate study and stability. (a) Scan rate study of VN at CuO/NiO/GCE in PBS electrolyte pH 7 in 60 µM VN, (b) regression coefficient R2 = 0.9925.
Calibration
The calibration measurement of VN was carried out at fabricated CuO/NiO/GCE in PBS electrolyte pH 7 at differential pulse mode of voltammetry. For calibration study, the concentration range of VN analyte was kept as 0.01–70 μM at pulse amplitude 70 mV/s. The potential range was set from 0.2 to 1.1 V. By investigating the calibration measurement, it was observed that the engineered CuO/NiO/GCE exhibited well resolved linear response at increased concentration of VN from 0.01 to 70 µM as shown in Fig. 6(a). The linearity in current responses of VN at CuO/NiO/GCE was calculated as 0.9839 as displayed in Fig. 6(b). Moreover, through the slope of calibration curve, the limit of detection (LOD) and quantification limit (LOQ) were calculated respectively. The LOD of developed method for VN was found as 0.0087 µM and the LOQ was calculated 0.026 µM. For effectiveness, the LOD of proposed electrochemical sensor is compared with reported sensors used for the determination of VN. The comparison of CuO/NiO/GCE with reported sensors for the detection of VN is given in Table 1. By comparing the present method with reported sensor, it was examined that the proposed CuO/NiO/GCE is more effective and sensitive than the other reported electrochemical sensors.
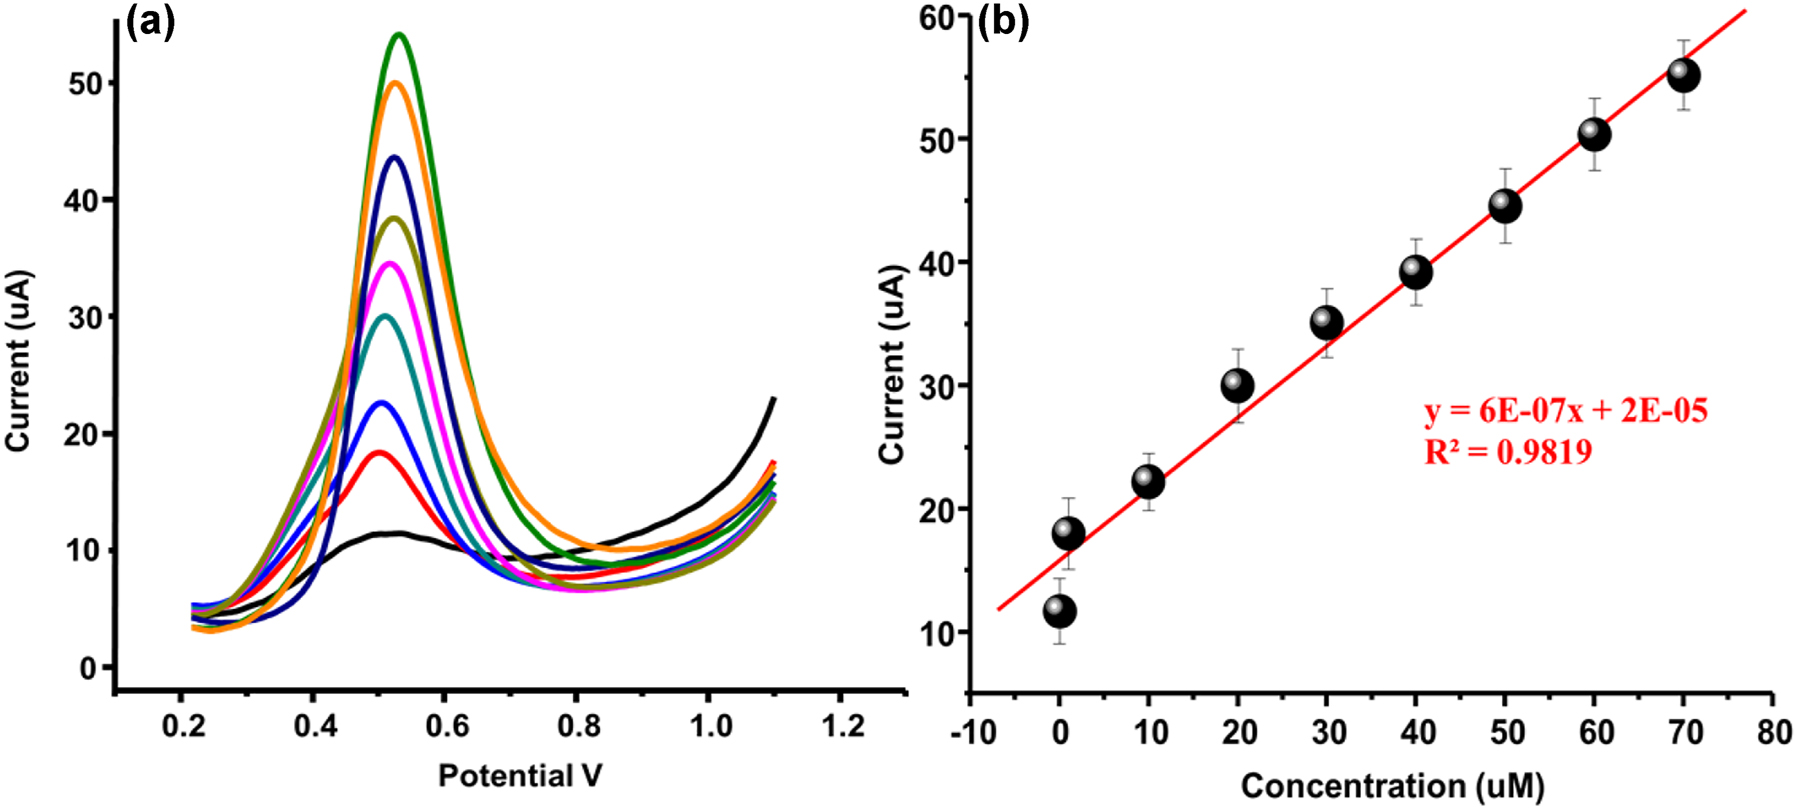
Calibration. (a) Calibration study under the concentration range from 0.01 to 70 µM, (b) regression coefficient R2 = 0.9839.
Comparison of CuO/NiO/GCE with reported sensor for detection of vanillin.
| Sensor | Techniques | LDR | LOD (µM) | Ref. |
|---|---|---|---|---|
| AuNP-PAH/GCE | SWV | 0.90–15.0 µmolL−1 | 55 nmolL−1 | [44] |
| Al-TiO2NPs/SPCE | CV/LSV | 0.07–20 µM | 0.02 | [45] |
| CNT/SPE | CV | 2.5–750 µM | 1.03 | [46] |
| ATT-Au modified electrode | DPV/CV | 1.1–76.4 µM | 0.19 | [47] |
| Au/F-rGO/GCE | CV/DPV | 1.0–150 µM | 0.15 | [48] |
| Aptamer-AuNPs/Fc-KB/ZIF-8@GCE | SWV | 10 nM–0.2 mM | 0.003 | [49] |
| GR-PVP/ABPE | CV | 40–100 µM | 0.01 | [7] |
| AuNPs-GQDs/Nafion/SPEC | DPV/LSV | 0.66–33 µM | 0.32 | [50] |
| MoS2-GNF/GCE | CV | 0.3–135 µM | 0.15 | [51] |
| CoS NR@Nafion/GCE | DPV | 0.5–56 µM | 0.07 | [52] |
| Au–Ag alloy/GCE | SWV | 0.2–50 µM | 0.04 | [53] |
| MnO2 NWs-rGO/GCE | CV | 20–100 µM | 0.006 | [54] |
| MWCNTs/GCE | DPV | 4.15–294.12 µM | 3.44 | [55] |
| Poly(Arginine)/CNTPE | LSV/CV/DPV | 2 × 10⁻⁶–1 × 10⁻⁵ M | 0.033 | [56] |
| CeO2/ERGO/GCE | CV/SDLSV | 20–100 µM | 0.01 | [57] |
| CPE/CdO/SWCNTs/DPIB | SWV | 0.03–800.0 µM | 0.009 | [58] |
| CuO/NiO/GCE | CV/DPV | 0.01–70 µM | 0.0087 | This work |
Analytical application
The analytical applicability of proposed CuO/NiO/GCE was tested in different ice-cream and chocolate samples purchased from local market of Jamshoro, Sindh Pakistan. For real application, three samples of ice-cream and two samples of chocolates were purchased and brought to the laboratory. For preparation of real samples, the ice-cream and chocolate samples were dissolved in DI water and then filtered through Whatman filter paper to get clear solution. Afterwards, the filtered solutions were exploited for real sample experiment. A 10 mL volume capacity electrochemical cell was used in experiment by keeping the ratio 9:1 of PBS electrolyte and real samples. The standard addition method was exploited for the analysis of VN in ice-cream and chocolate samples. The percent recovery and relative standard deviation RSD values of ice-cream and chocolate samples are given in Tables 2 and 3.
Real application of CuO/NiO/GCE in ice-cream sample.
| Sample | Added (µM) | Detected (µM) | (%) Recovery | (%) RSD (n = 4) |
|---|---|---|---|---|
| 0 | 2.76 | – | 2.21 | |
| 10 | 9.91 | 99.1 | 3.11 | |
| Vanilla | 20 | 19.8 | 99.0 | 4.23 |
| 30 | 30.2 | 100.6 | 2.42 | |
| 0 | 0.57 | – | 3.55 | |
| 10 | 10.3 | 103 | 3.38 | |
| Poodle Moo | 20 | 20.1 | 100.5 | 2.13 |
| 30 | 19.8 | 99.0 | 3.67 | |
| 0 | 0 | – | – | |
| 10 | 9.7 | 97.0 | 3.92 | |
| Cornetto | 20 | 19.7 | 98.5 | 3.49 |
| 30 | 29.6 | 98.6 | 3.99 |
Real application of CuO/NiO/GCE in chocolate sample.
| Sample | Added (µM) | Detected (µM) | (%) Recovery | (%) RSD (n = 4) |
|---|---|---|---|---|
| 0 | 0.28 | – | 3.64 | |
| 10 | 10.1 | 101 | 4.73 | |
| Delight | 20 | 19.9 | 99.5 | 3.39 |
| 30 | 30.4 | 101.3 | 4.23 | |
| 0 | 0 | – | – | |
| 10 | 9.45 | 94.5 | 4.18 | |
| Dairy Milk | 20 | 19.6 | 98.3 | 2.15 |
| 30 | 29.8 | 99.3 | 4.76 |
Conclusion
In summary, the green engineering of CuO/NiO nanocomposite was carried out by using fresh green leaves’ extract of Java plum plant. The plant leaves contain different phenolic compounds and phytochemicals which acted as reducing/capping agent for the preparation of CuO/NiO nanocomposite. The engineered nanocomposite was characterized via XRD, FTIR and TEM for confirmation of stretching vibration, crystalline structure and 2D internal morphology of CuO/NiO nanocomposite. The circuit fitted EIS Nyquist plot confirmed ohmic resistance as 593 and 4653 Ω for bare and CuO/NiO/GCE. Prepared CuO/NiO/GCE based electrocatalyst was exploited for the determination of VN in two different food samples. Under the LDR from 0.01 to 70 μM at 70 mV/s pulse amplitude, the fabricated modified electrode exhibited exceptional response for VN. The LOD and LOQ of developed method for VN were found 0.0087 and 0.026 µM. Moreover, the analytical application of prepared CuO/NiO/GCE was tested in ice-cream and chocolates samples. The acceptable recovery results witness the reliability of engineered electrode in real samples.
Funding source: Sindh Higher Education Commission
Award Identifier / Grant number: SHEC/SRSP/APS-3/3/2020-21
Acknowledgement
We sincerely thank the Sindh Higher Education Commission, Govt. of Sindh, Pakistan for providing us funds to conduct this important research under the project Code: “SHEC/SRSP/APS-3/3/2020-21”.
-
Research funding: This work was funded by Sindh Higher Education Commission, Govt. of Sindh, Pakistan under the project Code: “SHEC/SRSP/APS-3/3/2020-21”.
-
Conflict of interest: All authors declare no conflict of interest.
References
[1] N. J. Walton, M. J. Mayer, A. Narbad. Phytochemistry 63, 505 (2003), https://doi.org/10.1016/s0031-9422(03)00149-3.Search in Google Scholar PubMed
[2] A. A. Gabriel, A. M. P. Tongco, A. A. BarnesJr. Food Control 71, 117 (2017), https://doi.org/10.1016/j.foodcont.2016.06.026.Search in Google Scholar
[3] Z. Yazan, S. Erden, E. Dinç. J. Electroanal. Chem. 826, 133 (2018), https://doi.org/10.1016/j.jelechem.2018.07.047.Search in Google Scholar
[4] A. K. Sinha, U. K. Sharma, N. Sharma. Int. J. Food Sci. Nutr. 59, 299 (2008), https://doi.org/10.1080/09687630701539350.Search in Google Scholar PubMed
[5] M. Takahashi, Y. Inai, N. Miyazawa, Y. Kurobayashi, A. Fujita. Biosci., Biotechnol., Biochem. 77, 601 (2013), https://doi.org/10.1271/bbb.120840.Search in Google Scholar PubMed
[6] A. Kuznetsov, N. Komarova, M. Andrianova, V. Grudtsov, E. Kuznetsov. Microchim. Acta 185, 1 (2018), https://doi.org/10.1007/s00604-017-2586-4.Search in Google Scholar PubMed
[7] P. Deng, Z. Xu, R. Zeng, C. Ding. Food Chem. 180, 156 (2015), https://doi.org/10.1016/j.foodchem.2015.02.035.Search in Google Scholar PubMed
[8] Y. Ni, G. Zhang, S. Kokot. Food Chem. 89, 465 (2005), https://doi.org/10.1016/j.foodchem.2004.05.037.Search in Google Scholar
[9] J. Zhu, D. Chen, Y. Ai, X. Dang, J. Huang, H. Chen. Microchim. Acta 184, 1161 (2017), https://doi.org/10.1007/s00604-017-2107-5.Search in Google Scholar
[10] Z. Wang, G. Zeng, X. Wei, B. Ding, C. Huang, B. Xu. Food Anal. Methods 9, 3360 (2016), https://doi.org/10.1007/s12161-016-0520-8.Search in Google Scholar
[11] M. Shu, Y. Man, H. Ma, F. Luan, H. Liu, Y. Gao. Food Anal. Methods 9, 1706 (2016), https://doi.org/10.1007/s12161-015-0347-8.Search in Google Scholar
[12] L. S. de Jager, G. A. Perfetti, G. W. Diachenko. J. Chromatogr. A 1145, 83 (2007), https://doi.org/10.1016/j.chroma.2007.01.039.Search in Google Scholar PubMed
[13] L. S. De Jager, G. A. Perfetti, G. W. Diachenko. Food Chem. 107, 1701 (2008), https://doi.org/10.1016/j.foodchem.2007.09.070.Search in Google Scholar
[14] J. A. Buledi, A. R. Solangi, A. Hyder, N. H. Khand, S. A. Memon, A. Mallah, N. Mahar, E. N. Dragoi, P. Show, M. Behzadpour. Food Chem. Toxicol. 165, 113177 (2022), https://doi.org/10.1016/j.fct.2022.113177.Search in Google Scholar PubMed
[15] J. J. A. Buledi, A. R. Solangi, A. Hyder, M. Batool, N. Mahar, A. Mallah, H. Karimi-Maleh, O. Karaman, C. Karaman, M. Ghalkhani. Environ. Res. 212, 113372 (2022), https://doi.org/10.1016/j.envres.2022.113372.Search in Google Scholar PubMed
[16] A. Hyder, S. S. Memon, S. Memon, D. B. Rajpar, S. G. Shaikh, J. A. Buledi. Microchem. J. 163, 105908 (2021), https://doi.org/10.1016/j.microc.2020.105908.Search in Google Scholar
[17] G. Ziyatdinova, E. Kozlova, E. Ziganshina, H. Budnikov. Monatsh. Chem. – Chem. Mon. 147, 191 (2016), https://doi.org/10.1007/s00706-015-1559-8.Search in Google Scholar
[18] J. A. Buledi, A. R. Solangi, A. Mallah, S. S. Hassan, S. T. H. Sherazi, M. R. Shah. J. Mater. Sci. Mater. Electron. 34, 618 (2023), https://doi.org/10.1007/s10854-023-10061-1.Search in Google Scholar
[19] J. A. Buledi, A. R. Solangi, A. Mallah, S. S. Hassan, S. Ameen, C. Karaman, H. Karimi-Maleh. Ind. Eng. Chem. Res. 64, 1–16 (2023), https://doi.org/10.1021/acs.iecr.2c04091.Search in Google Scholar
[20] F. D. Guerra, M. L. Campbell, D. C. Whitehead, F. Alexis. ChemistrySelect 2, 9889 (2017), https://doi.org/10.1002/slct.201701736.Search in Google Scholar
[21] J. Singh, T. Dutta, K.-H. Kim, M. Rawat, P. Samddar, P. Kumar. J. Nanobiotechnol. 16, 1 (2018), https://doi.org/10.1186/s12951-018-0408-4.Search in Google Scholar PubMed PubMed Central
[22] M. L. Campbell, F. D. Guerra, J. Dhulekar, F. Alexis, D. C. Whitehead. Chem. – Eur. J. 21, 14834 (2015), https://doi.org/10.1002/chem.201502021.Search in Google Scholar PubMed
[23] J. A. Buledi, S. Amin, S. I. Haider, M. I. Bhanger, A. R. Solangi. Environ. Sci. Pollut. Res. 28, 58994 (2021), https://doi.org/10.1007/s11356-020-07865-7.Search in Google Scholar PubMed
[24] F. H. Khan. Orient. J. Chem. 29, 1399 (2013), https://doi.org/10.13005/ojc/290415.Search in Google Scholar
[25] J. A. Buledi, N. Mahar, A. Mallah, A. R. Solangi, I. M. Palabiyik, N. Qambrani, F. Karimi, Y. Vasseghian, H. Karimi-Maleh. Food Chem. Toxicol. 161, 112843 (2022), https://doi.org/10.1016/j.fct.2022.112843.Search in Google Scholar PubMed
[26] S. Cheraghi, M. A. Taher, H. Karimi-Maleh, F. Karimi, M. Shabani-Nooshabadi, M. Alizadeh, A. Al-Othman, N. Erk, P. K. Y. Raman, C. Karaman. Chemosphere 287, 132187 (2022), https://doi.org/10.1016/j.chemosphere.2021.132187.Search in Google Scholar PubMed
[27] D. Zhang, X.-L. Ma, Y. Gu, H. Huang, G.-W. Zhang. Front. Chem. 8, 799 (2020), https://doi.org/10.3389/fchem.2020.00799.Search in Google Scholar PubMed PubMed Central
[28] V. Kalpana, V. Devi Rajeswari. Bioinorgan. Chem. Appl. 2018, 3569758 (2018), https://doi.org/10.1155/2018/3569758.Search in Google Scholar PubMed PubMed Central
[29] S. Ahmad, S. Munir, N. Zeb, A. Ullah, B. Khan, J. Ali, M. Bilal, M. Omer, M. Alamzeb, S. M. Salman. Int. J. Nanomed. 14, 5087 (2019), https://doi.org/10.2147/ijn.s200254.Search in Google Scholar
[30] A. E. D. Mahmoud, K. M. Al-Qahtani, S. O. Alflaij, S. F. Al-Qahtani, F. A. Alsamhan. Sci. Rep. 11, 1 (2021), https://doi.org/10.1038/s41598-021-91093-7.Search in Google Scholar PubMed PubMed Central
[31] N.-D. Jaji, H. L. Lee, M. H. Hussin, H. M. Akil, M. R. Zakaria, M. B. H. Othman. Nanotechnol. Rev. 9, 1456 (2020), https://doi.org/10.1515/ntrev-2020-0109.Search in Google Scholar
[32] J. A. Buledi, S. Ameen, S. A. Memon, A. Fatima, A. R. Solangi, A. Mallah, F. Karimi, S. Malakmohammadi, S. Agarwal, V. K. Gupta. Open Chem. 19, 481 (2021), https://doi.org/10.1515/chem-2021-0029.Search in Google Scholar
[33] J. A. Buledi, A. R. Solangi, S. Q. Memon, S. I. Haider, S. Ameen, N. H. Khand, A. Bhatti, N. Qambrani. Langmuir 37, 3214 (2021), https://doi.org/10.1021/acs.langmuir.1c00165.Search in Google Scholar PubMed
[34] S. Panhwar, J. A. Buledi, D. Mal, A. R. Solangi, A. Balouch, A. Hyder. Curr. Anal. Chem. 17, 1169 (2021), https://doi.org/10.2174/1573411017999201125124513.Search in Google Scholar
[35] M. Ismail, M. Khan, S. B. Khan, M. A. Khan, K. Akhtar, A. M. Asiri. J. Mol. Liq. 260, 78 (2018), https://doi.org/10.1016/j.molliq.2018.03.058.Search in Google Scholar
[36] H. Baksh, J. A. Buledi, N. H. Khand, A. R. Solangi, A. Mallah, S. T. Sherazi, M. I. Abro. Monatsh. Chem. – Chem. Mon. 151, 1689 (2020), https://doi.org/10.1007/s00706-020-02704-4.Search in Google Scholar
[37] M. Nasrollahzadeh, M. Sajjadi, H. Komber, H. A. Khonakdar, S. M. Sajadi. Appl. Organomet. Chem. 33, e4938 (2019), https://doi.org/10.1002/aoc.4938.Search in Google Scholar
[38] O. Kanoun, T. Lazarević-Pašti, I. Pašti, S. Nasraoui, M. Talbi, A. Brahem, A. Adiraju, E. Sheremet, R. D. Rodriguez, M. Ben Ali. Sensors 21, 4131 (2021), https://doi.org/10.3390/s21124131.Search in Google Scholar PubMed PubMed Central
[39] L. Lu, X. Hu, Z. Zhu, D. Li, S. Tian, Z. Chen. J. Electrochem. Soc. 167, 037512 (2019), https://doi.org/10.1149/2.0122003jes.Search in Google Scholar
[40] H. Karimi-Maleh, F. Karimi, M. Alizadeh, A. L. Sanati. Chem. Rec. 20, 682 (2020).10.1002/tcr.201900092Search in Google Scholar PubMed
[41] H. Karimi-Maleh, Y. Orooji, F. Karimi, M. Alizadeh, M. Baghayeri, J. Rouhi, S. Tajik, H. Beitollahi, S. Agarwal, V. K. Gupta. Biosens. Bioelectron. 184, 113252 (2021), https://doi.org/10.1016/j.bios.2021.113252.Search in Google Scholar PubMed
[42] H. Karimi-Maleh, A. Khataee, F. Karimi, M. Baghayeri, L. Fu, J. Rouhi, C. Karaman, O. Karaman, R. Boukherroub. Chemosphere 291, 132928 (2022), https://doi.org/10.1016/j.chemosphere.2021.132928.Search in Google Scholar PubMed
[43] H. Karimi-Maleh, F. Karimi, L. Fu, A. L. Sanati, M. Alizadeh, C. Karaman, Y. Orooji. J. Hazard. Mater. 423, 127058 (2022), https://doi.org/10.1016/j.jhazmat.2021.127058.Search in Google Scholar PubMed
[44] T. R. Silva, D. Brondani, E. Zapp, I. Cruz Vieira. Electroanalysis 27, 465 (2015), https://doi.org/10.1002/elan.201400517.Search in Google Scholar
[45] K. Murtada, S. Jodeh, M. Zougagh, Á. Ríos. Electroanalysis 30, 969 (2018), https://doi.org/10.1002/elan.201800032.Search in Google Scholar
[46] L. Chen, K. Chaisiwamongkhol, Y. Chen, R. G. Compton. Electroanalysis 31, 1067 (2019), https://doi.org/10.1002/elan.201900037.Search in Google Scholar
[47] T. T. Calam, D. Uzun. Electroanalysis 31, 2347 (2019), https://doi.org/10.1002/elan.201900328.Search in Google Scholar
[48] V. S. Manikandan, E. Boateng, S. Durairaj, A. Chen. Foods 11, 1448 (2022), https://doi.org/10.3390/foods11101448.Search in Google Scholar PubMed PubMed Central
[49] Y. Sun, X. Jiang, H. Jin, R. Gui. Anal. Chim. Acta 1083, 101 (2019), https://doi.org/10.1016/j.aca.2019.07.027.Search in Google Scholar PubMed
[50] N. Sirdesai, T. Singh, P. Ranjith, R. Singh. Rock Mech. Rock Eng. 50, 205 (2017), https://doi.org/10.1007/s00603-016-1047-4.Search in Google Scholar
[51] M. Qianwen, D. Yaping, L. Li, W. Anqing, D. Dingding, Z. Yijun. J. Electroanal. Chem. 833, 297 (2019), https://doi.org/10.1016/j.jelechem.2018.09.040.Search in Google Scholar
[52] M. Sivakumar, M. Sakthivel, S.-M. Chen. J. Colloid Interface Sci. 490, 719 (2017), https://doi.org/10.1016/j.jcis.2016.11.094.Search in Google Scholar PubMed
[53] D. Zheng, C. Hu, T. Gan, X. Dang, S. Hu. Sensor. Actuator. B Chem. 148, 247 (2010), https://doi.org/10.1016/j.snb.2010.04.031.Search in Google Scholar
[54] Y. Tian, P. Deng, Y. Wu, J. Liu, J. Li, G. Li, Q. He. Microchem. J. 157, 104885 (2020), https://doi.org/10.1016/j.microc.2020.104885.Search in Google Scholar
[55] I. Kouhi, G. Parvizi Fard, E. Alipour, A. Saadatirad. J. Food Process. Preserv. 46, e16289 (2022), https://doi.org/10.1111/jfpp.16289.Search in Google Scholar
[56] E. S. D’Souza, J. Manjunatha, C. Raril, G. Tigari, D. K. Ravishankar, S. Fattepur. J. Mater. Environ. Sci. 11, 512 (2020).Search in Google Scholar
[57] X. Nie, R. Zhang, Z. Tang, H. Wang, P. Deng, Y. Tang. Nanomaterials 10, 1356 (2020), https://doi.org/10.3390/nano10071356.Search in Google Scholar PubMed PubMed Central
[58] S. Cheraghi, M. A. Taher, H. Karimi-Maleh. J. Food Compos. Anal. 62, 254 (2017), https://doi.org/10.1016/j.jfca.2017.06.006.Search in Google Scholar
© 2023 IUPAC & De Gruyter. This work is licensed under a Creative Commons Attribution-NonCommercial-NoDerivatives 4.0 International License. For more information, please visit: http://creativecommons.org/licenses/by-nc-nd/4.0/
Articles in the same Issue
- Frontmatter
- In this issue
- Preface
- Preface for special issue of ICGC-9 in Athens, Greece
- Conference papers
- HOME-Chemistry: hydrazone as organo-metallic equivalent
- Towards lignin valorization: lignin as a UV-protective bio-additive for polymer coatings
- How the physio-chemical properties of char from the pyrolysis of Automotive Shredder Residue (ASR) influences its future uses
- Plant based fabrication of CuO/NiO nanocomposite: a green approach for low-level quantification of vanillin in food samples
- Synthesis and characterization of new polycarbonates free of bisphenol A components (BPA-free) based on dimethyl/diphenyl carbonate and diphenylmethane derivative
- Adsorption capacity of biocarbons from residue of supercritical extraction of raw plants
- Cd(II) and As(V) removal from the multicomponent solutions in the presence of ionic polymers using carbonaceous adsorbents obtained from herbs
- Synthesis and thermal characterization of composites based on Epidian 601 with flame retardants compounds
- A green sorptive extraction method (HiSorb-TD-GC-MS) for determining the extra virgin olive oil (EVOO) aroma profile
- Synthesis, aging and antimicrobial tests of (di)acrylate composites