
Raman spectra of MCl-Ga2S3-GeS2 (M = Na, K, Rb) glasses
-
Maria Bokova

 ,
Alla Paraskiva
,
Alla Paraskiva

Abstract
Raman spectra of (MY) x (Ga2S3)0.2−0.2x (GeS2)0.8−0.8x pseudo-ternary glassy systems (M = Na, K, Rb; Y = Cl, Br, I) were investigated systematically as a function of MY nature and alkali content. Raman spectroscopy of the Ga3S3-GeS2 glassy matrix shows a complicated local structure: corner-sharing CS- and edge-sharing ES-GeS4/2 tetrahedra, Ga-S triclusters and ETH-Ga2S6/2 ethane-like units. The Ga2S6/2 population decreases with increasing x related to a substitution of some bridging sulfur atoms around central Ga by terminal Y species with a respective decrease of the network rigidity. The formation of mixed Ga-(S,Y) environment is affected by the M+ ion size and the MY concentration.
Introduction
Alkali halide doped sulfide and selenide glasses are promising functional materials for optical applications, portable ion sources, electronic devices and reliable chemical sensors [1], [2], [3], [4], [5]. However, the systematic studies of these glasses as a function of the cation nature and the content of alkali halide are limited. Recently, we have investigated the glass-forming regions and macroscopic properties in the MY-Ga2S3-GeS2 systems (M = Na, K, Rb; Y = Cl, Br, I) [6, 7]. The structural analysis is necessary for a better understanding of the properties of glass.
Raman scattering is a very powerful spectroscopic technique for detecting the local order in the amorphous solids. Several Raman spectroscopy studies have been carried out in lithium, potassium and caesium halide doped Ga2S3-GeS2 glasses [8], [9], [10], [11], [12], [13], [14], [15], [16], [17], [18] but only few reports are devoted to sodium and rubidium containing counterparts [19], [20], [21]. It is generally accepted that the incorporation of metal halides into chalcogenide glassy matrix does not change the Raman spectra significantly. Nevertheless, the comparative study of the Raman spectra in the alkali halide doped Ga2S3-GeS2 glasses is still missing and deserves to be carried out.
In this paper we present the structural analysis of the (MCl) x (Ga2S3)0.2−0.2x (GeS2)0.8−0.8x glasses (M = Na, K, Rb) using Raman spectroscopy. The main reason to choose this composition line is the constant Ga2S3/GeS2 ratio in the host matrix whatever the amount of the incorporated salt. Thus, the only effect of MY addition on the (Ga2S3)0.2(GeS2)0.8 glass is observed. In the case of sodium containing glasses, the compositions with 30 mol% NaBr and NaI are also investigated. The main purpose of this work is to compare the Raman spectra of Ga2S3-GeS2 glass doped with light and heavy alkali halides of different concentrations.
Materials and methods
Preparation and macroscopic characterization of glasses
Chalcohalide glasses in the (MY) x (Ga2S3)0.2−0.2x (GeS2)0.8−0.8x systems (0.0 ≤ x ≤ 0.25; M = Na, K, Rb; Y = Cl, Br, I) were prepared by classical melt quenching from high purity Ga, Ge and S elements (5N) and alkali halide (NaCl, NaBr, NaI, KCl and RbCl of 4N). The mixtures of 3 g were sealed in quartz ampoules (8 mm ID, 10 mm OD) under vacuum (10−6 mbar). The batches were heated at a rate of 1 °C min−1 to 950 °C, homogenized at this temperature for a few days, and then quenched in cold water. Further details of the glass synthesis and characterization by density, glass transition temperatures and electrical conductivity measurements are published in our previous papers [6, 7].
Raman spectroscopy measurements
The Raman spectra of the glasses were obtained by using a LABRAM Dilor spectrometer (Jobin Yvon Horiba Group) in the 70–1200 cm−1 spectral range and a resolution of 1 cm−1. The scattering was excited by a 632.8 nm He–Ne laser. Each spectrum was recorded at room temperature using a power level between 0.15 mW and 1.5 mW. The acquisition time varied between 60 and 300 s. Several spectra were registered for each sample at different positions and different amounts of laser power in order to verify the sample homogeneity and the absence of photo-induced phenomena.
Results and discussion
All the measured raw Raman spectra were analyzed over the 70–600 cm−1 range. The spectral background was approximated by a Voigt function and then subtracted from the experimental data with further normalization to the most intense feature. Typical raw Raman spectra treatment is shown in Fig. S1 (Supplementary Material). The resulting Raman spectra of the (NaCl) x (Ga2S3)0.2−0.2x (GeS2)0.8−0.8x glasses, 0.0 ≤ x ≤ 0.25, are shown in Fig. 1(a). The Raman spectra of the vitreous matrix (Ga2S3)0.2(GeS2)0.8 and (NaY)0.3(Ga2S3)0.14(GeS2)0.56 glasses, where Y = Br or I, are visualised in Figs. 2 and 3. The results for the potassium (0.0 ≤ x ≤ 0.30) and rubidium (0.0 ≤ x ≤ 0.40) containing counterparts are presented in Figs. 4 and 5, respectively. Before discussing the structural changes in glassy matrix (Ga2S3)0.2(GeS2)0.8 related to alloying with alkali halides, it seems reasonable to understand what happens in glassy GeS2 network with Ga2S3 additions.
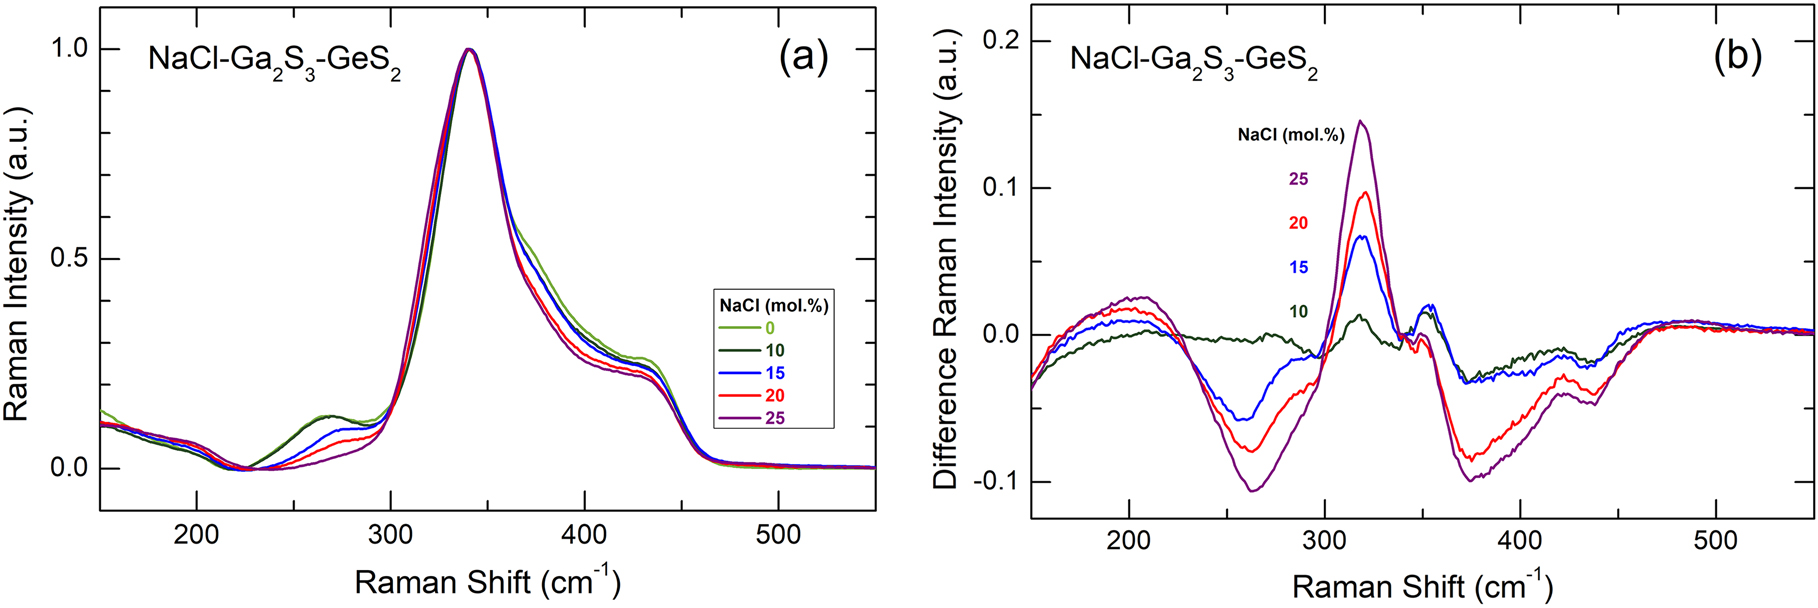
(a) Experimental Raman spectra of (NaCl) x (Ga2S3)0.2−0.2x (GeS2)0.8−0.8x glasses, 0.0 ≤ x ≤ 0.25; (b) the difference Raman spectra of NaCl-containing glasses obtained by subtraction of the spectrum for vitreous matrix (Ga2S3)0.2(GeS2)0.8.
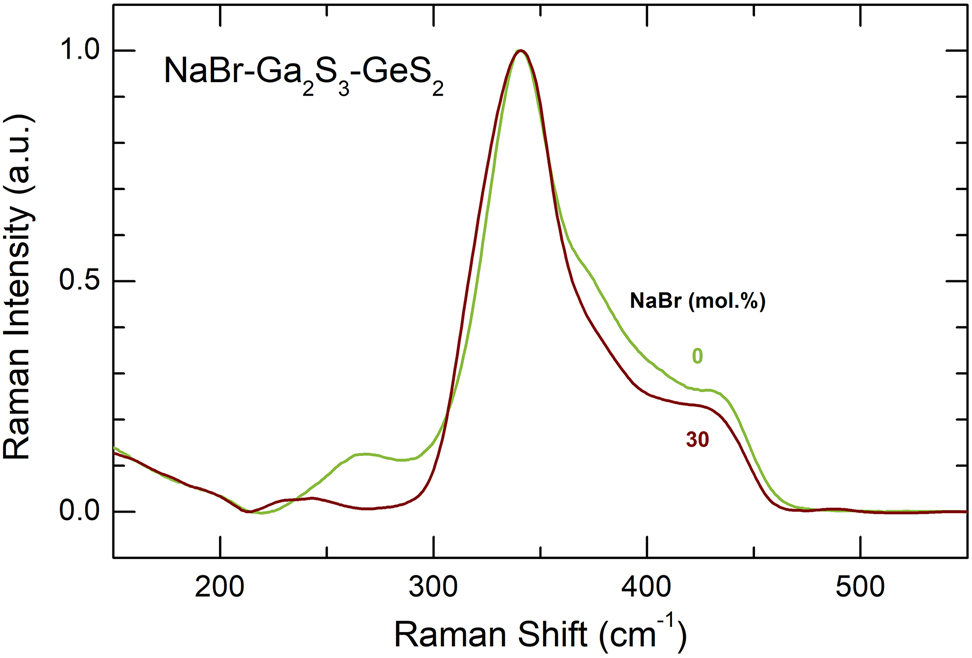
Experimental Raman spectra of pure glassy matrix (Ga2S3)0.2(GeS2)0.8 and a NaBr-Ga2S3-GeS2 glass containing 30 mol% NaBr.
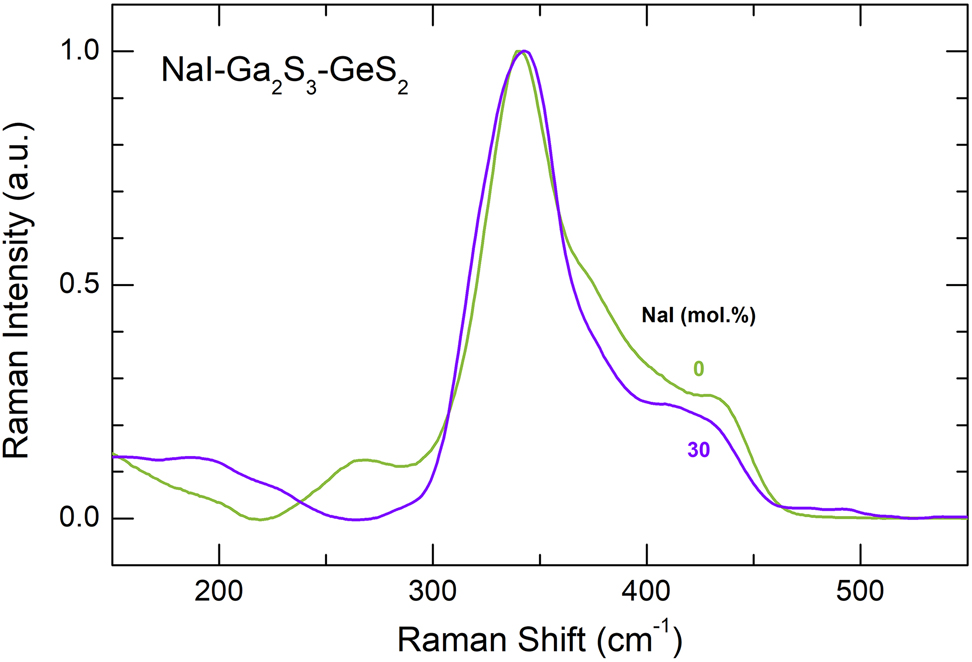
Experimental Raman spectra of pure glassy matrix (Ga2S3)0.2(GeS2)0.8 and a NaI-Ga2S3-GeS2 glass containing 30 mol% NaI.
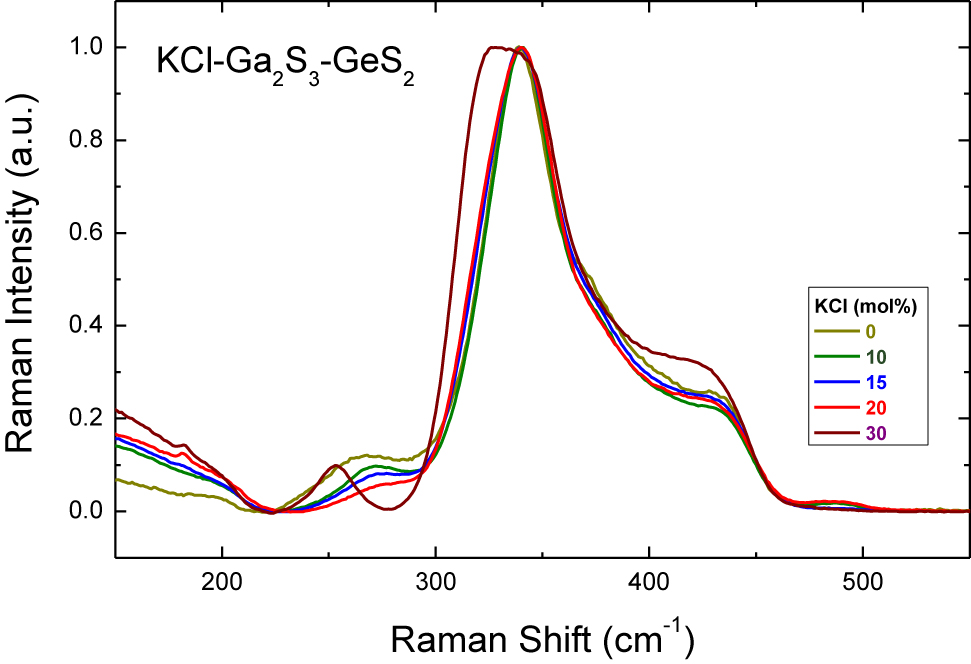
Experimental Raman spectra of (KCl) x (Ga2S3)0.2−0.2x (GeS2)0.8−0.8x glasses, 0.0 ≤ x ≤ 0.30.
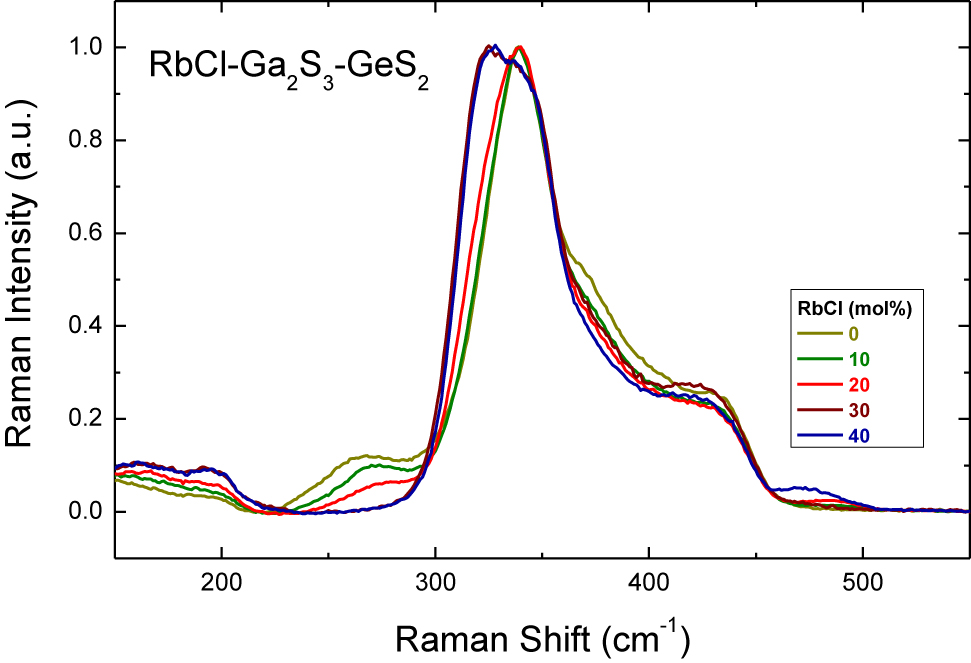
Experimental Raman spectra of (RbCl) x (Ga2S3)0.2−0.2x (GeS2)0.8−0.8x glasses, 0.0 ≤ x ≤ 0.40.
Fig. 6(a) shows the Raman spectra of g-GeS2 (taken from [22]) and vitreous matrix (Ga2S3)0.2(GeS2)0.8. Gallium sulphide broadens the entire spectrum and slightly shifts to lower frequencies the main spectroscopic feature of glassy GeS2, the
![Fig. 6:
Experimental Raman spectra of (a) glassy GeS2 [22] and (Ga2S3)0.2(GeS2)0.8, and (b) glassy GeS2 [22] and (GeS)0.1(GeS2)0.9 [28].](/document/doi/10.1515/pac-2021-0702/asset/graphic/j_pac-2021-0702_fig_006.jpg)
![Fig. 7:
Experimental Raman spectra of (a) glassy GeS2 [22] and (Ga2S3)0.2(GeS2)0.8, and (b) glassy GeS2 [22] and (GeS)0.1(GeS2)0.9 [28] (detail).](/document/doi/10.1515/pac-2021-0702/asset/graphic/j_pac-2021-0702_fig_007.jpg)
The origin of the Ga-S triclusters, i.e., the structural units containing three-fold coordinated sulfur, is directly related to tetrahedral gallium coordination and Ga2S3 stoichiometry. Two tetrahedral Ga atoms are forming 8 Ga–S bonds. Consequently, three sulfur species should have the average S-Ga coordination
![Fig. 8:
Lattice and structural motifs in monoclinic Ga2S3 [29]: (a) selected two-fold S2F and three-fold S3F coordinated sulfur species in the lattice are indicated by red circles, (b) a Ga-S tricluster, (c) a corner-sharing CS-Ga2S7 dimer.](/document/doi/10.1515/pac-2021-0702/asset/graphic/j_pac-2021-0702_fig_008.jpg)
Lattice and structural motifs in monoclinic Ga2S3 [29]: (a) selected two-fold S2F and three-fold S3F coordinated sulfur species in the lattice are indicated by red circles, (b) a Ga-S tricluster, (c) a corner-sharing CS-Ga2S7 dimer.
Nevertheless, the origin of homopolar Ga–Ga bonds and the 270 cm−1 stretching mode remains unclear in stoichiometric Ga2S3-GeS2 glasses, except for a possible rather weak chemical disorder. We should note that the Ga-S triclusters are over-coordinated,
where (Ga2S3)* represents the average structure with ⅔ of Ga-S triclusters, should depend from the glass chemical composition, synthesis temperature and quenching rate. The observed differences in the amplitude of the 270 cm−1 mode, reported by different research groups [19, 32, 33], are consistent with this suggestion.
The Raman spectra of NaY-Ga2S3-GeS2 glassy alloys (Y = Cl, Br, I), Figs. 1 –3, exhibit similar composition trends: (i) the Ga–Ga stretching mode at 270 cm−1 decreases with increasing sodium halide content x; (ii) a new feature at ≈320 cm−1 emerges and grows with x; and (iii) broad unresolved high-frequency modes at ≈380 cm−1 and ≈435 cm−1 are also decreasing. The difference spectra in Fig. 1(b) reveal clearly these composition trends. The halogen nature does not affect significantly the Raman spectra of the glasses.
The 270 cm−1 and partly ≈380 cm−1 modes belong to the ETH-Ga2S6/2 units decreasing with increasing x. A fraction of the last poorly resolved feature is related to symmetric and asymmetric Ga-S stretching in the ethane-like units [28]. The 435 cm−1 peak seems to be the high-frequency
The emerging and growing ≈320 cm−1 feature seems to be related to Ga–Cl stretching in mixed GaCl m S4-m tetrahedra, where m = 1 or 2. Similar modes were reported for CsAlSCl2 (at 325 cm−1) and CsGaSCl2 (at 315 cm−1) glasses and attributed to vibrations in the m = 2 mixed tetrahedra, forming corner-sharing chains (CS-ACl2S2/2) k , where A = Al or Ga [34]. Later, similar hypothesis was formulated for MCl-Ga2S3 glasses [19], where M = Ag, Tl, Rb, and Cs, but for different tetrahedral stoichiometry, GaClS3/2, i.e., m = 1. Neutron and high-energy X-ray diffraction as well as the DFT modelling of Raman spectra were used to verify the gallium local environment in the CsCl-Ga2S3 glasses [13, 35], essentially confirming the m ≈ 1 stoichiometry.
The suggested appearance of the mixed GaYS3/2 tetrahedra in the NaY-Ga2S3-GeS2 glasses compensates the excessive rigidity of Ga-S triclusters without their transformation into ETH-Ge2S6/2, since the average coordination in the mixed tetrahedron,
The Raman spectra of potassium and rubidium chloride doped Ga2S3-GeS2 glasses, Figs. 4 and 5, follow the similar changes with the increase of MCl molar content: the peak at ≈270 cm−1 attributed to the ETH-Ga2S6/2 units decreases in intensity and a ≈320 cm−1 feature related to the mixed GaClS3/2 tetrahedra emerges and grows with x. It should be noted that the glass-forming region in the NaY-Ga2S3-GeS2 systems broadens with the increasing alkali radius and the largest amount of dissolved alkali halide can be reached in the (MCl) x (Ga2S3)0.2−0.2x (GeS2)0.8−0.8x systems (M = Na, K, Rb) for rubidium-doped glasses with 40 mol% RbCl [7]. Moreover, it is generally assumed that MY additions interact essentially with Ga2S3 in the pseudo-ternary MY-Ga2S3-GeS2 glasses. Consequently, the gradual changes in the relative intensity of the peak at ≈320 cm−1 can be seen clearly in Raman spectra for cation-rich glasses from 25 mol% NaCl to 40 mol% RbCl. In the case of (RbCl)0.4(Ga2S3)0.12(GeS2)0.48 composition, Ga–Cl stretching in mixed GaClS3/2 tetrahedra becomes the most intense spectral feature, Fig. 9. The same spectral evolution was observed for (CsCl) x (Ga2S3)25(GeS2)75−x glasses [14]. The dominant GeS2 peak at ≈340 cm−1 broadens as the CsCl content increases over 20 mol% in the system and separates at 40 mol% CsCl.
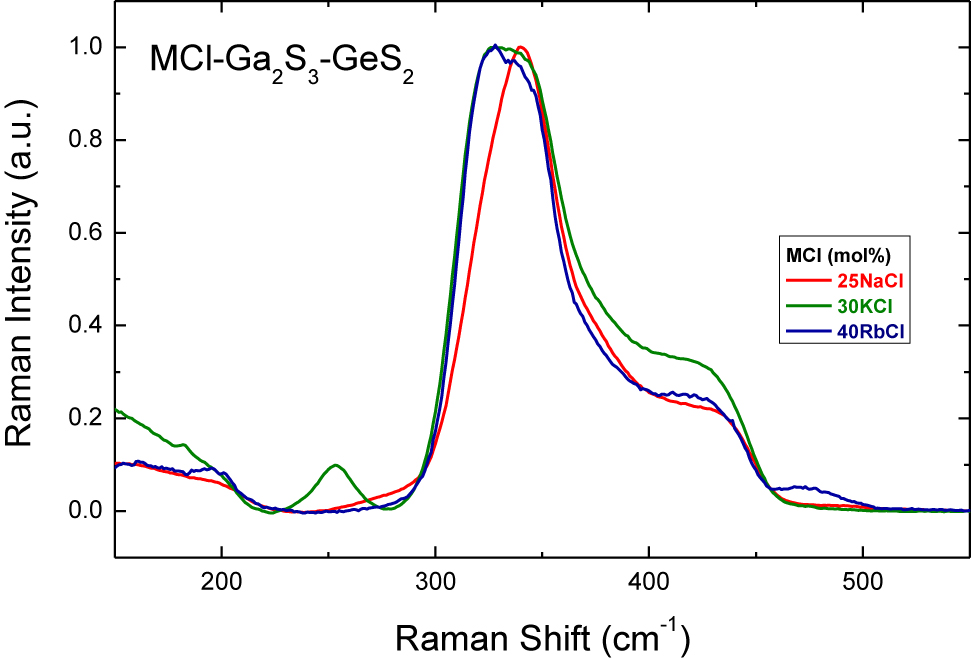
Experimental Raman spectra of (MCl) x (Ga2S3)0.2−0.2x (GeS2)0.8−0.8x glasses: x = 25 for M = Na; x = 30 for M = K; x = 40 for M = Rb.
A gradual blue-shift of the vibration mode between 390 and 420 cm−1 is observed for potassium-rich (KCl) x (Ga2S3)0.2−0.2x (GeS2)0.8−0.8x glasses with the addition of KCl, Fig. 4. Similar Raman spectral evolution has already been reported for potassium and caesium-doped glasses in this system [11, 14, 16]. The growing shoulder located at ≈390 cm−1 and the peak positioned at ≈420 cm−1 were attributed to the symmetric stretching vibrations of the outer Ga–Cl bonds in mixed GaClS3/2 and Ga2Cl2S4/2 subunits, respectively. Indeed, the above assumption was supported by the study of the vibrational spectrum of molten dimeric Ga2Cl6, where the strongest Raman feature at ≈413 cm−1 was assigned to the symmetric stretching vibrations of the outer Ga–Cl bonds [36]. The origin of the peak at ≈254 cm−1 for the (KCl)0.3(Ga2S3)0.14(GeS2)0.56 glass is rather controversial. This feature was not observed for the same composition in the previous study on KCl-Ga2S3-GeS2 glasses [11]. Nevertheless, the authors present the Raman spectra for 2KCl – Ga2S3 solid with the most intense spectral band located at ≈250 cm−1.
The rubidium-rich (RbCl)0.4(Ga2S3)0.12(GeS2)0.48 composition presents the low intensity Raman feature at ≈475 cm−1, Fig. 5. This peak could be assigned to the contribution of S–S homopolar bonds, which is present in S8 ring or Sn chains [26] and appears due to enhanced chemical disorder in the glasses. Indeed, the (RbCl)0.4(Ga2S3)0.12(GeS2)0.48 glass is on the limit of the glass-forming region and seems to be phase-separated [7]. Further studies of local and intermediate-range order in MY-Ga2S3-GeS2 glasses will have been carried out using pulsed neutron and high-energy X-ray diffraction.
The decreasing connectivity of the Ga-Ge-S glass network, related to increasing fraction of the mixed tetrahedra, results in lower glass transition temperatures [7]. The diminishing rigidity decreases also the crystallisation ability; the glasses become more resistant to crystallisation. The mobile M+ cations are giving rise to ionic conductivity in the glasses. The ionic conductivity increases with NaY content but remains nearly invariant to the halide nature; glasses containing NaI have roughly the same conductivity as the glasses with NaCl additions. The origin of the last phenomenon resides probably in the glass network compression. Covalent Ge-rich subnetwork prevents expansion of structural regions containing mixed tetrahedra and sodium species, when smaller halide as Cl is replaced by large iodine species. Moderate changes of Na-Y interatomic distances compared to those in crystalline NaY compounds are consistent with this hypothesis [37].
Conclusions
The changes in Raman spectra with the addition of alkali halides into the chalcogenide glass were investigated by analyzing (MY)
x
(Ga2S3)0.2−0.2x
(GeS2)0.8−0.8x
systems (M = Na, K, Rb; Y = Cl, Br, I). The Ga2S3-GeS2 vitreous matrix is different from GeS2-like disordered network in two aspects: (i) the presence of Ga-S triclusters containing 3-fold coordinated sulfur S3F, and (ii) the ethane-like ETH-Ga2S6/2 units with homopolar Ga–Ga bonds. The Ga-S triclusters, forming ⅔ of the crystalline lattice in monoclinic Ga2S3, probably exist in the melt. The ETH-Ga2S6/2 units appear in stoichiometric Ga2S3-GeS2 glasses on cooling and vitrification because of excessive rigidity of the Ga-S triclusters (the average coordination
Article note:
A collection of invited papers based on presentations at the 14th International Conference on Solid State Chemistry (SSC 2021) held in Trencin, Slovakia, June 13–17, 2021.
-
Research funding: This work was supported by the Région Hauts de France and the Ministère de l’Enseignement Supérieur et de la Recherche (CPER Climibio) as well as by the European Fund for Regional Economic Development.
References
[1] Y. G. Vlasov, E. A. Bychkov. Ion-Selective Electrode Rev. 9, 5 (1987).Suche in Google Scholar
[2] E. Bychkov, Y. Tveryanovich, Y. Vlasov. in Applications of Chalcogenide Glasses, Semiconductors and Semi-metals Series, R. Fairman, B. Ushkov (Eds.), Vol. 80, pp. 103–168, Elsevier, New York – London (2004).10.1016/S0080-8784(04)80027-9Suche in Google Scholar
[3] A. Hayashi, K. Noi, A. Sakuda, M. Tatsumisago. Nat. Commun. 3, 856 (2012), https://doi.org/10.1038/ncomms1843.Suche in Google Scholar
[4] Y. Ledemi, M. E. Amraouri, Y. Messaddeq. Opt. Mater. Express 4, 1725 (2014), https://doi.org/10.1364/ome.4.001725.Suche in Google Scholar
[5] J. J. Bernstein, A. Whale, J. Brown, C. Johnson, E. Cook, L. Calvez, X. Zhang, S. W. Martin. in Proceedings of the Solid-State Sensors, Actuators and Microsystems Workshop, Hilton Head Island, South Carolina, pp. 180–184 (2016).10.31438/trf.hh2016.50Suche in Google Scholar
[6] A. Paraskiva, M. Bokova, E. Bychkov. Solid State Ionics 299, 2 (2017), https://doi.org/10.1016/j.ssi.2016.11.003.Suche in Google Scholar
[7] M. Bokova, A. Paraskiva, M. Kassem, E. Bychkov. Phys. Status Solidi B 257, 2000115 (2020), https://doi.org/10.1002/pssb.202000115.Suche in Google Scholar
[8] S. Cozic, A. Bréhault, D. Le Coq, T. Usuki. Int. J. Appl. Glass Sci. 7, 513 (2016), https://doi.org/10.1111/ijag.12189.Suche in Google Scholar
[9] J. Kolář, T. Wágner, V. Zima, Š. Stehlík, B. Frumarová, L. Beneš, M. Vlček, M. Frumar, S. O. Kasap. J. Non-Cryst. Solids 357, 2223 (2011).10.1016/j.jnoncrysol.2010.12.020Suche in Google Scholar
[10] D. S. Patil, M. S. Konale, J. Kolar, K. Shimakawa, V. Zima, T. Wagner. Pure Appl. Chem. 87, 249 (2015), https://doi.org/10.1515/pac-2014-1005.Suche in Google Scholar
[11] T. Haizheng, Z. Xiujian, J. Chengbin. J. Mol. Struct. 697, 23 (2004), https://doi.org/10.1016/j.molstruc.2003.12.039.Suche in Google Scholar
[12] Y. S. Tver’yanovich, M. Vlcek, A. Tverjanovich. J. Non-Cryst. Solids 333, 85 (2004), https://doi.org/10.1016/s0022-3093(03)00824-x.Suche in Google Scholar
[13] A. Cuisset, F. Hindle, J. Laureyns, E. Bychkov. J. Raman Spectrosc. 41, 1050 (2010), https://doi.org/10.1002/jrs.2530.Suche in Google Scholar
[14] I. Seo. J. Electron. Mater. 43, 4018 (2014), https://doi.org/10.1007/s11664-014-3329-5.Suche in Google Scholar
[15] Y. Ledemi, B. Bureau, L. Calvez, M. Le Floch, M. Roze, M. Allix, G. Matzen, Y. Messaddeq. J. Phys. Chem. B 113, 14574 (2009), https://doi.org/10.1021/jp905649v.Suche in Google Scholar
[16] T. Haizheng, Z. Xiujian, J. Chengbin, Y. Hui, M. Shun. Solid State Commun. 133, 327 (2005), https://doi.org/10.1016/j.ssc.2004.11.010.Suche in Google Scholar
[17] C. Lin, G. Qu, Z. Li, S. Dai, H. Ma, T. Xu, Q. Nie, X. Zhang. J. Am. Ceram. Soc. 96, 1779 (2013), https://doi.org/10.1111/jace.12394.Suche in Google Scholar
[18] J. Li, G. Wang, C. Lin, T. Zhang, R. Zhang, Z. Huang, X. Shen, B. Gu, B. Ye, F. Ying, M. Li, Q. Nie. Infrared Phys. Technol. 83, 238 (2017), https://doi.org/10.1016/j.infrared.2017.04.012.Suche in Google Scholar
[19] A. Tverjanovich, Y. S. Tveryanovich, S. Loheider. J. Non-Cryst. Solids 208, 49 (1996), https://doi.org/10.1016/s0022-3093(96)00415-2.Suche in Google Scholar
[20] Y. S. Tver’yanovich, V. V. Aleksandrov, I. V. Murin, E. G. Nedoshovenko. J. Non-Cryst. Solids 256–257, 237 (1999), https://doi.org/10.1016/s0022-3093(99)00327-0.Suche in Google Scholar
[21] T. Haizheng, M. Shun, Z. Xiujian, D. Guoping. J. Non-Cryst. Solids 354, 1175 (2008), https://doi.org/10.1016/j.jnoncrysol.2007.01.102.Suche in Google Scholar
[22] R. Zaiter, M. Kassem, M. Bokova, A. Cuisset, E. Bychkov. J. Phys. Chem. B 124, 7075 (2020), https://doi.org/10.1021/acs.jpcb.0c03673.Suche in Google Scholar PubMed
[23] J. E. Griffiths, J. C. Phillips, G. P. Espinosa, J. P. Remeika, P. M. Bridenbaugh. Phys. Status Solidi B 122, K11 (1984), https://doi.org/10.1002/pssb.2221220148.Suche in Google Scholar
[24] S. Sugai. Phys. Rev. B Condens. Matter 35, 1345 (1987), https://doi.org/10.1103/physrevb.35.1345.Suche in Google Scholar
[25] K. Inoue, O. Matsuda, K. Murase. Solid State Commun. 79, 905 (1991), https://doi.org/10.1016/0038-1098(91)90441-w.Suche in Google Scholar
[26] P. Boolchand, J. Grothaus, M. Tenhover, M. A. Hazle, R. K. Grasselli. Phys. Rev. B 33, 5421 (1986), https://doi.org/10.1103/physrevb.33.5421.Suche in Google Scholar
[27] I. P. Kotsalas, C. Raptis. Phys. Rev. B 64, 125210 (2001), https://doi.org/10.1103/physrevb.64.125210.Suche in Google Scholar
[28] P. Masselin, D. Le Coq, A. Cuisset, E. Bychkov. Opt. Mater. Express 2, 1768 (2012), https://doi.org/10.1364/ome.2.001768.Suche in Google Scholar
[29] C. Y. Jones, J. C. Bryan, K. Kirschbaum, J. G. Edwards. Z. Kristallogr. NCS 216, 327 (2001), https://doi.org/10.1524/ncrs.2001.216.14.349.Suche in Google Scholar
[30] M. F. Thorpe, D. J. Jacobs, M. V. Chubynsky, J. C. Phillips. J. Non-Cryst. Solids 266–269, 859 (2000), https://doi.org/10.1016/s0022-3093(99)00856-x.Suche in Google Scholar
[31] J. C. Phillips. J. Non-Cryst. Solids 34, 153 (1979), https://doi.org/10.1016/0022-3093(79)90033-4.Suche in Google Scholar
[32] J. Heo, J. M. Yoon, S. Y. Ryou. J. Non-Cryst. Solids 238, 115 (1998), https://doi.org/10.1016/s0022-3093(98)00577-8.Suche in Google Scholar
[33] C. Lin, L. Calvez, H. Tao, M. Allix, A. Moreac, X. Zhang, X. Zhao. J. Solid State Chem. 184, 584 (2011), https://doi.org/10.1016/j.jssc.2011.01.018.Suche in Google Scholar
[34] M. Le Toullec, P. S. Christensen, J. Lucas, R. W. Berg. Mater. Res. Bull. 22, 1517 (1987), https://doi.org/10.1016/0025-5408(87)90217-0.Suche in Google Scholar
[35] F. Hindle, M. Miloshova, E. Bychkov, C. J. Benmore, A. C. Hannon. J. Non-Cryst. Solids 354, 134 (2008), https://doi.org/10.1016/j.jnoncrysol.2007.07.031.Suche in Google Scholar
[36] I. R. Beattie, T. Gilson, P. Cocking. J. Chem. Soc. A 4, 702 (1967), https://doi.org/10.1039/j19670000702.Suche in Google Scholar
[37] A. Paraskiva. Université du Littoral Côte d’Opale (2017), Ph.D. Thesis.Suche in Google Scholar
Supplementary Material
The online version of this article offers supplementary material (https://doi.org/10.1515/pac-2021-0702).
© 2021 IUPAC & De Gruyter. This work is licensed under a Creative Commons Attribution-NonCommercial-NoDerivatives 4.0 International License. For more information, please visit: http://creativecommons.org/licenses/by-nc-nd/4.0/
Artikel in diesem Heft
- Frontmatter
- Preface
- 14th Conference on Solid State Chemistry
- Conference papers
- Strong emission at 1000 nm from Pr3+/Yb3+-codoped multicomponent tellurite glass
- Pressure assisted sintering of Al2O3–Y2O3 glass microspheres: sintering conditions, grain size, and mechanical properties of sintered ceramics
- Present state of 3D printing from glass
- Raman spectra of MCl-Ga2S3-GeS2 (M = Na, K, Rb) glasses
- The chemistry of melting oxynitride phosphate glasses
- Structure and magnetic properties of Bi-doped calcium aluminosilicate glass microspheres
- Special Topic Paper
- Synthesis design using mass related metrics, environmental metrics, and health metrics