Pattern recognition of ocean pH
-
Albert Parker


Abstract
The manuscript shows how the few, scattered, latest measurements of ocean pH lacking a proper spatial and time coverage do not permit a meaningful computation of global trends, as the ocean pH is strongly variable in latitude, longitude and depth and very likely is subject to the multi-decadal oscillations that have been identified in the atmospheric and ocean systems. The proposed mathematical model is based on the assumption that the monthly averaged ocean pH may be described by the superposition of a linear trend and inter-annual, decadal and multi-decadal oscillations, with linear and sinusoidal regression coefficients requiring data that are presently unavailable.
1 Introduction
According to IPCC (2013), their highly selected data collected in few geographical locations and over a very short time window is proof that the oceans are becoming more acid because of the increasing anthropogenic CO2 concentration in the atmosphere. They then claim that their projected changes in the ocean will have catastrophic consequences on marine life by 2100, with many signs already showing.
After many examples of altering raw data and manufacturing trends of temperature, rainfall and sea level, there is now a fresh wave of papers to support the catastrophic ocean acidification caused by the anthropogenic CO2 emission, as for example Mathesius et al (2015), Kapsenberg et al (2015), Lui & Chen (2015), Fantazzini et al (2015), Tambutté et al (2015), Nagelkerken et al (2015), Taylor et al (2015), Dutkiewicz et al (2015), Lucey et al (2015), Garilli et al (2015), Cornwall & Hurd (2015) and Cressey (2015), that all assumes the evidence of IPCC (2013) is a fully satisfactory description of the ocean pH pattern.
The latest recent paper Cornwall & Hurd (2015) immediately trumpeted by Cressey (2015), claims on the basis of a literature review but no new empirical evidence that most reports of laboratory experiments on ocean pH implications either used inappropriate methods or did not report their methods properly. Many of the experiments are therefore suspect, which makes it difficult or impossible to assess the magnitude of effects of ocean acidification, or to combine results from individual experiments to build overall predictions for how the ecosystem as a whole will behave. However, surprisingly the authors conclude that there is overwhelming evidence of the negative effects of ocean acidification, even if it has not been properly measured.
Therefore, there is a claim the ocean pH is globally reducing proportional to the anthropogenic carbon dioxide emission and the consequences will be catastrophic. However, looking carefully at the evidence supporting this claim, there is no such a thing like a clear indication the oceans are actually reducing their pH, no idea which the actual reduction rate may be, and what kind of consequences could be likely within the end of this century. This paper attempts to determine the most likely pattern of the ocean pH, and therefore establish which data are needed to infer realistic trends.
According to the global warming narrative (IPCC, 2013), the ocean pH is reducing because of the increasing absorption of the anthropogenic carbon dioxide, and the global trend in the oceanic pH is as shown in Figure 1. The experimental support for this figure consists of just few data sets of surface measurements in the Atlantic and the Pacific, all collected in a period of time of less than 20 years, and a purely computational, never validated, global ocean pH.
The expected pattern of the ocean pH may be possibly more complicated than what is represented in this narrative (IPCC, 2013). In particular, it may be characterized by a strong spatial distribution in latitude, longitude and depth, and additionally subjected to strong variations in time with anticipated periodicities up to multi-decadal and possibly longer. This will be sorted out on the basis of all the data available, the tiny part of the records used by the IPCC, and the other data we do have for the historical and contemporary ocean pH, the historical data showing different trends that were omitted by IPCC (2013) because of poor quality, and the other more recent data sets of about same quality and same insufficient length to infer any trend of IPCC (2013) that were neglected without any reason.
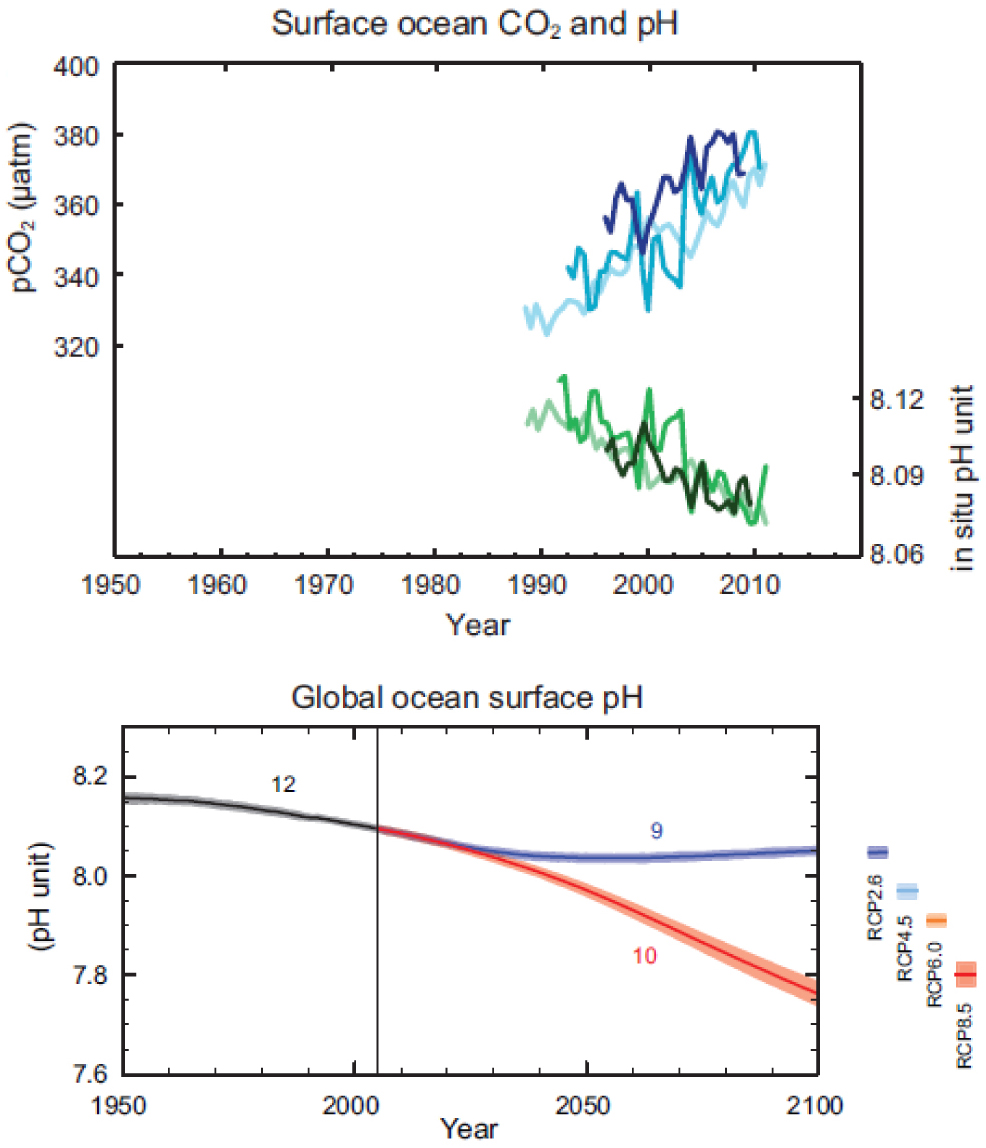
Surface and global ocean pH according to the global warming narrative. On the left, measured concentration of CO2 and pH in few selected locations. On the right, computed global pH to 2100 according to different CO2 emission scenarios. The evidence are three ‘surface measurements’ in the Atlantic and Pacific all below 20 years and a computed global ocean pH. The ‘surface measurements’ – see analysis of the Hawaiian Ocean Time Series proposed later – also includes computations to replace missed measurements or extend the time series. The ‘surface measurements’ – see analysis of the Monterey Bay time series proposed later – do not include not cooperative projects not supportive of declining trends. This ‘evidence’ is absolutely not enough to make any claim. The images are taken from IPCC (2013).
2 Measured ocean pH
There are not enough measurements in time, latitude, longitude and depth, and measurements are often of insufficient quality. In these circumstances verification of the ‘ocean acidification’ claim is impossible. We do not have enough data over long enough periods to understand the distribution of oceanic pH across the globe and within the deep oceans to distinguish trends from variability. The most part of the data needed to understand spatial and time variability of ocean pH are unavailable, but what is actually measured supports more a naturally oscillating pattern than a pattern of sharply declining pH.
2.1 Historical ocean pH
Such past data as we have does not support the acidification claim, and unfortunately these data have been omitted and replaced by model simulations. This manipulation of data is a clear indication the science of ocean acidification is not based on a solid foundation.
Most of the world’s historical ocean pH measurements collected over 80 years were replaced by a substituted history known as the FEEL2899 report (Feely, Sabine and Fabry, 2006). This manufactured data was used in a testimony to the US Congress to increase mitigation research funding and strengthen the regulation of anthropogenic greenhouse gas emissions (Noon, 2014).
As noted by Eschenbach (2014) the sampling of the 2.5 million points is not uniform in time and space. But the computation of a ‘global’ or many ‘local’ trends from this data is certainly superior to a method using even less measurements collected over a shorter period – the latest IPCC time series, Figure 1 on left – or manufactured by simulations – the FEEL2899 report and the IPCC time series, Figure 1 on the right.
If the neglected 2.5 million points may not be used to infer a ‘global’ trend, they are certainly enough to prove the simplistic pH parabolic reduction with time since 1910 of Feely, Sabine and Fabry (2006) is wrong. The ocean pH oscillates with annual, decadal and multi-decadal periodicities and it is shown not to follow the parabolic declining curve of Feely, Sabine and Fabry (2006), Figure 2. The location around the globe of 1/10 of the pH sampling is reproduced in this figure from Eschenbach (2014), together with the time average pH.
Ideally we would like pH measurements at every gridded point at different depths and collected at the same time, and repeated with constant sampling rate. The reality is not even a close approximation. It appears that there is sufficient data for construction of time series extractions in some areas, for example the North Atlantic and Japan. Everywhere else, the scattered data may provide at the most validation for detailed models accounting for natural variability when somebody will finally evolve the climate models to account for more driving forces.
From these 2.5 million points, we know that the oceanic pH is strongly variable in space (including depth) as well as in time. In Hawaii, the surface pH is above 8.05, and in Alaska the surface pH is below 7.7 (Eschenbach, 2015). While the open ocean shows a narrow pH range, a number of marine environments show a wide range over time: coral reefs for example show a large variation in pH (Eschenbach, 2015).
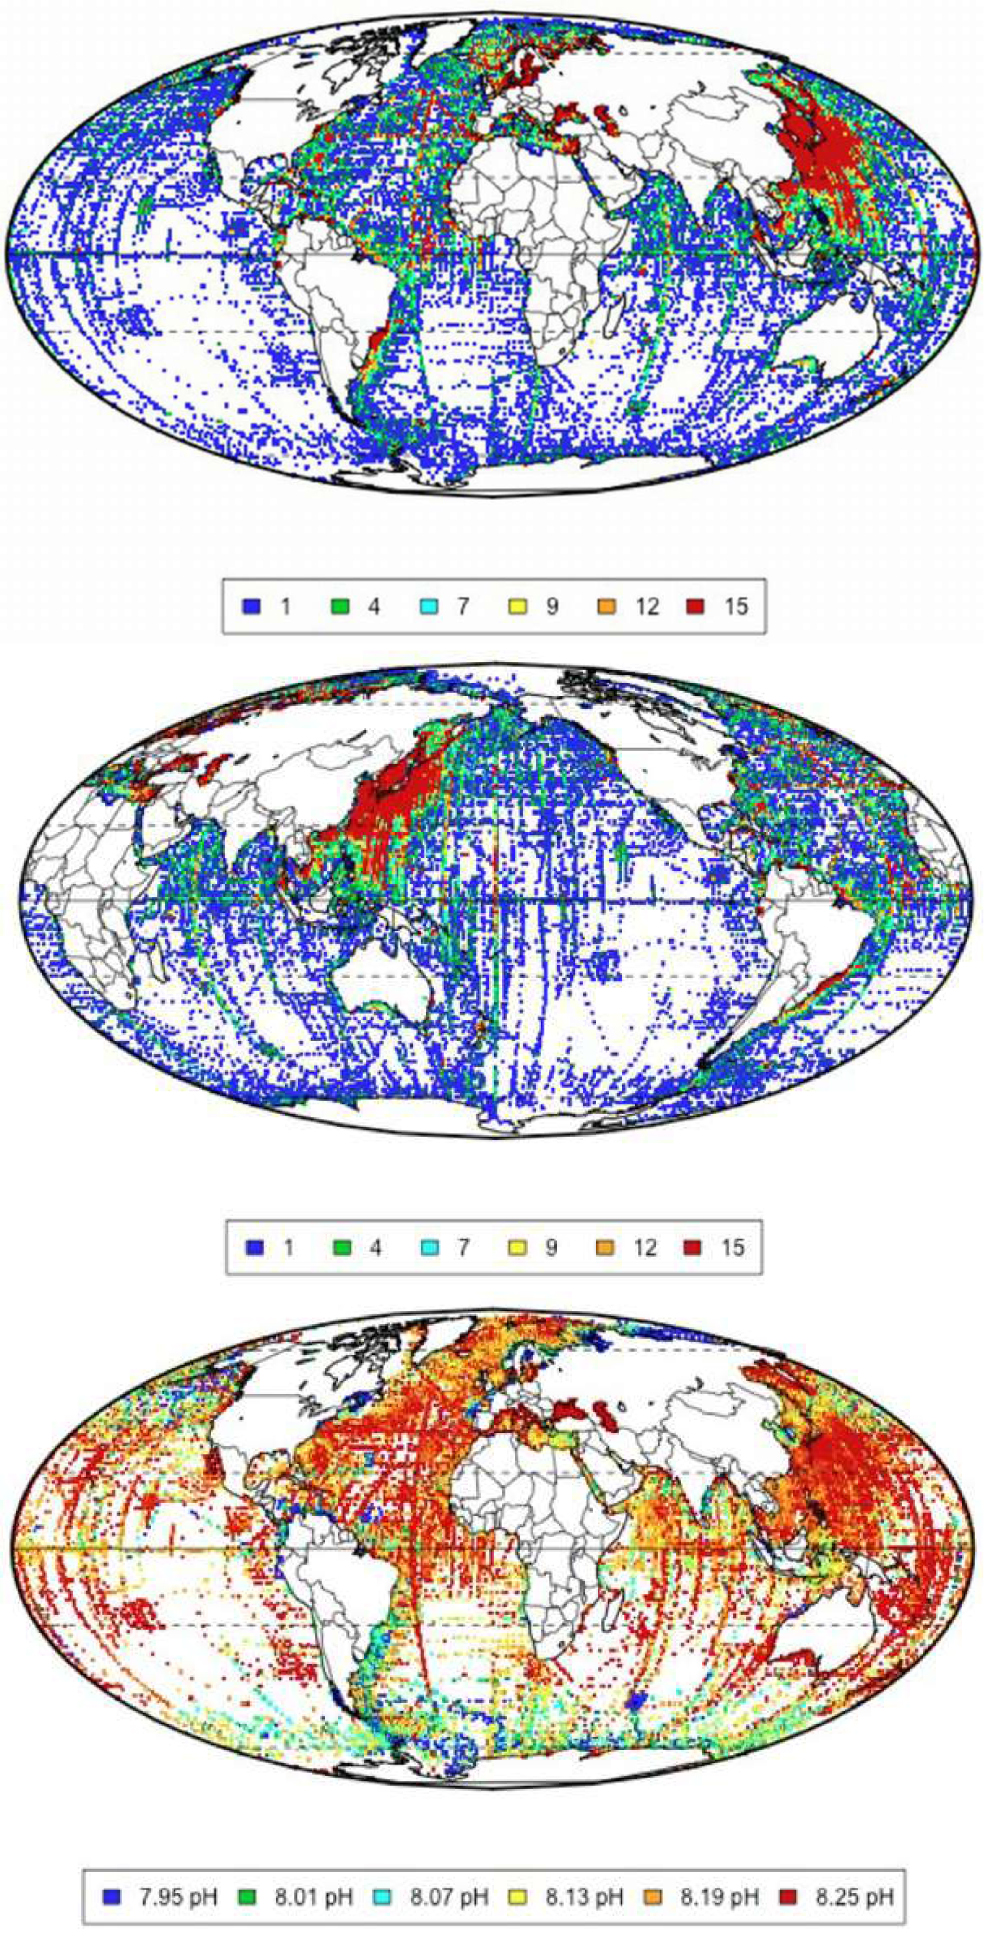
Samples of 196,888 surface data, less than 1/10 of the total samples in the 2.5 million neglected data points collected over the period 1910 to 2013. Two views of the location of the surface samples of the global pH dataset, centered on the Pacific and the Atlantic and average values of pH by grid cell in the record. Images are taken from Eschenbach (2014). The spatial coverage is excellent in some areas, as the North Atlantic or Japan, but more scattered in other areas, however similarly to other climate products as temperatures or rainfall or sea levels.
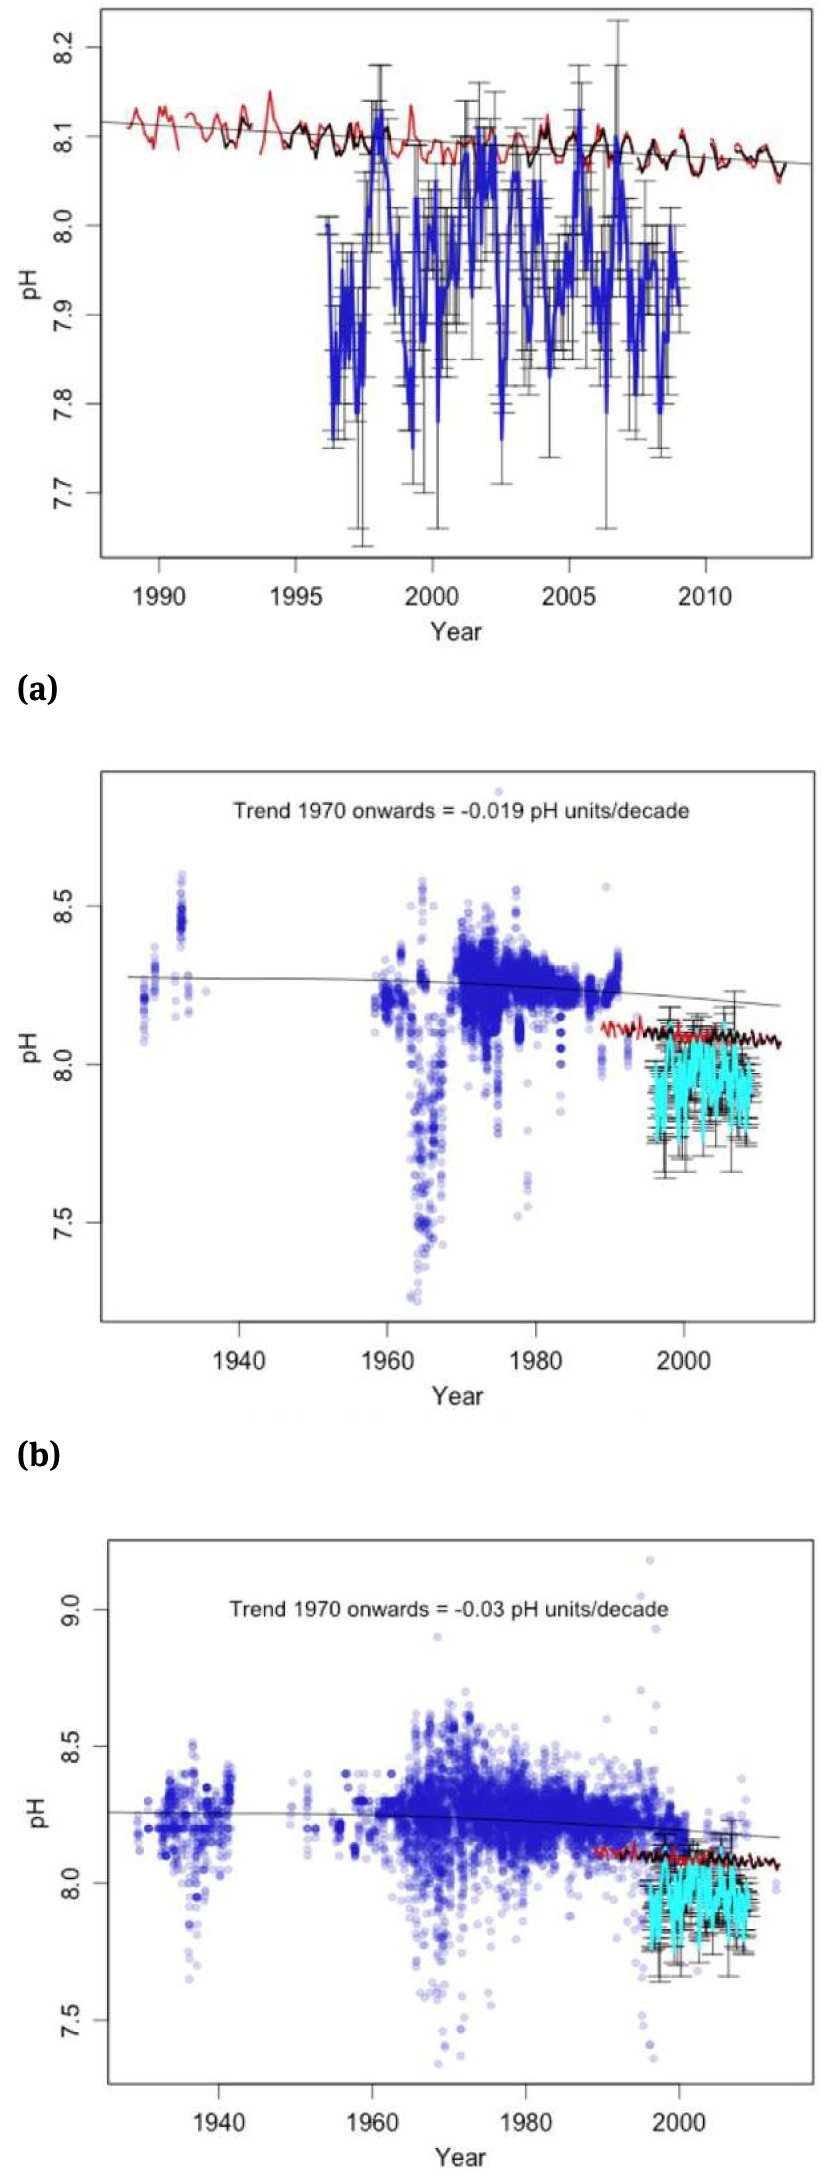
Figure 3, reproduced from Wallace (2015), includes data from the FEEL2899 report pH time series (Feely, Sabine and Fabry, 2006) as the thick reddish curve. These results are compared with data from the NOAA/NODC World Ocean Database (WOD) global ocean pelagic pH data (GOPpH) (NOAA/NODC, 2015) plotted over the same time frame, with the year moving average in blue. The WOD-based curve suggests an oscillatory behavior, over the period shown, without any detectable trend up or down.
FEEL2899 (Feely, Sabine and Fabry, 2006) pH curve vs. the WOD GOPpH (NOAA/NODC, 2015) time series, surface to 200 m depth. While the purely computational result of Feely, Sabine and Fabry (2006) proposes a declining pH about proportional to the anthropogenic carbon dioxide emission, the WOD GOPpH measurements suggest an oscillatory behavior whatever the accuracy of the measurements could be. Image is taken from Wallace (2015).
As Wallace (2015) notes, the major obstacle to rapid correction of the simplistic FEEL2899 report pH trend that builds on occasional correlation with one phase of the multi-decadal oscillations in selected locations, while neglecting the other phases or other locations, is the consensus among those controlling the peer review that the ocean pH cannot be instrumentally measured and therefore we should accept the formerly undisclosed model replacement of ocean pH data of Feely, Sabine and Fabry (2006).
2.2 Recent oceanic pH time series
Figure 4 (from Eschenbach, 2015) shows the data from the Hawaii Ocean Time series (HOT) project, the favorite project of the Intergovernmental Panel on Climate Change (IPCC), the data from the Monterey Bay coastline project, a project with even better data but not widely discussed showing a pattern conflicting with the IPCC narrative, plus the North Atlantic and Japan data from the ‘neglected’ 2.5 million point data base.
The reconstructed trend of declining pH proportional to the increasing atmospheric CO2 of the models as IPCC (2013) or Feely, Sabine and Fabry (2006) has some support from the short term Hawaii Ocean Time series (HOT) project, but not from the short term Monterey Bay coastline project, or from the ‘neglected’ data set for the North Atlantic or Japan. The ‘neglected’ data set or the Monterey Bay time series are actually more supportive of a relatively stable ocean pH, with no clear declining trend evidenced.
Figure 5 (images from Monterey Bay Aquarium, 2010) presents in more details the Monterey Bay data set, by far the best data set presently available even if only spanning two decades. The multiple plots of the pH data against time, for the period 1995 to present in the incoming water to the Monterey Bay Aquarium, show significant natural oscillations but no declining trend. Contrary to the Hawaii Ocean Time series (HOT) data, the measurements here are continuous over the time window, with no gap replaced by modeling predictions, no extension by modeling predictions, and no comparison with model result to support the validity of the measurements, as if nothing could be trusted more than the models. The Monterey Bay results also show the error bar that is something omitted in the HOT data. Without data of this quality available in many locations worldwide and at different depths over a time window that can distinguish inter-annual and multi-decadal variability, the actual rate of change of the oceanic pH is unknown.
Figure 6 (images from Tanhua, Orr, Lorenzoni and Hansson, 2015), presents the totality of the time series used to support the ocean acidification claim (as every other uncooperative project result, the Monterey Bay time series is omitted). It does not seem these results are ‘representative’ of ‘accurate’ global trends of reducing pH cleared of localized effects and multi-decadal variability, as they are short, of unspecified accuracy, with gaps model filled or extended by models. The surface data are ‘deseasonalized’ using WMO Global Atmosphere Watch (GAW) ‘recommended’ procedures and fitted with a linear trend. The measuring error of every point is omitted. The fitting accuracy is similarly omitted. Ocean surface pH is claimed to decrease during the period of observations at an average rate of −0.0013 to −0.0024 pH/year depending on the location.
a) Hawaiian Ocean Time series (HOT) pH measurements and calculations (red-calculated, black-observed), and Monterey Bay pH measurements (cyan, with the standard deviations shown by whiskers). One time series shows a short term reduction of pH, the other time series shows a short term increase of pH. b) and c) North Atlantic or Japan pH measurements from oceanographic transects (blue circles), plus Hawaiian Ocean Time series (HOT) pH measurements (red-calculated, black-observed), and Monterey Bay pH measurements (cyan, with the standard deviations shown by whiskers). The North Atlantic or Japan pH measurements may not be used to prove any trend of declining or increasing pH. Images are taken from Eschenbach (2015).
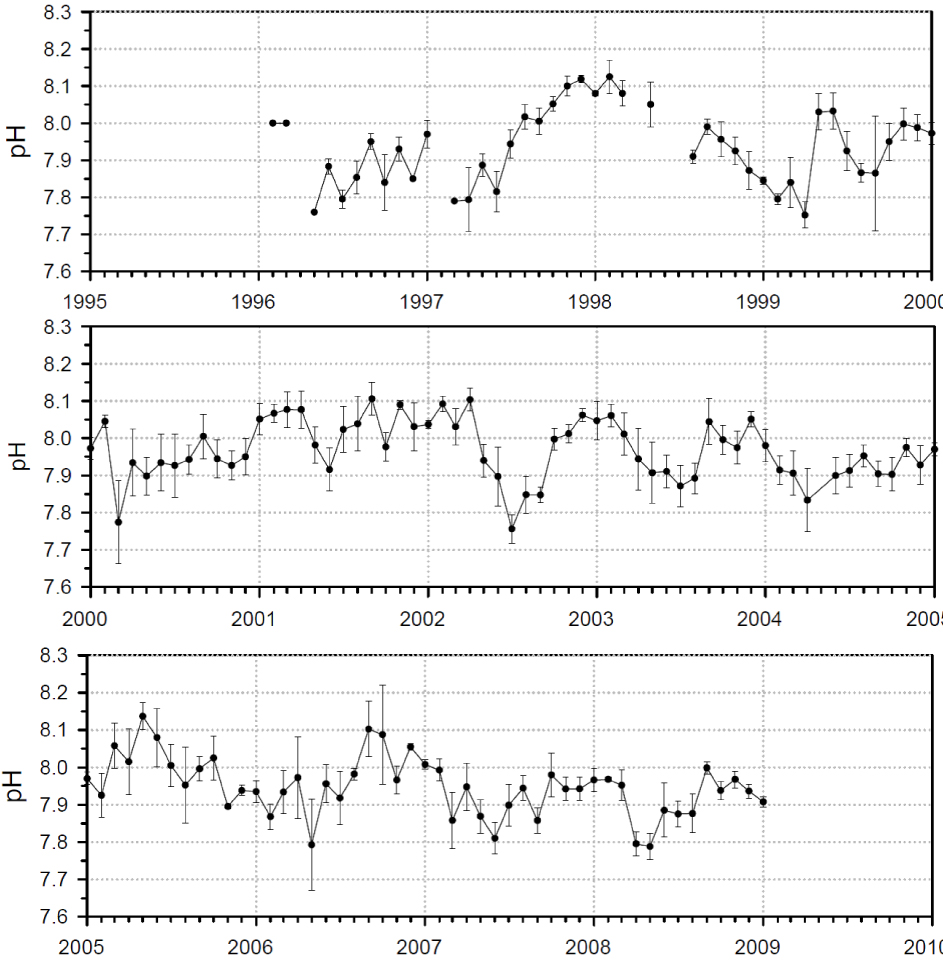
Details the Monterey Bay data set. The multiple plots of the pH spot check data vs. time, for the period 1995 to present in the incoming water to the Monterey Bay Aquarium show natural oscillations and no declining trend. Results are shown as measured values and their standard deviation. Images are taken from Monterey Bay Aquarium (2010).
2.3 Analysis of the Aloha station (HOT)
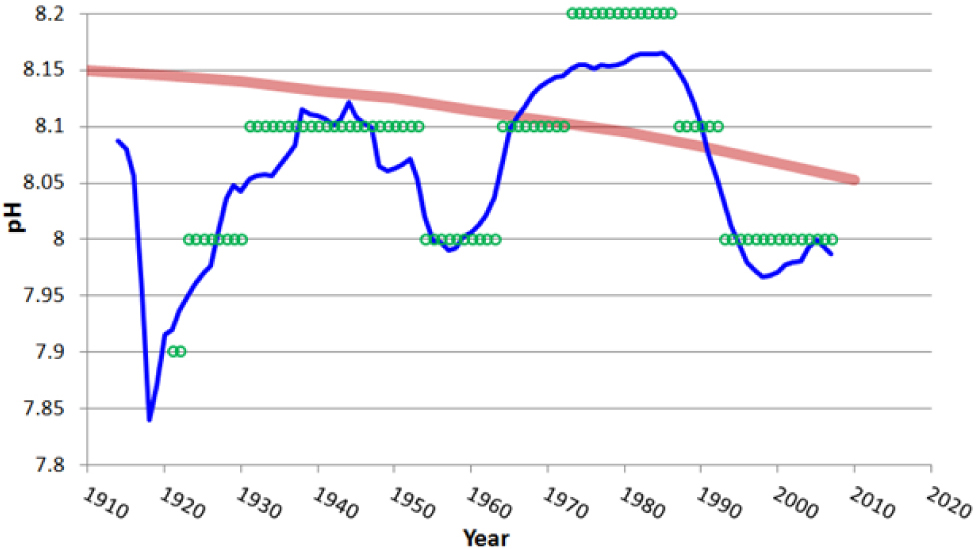
If we consider for example the pH data for the Aloha station (Hawaii Time series) presented by Europa Environment Agency (2014), Figure 7, the pH values are shown with three digits, indicating a likely accuracy of 0.001 pH, that is however fairly optimistic.
The truly measured data do not cover 20 years. There are nearly monthly data 17 April 1992 to 17 June 1998 for about 6 years with only few missed months. Then there is a significant gap to 20 June 2003 of more than 5 years. Then there are nearly monthly data to 4 December 2012 for about 9 years with only few months missed. Closing the significant gaps with computer model results or extending the time range to 1988 by computer model results is not a legitimate procedure when there is no validation for the models. No model can be trusted if not validated first against accurate measurements, and if the measurements are not available or not accurate, than the use of the model is pointless. The time series of the actually measured pH does not satisfy the minimal quality requirements to infer any trend.
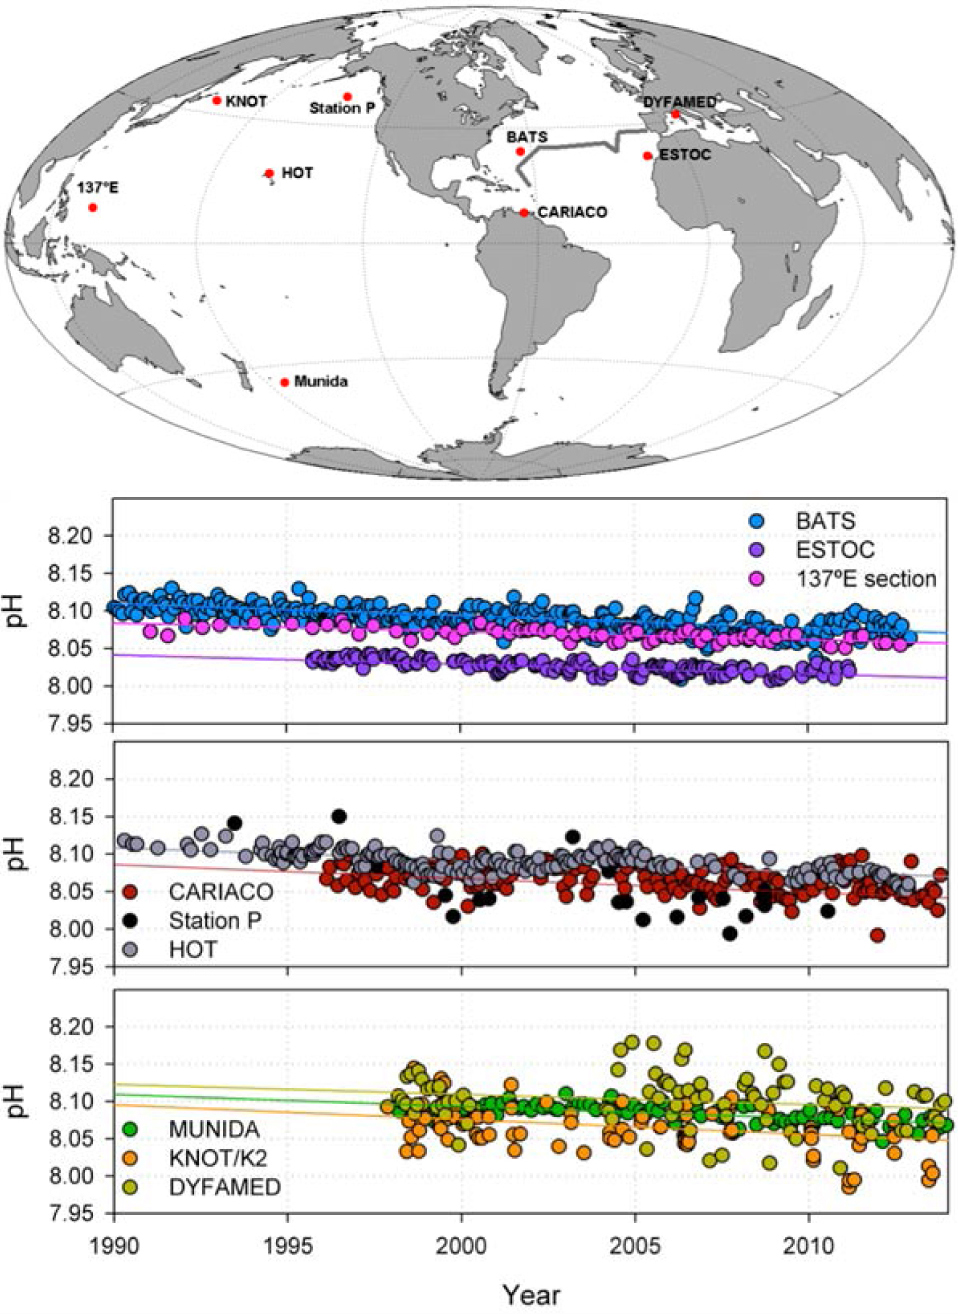
Time series used to support the ocean acidification claim in Tanhua, Orr, Lorenzoni and Hansson (2015). The Monterey Bay time series as every other uncooperative project result is omitted. It does not seem these results are ‘representative’ of ‘accurate’ global trends of reducing pH cleared of localized effects and multi-decadal variability. Images are taken from Tanhua, Orr, Lorenzoni and Hansson (2015).
The fitting accuracy is the only parameter sometimes accounted in climate change analyses always based on very ‘rough’ mathematics, but in ocean pH analyses, also this parameter is usually omitted. The computation of the fitting accuracy is however trivial and should always accompanying the claimed linear trend. The Excel LINEST function calculates the statistics for a line y = m·x + by using the ‘least squares’ method to calculate a straight line that best fits the data, and then returns an array that describes the line. From a range of known_x’s and known_y’s, the values of m and as well as the regression statistic of the standard error values for the coefficients m and are computed.
The standard error value for m does not include the inaccuracies on the measurements collected or the missed measurements, and obviously does not account for the significance of the time series, if for example not long enough to clear a longer term trend of natural oscillations, that however must be kept in mind.
The first 6 years of data, Figure 7a, are oscillating about a trend line of slope −0.00068±0.00090 pH/year. The 0.00090 pH/year standard error in computing the slope from the data fitting is largest than the module of the slope, that is therefore insignificant. The accuracy of ±0.001 pH in every monthly measurement may translate in an additional error ±0.00046 pH/year on the trend.
The last 9 years of data, Figure 7a, are oscillating about a trend line of slope −0.00213±0.00043 pH/year. The accuracy of ±0.001 pH in every monthly measurement may translate in an additional error ±0.00031 pH/year. While the trend is statistically significant, the computation of a trend from only 9 years of data when we do know of the existence of decadal and multi-decadal oscillation is however wrong.
Globally, considered as a single data set 1992 to 2012 with more than 25% of the data missed, Figure 7a, the trend is −0.00157±0.00015 pH/year. The accuracy of ±0.001 pH in every monthly measurement may translate in an additional error ±0.00014 pH/year. The trend is statistically significant, but 20 years of data are still not enough to infer a proper trend, and the 25% of missed data further play against the reliability of the time series.
Is the fitting with a line of the monthly values of pH the right approach to compute a trend? If the time span of data is long enough, and this means it cover multiple periods of the longer multi-decadal periodicity, this may be reasonable. Conversely, with only 5, 9 or even 20 years of data this translates in an over simplification.
Clearly, Figure 7b, the 20 years of scattered monthly data show annual oscillations not about a linear trend, but about a more complicated trend that also includes a multi-decadal oscillation.
A simple fitting with a sinusoid of period 60 years (but the proper determination of the length of the multi-decadal periodicity certainly needs more data) and a sinusoid of period 1 year leaves residuals that may then be fitted with a line of slope a negligible 0.00009 pH/year, Figure 7c.
The assumption of a perfectly oscillatory variation of the pH is not certainly more wrong that assuming there is no multi-decadal periodicity. Only many more data measured may clarify the real trend.
Neither the 5 nor the 9 years of data are enough to infer any reasonable trend. Similarly the 20 years of data with 25% of gaps. True measurements even if not accurate shows multi-decadal oscillations for ocean pH similarly to what has been already shown for temperatures, rainfalls or sea levels, and the local short term focus even if accurate – as it is however not even the case here – is particularly misleading. To understand a true trend cleared of variability and not specific of one single location without any doubt many more results are needed, and not corrupted by replacement or complement with never validated computer model results.
As shown in Figure 6, the Monterey Bay data set that has better quality, with many more real measurements over two complete decades does not show any trend and there should be no reason to support one measurement against the other.
2.4 The measuring accuracy issue
According to NOAA/PMEL (2015), the NOAA/NODC World Ocean Database historical pH data base has data collected prior to 1989 typically not well documented and with their metadata incomplete; therefore, such data are of unknown and probably variable quality and cannot be used. The uncertainty of these older pH measurements is claimed by NOAA/PMEL (2015) to be rarely less than 0.03 in pH and even as large as 0.2 in pH, which is certainly an extreme claim. The historical pH data is typically published to two decimal places, possibly indicating a 0.01 pH unit accuracy of the meters utilized. However, even by accepting a measuring accuracy of 0.1 pH for the bleu curve of the GOPpH data of Figure 3, this would not invalidate the trend.
At the present time, best possible measurements are done with recently developed sensors as the Satlantic SeaFET™ Ocean pH Sensor (Satlantic, 2015). Developed for the Monterey bay project, this sensor has a measurement range of 6.5–9.0 pH, an initial accuracy of 0.02 pH, typical stability of 0.003 pH/month, and precision (of best measurements, as other factors may affect the actual accuracy) of 0.004 pH. Interesting high quality pH results obtained with this sensor are presented in Martz, Connery and Johnson (2010), Hofm ann et al (2011), Yu, Matson, Martz and Hofmann (2011), Kroeker, Micheli, Gambi and Martz (2011), Price, Martz, Brainard, and Smith (2012), Matson, Martz and Hofmann (2011) and Bresnahan Jr et al (2014), but unfortunately not spanning enough time to compute meaningful pH local trends.
Not all the measurements of Figure 6 have this very high pH sensitivity. Very likely, the measurement error is on average not much better than the 0.01 pH for the most part of the measurements, and it is quite questionable to assert that less accurate but numerous data spanning long time windows must be neglected and only more accurate (but still imperfect) few scattered data only covering short time windows in selected locations should be considered.
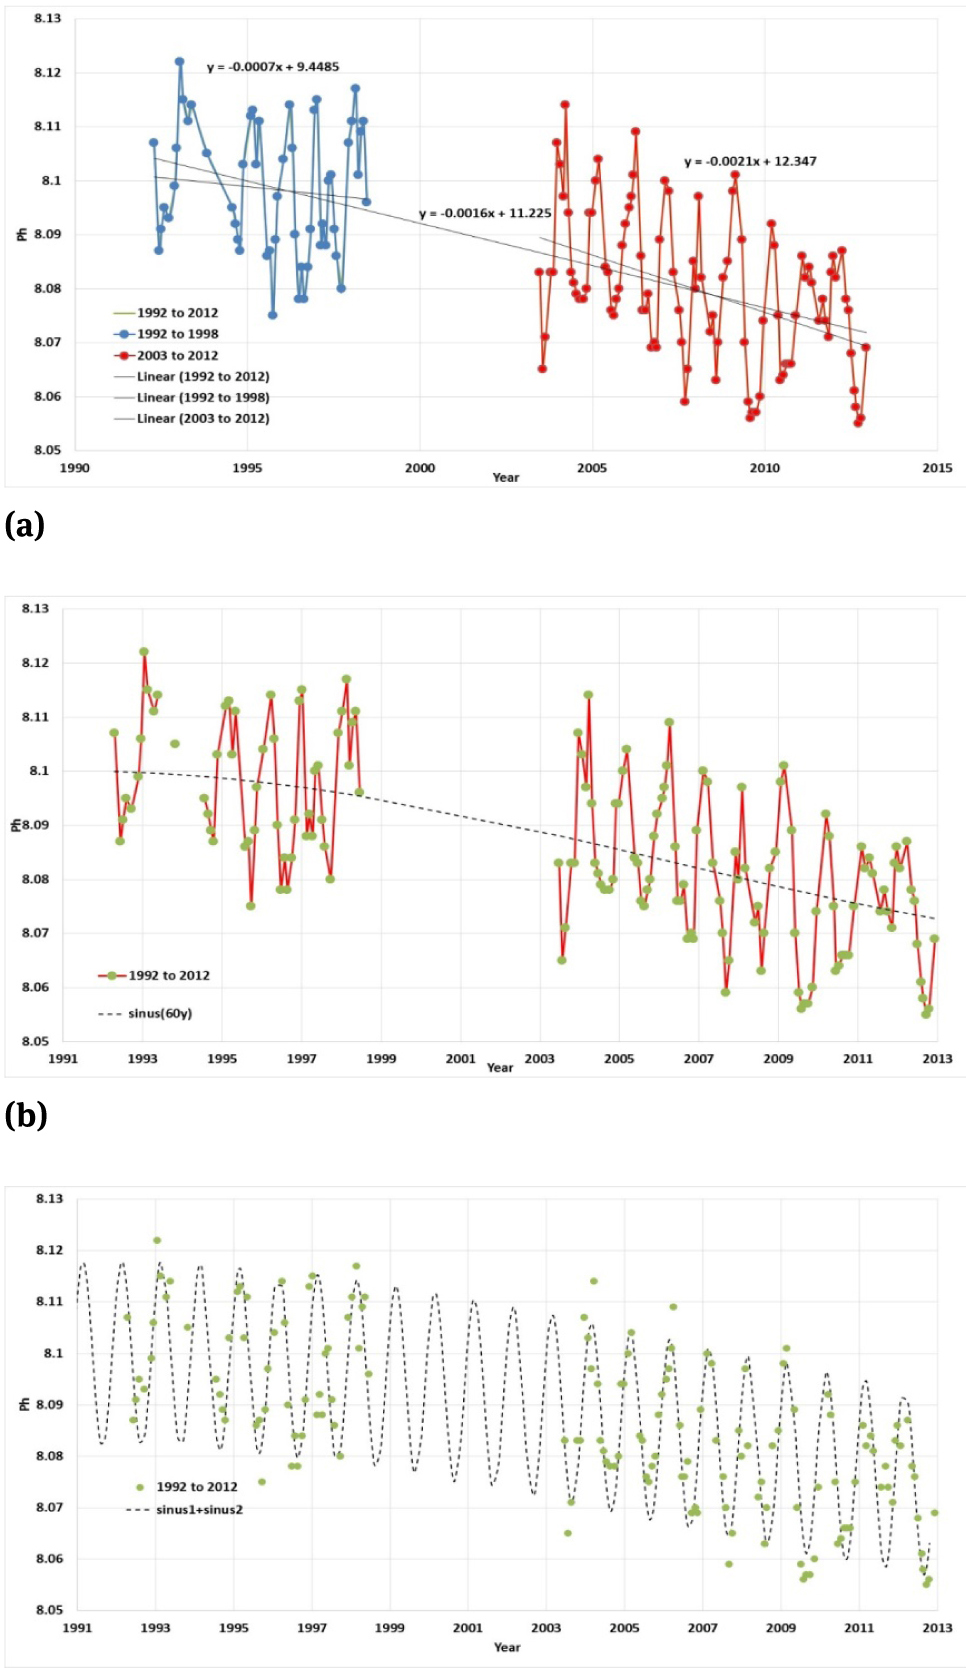
Analysis of the truly measured data in the Aloha station (Hawaii Ocean Time series). Data are taken from Europa Environment Agency (2014). The measured data in the time series does not prove the world oceans pH is reducing because of the anthropogenic carbon dioxide emission, as the time series is short, it is incomplete, it does not permit to clear the trend of multi-decadal oscillations, and no account is made of inaccuracies. If we accept the inappropriate assumption of monthly oscillations about a linear trend y = −0.0016·y + 11.225, the local pH in 2100 could reach values of 7.865. If we include the opportunity of a sinusoidal oscillation of period 60 years, there will be no reduction of pH in 2100.
If the GOPpH trend of Figure 3 is claimed to be not trustworthy, the same concepts should certainly be used to disqualify the claimed trends of −0.0013 to −0.0024 pH/year of Figure 6, that do not even report the fitting error, which is very likely larger than the trends, in addition to not reporting the measurement accuracy, or the completeness of the time series, or the actual measurements and the computational substitution or complement, that are only a few of the other parameters that make a time series accurate enough for the practical use of inferring a time trend.
2.5 Spatial Distribution of Ocean pH (and CO2 fluxes)
Spencer (2015) raises very good points about what we actually know of the historical ocean pH and also of the present ocean pH, in particular the geographical distribution of the ocean pH. Despite the claims of a recent lowering of the ocean pH, there is no evidence that there have actually been any significant changes in the ocean pH. As Wallace (2015) notes, most of the historical data on the ocean pH have been replaced by hind-casts from unvalidated computer models. NOAA/PMEL (2015) provides some explanation for dismissing the ocean pH data before 1989, but they do not explain why the “inaccurate” observations have been replaced by simulations. The two excuses for dismissing the historical data (Telford, 2015) are poor sampling protocols and non-gridded data.
The same complaints could be made about the temperature data, or the CO2 data for the past, which were very scattered and suffered the same inaccuracies as the ocean pH historical data. If the historic ocean pH data are rejected, then there is no past to compare to the present, so the claim that the surface-water of the oceans pH has declined since the industrial revolution is unsupported.
The scattering of data and the inaccuracies and biases are not only an issue of the past. At the present time, as soon as new measurements techniques become available, they fail to fit the accepted convents until the results are corrupted by corrections to match the models.
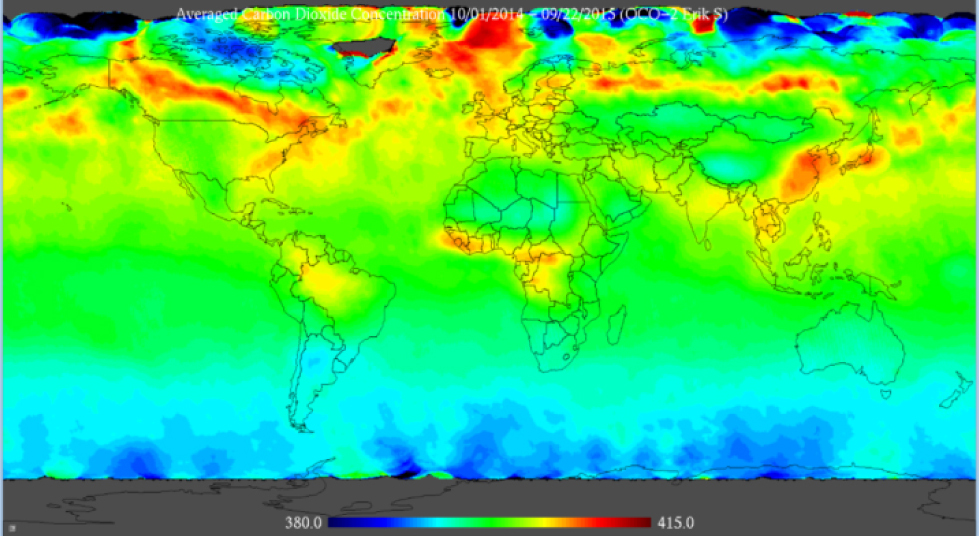
It was formerly assumed that CO2 is well mixed in the atmosphere and a single monitoring station at Mauna Loa, close to an active volcano, was accepted as representing the worldwide trend. Similarly, it is assumed that the 7 stations ocean pH time series (or even just the HOT time series) may be used to represent the world ocean pH with support by a model and some scattered measurements by buoys and cruises (Takahashi et al, 2014). The latest NASA OCO-2 measurements (NASA, 2015; Swenson, 2015) tell us that what we do not know of the present CO2 pattern is exceeding what we do know. Similarly, the present ocean pH pattern is unknown.
According to the press release Lamont-Doherty Earth Observatory (2014) citing the work by Takahashi et al (2014), the “oceans pH is changing in step with the rising CO2 emission”. It is not clear what observational evidence this is based on, if any, or if it is everything derived from modeling. They further claim the “oceans have taken up a quarter of the carbon dioxide humans have put in the atmosphere over the last two hundred years” and as a consequence, “the oceans are growing more acidic as they absorb our excess CO2”. “Since the industrial era began, average surface seawater pH in temperate oceans has fallen from 8.2 to 8.1 by 0.1 pH unit”. How this number is derived is hard to say. If the past measurements are neglected, there is no basis for any such claim. But apart from the past, it is the spatial pattern proposed by Takahashi et al (2014) that also appears to be incorrect.
Not surprisingly, the press release about the results of Takahashi et al (2014) claims that “this is exactly what we’d expect based on how much CO2 we’ve been putting in the air”. It is perhaps more probable that this “expectation” was the driving force of the project.
The recent data (NASA OCO-2 data; Swenson (2015); NASA (2015)0 have shown that the belief Mauna Loa represents the world CO2 is completely false. These data also show that the actual emission and sequestration in addition to the actual transport and diffusion mechanisms are very far from the simplistic models’ description. The measured surface CO2 from the NASA OCO-2 project differ considerably from the NOAA/PMEL estimated ocean CO2 and pH as proposed by Takahashi et al (2014) or the many other models supporting the global warming narrative.
Figure 8 presents the latest NASA OCO-2 images of the CO2 fluxes (data from NASA (2015), analysis by Swenson (2015), images from Swenson (2015)). Left to right, top to bottom: Oct 1 – Nov 11, 2014; Nov 16 – Dec 31, 2014; Jan 1 – Fe15, 2015; Fe16 – Mar 31, 2015; Apr 1 – May 15, 2015; May 16 – Jun 30, 2015; Jul 1 – Aug 15, 2015; Aug 16 – Sep 12, 2015. Figure 9 presents the NASA OCO-2 CO2 flux over the entire year from September 2014 to October 2015 (data from NASA (2015), analysis by Swenson (2015), image from Swenson (2015)).
These images do not fit well into the Ocean CO2 flux and pH narrative of PMEL/NOAA. Figure 10 presents the maps of pCO2, pH and CO2 from Takahashi et al (2014). The present time global map of ocean pH by PMEL/NOAA is similar to the present time global map of ocean CO2 flux by PMEL/NOAA. The pH and CO2 spatial distribution by PMEL/NOAA are consistent. The CO2 spatial distribution by PMEL/NOAA is however conflicting with the latest NASA OCO-2 measurements. There are clearly great differences between the NASA OCO-2 CO2 fluxes that are mostly measurement results and the CO2 results of PMEL/NOAA that are mostly manufactured results built from numerical reconstructions of scattered and selected measurements to produce a consensus pattern. As the PMEL/NOAA pH and CO2 results are closely related, it may be concluded the present spatial distribution of the ocean pH is mostly unknown also at the present day.
3 The likely pH pattern
The FEEL2899 substitutional evidence had more than 2.5 million points of ‘inaccurate’ measurements replaced by not better simulations.
The ‘accurate’ measurements are only available to cover less than two decades and in very few selected locations worldwide (8), and all collected as part of Intergovernmental Panel on Climate Change (IPCC) sponsored assessments these time series are not free of inaccuracies.
The Hawaii Ocean Time (HOT) series despite having many gaps arbitrarily filled and being arbitrarily extended by simulations is too short to clear the trend of natural variability.
The independent Monterey Bay project time series neglected in the IPCC assessments opposite to the HOT time series is similarly short but does not show any declining trend.
There is not enough truly observational ‘evidence’ to make any claim of declining pH cleared of multi-decadal oscillations, and therefore the ocean acidification issue is pure speculation.
The actual measurements of ocean pH are too scattered in time, latitude, longitude and depth, and performed with too many different methods of variable accuracy, to permit a meaningful computation of global trends cleared of natural inter annual, decadal and multi-decadal variability.
The data available do not permit to answer the questions of what is actually the present pattern of pH of the oceans and how is it changing, and if these changes are due to natural variability or they are man-made, and if the anthropogenic CO2 emission is really the driving force for all the changes, that unfortunately are not being discussed in the settled science of global warming.
4 Consequences of pH changes
Not only the amount of real information available is insufficient to infer clear trends in pH variations, in addition the possible consequences of the likely pH variations may be far less dramatic than the exaggerated claims of IPCC (2013).
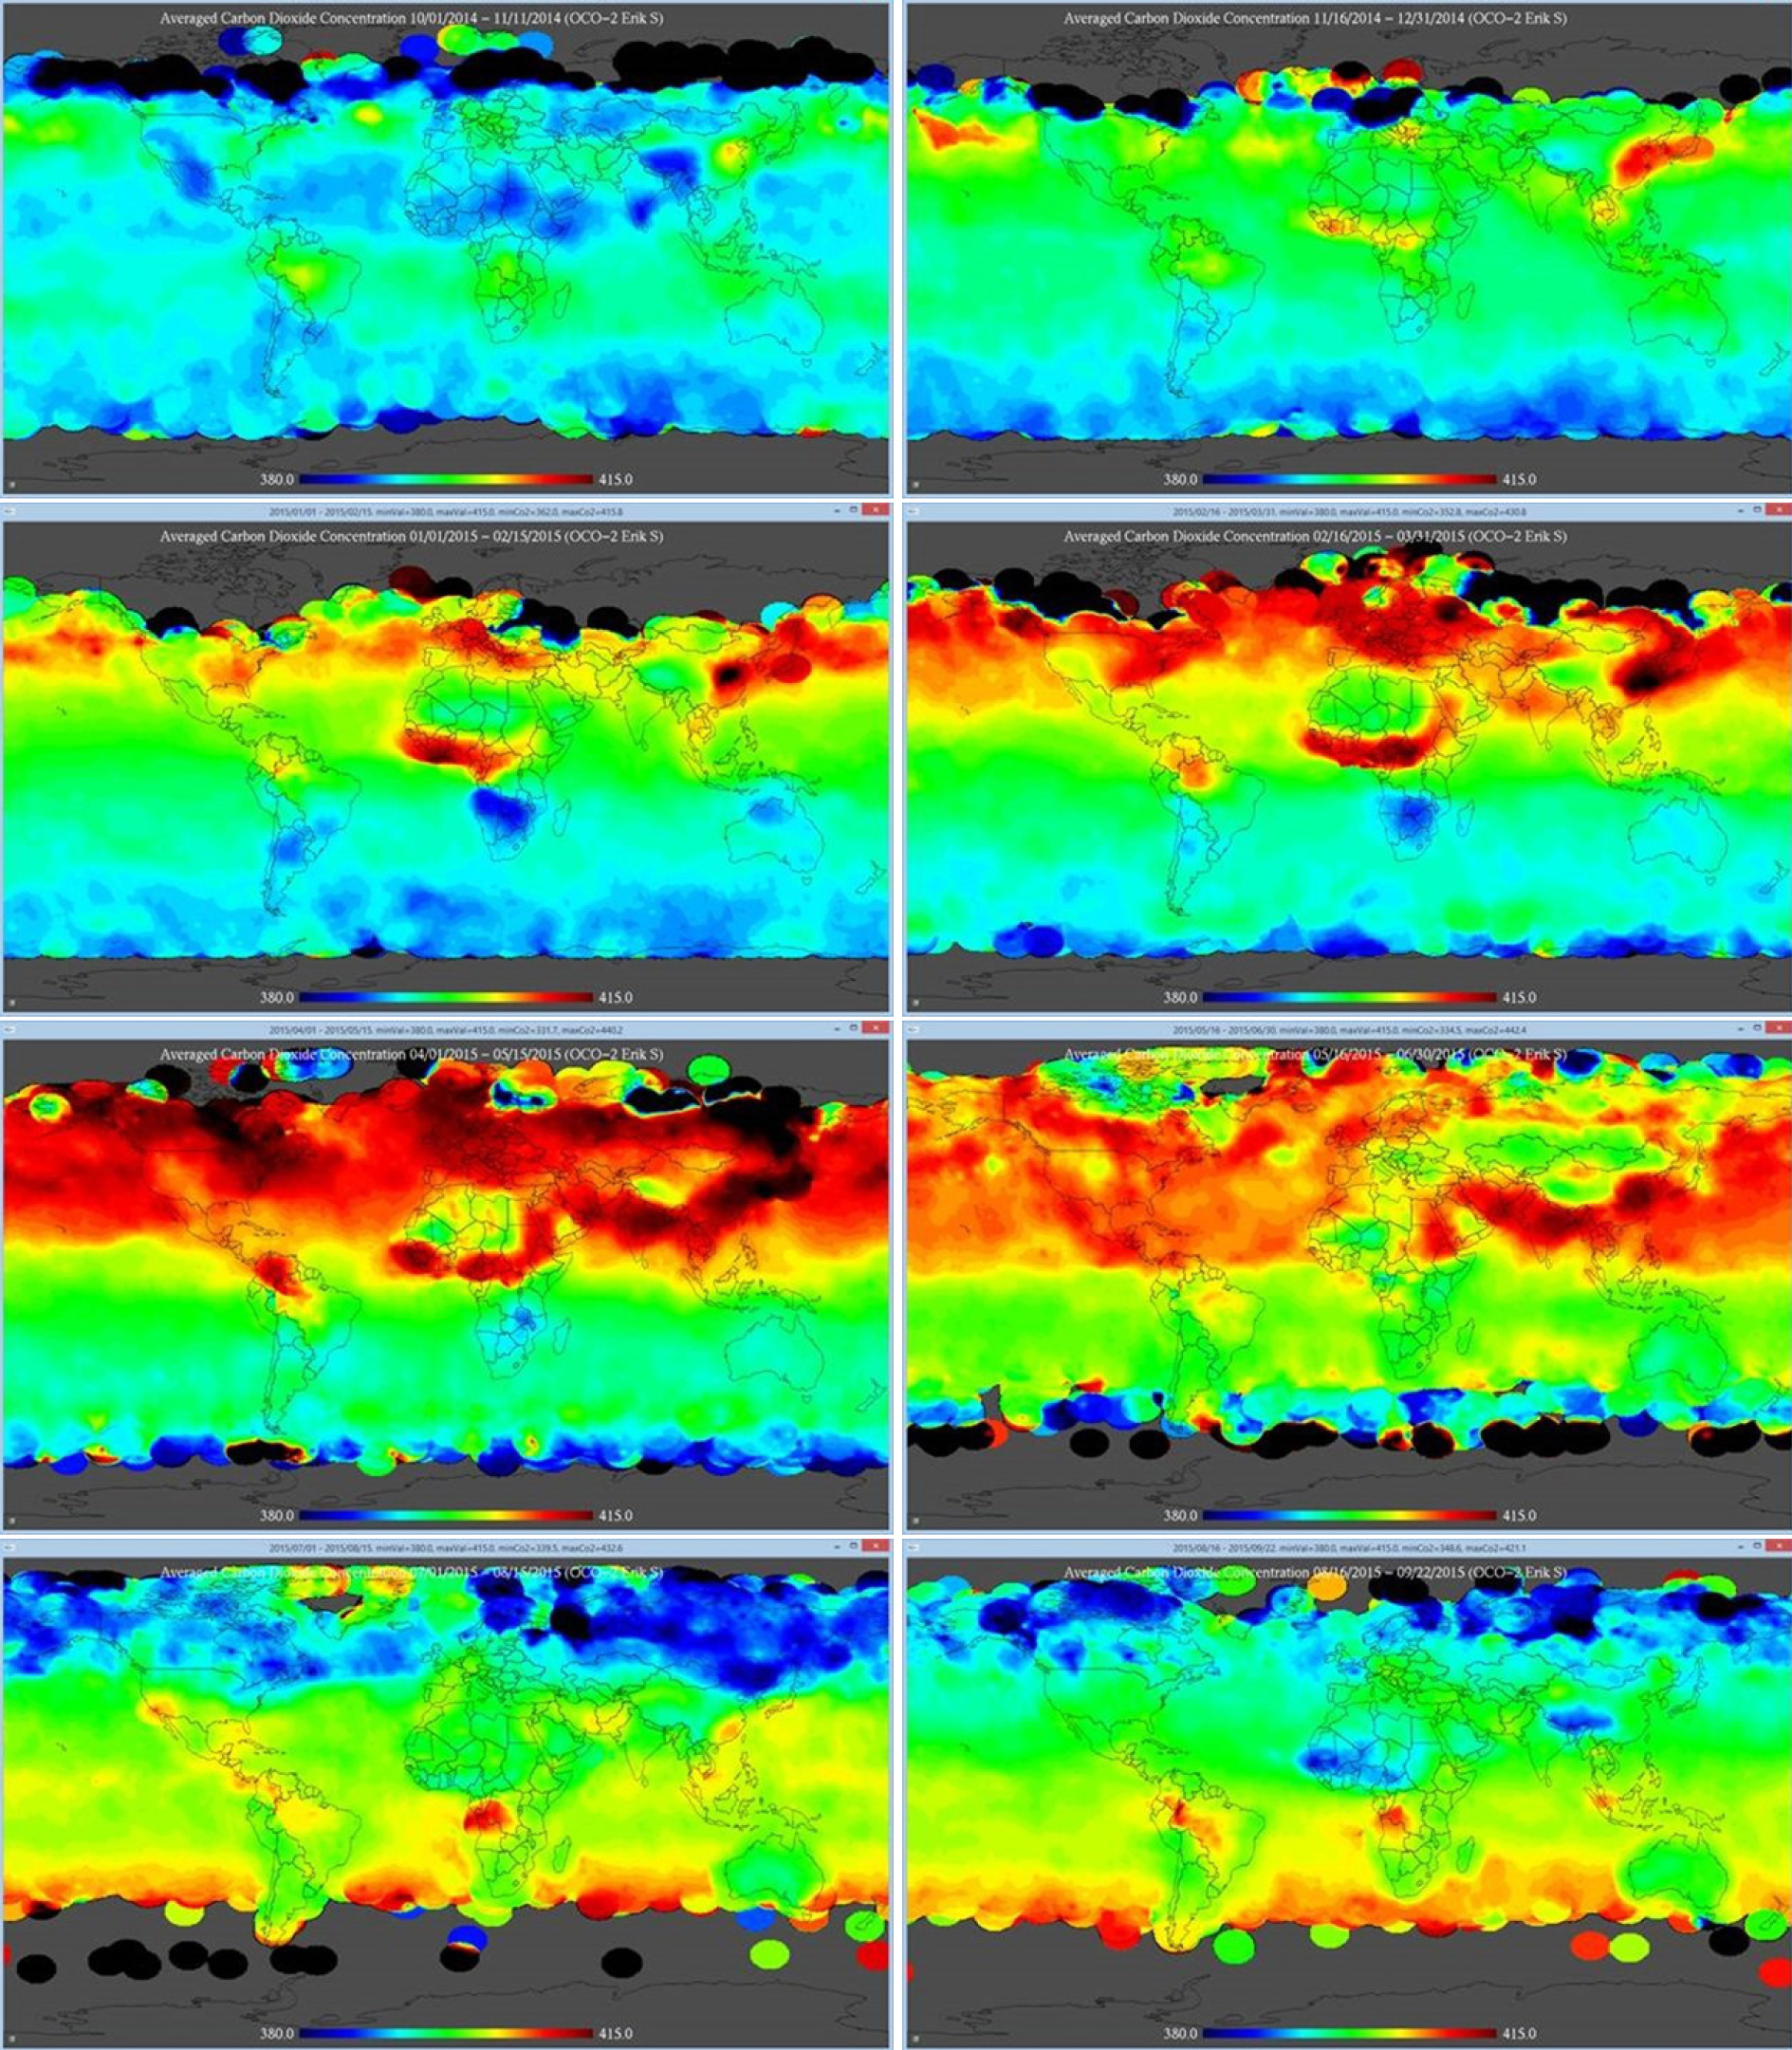
NASA OCO-2 images of the CO2 fluxes (data from NASA (2015), analysis by Swenson (2015), images from Swenson (2015)). Left to right, top to bottom: Oct 1 – Nov 11, 2014; Nov 16 – Dec 31, 2014; Jan 1 – Fe15, 2015; Fe16 – Mar 31, 2015; Apr 1 – May 15, 2015; May 16 – Jun 30, 2015; Jul 1 – Aug 15, 2015; Aug 16 – Sep 12, 2015.
As Kaiser (2010) correctly pointed out, the supposedly ocean acidification is largely based on unrealistic biologi cal experiments, using measurements over an insufficient time to allow any trend delineation, and lacking understanding of the chemistry involved.
NASA OCO-2 images of the CO2 fluxes over the entire year from September 2014 to October 2015 (data from NASA (2015), analysis by Swenson (2015), image from Swenson (2015)).
Oceans are alkaline, with pH well above 7, approximately 8 to 8.2 on average, and fluctuating with the seasons, and from year to year, from decade to decade, from one geographical area to another, from one ecosystem to the other, from the surface down to the deepest layers. Oceans are not ‘acid’, which by definition is a pH below 7.
The ocean pH changes with the seasons because of photosynthesis, as this process is most pronounced when the sunlight intensity reaches a maximum. The ocean pH is alkaline due to the overall effect over many annual cycles of photosynthetic activity is an increase in water pH. Photosynthesis counteracts the acidic effect of CO2 reducing the CO2 to non-acidic plant matter. In addition, it incorporates nitrogen to create alkaline amines which increase the pH. The supposedly negative effects of CO2 on organisms in water are not evidenced in the water of laboratories and over a short period of time. In laboratories, any significant influx of CO2 to the water reduces the alkalinity (relative acidity), and organisms may not be happy about that, but these experiments do not reflect what is happening in nature as they omit the counteracting effect of photosynthesis and other driving forces of pH variations.
Ollier (2012) further supports these statements by noting that a pH less than 7 (that is ‘acid’) has not happened through at least the past 600 million years because it would dissolve lime stones, and limestone have been deposited in the sea and not re-dissolved in the sea through all that time, no matter that the CO2 levels in the atmosphere were sometimes even much higher that today. Marine life actually flourishes where CO2 is abundant. In the ‘Bubble Bath’ near Dobu Island, Papua New Guinea, CO2 of volcanic origin is bubbling visibly through the water and abundant life flourishes to make the spot a spectacular diver’s delight.
Ocean pH varies in time and space significantly but nobody has ever measured ocean water below 7. The likely result of human emissions of CO2 may be better an increase in oceanic CO2 that could stimulate photosynthesis and calcification in a wide variety of corals. Marine life, including that part that fixes CO2 as the carbonate in lime stones such as coral reefs, evolved on an Earth with CO2 levels many times higher than those of today. Creatures such as corals that build carbonate shells and skeleton need CO2 to make the carbonate (CO3). It may be more true to say that today’s marine life is getting by in a CO2deprived environment. We have to consider coral growth, erosion, transport and deposition of sediment and many other aspects of coral island evolution – not just the pH of seawater to understand the coral evolution. Studies as Herfort, Thake and Taubner (2008) or Webb and Kench (2010), actually support relatively stable pacific islands coral reefs over the past twenty years despite the rise in atmospheric CO2 over the same period. Ollier (2012) concludes that the sequestration of CO2 by living things is far more important than trivial additions to the atmosphere caused by human activity.
5 Discussion
As commented by Steele (2015), anthropogenic ocean acidification is claimed without first determining if any current pH trends lies within the bounds of natural variability. Claims of acidification are based on an ‘accepted scientific paradigm’ that higher atmospheric CO2 concentrations result in more CO2 entering the oceans and lowering pH. But the ever-changing conditions of surface waters include far more powerful effects.
Whether we examine seasonal, multi-decadal, millennial or glacial/interglacial time frames, ocean surfaces are rarely in equilibrium with atmospheric CO2. It is possible that the balance between upwelled acidic waters versus carbon sequestration and export by the ‘biological pump’ is the key factor maintaining high pH in oceanic surface waters. The communities of plankton that operate the pump undergo changes on seasonal, multi-decadal and millennial time scales – changes we are just beginning to understand but cannot ignore.
6 Conclusions
So where are the oceans headed? As correctly pointed out by Steele (2015) if history repeats itself, declining solar insolation will result in less upwelling, lower biological productivity, a reduced biological pump and higher pH. Or perhaps higher levels of atmospheric CO2 will increase productivity as observed in several experiments. Or perhaps rising CO2 will cause a deleterious decline in pH? The uncertainties arising from the current under sampling of oceans allows anyone to find experimental support for their favorite theory, no matter what theory they prefer.
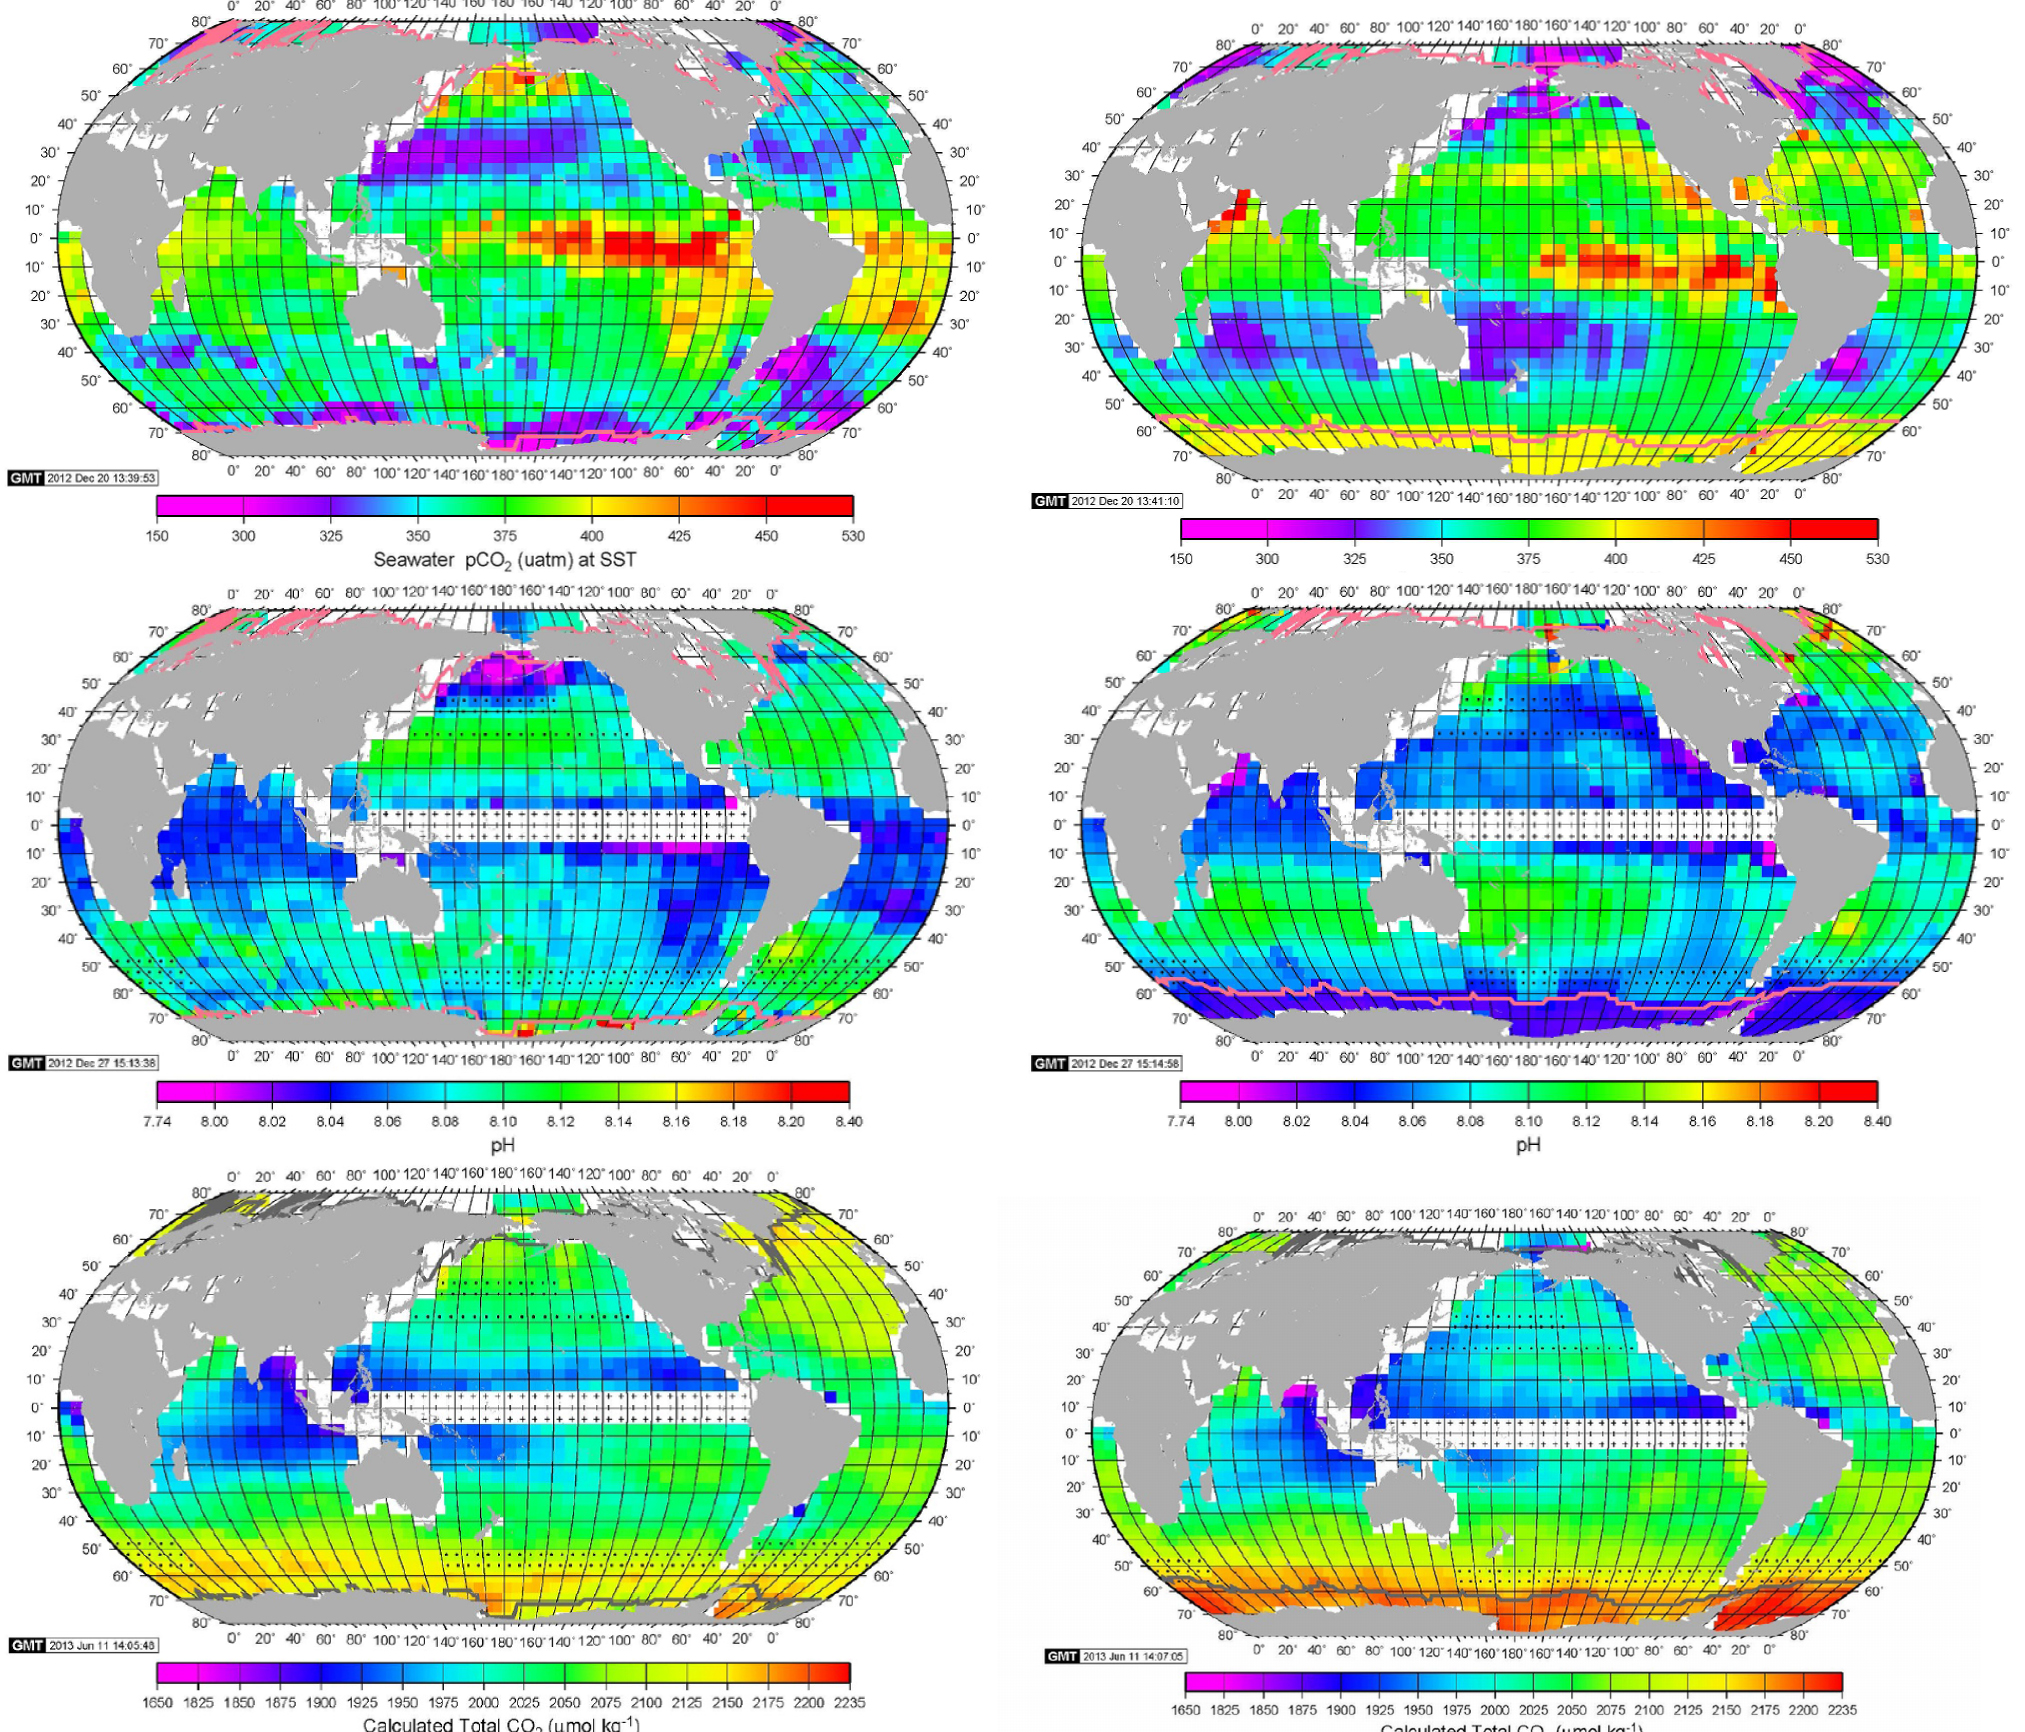
Maps of pCO2, pH and CO2 from Takahashi et al (2014). Top to bottom, left to right are the pCO2, pH and total CO2 maps for February 2005 and April 2005.
The climate model predictions routinely fail when compared to real observations, whether it related to temperature, rainfall, sea ice or sea levels. The modern style of climate science is therefore replacement of past observational evidence of temperatures, rainfall, sea ice or sea levels and now ocean pH, and use models to manufacture a trend compliant with the global warming narrative.
I have shown that the measurements of ocean pH, including the Aloha station (HOT) data, are too scattered in time and space to prove any trend. Nevertheless many measurements that are available show a different trend from the global warming narrative. These observations are therefore ignored, or replaced by modeled results.
There is not enough observational evidence to claim the ocean pH is declining, let alone that such a decline is due to increased anthropogenic carbon dioxide concentration in the atmosphere. Claims that world’s oceans are becoming more acidic, and that the average acidity of surface waters has risen by about 26% over the past 200 years have no observational support.
Acknowledgement
I thank Professor Cliff Ollier for assistance with sorting out the information and for comments that greatly improved the manuscript.
References
[1] P.J. Bresnahan Jr, et al (2014), Best practices for autonomous measurement of seawater pH with the Honeywell Durafet Methods in Oceanography 9:44–60.10.1016/j.mio.2014.08.003Suche in Google Scholar
[2] C.E. Cornwall, C.L. Hurd (2015), Experimental design in ocean acidification research: problems and solutions, ICES J. Mar. Sci. 10.1093/icesjms/fsv118.Suche in Google Scholar
[3] D. Cressey, (2015), Crucial ocean-acidification models come up short, Nature News 524,18–19.10.1038/524018aSuche in Google Scholar PubMed
[4] S. Dutkiewicz, et al (2015), Impact of ocean acidification on the structure of future phytoplankton communities, Nature Climate Change. 10.1038/nclimate2722.Suche in Google Scholar
[5] W. Eschenbach (2014), pH Sampling Density. Published 30 December 2014. http://wattsupwiththat.com/2014/12/30/phsampling-density/, visited August 18, 2015.Suche in Google Scholar
[6] W. Eschenbach (2015), A Neutral View of Oceanic pH. Published 2 January 2015. http://wattsupwiththat.com/2015/01/02/a-neutral-view-of-oceanic-ph/, visited August 18, 2015.Suche in Google Scholar
[7] Europa Environment Agency (2014), Decline in pH measured at the Aloha station. Published 19 Jun 2014. http://www.eea.europa.eu/data-and-maps/daviz/decline-in-ph-measured-at01#tab-chart_2, visited August 18, 2015.Suche in Google Scholar
[8] P. Fantazzini, et al (2015), Gains and losses of coral skeletal porosity changes with ocean acidification acclimation, Nature Communications 6, 7785.10.1038/ncomms8785Suche in Google Scholar PubMed PubMed Central
[9] R.A. Feely, C.L. Sabine, and V.J. Fabry, (2006), CARBON DIOXIDE AND OUR OCEAN LEGACY. Published April, 2006. http://www.pmel.noaa.gov/pubs/PDF/feel2899/feel2899.pdf, visited August 18, 2015.Suche in Google Scholar
[10] V. Garilli, et al (2015), Physiological advantages of dwarfing in surviving extinctions in high-CO2 oceans, Nature Climate Change 5, 678–682.10.1038/nclimate2616Suche in Google Scholar
[11] L. Herfort, B. Thake, and I. Taubner (2008), Bicarbonate stimulation of calcification and photosynthesis in two hermatypic corals, Journal of Phycology 44:91–8.10.1111/j.1529-8817.2007.00445.xSuche in Google Scholar PubMed
[12] G.E. Hofmann, et al (2011), High-Frequency Dynamics of Ocean pH: A Multi-Ecosystem Comparison, PLoS ONE 6(12): e28983.10.1371/journal.pone.0028983Suche in Google Scholar PubMed PubMed Central
[13] IPCC (2013), Assessment Report AR5 WG1. Published Printed October 2013. https://www.ipcc.ch/pdf/assessment-report/ar5/wg1/WGIAR5_SPM_brochure_en.pdf, visited August 18, 2015.Suche in Google Scholar
[14] K.L.E. Kaiser (2010), Ocean Acidification and the CO2 Propaganda, Canada Free Press. Published 14 August 2010. http://canadafreepress.com/article/26571, visited August 18, 2015.Suche in Google Scholar
[15] L. Kapsenberg, et al (2015), Near-shore Antarctic pH variability has implications for the design of ocean acidification experi ments, Scientific Reports 5, 9638.10.1038/srep09638Suche in Google Scholar
[16] K.J. Kroeker, F. Micheli, M.C. Gambi, and T.R. Martz (2011), Divergent ecosystem responses within a benthic marine com0 munity to ocean acidification, Proceedings of the National Academy of Sciences (PNAS) 108(35):14515–14520.10.1073/pnas.1107789108Suche in Google Scholar PubMed PubMed Central
[17] Lamont-Doherty Earth Observatory (2014), New Global Maps Detail Human-Caused Ocean Acidification. Published November7, 2014. http://www.ldeo.columbia.edu/news-events/new-global-maps-detail-human-caused-ocean-acidification, visited October 23, 2015.Suche in Google Scholar
[18] N.M. Lucey, et al (2015), To brood or not to brood: Are marine invertebrates that protect their offspring more resilient to ocean acidification?, Scientific Reports 5, 1200910.1038/srep12009Suche in Google Scholar PubMed PubMed Central
[19] H-K. Lui, C-T.A. Chen (2015), Deducing acidification rates based on short-term time series, Scientific Reports 5, 11517.10.1038/srep11517Suche in Google Scholar PubMed PubMed Central
[20] T. Martz, J.G. Connery, and K.S. Johnson (2010), Testing the Honeywell Durafet® for seawater pH applications, Limnol. Oceanogr. Methods 8:172–184.10.4319/lom.2010.8.172Suche in Google Scholar
[21] S. Mathesius, et al (2015), Long-term response of oceans to CO2 removal from the atmosphere, Nature Climate Change. 10.1038/nclimate2729Suche in Google Scholar
[22] P.G. Matson, T.R. Martz, and G.E. Hofmann (2011), High frequency observations of pH under Antarctic sea ice in the southern Ross Sea, Cambridge Journals Online 23(6):607–613.10.1017/S0954102011000551Suche in Google Scholar
[23] Monterey Bay Aquarium (2010), Multiple plots of the pH spot check data vs. time, for the period 1995 – present as measured in the incoming water to the Monterey Bay Aquarium. Published 13 February 2008. http://sanctuarymonitoring.org/regional_docs/monitoring_projects/100240_167.pdf, visited August 18, 2015.Suche in Google Scholar
[24] I. Nagelkerken, et al (2015), Ocean acidification alters fish populations indirectly through habitat modification, Nature Climate Change. 10.1038/nclimate2757Suche in Google Scholar
[25] NASA (2015), OFFICIAL LEVEL 2 DATA PRODUCT OCO-2. https://co2.jpl.nasa.gov/#mission=OCO-2, visited October 23, 2015.Suche in Google Scholar
[26] NOAA/NODC (2015), Global ocean pelagic pH data (GOPpH). https://www.nodc.noaa.gov/OC5/WOD/pr_wod.html, visited August 18, 2015.Suche in Google Scholar
[27] NOAA/PMEL (2015), Quality of pH Measurements in the NODC Data Archives. http://www.pmel.noaa.gov/co2/story/Quality+of+pH+Measurements+in+the+NODC+Data+Archives, visited August 18, 2015.Suche in Google Scholar
[28] M. Noon (2014), what if Obamas climate change policies are based on pHraud. Published 22 December 2014. http://www.cfact.org/2014/12/22/what-if-obamas-climate-change-policies-are-based-on-phraud/, visited August 18, 2015.Suche in Google Scholar
[29] C. Ollier (2012), The Myth of ‘Acidification’ of Oceans. Published 24 May 2012. http://quadrant.org.au/opinion/doomedplanet/2012/05/the-myth-of-acidification-of-oceans/, visited August 18, 2015.Suche in Google Scholar
[30] N.N. Price, T.R. Martz, R.E. Brainard, J.E. Smith (2012), Diel Variability in Seawater pH Relates to Calcification and Benthic Community Structure on Coral Reefs, PLoS ONE 7(8): e43843.10.1371/journal.pone.0043843Suche in Google Scholar PubMed PubMed Central
[31] Satlantic (2015), SeaFET™ Ocean pH Sensor. http://satlantic.com/seafet, visited August 18, 2015.Suche in Google Scholar
[32] C. Spencer (2015), Are the Oceans Becoming More Acidic?. Published September 15, 2015. http://wattsupwiththat.com/2015/09/15/are-the-oceans-becoming-more-acidic/, visited October 23, 2015.Suche in Google Scholar
[33] E. Swenson (2015), Finally: visualized OCO2 satellite data showing global carbon dioxide concentrations. Published October 4, 2015. http://wattsupwiththat.com/2015/10/04/finally-visualized-oco2-satellite-data-showing-global-carbon-dioxide-concentrations/ visited October 23, 2015.Suche in Google Scholar
[34] J. Steele (2015), Ocean Acidification: Natural Cycles and Ubiquitous Uncertainties, wattsupwiththat.com 25 March 2015. http://wattsupwiththat.com/2015/03/25/ocean-acidification-natural-cycles-and-ubiquitous-uncertainties/, visited August 18, 2015.Suche in Google Scholar
[35] T. Takahashi, S. C. Sutherland, D.W. Chipman, J. G. Goddard, T. Newberger and C. Sweeney (2014), Climatological Distributions of pH, pCO2, Total CO2, Alkalinity, and CaCO3 Saturation in the Global Surface Ocean, ORNL/CDIAC-160 NDP-094, September 2014. http://cdiac.ornl.gov/ftp/oceans/NDP_094/NDP_094.pdf, visited October 23, 2015.Suche in Google Scholar
[36] T. Takahashi, S.C. Sutherland, D.W. Chipman, J.G. Goddard, C. Ho, T. Newberger, C. Sweeney, D.R. Munro (2014), Climatological distributions of pH, pCO2, total CO2, alkalinity, and CaCO3 saturation in the global surface ocean, and temporal changes at selected locations, Marine Chemistry, 2014: 95–125.10.1016/j.marchem.2014.06.004Suche in Google Scholar
[37] E. Tambutté, et al (2015), Morphological plasticity of the coral skeleton under CO2-driven seawater acidification, Nature Communications 6, 7368.10.1038/ncomms8368Suche in Google Scholar PubMed PubMed Central
[38] T. Tanhua, J.C. Orr, L. Lorenzoni, and L. Hansson (2015), Monitoring Ocean Carbon and Ocean Acidification, WMO Bullettin 64(1). http://www.wmo.int/bulletin/en/content/monitoring-ocean-carbon-and-ocean-acidification#sthash.Y8wFKSoh.dpuf, visited August 18, 2015.Suche in Google Scholar
[39] J.R.A. Taylor, et al (2015), Effects of CO2-induced pH reduction on the exoskeleton structure and biophotonic properties of the shrimp Lysmata californica, Scientific Reports 5, 10608.10.1038/srep10608Suche in Google Scholar PubMed PubMed Central
[40] R. Telford (2015), Musings on quantitative palaeoecology: Not pHraud but pHoolishness. Published 26 December 2014. https://quantpalaeo.wordpress.com/2014/12/26/not-phraudbut-phoolishness/, visited October 23, 2015.Suche in Google Scholar
[41] P.C. Yu, P.G. Matson, T.R. Martz, and G.E. Hofmann (2011), The ocean acidification seascape and its relationship to the performance of calcifying marine invertebrates: Laboratory experiments on the development of urchin larvae framed by environmentally-relevant pCO2/pH, Journal of Experimental Marine Biology and Ecology 400:288–295.10.1016/j.jembe.2011.02.016Suche in Google Scholar
[42] M. Wallace (2015), Ocean pH Accuracy Arguments Challenged with 80 Years of Instrumental Data, wattsupwiththat.com, 31 March 2015. https://wattsupwiththat.com/2015/03/31/ocean-ph-accuracy-arguments-challenged-with-80-years-of-instrumental-data/, visited August 18, 2015.Suche in Google Scholar
[43] A.P. Webb, P.S. Kench (2010), The dynamic response of reef islands to sea level rise: evidence from multi-decadal analysis of island change in the central pacific, Global and Planetary Change 72:234–246.10.1016/j.gloplacha.2010.05.003Suche in Google Scholar
© 2016 Walter de Gruyter GmbH, Berlin/Boston
This article is distributed under the terms of the Creative Commons Attribution Non-Commercial License, which permits unrestricted non-commercial use, distribution, and reproduction in any medium, provided the original work is properly cited.
Artikel in diesem Heft
- Frontmatter
- Original Articles
- Dynamic Analysis of Coupled Vehicle-Bridge System with Uniformly Variable Speed
- Research Article
- A note on soliton solutions of Klein-Gordon-Zakharov equation by variational approach
- Research Article
- Analytical and numerical validation for solving the fractional Klein-Gordon equation using the fractional complex transform and variational iteration methods
- Research Article
- Thermal radiation and chemical reaction effects on boundary layer slip flow and melting heat transfer of nanofluid induced by a nonlinear stretching sheet
- Research Article
- Homotopy analysis transform algorithm to solve time-fractional foam drainage equation
- Research Article
- Effects of Soret, Hall and Ion-slip on mixed convection in an electrically conducting Casson fluid in a vertical channel
- Research Article
- Chaos suppression of Fractional order Willamowski–Rössler Chemical system and its synchronization using Sliding Mode Control
- Research Article
- Comparative study of synchronization methods of fractional order chaotic systems
- Research Article
- Spectral Quasi-linearisation Method for Nonlinear Thermal Convection Flow of a Micropolar Fluid under Convective Boundary Condition
- Research Article
- Pattern recognition of ocean pH