Abstract
Satellite altimetry (SA) is one of the most valuable techniques that measure the sea level data at both the near-coast and offshore. There exists, however, multiple challenges and hindrances in determining and using accurate sea level data. The most pertinent is that evaluation of SA performance requires that all data sources (such as tide gauges (TG) and hydrodynamic models (HDMs)) refer to the same vertical datum. Thus, knowledge of the geoid (equipotential surface of the earth) is essential in linking different sources of sea level. Accordingly, this study examines performance of along-track data for three satellite missions (Sentinel-3A, Jason-3, and Sentinel-6A) to obtain realistic sea level variation and to determine the accuracy of the various missions in the complex area of the eastern Baltic Sea. The methodology consisted of utilizing SA, HDM, and TG data and a high-resolution geoid model. Results show that root-mean-square error (RMSE) varied for Jason-3 within a range of 1.68–50.14 cm, Sentinel 3A with a range of 2.8–46.27 cm, and Sentinel 6A with a range of 3.5–43.90 cm. Sentinel 6A was determined to be the most accurate and reliable satellite mission. Results also showed higher RMSE (15.7–46.2 cm) during (i) the seasonal sea ice month (e.g. March 2018); (ii) at locations of several islands (e.g. eastern section of Gulf); and (iii) at locations where rivers discharged into the Gulf (e.g. Nava, Kemi, Luga, and Neva rivers). These features tended to show up as peaks in the final results even though robust data processing for outliers were undertaken. These results suggests that improvements can still be made in the SA retrackers and also in the data-processing techniques utilized.
1 Introduction
Satellite altimetry (SA) is an advancing technology that is constantly being improved and perfected over different satellite missions to capture sea level at both the coast and offshore area. Currently (as of year 2022), there are eight SA missions observing the Earth (CyroSat-2, HY-2A, HY-2B, SARAL, Sentinel-3, Jason-3, Sentinel-6, SWOT) (Grgic and Bašić, 2021). With satellite missions being utilized for various purposes and with new advanced features being implemented, it is important to examine the performance of some of the newest satellite missions. This is essential to determine whether the new advances implemented (e.g. corrections, retracking algorithms) actually improve the accuracy and quality of sea level data. As a result, this study examines the accuracy of the Sentinel-3A and Jason-3A (both launched in 2016) and the recent Sentinel-6A (launched in 2020) mission. However, to actually access the sea level accuracy of a particular satellite mission requires that some sea level source serves as the ‘ground truth’. Fortunately, there exist several other potential sources that can be utilized. For instance, some of the most common sources of sea level data are tide gauges (TG), SA, and hydrodynamic models (HDMs). Whilst these sources are capable of obtaining the sea level, they, however, are often limited in their capabilities by different resolutions (in both space and time) and dissimilar or unknown vertical reference datum (Jahanmard et al., 2021). It is important to note that these various sources will also have different constraints based on their method of acquirement (e.g. models vs in situ). Intuitively, however, comparison of different data sources potentially allows determination of the problematic issues (both spatially and temporally) among the data sources. Nevertheless, for this to be effective, it is first essential that all the different sources be referred to the same vertical datum and that one of the sources should be identified as representative of the “almost ground truth.”
This study explores a method for deriving sea level data obtained from TG, HDM, and SA to a common vertical datum, with basically TG representing the “almost ground truth.”
TG records are known for being one of the most reliable sources of sea level. Typically, their vertical reference datum refers to some chart datum (e.g. some historic mean sea level, lowest astronomic tide) or a physical model like the geoid (IHO, 2020). One major limitation of TG is that they are often land bounded, which means that they do not represent offshore domain (Mostafavi et al., 2021). HDMs, on the other hand, can simulate sea level data for both coastal and offshore areas. They are based on a series of Navier–Stokes mathematical equations, which try to attempt to model reality by using meteorological and hydrological data (Lehmann, 1995; Ophaug et al., 2015). Nevertheless, a major disadvantage of HDM is that the vertical datum is often undisclosed. This implies that only reliable and available source of sea level for both near-coast and offshore is SA.
The basic measurement process of SA measurement is that a pulse of radiation with known power is transmitted from the satellite towards the sea. The pulse interacts with the rough sea surface and part of the incident radiation within the altimetric footprint reflects back to the radar altimeter, which records the returned echo of the pulse.
Using SA data, the time and thus the distance (range) of the altimeter to the target (liquid) surface is determined. Knowledge of the precise positioning of the satellite itself allows the altitude of the satellite to be calculated. The difference between the altitude of satellite and the range allows the sea surface height (SSH) to be derived. The vertical reference of SSH, however, is the reference ellipsoid (Figure 1).
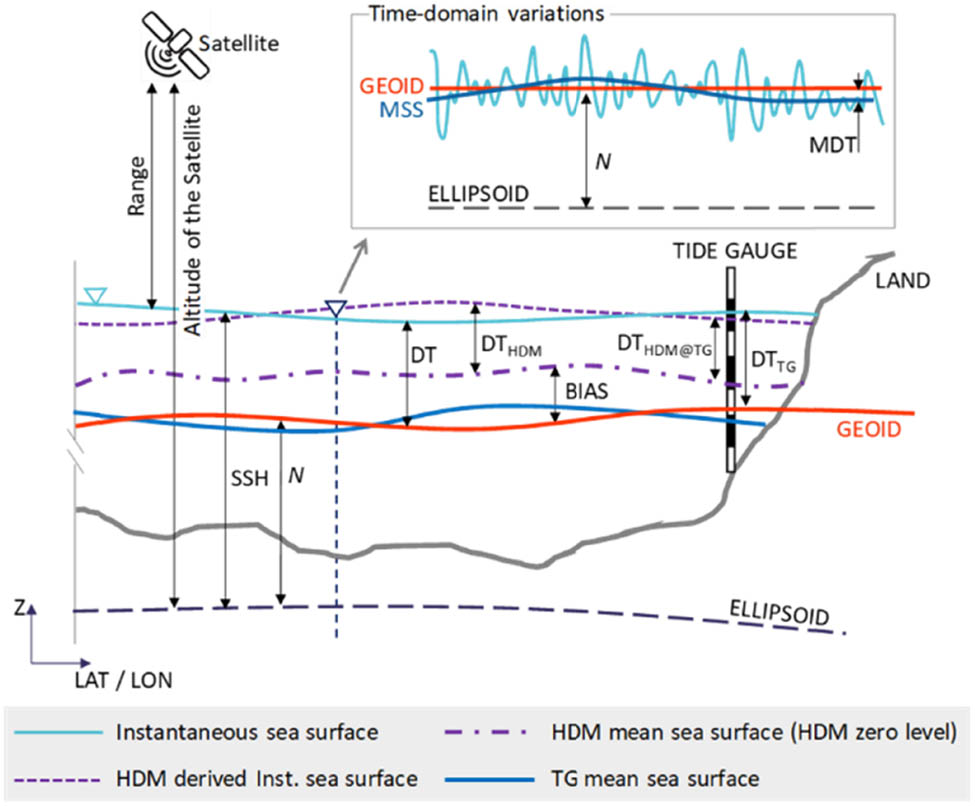
Involved data types, vertical datum, and interrelations between them (Jahanmard et al., 2021).
This indicates that whilst SSH is useful and many studies have reliably used SSH for validation (Mostafavi et al., 2021; Birgiel et al., 2019) and climate change studies, it does not represent the sea level with respect to a physical surface but to the reference ellipsoid, which is a mathematical model. For satellite data to realistically represent sea level data, the geoid should be utilized. The geoid represents the shape of the equipotential ocean surface under the influence of the gravity and rotation of Earth alone (i.e., without the influence of winds, tides). This indicates that the geoid can be considered as the natural “zero” which represents a stable physical vertical datum. The geoid gives an understanding of realistic heights and depths. The importance of accurately defining the geoid is that the dynamic topography (DT) can now be derived by subtracting SSH from the geoid (N), i.e., SSH-N. This concept is illustrated in Figure 1. Deriving DT now allows realistic physical knowledge of that sea level that can be used to determine ocean current (GGOS, 2022), sea level variations (Mostafavi et al., 2023), and so on. Calculation of DT also allows comparison with other sources of sea level data, which shall be explored in this study. Once the TG vertical datum is referred to the geoid (TG-based DT is used here), it indicates that it is compatible with the SA-derived DT.
Both sources are now referred to the same common vertical datum. This indicates that the HDM is the only other source that is not referred to the geoid. To make the HDM compatible with the TG and SA requires development of a method to refer the HDM sea level data to the geoid. Several studies have attempted such development by using the geoid-referred TG to shift the HDM data (Jahanmard et al., 2021, 2022). This study utilizes a similar approach as that performed in the study by Jahanmard et al. (2021) by using simple linear interpretation. Thus, once both TG and HDM data are referred to the geoid, a comparison can be made with different satellite missions. For such a method to be implemented requires (apart from SA sea level data) a reasonable network of TG data that are referred to the geoid, an accurate high-resolution geoid, and a HDM. The Baltic Sea region is a study site that has been fortunate to have access to mentioned high-resolution datasets and well-developed regional geodetic infrastructure. The Baltic Sea is known for its’ many archipelagos, complex coastlines, and presence of sea ice, which has made it challenging for obtaining accurate sea level data (Passaro et al., 2021). Due to these characteristics and varying sea level dynamics of the Baltic Sea, it is important to access how accurate the SA-derived sea level data are in the region. Thus, this research focuses on examining the accuracy of multi-mission SA data in the eastern section of Baltic Sea – the Gulf of Finland.
Previous studies have examined the accuracy of various SA derived sea level data for the Baltic Sea (Mostafavi et al., 2021; Birgiel et al., 2018, 2019; Liibusk et al., 2020). For instance, Mostafavi et al. (2021) reported the obtainable accuracy as of 8.5–7.7 and 3.9–5.0 cm for JA3 and S3 re-tracked datasets, respectively. Whilst Birgiel et al. (2018) reported that Sentinel-3 accuracy varied from 5.2–19.9 and 6.4–13.5 cm. These studies used different time periods, and the actual derivation of the DT was not performed. This study now examines a different perspective of using SSH instead as done in many earlier studies. We now derive the DT to examine the realistic sea level variation and the accuracy of various satellite missions. Sentinel-6 is one of the newest SA missions being explored in this study.
Sentinel-6 Micheal Freilich satellite was launched in November 2020, but its high-resolution data became only available from November 2021 (ESA, 2021). Limited studies have been performed on the accuracy of Sentinel-6 SA derived DT, and it is expected that the results of this study can be used for further improvements in sea level determination. Given that each new SA mission is with improvements, the following questions are now examined in this study: (i) What is the performance of the different missions and (ii) Do new satellite missions and re-trackers improve the accuracy of sea level data? As a result, this study examines the performance of three different satellite missions, Sentinel-3A, Jason-3, and Sentinel-6A, at two different time periods –Sentinel-3A in 2018 and Sentinel-6A and Jason-3 at the end of the year 2021 and beginning of 2022. The newest contribution examines the latest Sentinel-6A satellite mission that is comparable to the results of Jason-3 satellite mission because they pass over the Gulf of Finland at the same track with around 2 min apart. To compare the performance of all three satellite missions, two aspects are explored:
Along-track perspective – compare SA and HDMs to determine the realistic sea level data (i.e., DT) and the accuracy of the SA and
Inter-comparison of SA missions may hint of problematic areas or with sources of data.
The organization of this article is as follows: Section 2 presents the methodology section where the developed methodology is described. Section 3 describes the study area where some essential characteristics of the Gulf of Finland is described. Section 4 is an essential part of the study where the processing of the different SA missions are described in detail. Section 5 continues with a description of the HDM and TG data sources used. Section 6 presents the results of the data analysed followed by a discussion. Section 7 presents the conclusion where the main findings are summarized.
2 Method
Due to the fact that every data source used in this study uses various reference ellipsoids or arbitrary vertical datum, the methodology consisted of various data examinations and interpolations, such as correction for the ellipsoidal correction, adding land uplift, calculating DT and removing outliers. This can be viewed in Figure 2 for each data source used. Methodology is explained in detail in following subsections.
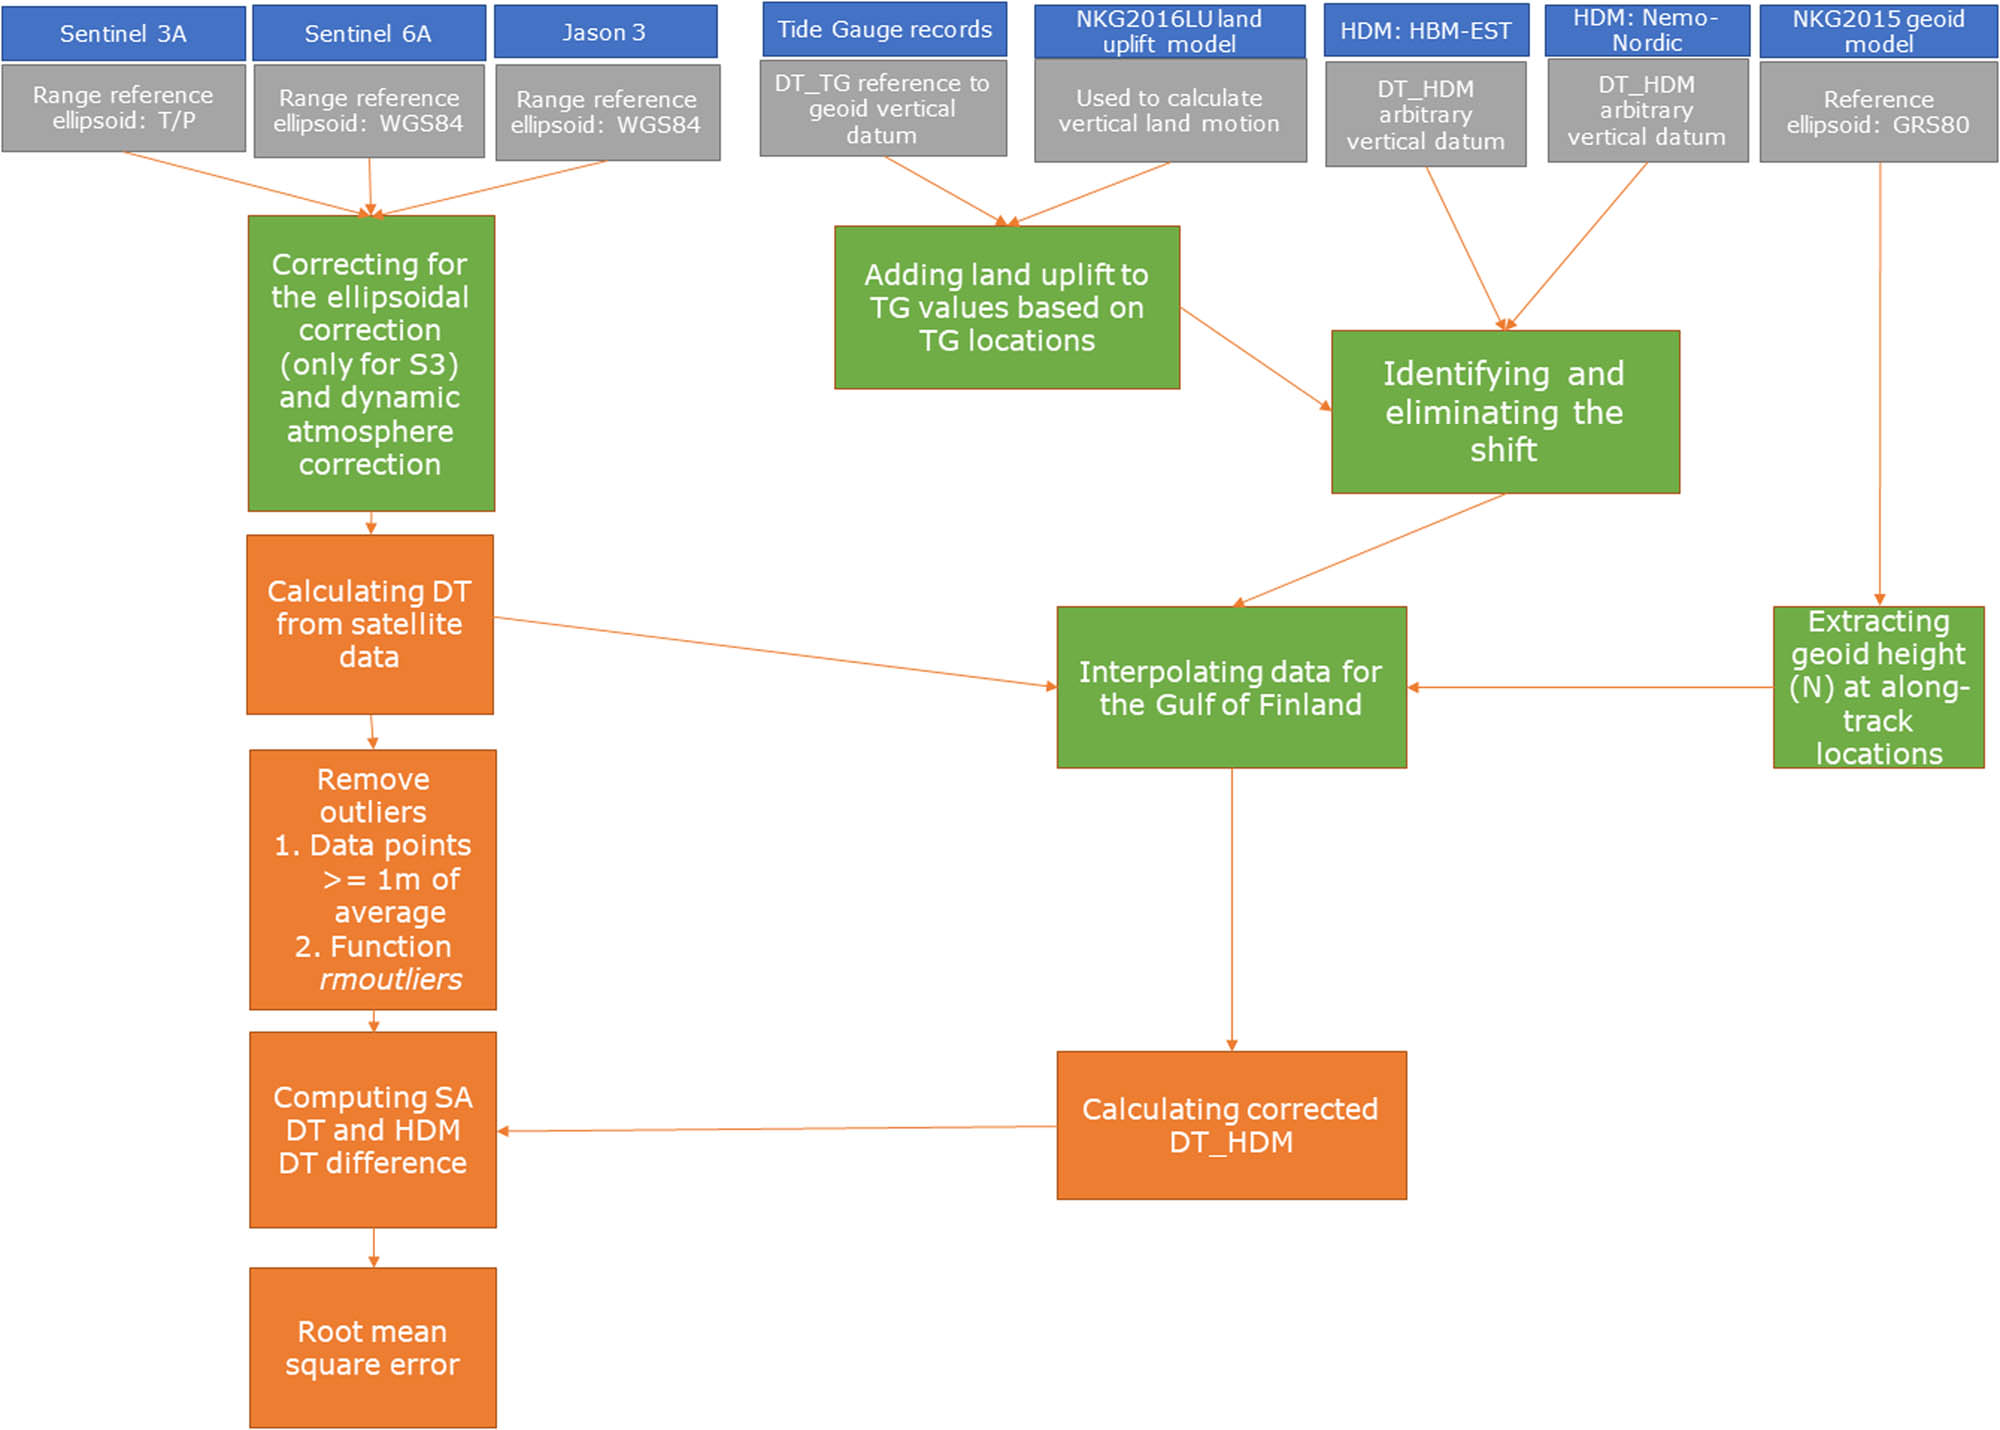
Flowchart of the methodology applied.
2.1 Satellite derived DT
The basic concept of satellite measurement is that the satellite altimeter sends pulse-like signals of known power towards the sea surface. After interacting with the sea surface, the pulse is reflected back from the sea surface to the altimeter, where the two-way travel time is computed. This gives the variable range R obs of the satellite. From the reference ellipsoid, h SA is determined and the SSH is calculated (cf. Figure 1):
where the corr term represents all the corrections used to compute SSH. For example, these corrections consists of dry tropospheric correction, wet tropospheric correction, dynamic atmosphere corrections (DACs), and so on. In this study, two other corrections are applied.
The ellipsoidal correction dh corrects the SSH data due to usage of different reference ellipsoid. This correction is taken into account (e.g. by Jekeli (2006)), while calculating SSHSA for Sentinel-3. (Sentinel-3A data are referred to Topex-Poseidon reference ellipsoid, whereas the rest of SA data and the geoid model are referred to GRS-80.)
The second correction is DAC. This correction is automatically removed from the SA data when downloading the data from the database, and therefore, it is de-corrected. The reason for this is to compare the instantaneous data from various sources, e.g. TG records reflect the instantaneous atmospheric pressure. The SA-derived SSH at locations (φ, λ) is then obtained:
where SSHSA(φ, λ, t) is the SA derived SSH.
Due to the SA footprint being contaminated by different causes, such as islands and coastal marine traffic, the outliers need to be removed. Outliers usually appear as steep peaks along the SSH track graphs. Outliers are removed by two steps – firstly for every data point which is over 40 cm than the average SSH value of adjacent data points and secondly by rmoutliers function (MatLab 2020), which removes outliers from the remaining data.
To obtain a more realistic representation of sea level, DT is calculated by subtracting geoidal height (N) from the instantaneous SSH:
DT represents the physical sea level as signals from both low and high frequency (GGOS, 2022) that can further be evaluated for detecting ocean currents, eddies, and so on. Hence, this DTSA is used for comparison with TG station records and the HDM model data in our study.
2.2 DT of TG
This study utilizes TG from both Estonian and Finnish coasts; however, they refer to different vertical data. On the Finnish side, the TG data are referred to the theoretical mean sea level, and on the Estonian side, the TG data are referred to the Estonian vertical data EH2000. Since the theoretical mean sea level is an arbitrary value, a conversion term is added to change the values to N2000 (the Finnish national height system). Both vertical datums of N2000 and EH2000 are national realizations of the Baltic Sea Chart Datum 2000 (BSCD2000) and therefore to the same geoid model (Varbla et al., 2022a).
Also the TGs of both Estonian and Finnish coasts are corrected for the vertical land motion (VLM), estimated from the NKG2016LU model (Vestøl et al., 2019). The absolute sea level (ASL) is calculated as follows:
where RSL(φ, λ, t) is the relative sea level measured by TG, VLM(φ, λ, t) is vertical land motion, t is the time epoch of interest, and the t 0 is reference time-epoch (Varbla et al., 2022b). Time epoch t for this study is either 2018 or 2022 depending on the satellite mission examined, and the reference time-epoch t 0 is for the year of 2000. The annual VLM values used for this study are less than 1 cm/year. Since the land uplift value in our study area is positive, then this correction increases artificially the TG DT values.
2.3 DT of HDM
To validate the SA offshore points, a regionally computed HDM is used. Essentially, the results of HDMs used in this study are equivalent to DT, but not referred to the geoid. The HDM usually provides hourly estimation of gridded DT for a time period. Due to an unknown vertical datum in the HDM, a shift between TG of both Estonian and Finnish coasts, and the HDM is found.
This shift (ShiftHDM) essentially marks the difference between TG and HDM model values, whereas it depends on the coordinates of viewable time period of the TG:
The shift (ShiftHDM) is calculated and applied to the original HDM model through linear interpolation to match with the TG values. In Figure 3, the shift is marked as a blue line. It is named as corrected HDM (
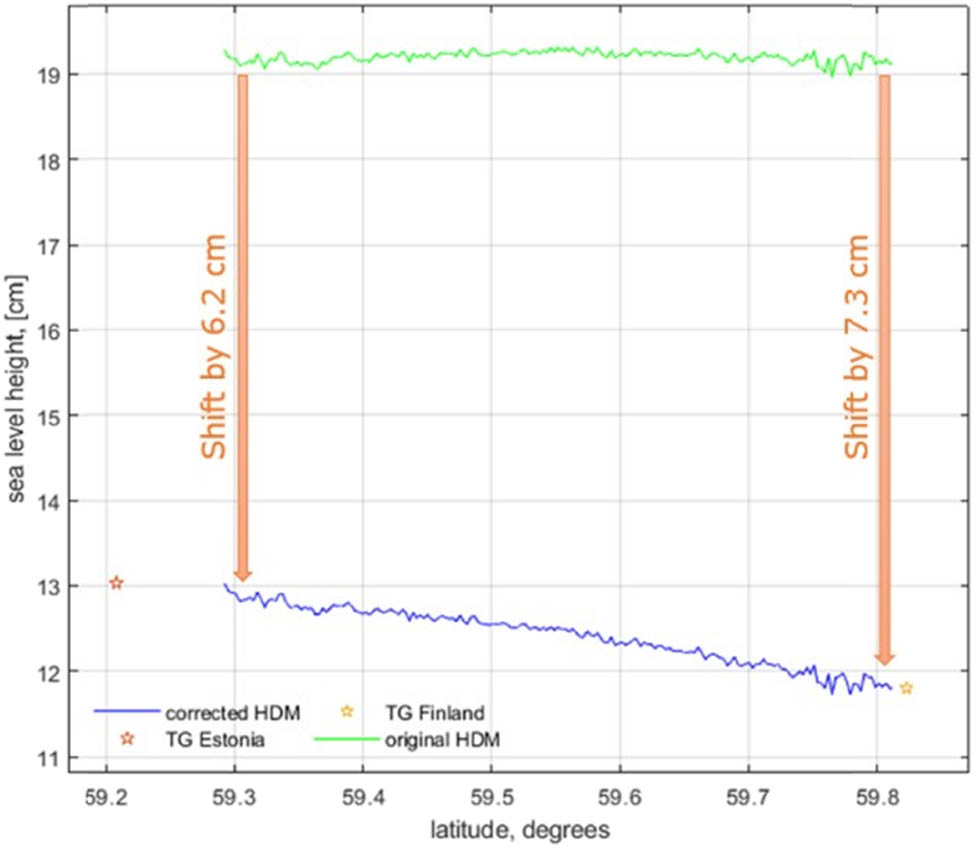
Example of tide gauges of both Estonian (vertical datum: EH2000) and Finnish (vertical datum: N2000) coast as well as corresponding original HDM at the same time instant with corrected HDM.
Difference between SA-derived DT (DT(φ, λ, t)) and corrected HDM (
This is the basic quantity that is used for evaluating the accuracy and performance of each SA dataset.
Root-mean-square error (RMSE) is used to measure difference between values of corrected HDM and the values observed from SA. In this study, the RMSE (RMSE(#track, t)) explains the difference between satellite-derived DT and the corrected HDM.
(∆DT(φ, λ,t)):
where n stands for the number of data points in the cycle.
3 Study area
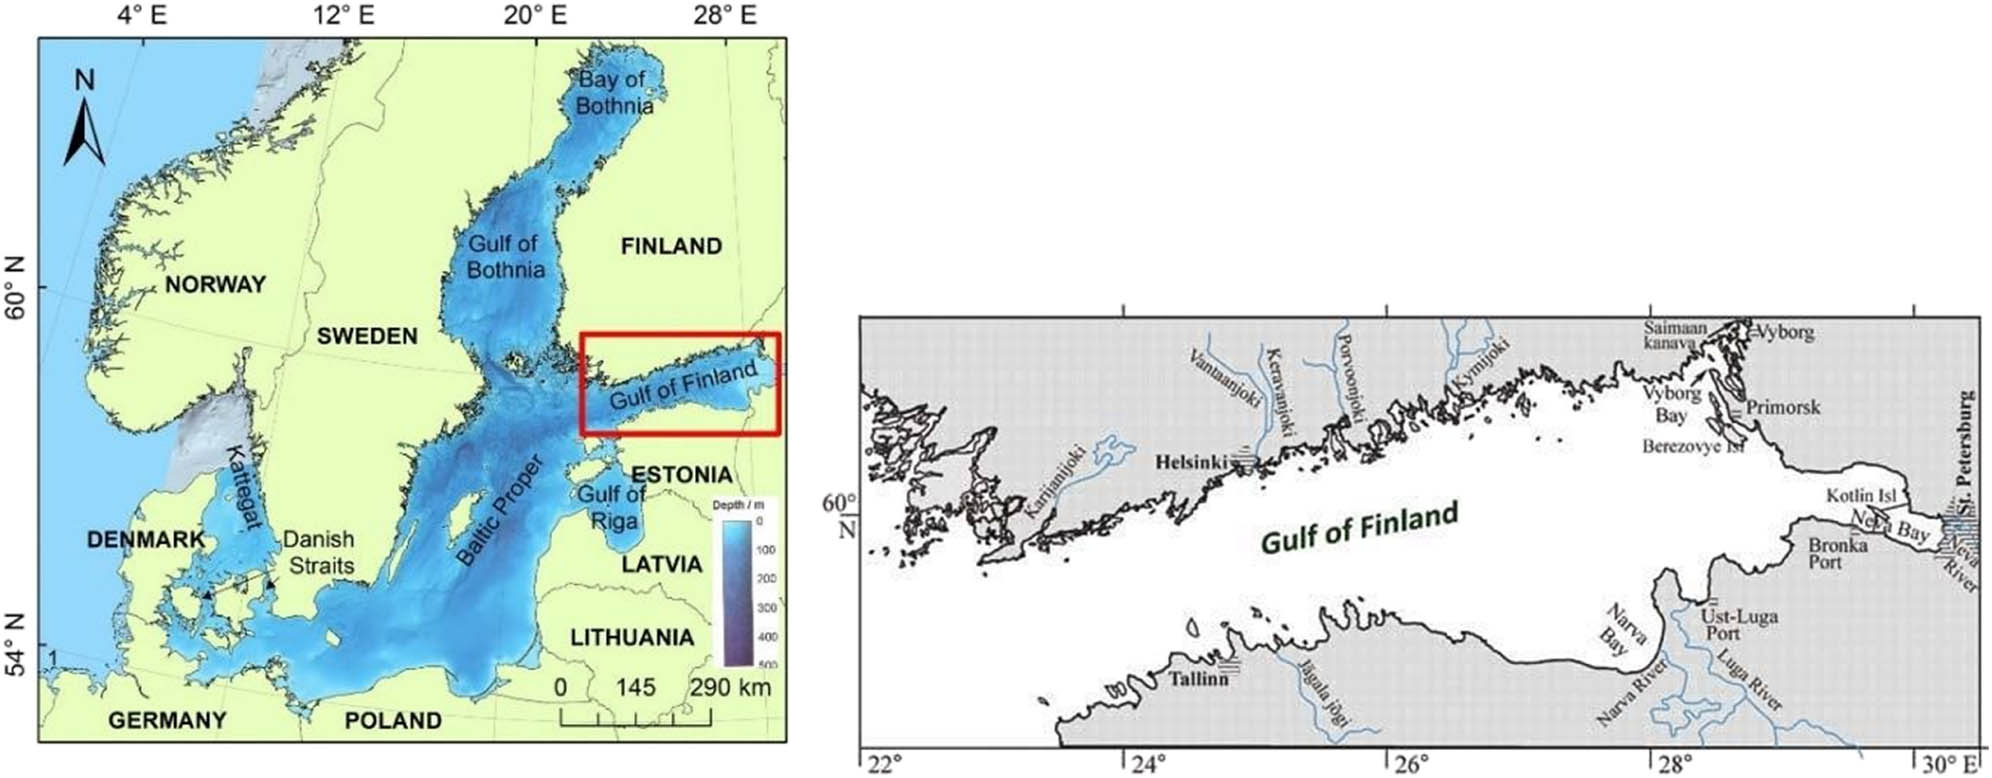
The Baltic Sea is a semi-enclosed sea located in northern Europe which are surrounded by several countries. It can be characterized as an estuarine environment, with freshwater being sourced from the numerous rivers that surround it and salt water sourced from the Atlantic Ocean that infiltrates via the narrow Danish straits. The Baltic Sea is divided into several subsections based on the geomorphology and bathymetry. This study examines the performance of SA in the Gulf of Finland that is located at the eastern end of the BS (Figure 4a).
The Gulf of Finland is narrow and elongated, having a length of approximately 400 km and a width of 48‒135 km. The mean water depth is around 38 m, and maximum water depth is 123 m (Delpeche-Ellmann et al., 2021). The Gulf is surrounded by three countries – Estonia, Finland, and Russia. The dominant wind direction is south-west, but it is common for northerly winds to also be prevalent. Storm surges (Suursaar and Sooäär, 2007) and coastal upwellings (Delpeche-Ellmann et al., 2017) are also quite prevalent in the Baltic Sea with a more or less seasonal trend. Typical wave height ranges from 0.5 to 0.8 m, and maximum wave height can be around 5.2 m (Soomere et al., 2008). Mean sea surface topography in the Gulf can range from 20 to 29 cm (averaged over 2014–2019) and occurs mostly in the eastern section of the Gulf of Finland (Kollo and Ellmann, 2019), and the extreme sea level maxima was 4.21 m in 1824 (Wolski et al., 2014). The Gulf has cliff-like or low-lying coastline with multiple peninsulas. The coastal area has many archipelagos, big islands, and rocks within 10 km from the coast, which makes it a challenge for SA. Sea ice is also present in the winter months and in some winters can even almost completely cover the whole sea area. However, improved satellite postprocessing algorithms are expected to improve the SA results in sea ice areas (Passaro et al., 2021).
Changes in Gulfs’ sea level are mainly influenced by several components that depend on the time scale investigated. Since the time frame under examination in this study is 2018 and 2021/2022, the short-term influences (yearly, seasonally, daily, etc.) are expected to occur. These short-term influences are mainly due to variation in the water balance caused by water exchange in the Danish Straits (e.g. saltwater intrusions from the Atlantic), and river runoff (e.g. Neva River which is one of the largest rivers in the Baltic sea (Figure 4b)) and ice melt are often the main drivers. On much shorter time frame (e.g. weekly, daily, and hourly), other localized events also affect the sea level. The majority of these events tends to be influenced by the meteorological factors, especially the winds. The Gulf of Finland has precise TG network (Figure 5). The Baltic Sea countries are also fortunate to have a high-resolution geoid model (NKG2015).
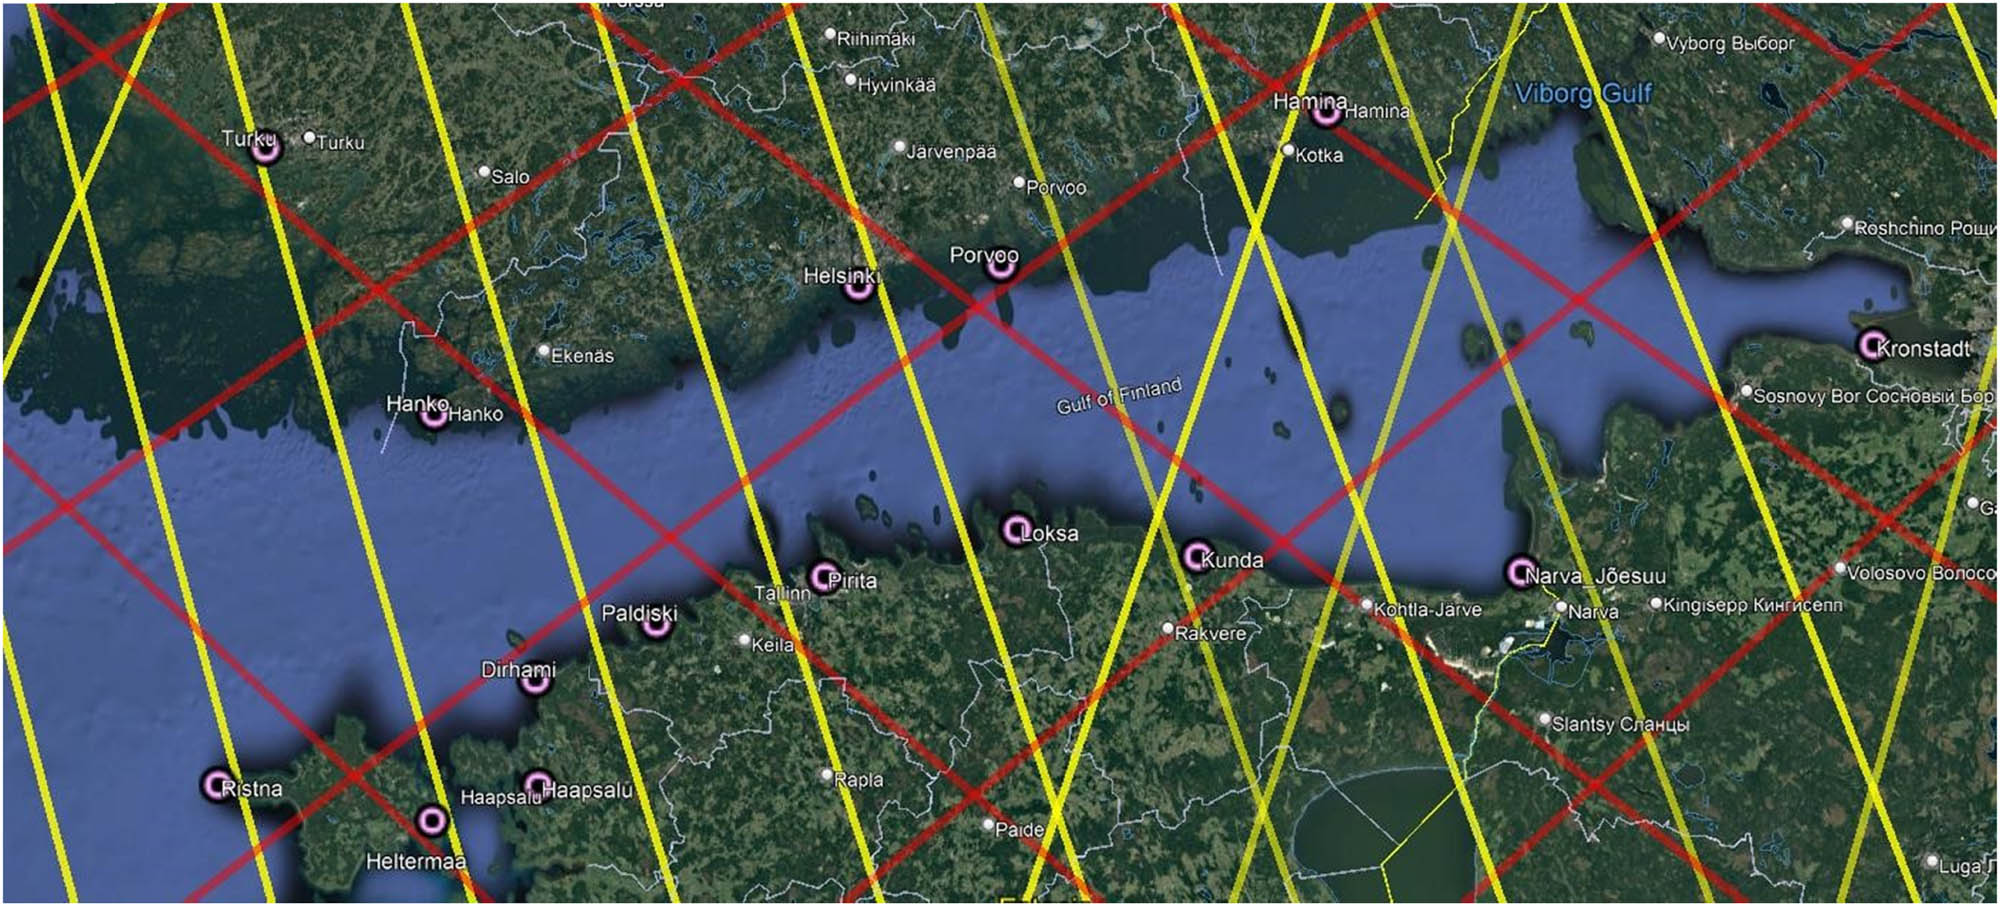
The study area of the Gulf of Finland with used tide gauges (pink circles) and used satellite tracks (Sentinel-3 in yellow, and Jason-3 and Sentinel-6 in red).
4 Used SA data
4.1 Sentinel-3A
Sentinel-3A is operated by ESA and EUMETSAT and was launched in 2016. Sentinel 3A orbits at an altitude of 814.5 km and an inclination of 98.65°. The along-track resolution is around 300 m, and across-track resolution is 1.64 km (Table 1). It is equipped with a synthetic aperture radar altimeter (SRAL) that operates in a synthetic-aperture radar (SAR) mode. SAR mode indicates that the transmit signals are sent in bursts, and this allows for an inter burst interval to receive the reflected pulses. It differs from the conventional low-resolution mode (LRM) used by previous satellites (except CRYOSAT) in that transmit and receive signals are reprocessed incoherently. In the SAR mode, it is expected that a noise reduction and a finer along track resolution would exist (Dinardo, 2020). For Sentinel 3A, both SAR mode and LRM are available, but in this study, solely the SAR mode was utilized. The Sentinel 3 data used in this study were obtained from the Baltic + SEAL dataset, which was obtained from http://balticseal.eu/data-access/. This dataset has specified algorithms derived for the Baltic Sea conditions, for instance, for the Sentinel 3 data, the ALES + SAR retacker was implemented, which are used for the delayed Doppler altimeters, and it adopts a simplified version of the Brown–Hayne functional form to track the leading edge of the waveform. The ALES + SAR is expected to improve sea level estimation especially at the coast and sea ice (Passaro et al., 2021).
Summary of types of data used for each satellite mission
| Mission | Altimeter instrument | Mode | Re-tracker | Altitude (km) | Inclination (°) | Cycle period (days) | Along-track resolution (m) | Across-track resolution (km) |
|---|---|---|---|---|---|---|---|---|
| Sentinel3A | SRAL | SAR | ALES + SAR | 814.5 | 98.65 | 27 | ∼300 | 1.64 |
| Sentinel6A | Poseidon-4 | SAR | HR Star tracker | 1,336 | 66 | 9.91 | ∼300 | 10 |
| Jason-3 | Poseidon-3B | LRM | Ocean ML4 | 1,336 | 66.64 | 9.91 | ∼300 | 10 |
Sentinel-3A satellite pass cycle is in every 27 days and 10 tracks cover the Gulf. Depending on the date of the first pass over the year, there could be either 13 or 14 passes in 1 year. In this article, passes # 0414, 0511, 0528, 0397, 0739, 0083, 0197, 0311, 0425, and 0625 were used. The passes 0528 and 0414 are descending, and the rest of passes are ascending.
4.2 Sentinel-6
Sentinel-6A is a new satellite developed by a cooperation with ESA, EUMETSAT, NASA, National Oceanic and Atmospheric Administration (NOAA, 2020), and European Commission along with support from the CNES French space agency. It was launched in November 2020 and equipped with a Poseidon-4 SAR Radar altimeter (that provides high-resolution mode and LRM measurements) and a microwave radiometer. The LRM is matched with Sentinel-6 mission’s predecessor Jason-3, and this is to ensure the continuity of Jason satellite missions. The altimeter was also designed to bring the new high-resolution Ku-band synthetic aperture radar measurements into the altimetry reference time series, so that the enhanced high-resolution data can be provided with absolute confidence (ESA, 2021).
Similar to Sentinel 3A, the Sentinel-6A satellite altimeter is equipped with SAR capabilities; however, the orientation of the passes shall be different, and the repeat time is shorter. The improved re-tracker is expected to derive better results. The low-resolution data were released in July 2021, and the high-resolution data were released in November 2021 (ESA, 2021). In this research, both high-resolution and low-resolution datasets were examined. Sentinel-6 satellite cycles repeat every 10 days, and there exist five tracks that cover the Gulf. Since the high accuracy Sentinel-6 data became available from November 2021, only five or six passes over the Gulf of Finland have been used at the period on November 2021–February 2022. The Sentinel 6 data were downloaded from EUMETSAT Earth Observation Portal https://eoportal.eumetsat.int/.
4.3 Jason-3
Jason-3 is developed in a partnership of EUMETSAT, NASA, and an international cooperative mission in which NOAA is partnering with the Centre National d'Études Spatiales (CNES, French space agency). It was launched in 2016 and equipped with Poseidon-3B altimeter with dual frequency (Ku/C bands 13.575 and 5.3 GHz). It is a pulse limited altimeter that operates in LRM. The along track resolution is ∼300 m (Mostafavi et al., 2021). Reprocessed standard data can be downloaded from EUMETSAT Earth Observation Portal https://eoportal.eumetsat.int/.
Jason-3 satellite pass cycle is the same as for Sentinel 6, also the Jason-3 tracks coincide with Sentinel-6 tracks; therefore, these two satellites and their measurements are comparable (Table 2). In the following research, the passes # 0111, 0168, 0157, 0092, and 0016 are used, whereas the passes 0111 and 0157 are descending. The tracks follow Sentinel-6 Micheal Freilich at the same latitude and inclination. Time difference of track measurement between Jason-3 and Sentinel-6 is about 2 min.
Summary of types of data used for each satellite mission
| Data used for processing/satellite | Sentinel-3 | Sentinel-6/Jason-3 |
|---|---|---|
| Hydrodynamic model | Nemo Nordic | HBM-EST |
| Geoid model | NKG2015 | NKG2015 |
| Land uplift model | NKG2016 (for vertical land motion) | NKG2016 (for vertical land motion) |
| Tide gauges | Estonian and Finnish | Estonian and Finnish |
| Year observed | 01-12/2018 | November 2021 to February 2022 |
| Number of tracks, that pass the Gulf of Finland | 10 | 5 |
| Repeat period | 27 days | 10 days |
4.4 SA corrections
Since different satellite missions are used, it is important to acknowledge the various atmospheric and geophysical corrections implemented to derive SSH. It is also essential that the vertical reference frame for the ellipsoid be common (e.g. Sentinel-3A is in Topex-Poseidon system, and Sentinel-6A and Jason-3 are referred to GRS80 reference ellipsoid), and this correction is implemented in Section 2.1 in equation (2). The tide system used for all sources of data should also be similar, so that all missions are in zero-tide permanent tide system, which means that all used data including the geoid model and TG are corrected to be tidal free (Varbla et al., 2022b).
4.4.1 Sentinel-3A corrections
After obtaining the satellite orbit height (H altitude) and satellite altimeter range (R), there is a need to apply different atmospheric and geophysical corrections to derive the SSH. The following equation displays the algorithm, which is implemented by default to the Sentinel-3A products:
where SSH is obtained by default from the S3A data (Baltic + SEAL project). The wet tropospheric (WT), dry tropospheric (DT), and ionospheric (iono) are atmospheric propagation corrections due to radar pulse passing through Earth’s atmosphere. Sea state bias, DAC, solid Earth tide, and pole tide (PT) are classified in the geophysical corrections, which refer to the systematic geophysical effects that can be modelled and corrected. The radial orbit error (ROC) is a new correction that was derived and is based on multi-mission cross-calibration. This correction was developed to ensure a consistent combination of all different altimetry missions. The default DAC that was included in the SSH was de-corrected from the SA data (by adding it back to SSH) because it is needed to compare the instantaneous data from various sources (Mostafavi et al., 2021).
4.4.2 Sentinel-6 corrections
Similarly, to Sentinel-3A corrections, from knowing the satellite orbit height (H altitude ) and satellite altimeter range (R), there is a need to apply different atmospheric and geophysical corrections to derive the SSH. The following equation displays the algorithm, which is implemented by default to the Sentinel-6A products:
where, in addition to Sentinel-3A corrections, geocentric ocean tide height solution (OT2), non-equilibrium long-period geocentric ocean tide height (OTA), and internal tide (IT) are also included (EUMETSAT, 2021).
The DAC is also decorrected for this satellite mission.
4.4.3 Jason-3 corrections
Similarly, to Sentinel-3A, the SSH is computed by using equation (9). The DAC is also de-corrected for this satellite mission. The DAC also includes inversive barometric height correction, which is computed from interpolation of two meteorological fields at the altimeter time-tag.
5 Used terrestrial data and models
5.1 Hydrodynamic models
5.1.1 Nemo Nordic HDM
Nemo-Nordic is a three-dimensional coupled ocean–sea ice model. It is especially accustomed for the Baltic Sea and North Sea areas (Hordoir et al., 2019). This HDM was developed by the Swedish Meteorological and Hydrological Institute (SMHI), and it is originally based on the NEMO-3.6 ocean engine (Nucleus for the European Modelling of the Ocean). In this study, the data utilized are an assimilated version of the Nemo-Nordic model, which has an hourly temporal resolution and a horizontal resolution of 1 nautical mile. The time period for this model is 3 December 2016 until 15 April 2020. The data are obtained from SMHI (SMHI, 2021), and it is expected to perform better in regard of sea level predictions considering previous studies due to the higher quality of model set up settings and data assimilation techniques employed (Hordoir et al., 2019; Kärnä et al., 2021).
5.1.2 HIROMB-EST
HIROMB-Boost HDM (HBM-EST) was developed in the Marine System Institute in Tallinn University of Technology. It is a three-dimensional baroclinic eddy-resolving circulation model, and it is specially tuned to the Estonian waters. The horizontal resolution of the model is of 0.5 nautical miles. HBM-EST models’ open boundary is located at the Danish Straits. There are two auxiliary models used to accurately correct the HBM-EST HDM model – a high-resolution limited area model to examine atmospheric forcings (HIRLAM) and for freshwater inflow the daily data from the river runoff model HBV. Sea ice data were obtained from the Louvain-la-Neuve sea ice model (LIM3) (Vancoppenolle et al., 2012). The HBM-EST data were retrieved from http://emis.msi.ttu.ee.
5.2 Geoid model NKG2015
The NKG2015 gravimetric quasi-geoid model for the Nordic-Baltic countries has been developed by the Nordic Geodetic Commission (NKG). It is utilizing zero permanent tide system, and epoch 2000.0, referred to the Geodetic Reference System GRS80 ellipsoid, extends from 53° to 73°N and from 0° to 34°E with a grid spacing 0.01° × 0.02°. The NKG2015 geoid model is corrected with a one-parameter fit to the national realizations of the EVRS and has a good agreement with GNSS/levelling control points with a STD of 3.0 cm (Ågren et al., 2016). The NKG2015 model is used to retrieve DTSA from SSH data (i.e. DT = SSH-geoid). The availability of such a high-resolution regional geoid model is clearly advantageous for the SA-based DT determination in the present study.
5.3 Land uplift model NKG2016LU
In the Baltic Sea, the official land uplift model NKG2016LU is used to describe land uplift. The model is also compiled by the Nordic Commission of Geodesy (NKG). The model was released in 2016 and covers an area from 49° to 75° latitude and 0° to 50° longitude. The NKG2016LU model is an empirical model, which is computed from observations using the least squares collocation. Model consists of geodetic observations, NKG levelling, and also GNSS observations although no TG are used to deliver the model. The NKG2016LU final levelled model is independent from any TG or other sea level-related sources. Model can adapt different time periods depending on the year observed (Vestøl et al., 2019).
5.4 Tide gauges
In this study, the TG data are referred to theoretical mean sea level (Finnish TGs) and EH2000 (Estonian TGs). Since the theoretical mean sea level is an arbitrary value, a conversion is needed to add to convert the values to N2000 (Finnish height system). N2000 and EH2000 correspond to Baltic Sea Chart Datum 2000 (BSCD2000) and therefore to the geoid. The Baltic Sea Chart Datum 2000 (BSCD2000) is a specially developed geodetic reference system to be used for hydrographic surveying and engineering. BSCD2000 is based on the EVRS, and the zero level of which is in accordance to NAP and height reference system is Earth’s gravity field’s equipotential surface (Schwabe et al., 2020). According to Varbla et al. (2022a), the BSCD2000 will be compatible with the national height system realizations of the Baltic Sea countries (e.g. EH2000, N2000, and RH 2000) and will coincide with national geoid models to allow height transitions.
6 Results and discussion
This section presents the DT results obtained from TG, HDM, and SA from three missions (S3A, S6, and JA3). Results are presented as follows: (i) an examination of DT at specific TG stations for both the Estonian and Finnish side of the gulf; (ii) a comparison of DT from HDM and SA; and (iii) RMSE values obtained from the three SA missions.
6.1 DT at TG stations
The TG from both Estonia and Finland served as a ground truth for the methodology applied; thus, it was necessary to have an impression of the DT variation across and along the gulf. The method utilized required that a TG be located on either side of the gulf with the distance (varies from 69.9 to 156.5 km) between the utilized TG from Estonia to Finland. Also, as expected, the DT from both shores were not exactly the same. To demonstrate this variation in DT (taken at a hourly time instant to represent different seasons/months), an example is shown in Figure 6a at four TG stations (Kunda, Heltermaa, Helsinki, and Hamina). The year 2018 was chosen to represent the S3A data set and 2021‒2022 for the S6/J3 to show this variation.
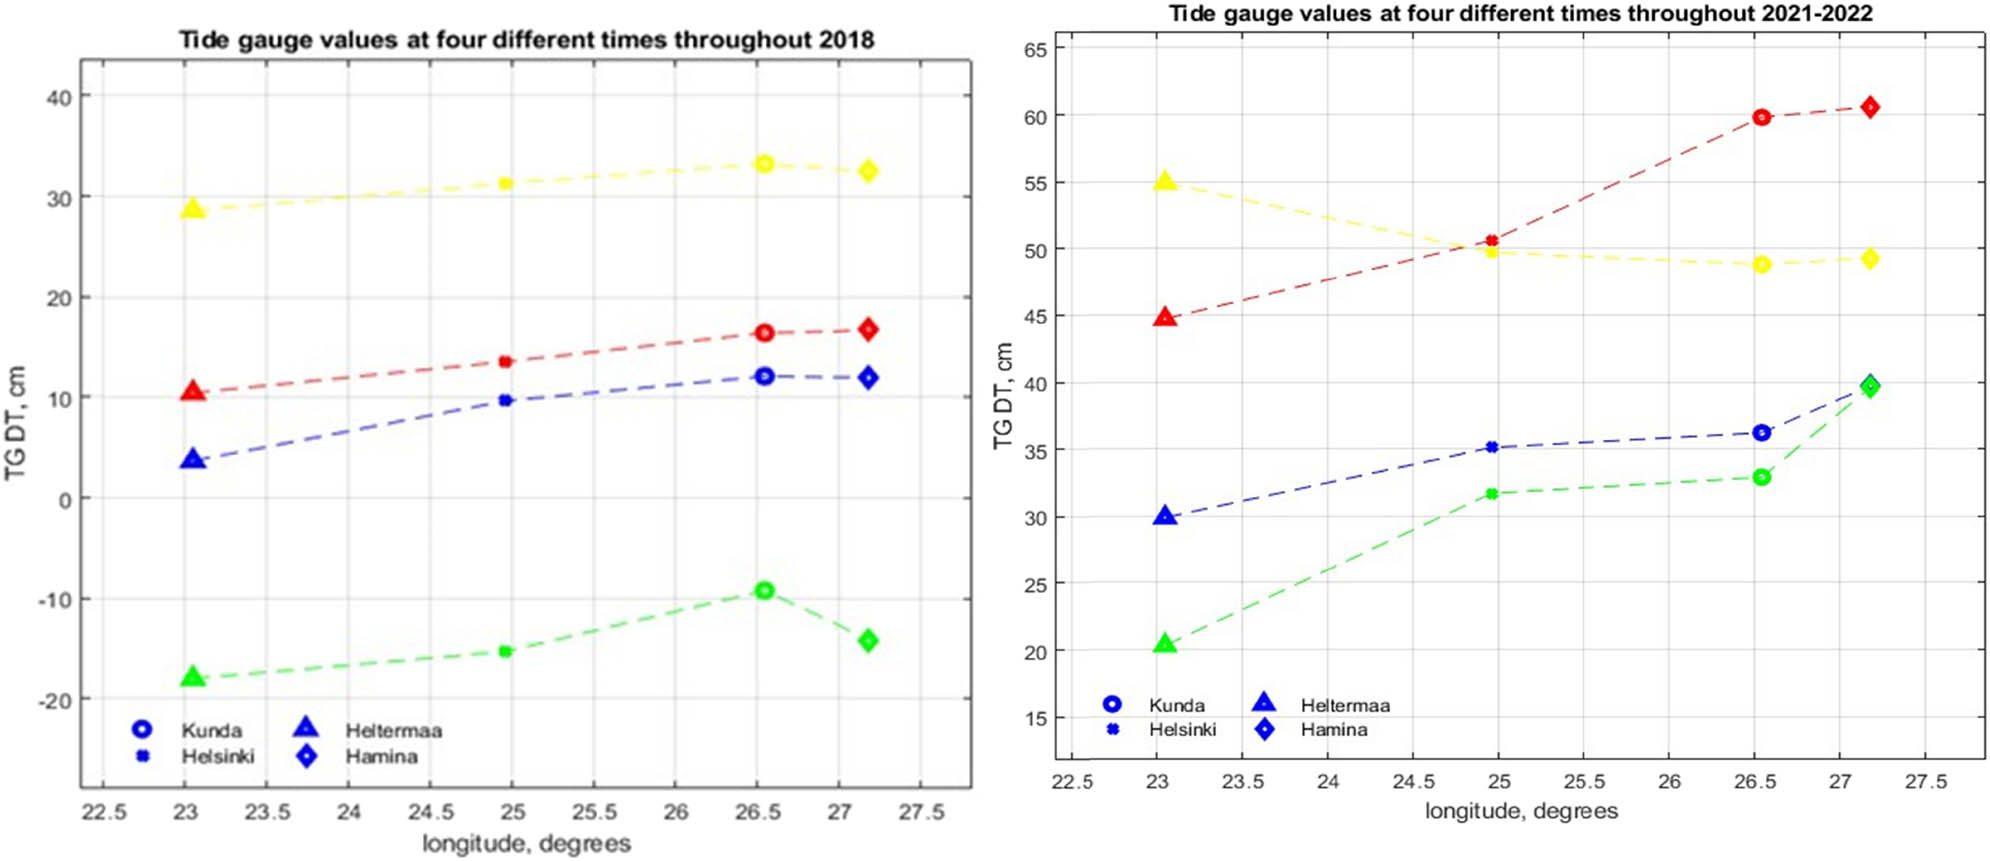
DT TG variation throughout the time periods. (left) Dynamic topography for tide gauge stations of Heltermaa, Helsinki, Kunda, and Hamina for the year of 2018 to represent S3A data (left) and 2021–2011 to represent the S6/J3 data (right). The yellow line represents 15 October 2018 12:00, the red line represents 15 July 2018 12:00, the green line represents 15 April 2018 12:00, and blue line represents 15 January 2018 12:00. (right) For 2021/2022, the yellow line represents 15 February 2022 12:00, the red line represents 15 January 2022 12:00, the green represents 15 December 2022 12:00, and blue line represents 15 November 2022 12:00.
For the whole year of 2018 (S3A), the DT TG values on the Estonian side appeared within the range (−60.4 to +151.2) cm, whilst on the Finnish side, it varied from −66.6 to +149.6 cm. However, the difference between both sides (from Estonia to Finland) varied from 1.0 to 50.0 cm. Also, along the Gulf of Finland, the DT varied from west to east from −40.5 to +108.5 cm and north to south from −64.7 to +151.8 cm. A more or less seasonal variation was also observed, and in the winter months, DT TG values were lower (−10 to −20 cm) than the summer (10–15 cm) and autumn (30–35 cm). In the middle of the spring, the DT was also surprisingly quite low (−10 to +20 cm). This may indicate that most of the ice melting and large quantities of water have already balanced throughout the gulf, and the DT was now most likely affected by other factors (e.g. winds, storms).
The DT TG variation for 2021‒2022 (Figure 6) was different in range compared to 2018. For instance, on the Estonian side, the range of DT varied from −33.6 to +84.7 cm, whilst on the Finnish side, it was from −61.1 to +80.1 cm. Thus, in 2018, the extreme values were somewhat larger than in 2021. The difference between both sides (from Estonia to Finland) was the same as in 2018 which varied from 1.0 to 50.0 cm. Along the Gulf of Finland, DT varied from west to east between −33.6 and +75.5 cm and DT in north to south was 10.7–84.7 cm. These larger values towards the east (which occurred both in 2018 and 2021/2022) are usually expected due to the Neva River (located in Russia) having one of the largest river discharges that drain into the gulf. Also the southern side, Gulf of Finland may experience mostly higher DT levels due the predominant south-westerly winds that push water towards the south shore. Examination of the seasonal differences throughout the year showed more or less a similar pattern as 2018, with the winter months being the lowest (e.g. December with a DT range of 20–30 cm). However, in January (a winter month), the DT was actually higher (45–60 cm). This variation demonstrates that there may exist some seasonal trend. The pattern and DT value may unexpectedly easily change due to the atmospheric forcing (e.g. winds) that may be present at a particular time.
6.2 Sentinel-3A-derived DT
Ten tracks of Sentinel-3A that crossed over the Gulf of Finland were examined. Tracks 0414 and 0528 are descending, and all other tracks are ascending (Figure 7a). These tracks of Sentinel3A are viewed and analysed for 2018 with respect to the derived DT for the SA, HDM, and TG data. Since Sentinel-3A passes over the same sites every 27 days, this indicates that for every track, there shall be around 13–14 passes within a calendar year.
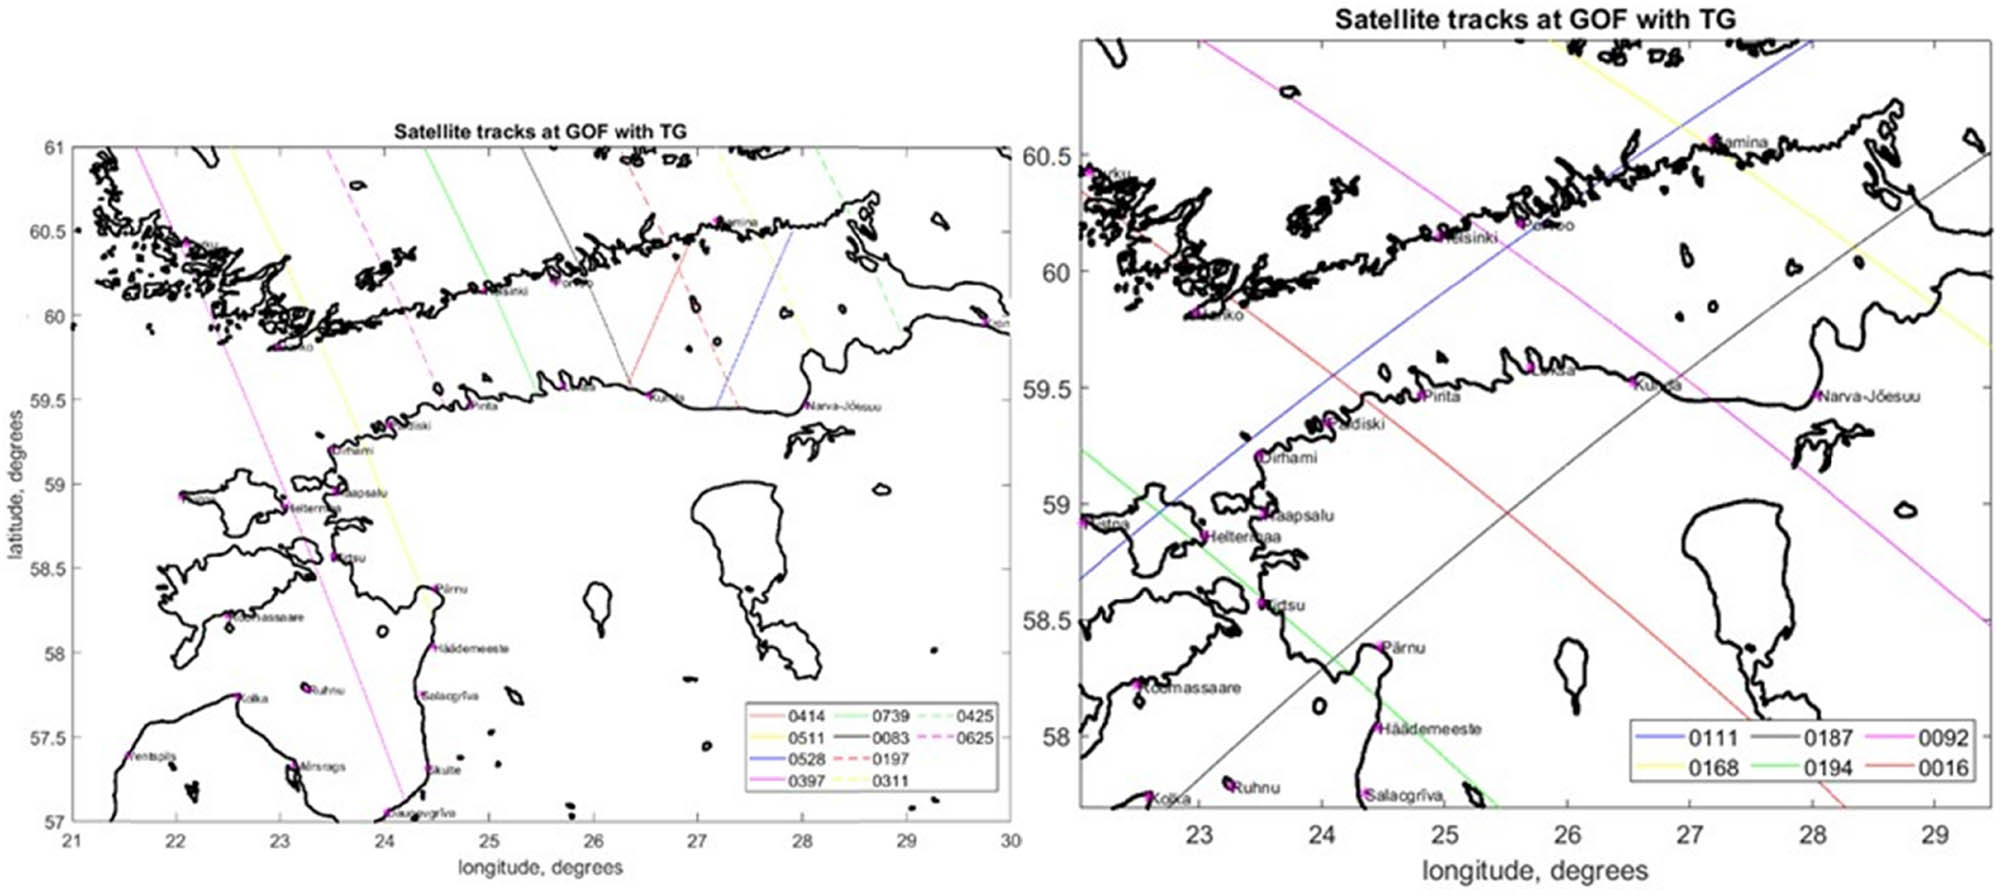
Satellite tracks that cross over the Gulf of Finland: (left) Tracks of Sentinel-3A (left) and (right) Sentinel 6/Jason 3 tracks. The location of used tide gauges is denoted by the pink dots.
Results show that in most cases, DT for the original HDM was overestimated when compared to SA (e.g. tracks 0511, 0397, 0083, 0414, 0739, 0311, 0425) or underestimated (e.g. tracks 0528, 0197, 0625) (Figure 7b). Such discrepancies vary throughout the year (within 55.10 to +90.58 cm). Also, as expected, the HDM DT results displayed a smooth sea surface compared to the rough and varying SA data. This characteristic demonstrates the difference in quality of results due to the various methods used to collect sea level data. With HDM being smoother due to the fact that it is based on mathematical equations that simulate the DT, whilst the SA sensor measures the actual sea surface and its environment.
6.3 RMSE of Sentinel-3A data
A compilation of RMSE results is displayed in Table 3. The general range of RMSE varied from minimum values of 2.8–13.15 cm and maximum values of 14.7–46.2 cm, so the general range was between 2.8 and 46.5 cm. The lowest RMSE values range was for track 0625, which is an ascending track in the middle of the gulf and passes over Naissaar island (Estonia) (Figure 8a). This also happened to be shortest track of 60.6 km. The largest RMSE values are associated with track 0425, which is an ascending track at the end of the gulf (last track to pass over the Gulf of Finland), and it passes over multiple of islands such as Beryozovye (Russia) islands (Figure 8b). Near Archipelago along the Finnish coast, the effects of islands/land contamination became noticeable. Figure 9a and b shows an example of how these tracks were analysed.
Table showing the statistics of Sentinel -3A from 2018 results
| Sentinel3 track | Estonia TG | Finland TG | Distance between Estonian TG and closest SA point to TG (km) | RMSE mini-mum along the track (cm) | Date of the RMSE minimum value (2018) | RMSE maximum along the track (cm) | Date of the RMSE maximum value (2018) | Mean RMSE (cm) |
|---|---|---|---|---|---|---|---|---|
| 0625 | Pirita | Helsinki | 17.41 | 2.83 | 02.04.2018 | 14.78 | 22.06.2018 | 8.8 |
| 0311 | Narva-Jõesuu | Hamina | 39.75 | 13.15 | 11.06.2018 | 36.59 | 22.03.2018 | 24.87 |
| 0197 | Narva-Jõesuu | Hamina | 38.66 | 3.20 | 14.04.2018 | 22.96 | 18.03.2018 | 13.08 |
| 0739 | Loksa | Helsinki | 18.2 | 4.49 | 03.05.2018 | 20.67 | 06.04.2018 | 12.58 |
| 0528 | Kunda | Hamina | 38.4 | 11.13 | 25.12.2018 | 29.19 | 04.02.2018 | 20.16 |
| 0414 | Kunda | Hamina | 13.52 | 6.68 | 21.12.2018 | 30.30 | 26.03.2018 | 18.49 |
| 0397 | Heltermaa | Turku | 85.92 | 4.79 | 26.02.2018 | 20.14 | 27.10.2018 | 12.46 |
| 0511 | Dirhami | Hanko | 14.11 | 5.20 | 15.07.2018 | 19.19 | 02.03.2018 | 12.19 |
| 0083 | Kunda | Porvoo | 8.871 | 5.23 | 19.01.2018 | 22.20 | 16.10.2018 | 13.71 |
| 0425 | Kronstadt (Russia) | Hamina | 46.33 | 9.19 | 21.12.2018 | 46.27 | 31.01.2018 | 27.73 |
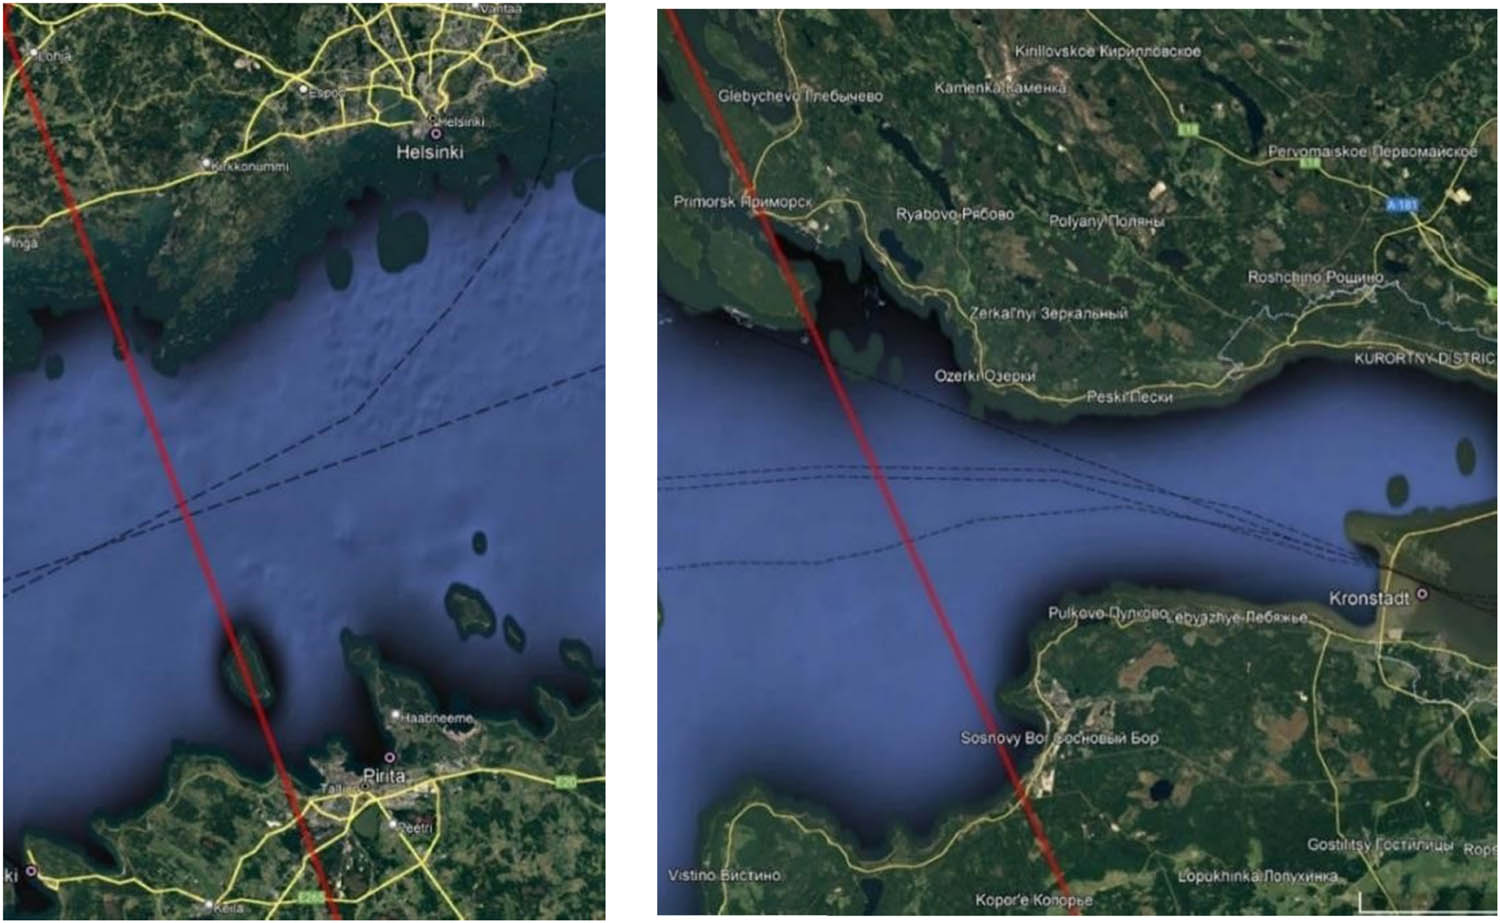
Examples of Sentinel-3A satellite track locations: (left) track 0625 and used stations of Pirita and Helsinki, which had the lowest RMSE and (right) Track 0425 and station Kronstadt, which had the largest RMSE.
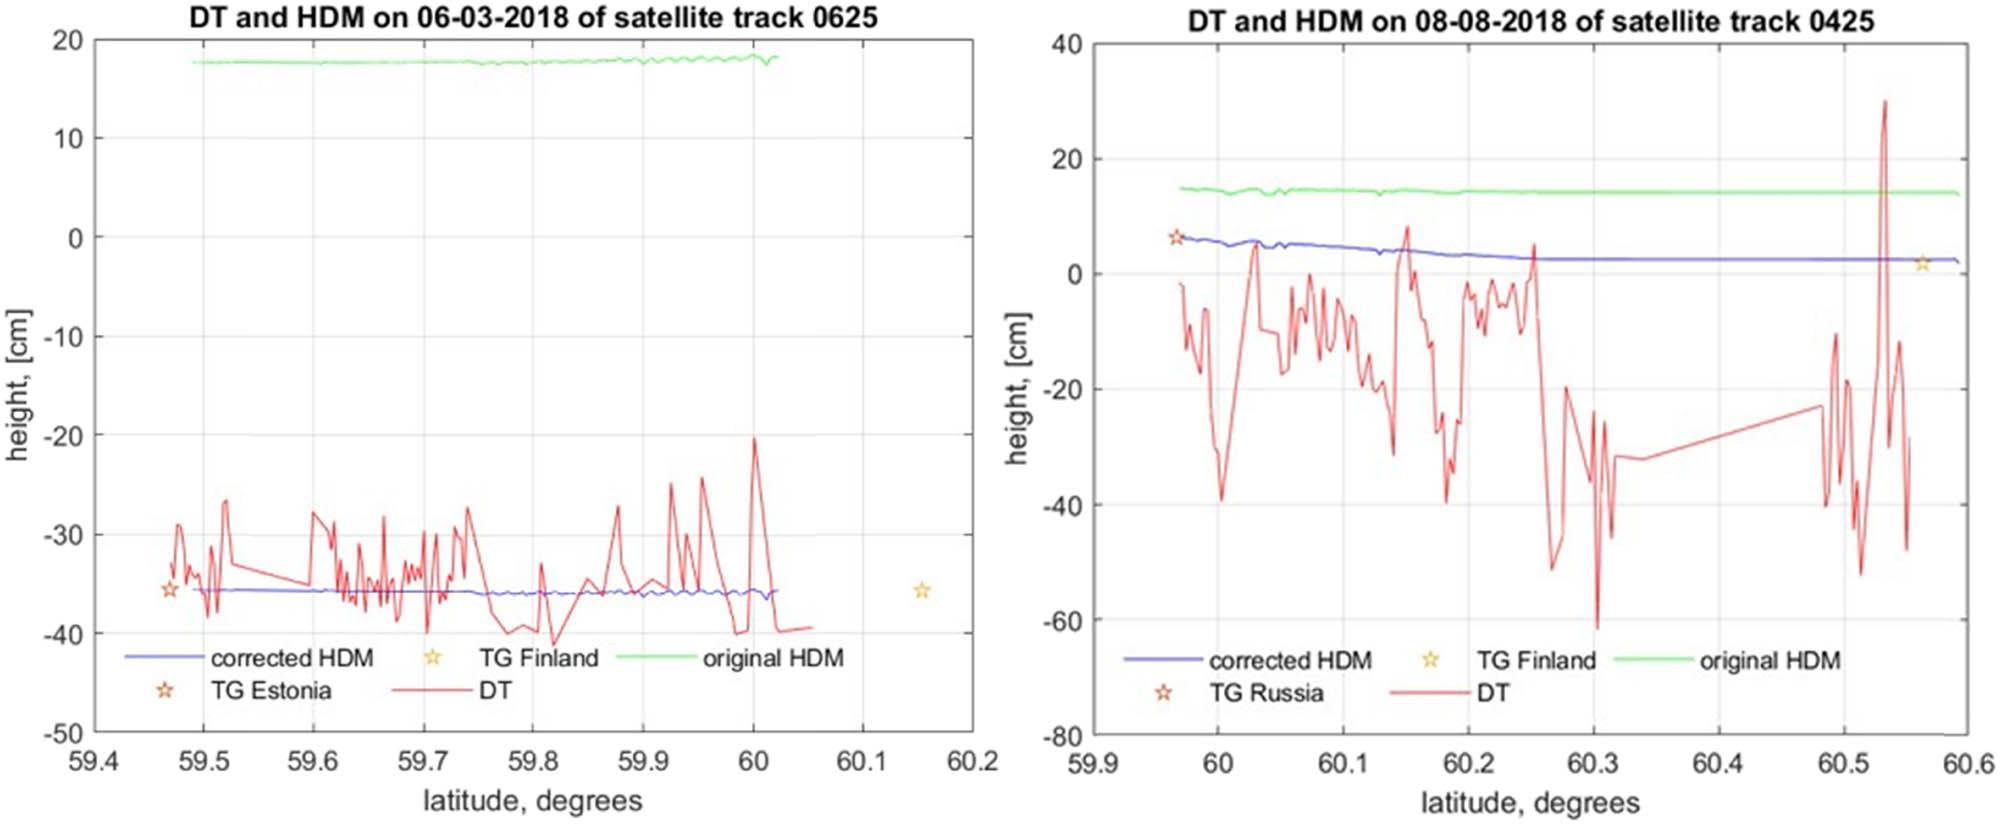
Example of Sentinel-3A-derived DT results: (left) track 0625 for 6 March 2018 and (right) track 0425 at 8 August 2018.
Examination of the results presented in Table 3 shows that there seems to be no correlation between minimum RMSE (2.8–13.15 cm) and date/season of the minimum value, and the minimum value varied for each month. This at first hints that the performance may not be influenced by environmental conditions of the study area (e.g., seasons with ice, river discharge). On the contrary, however, there seems to be a correlation between maximum RMSE of 14.7–46.2 cm and date of the maximum value occurring – the maximum RMSE values were calculated for March 2018. March happened to be the coldest month in 2018 with the coldest day occurring in the first week of March (Siegel and Gerth, 2018). Satellite imagery from EUMETSAT confirms the sea ice with a maximum thickness of 50 cm in the Gulf of Finland near the Hamina (Finland) station (Nietosvaara and Prieto, 2018). The sea ice reports and ice charts (Figure 10) show the extent of ice (BSH, 2018). This suggests that the satellite performance may not be performing at its best when sea ice is present.
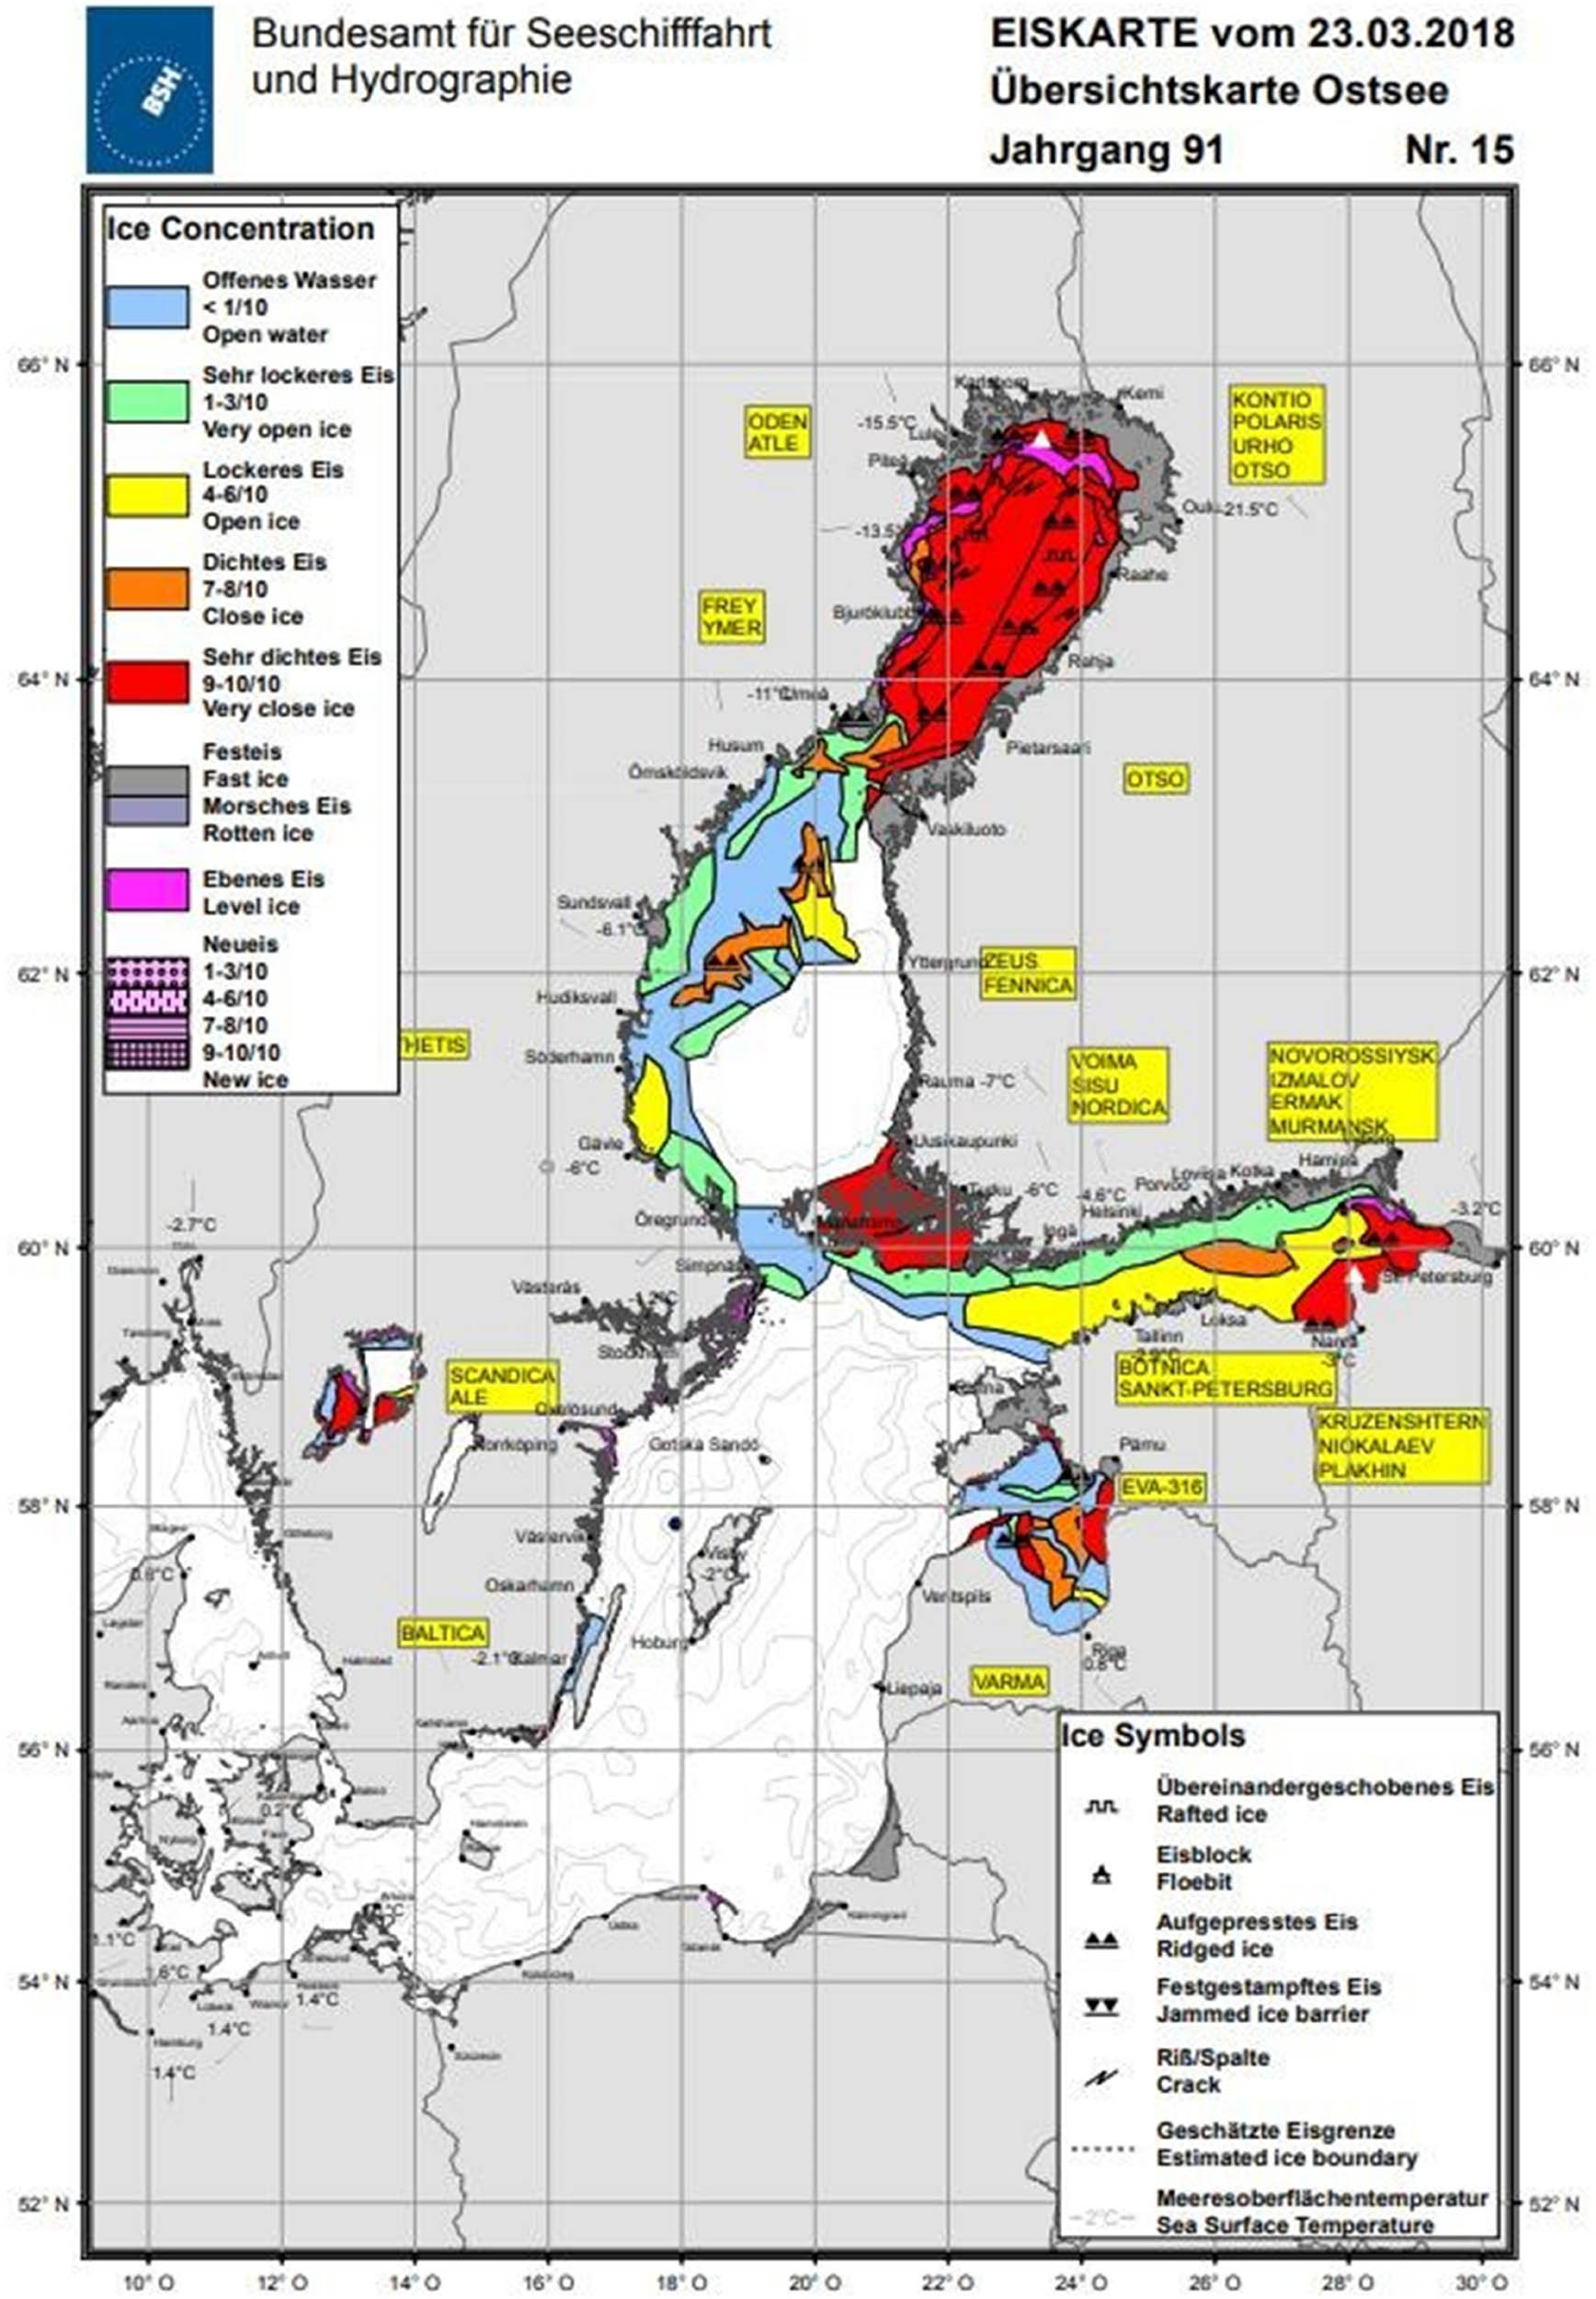
Ice chart from 23 March 2018 which possibly explains the poor accuracy DT during March 2018 (BSH, 2018).
It was also discovered that most of the largest RMSE values appear at the end of the Gulf of Finland using the Narva-Jõesuu, Kronstadt, and Hamina stations. In this part of the Gulf, there exists several islands (Figure 11) such as Vaindloo (Estonia), Gogland (Russia), and Malõi Tjuters (Russia). Tracks 0197 and 0311 also pass over some of the mentioned islands (Figure 11). This could also explain the difference between tracks 0528 and 0414 (descending tracks), which had the minimum RMSE values. Track 0528 crosses over Kilpisaari (Finland) and track 0414 do not cross any islands in the middle of the Gulf of Finland (Figure 12a and b). These four tracks are also located near some of the largest rivers that run off to Gulf of Finland – Narva, Kemi, Luga, and Neva.
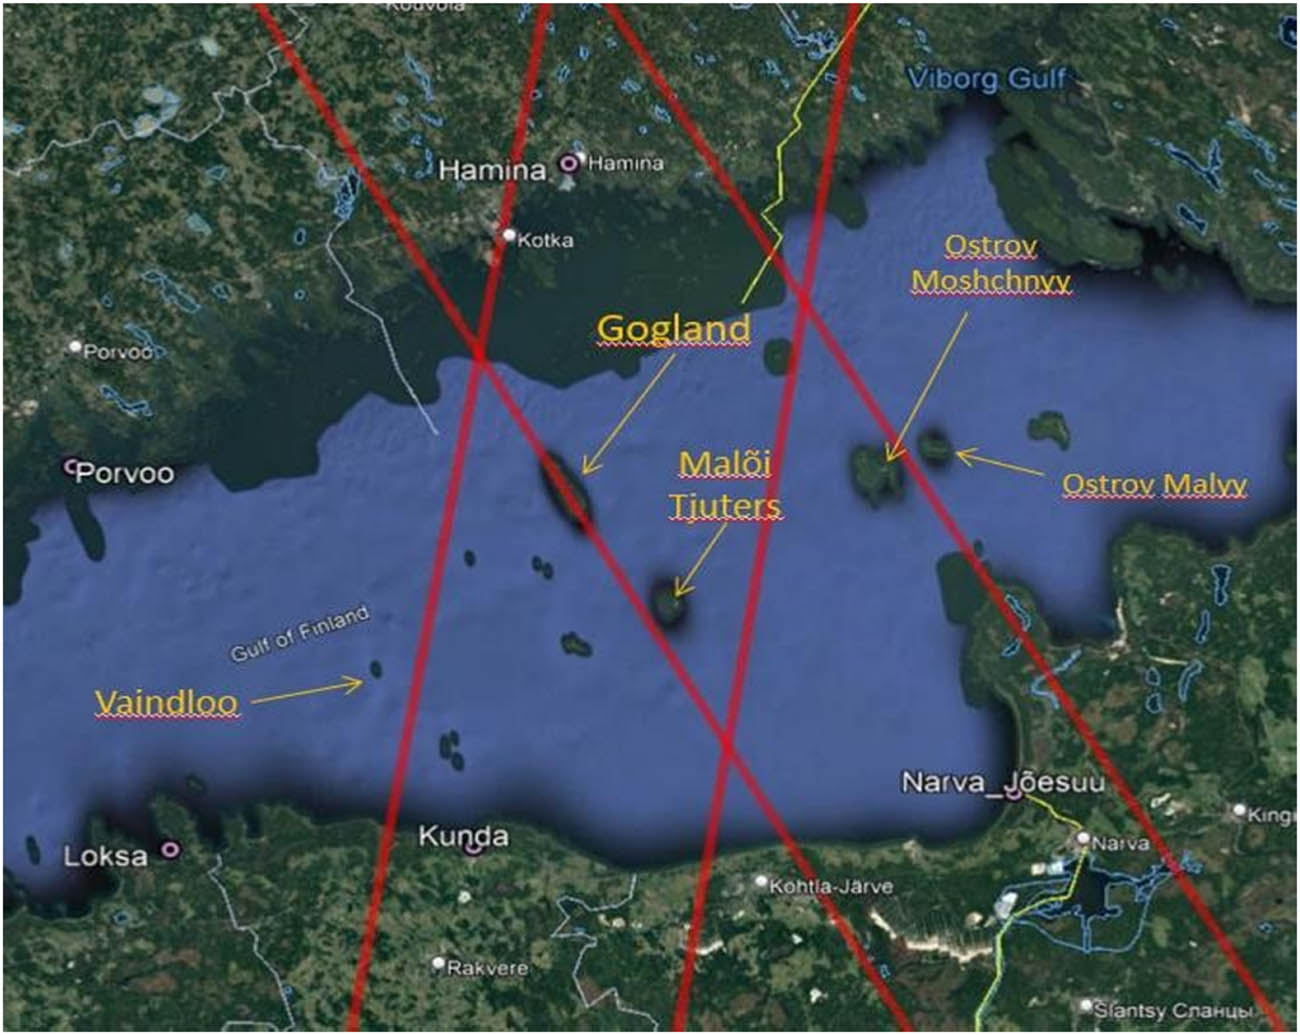
Location of tracks (from west to east) 0414, 0197, 0528, and 0311 and the stations of Kunda, Narva-Jõesuu, Kronstadt, and Hamina.
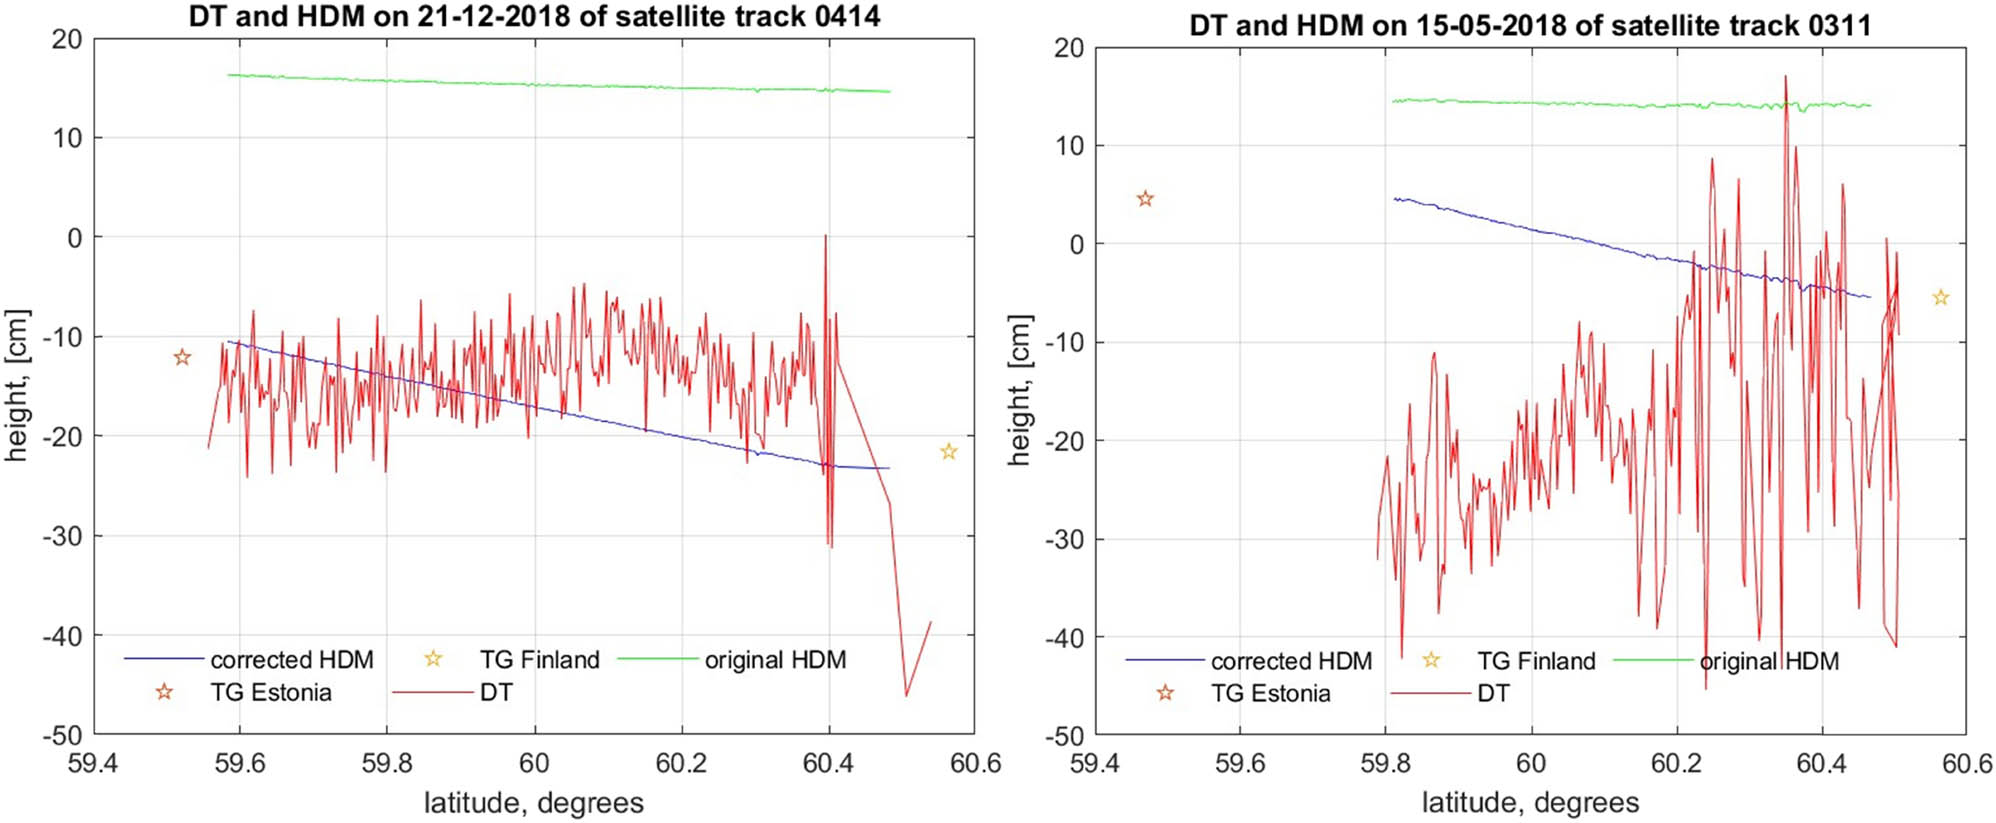
Example of Sentinel-3A-derived DT results: (left) descending track 0528 on 25 December 2018 and track 0414 on 21 December 2018, when the minimum RMSE occurred (top), and (right) ascending track 0197 on 11 May 2018 and track 0311 on 15 May 2018, when the high RMSE occurred (bottom). The height represents DT in the vertical axis.
It should be noted that the methodology employed depended partly on how close to the TG the SA data points are located. Table 3 shows that the closest SA data point was within 8.87–85.97 km from the TG stations. The closest TG station is at Kunda (ascending track) with a distance of 8.87 km and the furthest is at Kronstadt with a distance of 46.33 km and also at Turku a distance of 85.92 km. This difference in the distance between the TG and SA data point did not appear to affect the RMSE.
All of the values for all the satellite missions between TG and averaged 10 closest satellite DT points are negative – which means that SA DT greatly underestimates the DT compared to TG. The limitation of the data quantity and quality was also noted through examination – there was around 90.5% more data points for Sentinel-3 than for Sentinel-6/Jason-3, and this characteristic is common when comparing multi-mission SA data sets. It shows that the Sentinel-3 data set may be statistically more reliable.
6.4 Sentinel-6A-derived DT
Five tracks of Sentinel-6 that crossed over Gulf of Finland were examined. Track 0111 and 0187 are descending and track 0168, 0092, and 0016 are ascending.
Since Sentinel-6 high-resolution data were available only from November 2021, for the year 2021, the months of November and December are used and for the year 2022, the months January and February were processed and compared to the same time instance of Jason-3 passes. The time difference between two satellite mission passings at the same track is about 2 min. Therefore, both satellite mission tracks and results are highly comparable. For the years 2021 and 2022, the HBM-EST HDM was used. An examination of HBM-EST-derived DT show that in most of the cases, the DT for the original HDM was overestimated (e.g. track 0016 (−40.88 to +1.93 cm)), underestimated (e.g. most of the cases for the track 0187 (−40.65 to +1.93 cm) and 0092 (−31.4 to +13.30 cm)), and/or quite even compared (e.g., most of the cases for tracks 0111 and 0168) to the TG values throughout the months (minimum −33.64 to +84.78 cm in range).
6.5 RMSE of Sentinel-6A-derived DT data
Examination of Table 4 shows that there seems to be no correlation between minimum RMSE and date/season of the minimum value. Similar observation was also made with S3 results. The minimum RMSE varied from 3.5 to 7.0 cm and maximum RMSE varied from 32.6 to 43.9 cm. Minimum as well as a maximum RMSE occurred for track 0111, which is a descending track that begins at the opening of the Gulf of Finland and crosses over the Gulf of Finland almost all the way from west to east. Track 0111 is the longest track of Sentinel 6A which crosses over the gulf. This track also crosses over island of Osmussaar (Estonia) (Figure 13).
Table showing the statistics of Sentinel-6A from November 2021 to February 2022
| Sentinel-6 track | Estonia TG | Finland TG | Distance between Estonian TG and closest SA point to TG (km) | RMSE minimum along the track (cm) | Date of the RMSE minimum value | RMSE maximum along the track (cm) | Date of the RMSE maximum value | Mean RMSE (cm) |
|---|---|---|---|---|---|---|---|---|
| 0111 | Heltermaa | Porvoo | 92.95 | 3.50 | 02.01.2022 | 43.90 | 11.02.2022 | 23.7 |
| 0016 | Paldiski | Hanko | 18.99 | 4.29 | 29.12.2021 | 39.39 | 07.02.2022 | 21.84 |
| 0092 | Kunda | Helsinki | 23.62 | 5.28 | 01.01.2022 | 37.08 | 13.11.2021 | 21.18 |
| 0187 | Kunda | Hamina | 19.61 | 7.04 | 06.12.2021 | 37.60 | 16.11.2021 | 22.32 |
| 0168 | Narva-Jõesuu | Hamina | 67.49 | 5.39 | 15.12.2021 | 32.64 | 13.02.2022 | 19.01 |
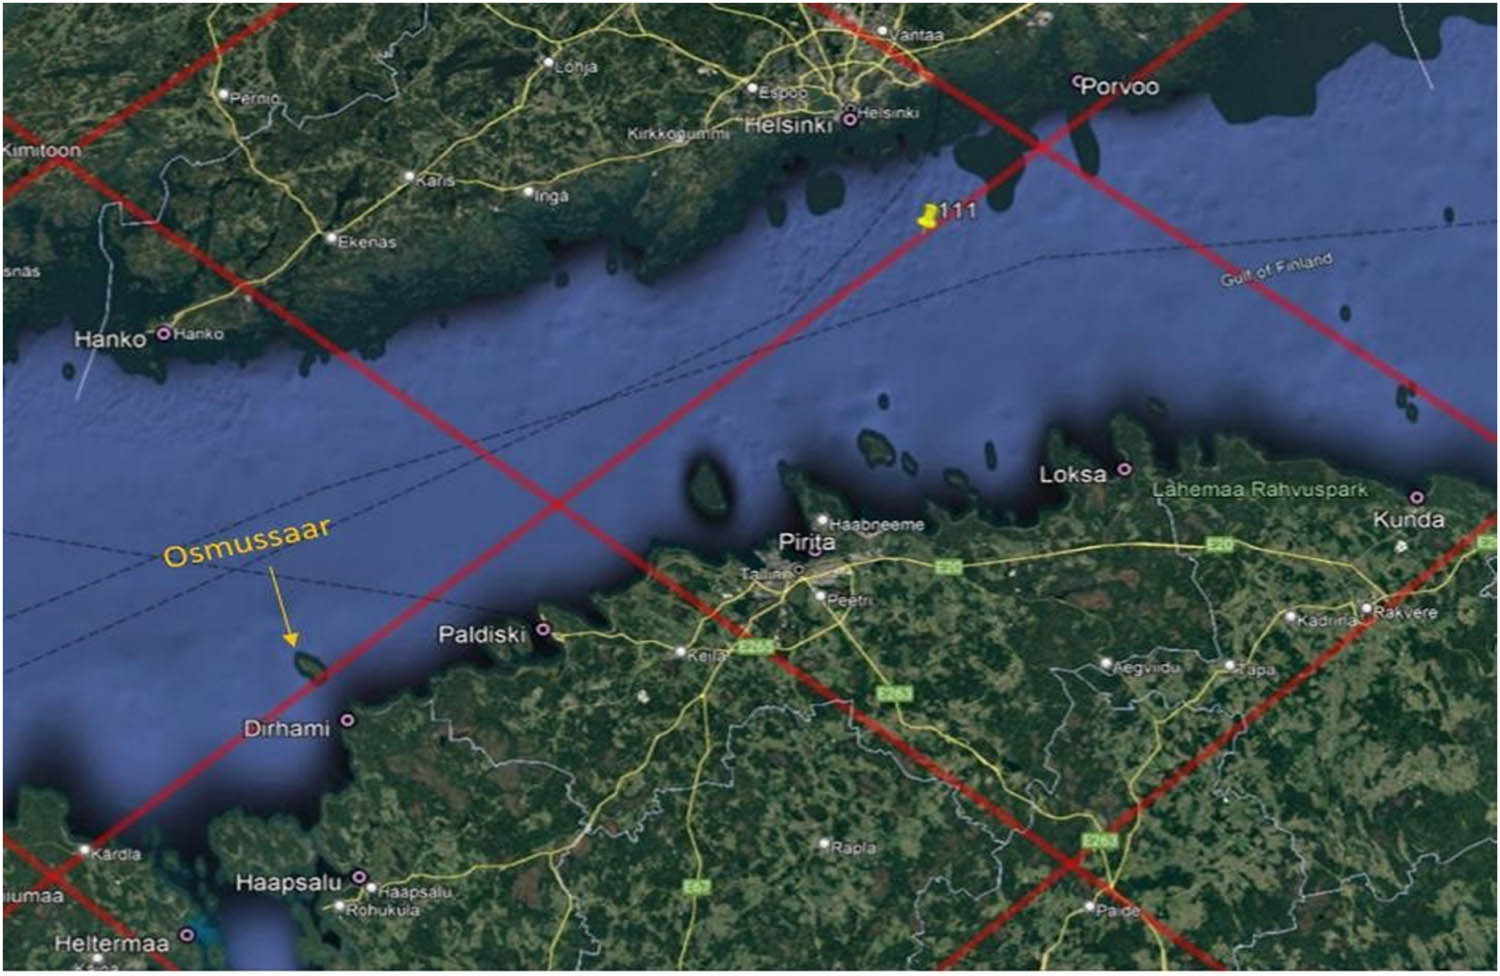
Tracks of Sentinel-6A and Jason-3, which pass over the Gulf of Finland. The track 0111 is marked by a yellow marker.
From Table 4, there seems to be a correlation between maximum RMSE and date of the maximum value – for the tracks of 0111, 0016, and 0168, maximum RMSE was recorded at the same week of 7–13 February, and for tracks 0092 and 0187, maximum RMSE was recorded at the same week of 13–16 November. The maximum RMSE varied from 32.6 to 43.9 cm. Note, as mentioned earlier, there are around 90.5% less data points for Sentinel-6A than Sentinel-3A, which was expected.
Results show that difference between HDM and TGs vary greatly. Most of the largest range differences occur for tracks of 0111 and 0016 (Figure 14a and b). Both of these tracks are located at each side of the Gulf of Finland, so there seems to be no correlation due to usage of different TG. Although there seems to be a correlation between the values and the dates they occurred – the minimum RMSE occurred on the same week (27 December 2021 to 2 January 2022) (Figure 14a and b). The same is valid also for the maximum RMSE values.
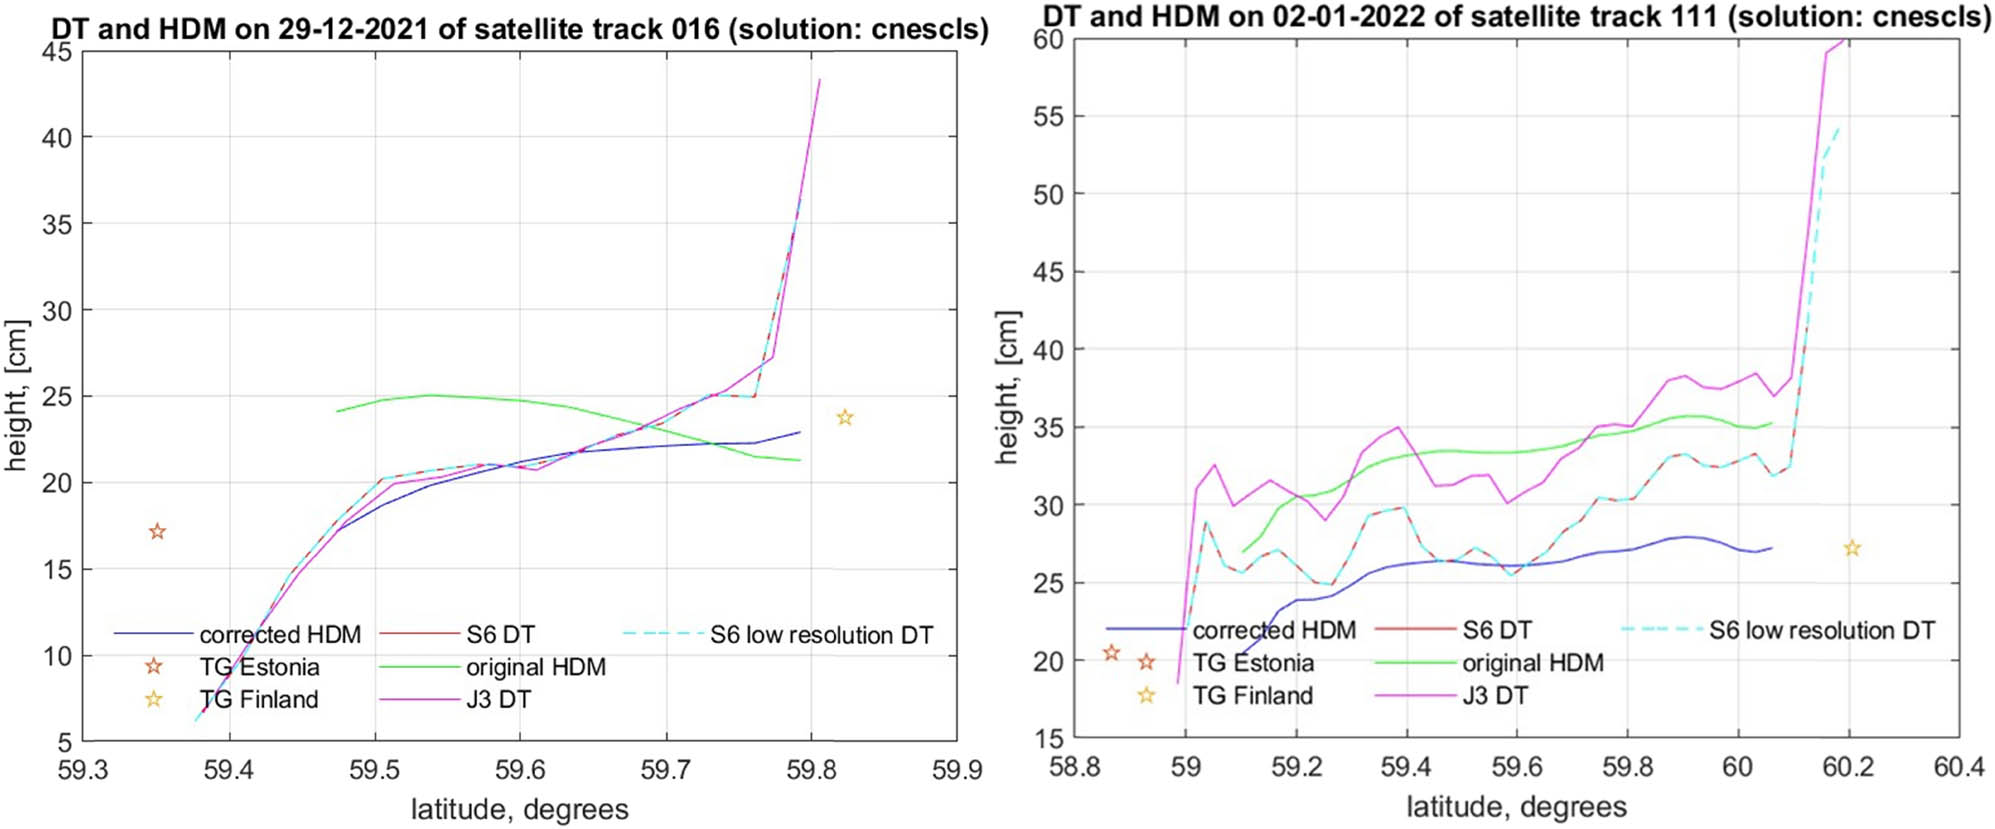
Example of Sentinel-6A-derived DT results: (left) Example of a track 0016 on 29 December 2021 and (right) example of track 0111 on 2 January 2022.
Figure 14a and b demonstrates the correlation between low- and high-resolution Sentinel 6 A data. As mentioned in Section 4.2, the difference between two resolutions lies in the waveform bands used. For almost all the tracks, which were examined, the SA DT is always lower than the TG recorded data. This could indicate that SA data underestimates the results, which could be due to the presence of sea ice and/or some other SA corrections that have either not been considered or not accurately represented. Sea ice in the year 2022 was present until early March; therefore, sea ice could be one of the aspects which hinder the RMSE values as well as the DT of SA in Sentinel 6. This most likely was not a technical problem regarding the satellite because both Sentinel-6A- and Jason-3-derived DT showed comparable results.
6.6 Jason-3-derived DT
Similar to Sentinel 6, the same five tracks of Jason-3 that crossed over Gulf of Finland were examined. Tracks 0111 and 0187 are descending, and tracks 0168, 0092, and 0016 are ascending for this satellite mission (Figure 7b).
In general, the results of HBM-EST-derived DT show that in most of the cases, the DT for the original HDM were overestimated and/or quite even compared to the TG values throughout the months (range: −33.64 to +84.78 cm). Similar results were also made for S6. Most of the largest range differences occur for the tracks of 0092 and 0187. Both of these tracks have been examined in Kunda station. Both of mentioned tracks also have a large average difference between corrected and uncorrected HDM. This means, that uncorrected HDM was mostly greatly underestimating the DT. Comparing Sentinel-6A and Jason-3, the largest range of differences between corrected HDM and SA DT for Sentinel 6A is for tracks 0016, 0187, and 0168 and that for Jason-3 is for tracks 0111 and 0092 (−50.14 to +20.2 cm).
6.7 RMSE of Jason-3 data
Examination of Table 5 shows that there seems to be no visual correlation between minimum RMSE and date of the minimum value. The minimum RMSE is between 1.6 and 11.1 cm and maximum RMSE is between 28.8 and 50.1 cm. Minimum as well as a maximum RMSE occurs for track 0111, which is the descending track that begins in the opening of the Gulf of Finland and crosses over the Gulf of Finland almost all the way from west to east. Track 0111 is the longest track of Sentinel-6A and Jason-3, which crosses over the gulf. This track also crosses over island of Osmussaar (Estonia) (Figure 13).
Table showing the statistics of Jason-3 from November 2021 to February 2022
| Jason-3 track | Estonia TG | Finland TG | Distance between Estonian TG and closest SA point to TG (km) | RMSE minimum along the track (cm) | Date of the RMSE minimum value | RMSE maximum along the track (cm) | Date of the RMSE maximum value | Mean RMSE (cm) |
|---|---|---|---|---|---|---|---|---|
| 0111 | Heltermaa | Porvoo | 92.95 | 1.68 | 11.02.2022 | 50.14 | 22.01.2022 | 25.91 |
| 0016 | Paldiski | Hanko | 18.99 | 11.13 | 17.02.2022 | 41.01 | 07.02.2022 | 26.07 |
| 0092 | Kunda | Helsinki | 23.62 | 6.59 | 12.12.2021 | 29.85 | 10.02.2022 | 18.22 |
| 0187 | Kunda | Hamina | 19.61 | 4.62 | 26.12.2021 | 38.81 | 25.01.2022 | 21.71 |
| 0168 | Narva-Jõesuu | Hamina | 67.49 | 8.81 | 25.12.2021 | 29.86 | 03.02.2022 | 19.33 |
There seems to be visual correlation between maximum RMSE and date of the maximum value – for all of the tracks, the maximum RMSE was recorded at the period of 2 weeks at the end of January and in the beginning of February 2022. The maximum RMSE was between 29.8 and 50.1 cm. Note that there are around 90.5% less data points for Jason-3 than Sentinel-3A, which means that the RMSE calculation is affected by the quality and quantity of the data points.
Comparing Sentinel-6A and Jason-3 results, most of the minimum RMSE occurred in December 2021 (in range of 4.29–8.81 cm). The range of minimum RMSE values is smaller for Sentinel-6A than Jason-3. For both satellite missions, the maximum RMSE mostly occurred in the month of February 2022 (in range of 29.86–43.9 cm). The range of the maximum RMSE values is smaller for Sentinel-6A than Jason-3. From this comparison, we can deduce that Sentinel-6A results are more stable than the Jason-3.
Tables 3–5 examine the results of Sentinel-3A, Sentinel-6A, and Jason-3 in terms of RMSE and the date of its maximum and minimum occurrence. As mentioned earlier, most of the maximum RMSE values occurred in March 2018 for Sentinel-3A, in November 2021 and in February 2022 for Sentinel-6A, and at the end of January and beginning in February for Jason-3.
6.8 Discussion of the results
The results reveal that in most cases, the HDM model tended to overestimate the DT results (this range of variation was as follows: S3: 2.83–46.27, S6: 3.5–43.9, J3: 1.68–50.14 cm). Also as expected, the HDM along track DT results was rather smooth compared to the SA, which showed more variation along the track. This observation hints that SA data due to actual measurements may be capturing more realistic sea level estimates. Difference between uncorrected and corrected HDMs was between −5.51 and +49.74 cm.
Concerning the along-track perspective, the RMSE results for all the satellite missions was between 1.68 and 50.14 cm (Table 6). With the largest RMSE difference occurring in values for the Jason-3 mission (difference of 48.46 cm) and smallest difference in values being for the Sentinel-6A mission (difference of 40.4 cm). This difference could be due to the new and improved altimeter (Poseidon-4 SAR) or improved corrections that were applied (see Section 6.2). Large RMSE values were present near the eastern end of the Gulf of Finland, and this could be due to the location of the satellite passing near the large Neva, Narva, and Luga rivers (Figure 4) where the river discharge may possibly affect the results. Thus, the influence of river discharge on SA data capture should be examined for future studies.
Summary of the values gathered during data processing
| Satellite mission | Most minimum RMSE (cm) | Most minimum RMSE (track #) | Most maximum RMSE (cm) | Most maximum RMSE (track #) | Nearest good point distance to TG (km) |
|---|---|---|---|---|---|
| Sentinel-3A | 2.83 | 0625 | 46.27 | 0425 | 8.87 |
| Sentinel-6A | 3.50 | 0111 | 43.90 | 0111 | 18.9 |
| Jason-3 | 1.68 | 0111 | 50.14 | 0111 | 18.9 |
On the basis of results of this study, our assessment shows (in terms of RMSE values) that the most accurate and reliable satellite mission appears to be Sentinel-6A. Also, although there were some large distances between closest coast point and TG (maximum value of 18.9 km), the overall RMSE values seems to be unaffected (Table 6). The smallest RMSE values occurred where the distance between TG and SA DT was the largest (e.g. tracks of 0397 and 0197 of Sentinel-3A).
The RMSE results appear to be season and weather dependent (Tables 3–5), for larger discrepancies occurred in the winter months when sea ice was present (especially with Sentinel-6A). Thus, future studies could enhance methods for determining the sea level when sea ice may also be present. Large RMSE values also occurred in summer or autumn, which could be the result of storms or other unpredictable coastal processes. Such observations were also presented in the study by Birgiel et al. (2019).
It was also observed that when some of the tracks crossed islands, higher RMSE values occur. This indicates that the presence of islands still influences the performance of SA derived data, even though the outliers caused by islands were automatically and manually removed. This could be an issue with the method used in the retracker to estimate sea level or the outlier removal method used in this study.
Compared to previous studies (Mostafavi et al., 2021; Birgiel et al., 2018), the time periods used is different, and the actual derivation of the DT was not performed. When comparing the results between Jason-3 and Sentinel-3A for all the studies, the results show that performance for Sentinel-3 is more reliable and can be considered more accurate for both SSH and DT. Mostafavi et al. (2021) and Birgiel et al. (2018) also examined closeness to coast and data quality near numerous islands that exist in the Gulf of Finland. It was noted, that the islands and closeness to coast affected the results in terms of data quality, number of data points, and distance to coast. Both the aforementioned previous studies discovered outliers near islands and coast. This shows that the SA post-processing stage can still be improved in this study area.
It should be noted that the SA data sources consisted of different time periods (Sentinel-3A was every 27 days and for Sentinel-6A/Jason-3 every 10 days) and different locations of tracks (Figure 5), and thus, one limitation of this study is with the quantity and quality of data. Sentinel3A consisted of 181–487 data points, Jason-3 consisted of 49–67 data points, and Sentinel-6A consisted of 50–69 data points. This influences the results for due to the large difference of available data points, and the RMSE of all the satellite missions may be affected.
Future studies should focus on the outliers near coast and islands as well as examining how to remove outliers to show more accurate and comparable results. Outliers also were noted on examining the data throughout the seasons, and so the outlier removal should also focus in terms of the winter season, where there is sea ice present.
7 Conclusions
An examination of the accuracy of DT of three SA missions (Sentinel 3A, Jason 3, and Sentinel 6A) was performed by using TG, SA, and HDMs. Results showed that the RMSE values ranged from 1.68 to 50.14 cm. The Jason-3 mission has a largest RMSE of 50.14 cm, the largest RMSE for Sentinel 3A was 46.27 cm, and that of Sentinel 6A was 43.90 cm. Considering these RMSE values, Sentinel-6A appears to be performing the best. Examination of the along track results also revealed that particular tracks appeared to be affected by land contamination, sea ice, and river discharge. This mostly occurred in the eastern end of the Gulf of Finland where there existed multiple islands and several rivers that emptied into the gulf. The method employed relied on TG acting as the “ground truth.” The distance from SA data points to TG was within the range of 8.82–92.5 km and did not appear to affect the results. Compared to the DT obtained from TG and corrected HDM, the satellites mostly underestimated the DT value.
Concerning the instrumental factors and correction algorithms, the Sentinel-6 included three more correction than Sentinel-3/Jason-3. These corrections were geocentric ocean tide height solution (OT2), non-equilibrium long-period geocentric ocean tide height (OTA), and IT. These corrections were not removed during examining all the satellite missions and their DT results. Future studies should also examine whether Sentinel-6 included corrections affect the end results and give impact to be considered removing.
Future research could focus on algorithms that can better determine the sea level in the presence of sea ice and processes/forces that may occur seasonality (e.g. river discharge). In the Baltic Sea, the land contamination is still a problem due to the small islands and numerous archipelagos. Improvements in the retrackers utilized is suggested. Further investigation and research could also include detailed estimation and evaluation of all the satellite missions’ corrections and whether they affect the overall estimation of DT. If the presence of sea ice is evaluated and predicted further with corrective algorithms and equations, then it would improve the estimation of sea level and DT.
Acknowledgments
This study was supported by the Estonian Research Council grants PRG 1785 Development of continuous dynamic vertical reference for maritime and offshore engineering by applying machine learning strategies and Grant no. PRG1129.
-
Funding information: The research was supported by the Estonian Research Council grants PRG1129 and PRG1785 “Development of continuous DYNAmic vertical REFerence for maritime and offshore engineering by applying machine learning strategies/DYNAREF/”.
-
Author contributions: Lenne-Liisa Heinoja, Nicole Delpeche-Ellmann, and Artu Ellmann designed the research concept and drafted the manuscript. Lenne-Liisa Heinoja conducted data processing and visualized the manuscript. All authors contributed to data collection, discussion, review, and editing and approved the final manuscript. We thank two anonymous reviewers and editor for provided helpful comments on earlier drafts of the manuscript.
-
Conflict of interest: The authors declare that they have no conflict of interest.
-
Data availability statement: All data can be made available by contacting authors.
References
Ågren, J., G. Strykowski, M. Bilker-Koivula, O. Omang, S. Märdla, R. Forsberg, A. Ellmann, T. Oja, I. Liepinš, E. Parseliunas, J. Kaminskis, L. E. Sjöberg, and G. Valsson. 2016. “The NKG2015 gravimetric geoid model for the Nordic-Baltic region.” 1st Joint Commission 2 and IGFS Meeting International Symposium on Gravity, Geoid and Height Systems.Search in Google Scholar
Birgiel, E., A. Ellmann, and N. Delpeche-Ellmann. 2019. “Performance of sentinel-3A SAR altimetry retrackers: The SAMOSA coastal sea surface heights for the Baltic sea.” International Association of Geodesy Symposia 150, 23–32. 10.1007/1345_2019_5.Search in Google Scholar
Birgiel, E., A. Ellmann, and N. Delpeche-Ellmann. 2018. “Examining the performance of the Sentinel-3 coastal altimetry in the Baltic Sea using a regional high-resolution geoid model.” Proceedings- 2018 Baltic Geodetic Congress, BGC-Geomatics 2018, 196–201. 10.1109/BGC-Geomatics.2018.00043.Search in Google Scholar
BSH. 2018. Ice reports and ice charts. https://www.bsh.de/EN/DATA/Predictions/Ice_reports_and_ice_charts/ice_reports_and_ice_charts_node.html.Search in Google Scholar
Delpeche-Ellmann, N., A. Giudici, M. Rätsep, and T. Soomere. 2021. “Observations of surface drift and effects induced by wind and surface waves in the Baltic Sea for the period 2011-2018.” Estuarine, Coastal and Shelf Science 249, 107071.10.1016/j.ecss.2020.107071Search in Google Scholar
Delpeche-Ellmann, N., T. Mingelaite, and T. Soomere. 2017. “Examining Lagrangian surface transport during a coastal upwelling in the Gulf of Finland, Baltic Sea.” Journal of Marine Systems 171, 21–30. 10.1016/j.jmarsys.2016.10.007.Search in Google Scholar
Dinardo, S. 2020. Techniques and Applications for Satellite SAR Altimetry over water, land and ice - TU prints. Darmstadt, Germany: TUprints. 10.25534/tuprints-00011343.Search in Google Scholar
Emelyanov, E., H. Vallius, and V. Kravtsov. 2017. “Heavy metals in sediments of the Gulf of Finland: A review.” Baltica 30(1), 47–54.10.5200/baltica.2017.30.05Search in Google Scholar
EUMETSAT. 2021. Sentinel-6/Jason-CS ALT Level 2 Product Generation Specification (L2 ALT PGS).Search in Google Scholar
European Space Agency (ESA). 2021. https://sentinels.copernicus.eu/web/.Search in Google Scholar
GGOS. 2022. How can the height of oceans be observed?. Global Geodetic Observing System. https://ggos.org/item/sea-surface-heights/#toggle-id-4.Search in Google Scholar
Grgic, M. and T. Bašić. 2021. Radar Satellite Altimetry in Geodesy -Theory, Applications and Recent Developments. London: IntechOpen Limited.10.5772/intechopen.97349Search in Google Scholar
HELCOM. 2018. Input of nutrients by the seven biggest rivers in the Baltic Sea region. https://helcom.fi/wp-content/uploads/2019/12/BSEP163.pdf.Search in Google Scholar
Hordoir, R., L. Axell, A. Höglund, C. Dieterich, F. Fransner, M. Gröger, Y. Liu, P. Pemberton, S. Schimanke, H. Andersson, P. Ljungemyr, P. Nygren, S. Falahat, A. Nord, A. Jönsson, I. Lake, K. Döös, M. Hieronymus, H. Dietze, U. Löptien, I. Kuznetsov, A. Westerlund, L. Tuomi, and J. Haapala. 2019. “Nemo-Nordic 1.0: a NEMO-based ocean model for the Baltic and North seas – research and operational applications.” Geoscientific Model Development 12, 363–86. 10.5194/gmd-12-363-2019.Search in Google Scholar
IHO. International Hydrographic Organization Standards for Hydrographic Surveys. 2020. S-44. Vol. 6.0.0. International Hydrographic Organization. https://iho.int/uploads/user/pubs/standards/s-44/S44_Edition_6.0.0_EN.pdf.Search in Google Scholar
Jahanmard, V., N. Delpeche-Ellmann, and A. Ellmann. 2021. “Realistic dynamic topography through coupling geoid and hydrodynamic models of the Baltic Sea.” Continental Shelf Research 222, 104421. 10.1016/j.csr.2021.104421.Search in Google Scholar
Jahanmard, V., N. Delpeche-Ellmann, and A. Ellmann. 2022. “Towards realistic dynamic topography from coast to offshore by incorporating hydrodynamic and geoid models.” Ocean Modelling 180, 102124.10.1016/j.ocemod.2022.102124Search in Google Scholar
Jekeli, C. 2006. Geometric Reference System in Geodesy. OhioState University: Columbus, Division of Geodesy and GeospatialScience School of Earth. https://kb.osu.edu/bitstream/handle/1811/77986/Geom_Ref_Sys_Geodesy_2016.pdf?sequence=1&isAllowed=y.Search in Google Scholar
Kärnä, T., P. Ljungemyr, S. Falahat, I. Ringgaard, L. Axell, V. Korabel, J. Murawski, I. Maljutenko, A. Lindenthal, S. Jandt-Scheelke, S. Verjovkina, I. Lorkowski, P. Lagemaa, J. She, L. Tuomi, A. Nord, and V. Huess. 2021. “Nemo-Nordic 2.0: operational marine forecast model for the Baltic Sea.” Geoscientific Model Development 14, 5731–49. 10.5194/gmd-14-5731-2021.Search in Google Scholar
Kollo, K. and A. Ellmann. 2019. “Geodetic Reconciliation of Tide Gauge Network in Estonia.” Geophysica 54(1), 27–38. http://www.geophysica.fi/pdf/geophysica_2019_54_kollo.pdfSearch in Google Scholar
Lehmann, A. 1995. “A three-dimensional baroclinic eddy-resolving model of the Baltic Sea.” Tellus A: Dynamic Meteorology and Oceanography 47(5), 1013–31.10.1034/j.1600-0870.1995.00206.xSearch in Google Scholar
Liibusk, A., T. Kall, S. Rikka, R. Uiboupin, Ü. Suursaar, and K. H. Tseng, 2020. “Validation of copernicus sea level altimetry products in the baltic sea and estonian lakes.” Remote Sensing 12(24), 4062. 10.3390/rs12244062.Search in Google Scholar
Mostafavi, M., N. Delpeche-Ellmann, and A. Ellmann. 2021. “Accurate Sea Surface heights from Sentinel-3A and Jason-3 retrackers by incorporating High-Resolution Marine Geoid and Hydrodynamic Models.” Journal of Geodetic Science 11(1), 58–74.10.1515/jogs-2020-0120Search in Google Scholar
Mostafavi M., N. Delpeche-Ellmann, A. Ellmann, and V. Jahanmard, 2023. “Determination of Accurate Dynamic Topography for the Baltic Sea Using Satellite Altimetry and a Marine Geoid Model.” Remote Sensing 15, 2189. 10.3390/rs15082189.Search in Google Scholar
NOAA. 2020. “Altimetric bathymetry.” Laboratory for Satellite Altimetry. https://www.star.nesdis.noaa.gov/socd/lsa/AltBathy/.Search in Google Scholar
Nietosvaara, V. and J. Prieto. 2018. Ice melting in the Baltic Sea. EUMETSAT. https://www.eumetsat.int/ice-melting-baltic-sea.Search in Google Scholar
Ophaug, V., K. Breili, and C. Gerlach. 2015. “A comparative assessment of coastal mean dynamic topography in Norway by geodetic and ocean approaches.” Journal of Geophysical Research: Oceans 120(12), 7807–26.10.1002/2015JC011145Search in Google Scholar
Passaro, M., F. Müller, D. Dettmering, A. Abulaitjiang, L. Rautiainen, R. G. Scarrott, E. Chalençon, and M. Sweeney. 2021. BALTIC + theme 3 Baltic + SEAL (sea level) product handbook. European Space Agency. 10.5270/esa.BalticSEAL.PH1.1.Search in Google Scholar
Schwabe, J., J. Ågren, G. Liebsch, and P. Westfeld. 2020. THE BALTIC SEA CHART DATUM 2000 (BSCD2000) – Implementation of a common reference level in the Baltic Sea.Search in Google Scholar
Siegel, H. and M. Gerth. 2018. Sea Surface Temperature in the Baltic Sea 2018. Leibniz Institute for Baltic Sea Research Warnemünde (IOW). https://helcom.fi/wp-content/uploads/2020/07/BSEFS-SeaSurface-Temperature-in-the-Baltic-Sea-2018.pdf.Search in Google Scholar
SMHI. 2021. Swedish Meteorological and Hydrological Institute. https://www.smhi.se/.Search in Google Scholar
Soomere, T., A. Behrens, L. Tuomi, and J. W. Nielsen. 2008. “Wave conditions in the Baltic Proper and in the Gulf of Finland during windstorm Gudrun.” Natural Hazards and Earth System Sciences 8(1), 37–46. 10.5194/nhess-8-37-2008.Search in Google Scholar
Suursaar, Ü. and J. Sooäär, 2007. “Decadal variations in mean and extreme sea level values along the Estonian coast of the Baltic Sea.” Tellus A: Dynamic Meteorology and Oceanography 59(2), 249–60.10.1111/j.1600-0870.2006.00220.xSearch in Google Scholar
Vancoppenolle, M., S. Bouillon, H. Goosse, and T. Fichefet. 2012. LIM - The Louvain-la-Neuve sea Ice Model. https://cmc.ipsl.fr/images/publications/scientific_notes/lim3_book.pdf.Search in Google Scholar
Varbla, S., A. Liibusk, and A. Ellmann. 2022a. “Shipborne GNSS-Determined Sea Surface Heights Using Geoid Model and Realistic Dynamic Topography.” Remote Sensing 14(10), 2368.10.3390/rs14102368Search in Google Scholar
Varbla, S., J. Ågren, A. Ellmann, and M. Poutanen. 2022b. “Treatment of tide gauge time series and marine GNSS measurements for vertical land motion with relevance to the implementation of the Baltic Sea Chart Datum 2000.” Remote Sensing 14(4), 920.10.3390/rs14040920Search in Google Scholar
Vestøl, O., J. Ågren, H. Steffen, H. Kierulf, and L. Tarasov. 2019. “NKG2016LU: a new land uplift model for Fennoscandia and the Baltic Region.” Journal of Geodesy 93, 1759–79. 10.1007/s00190-019-01280-8.Search in Google Scholar
Wolski, T., B. Wiśniewski, A. Giza, H. Kowalewska-Kalkowska, H. Boman, S. Grabbi-Kaiv, T. Hammarklint, J. Holfort, and Ž. Lydeikaitė. 2014. “Extreme sea levels at selected stations on the Baltic Sea coast.” Oceanologia 56(2), 259–90. 10.5697/oc.56-2.259.Search in Google Scholar
© 2023 the author(s), published by De Gruyter
This work is licensed under the Creative Commons Attribution 4.0 International License.
Articles in the same Issue
- Research Articles
- Two adjustments of the second levelling of Finland by using nonconventional weights
- A gap-filling algorithm selection strategy for GRACE and GRACE Follow-On time series based on hydrological signal characteristics of the individual river basins
- On the connection of the Ecuadorian Vertical Datum to the IHRS
- Accurate computation of geoid-quasigeoid separation in mountainous region – A case study in Colorado with full extension to the experimental geoid region
- A detailed quasigeoid model of the Hong Kong territories computed by applying a finite-element method of solving the oblique derivative boundary-value problem
- Metrica – An application for collecting and navigating to geodetic control network points. Part II: Practical verification
- Global Geopotential Models assessment in Ecuador based on geoid heights and geopotential values
- Review Articles
- Local orthometric height based on a combination of GPS-derived ellipsoidal height and geoid model: A review paper
- Some mathematical assumptions for accurate transformation parameters between WGS84 and Nord Sahara geodetic systems
- Book Review
- Physical Geodesy by Martin Vermeer published by Aalto University Press 2020
- Special Issue: 2021 SIRGAS Symposium (Guest Editors: Dr. Maria Virginia Mackern) - Part II
- DinSAR coseismic deformation measurements of the Mw 8.3 Illapel earthquake (Chile)
- Special Issue: Nordic Geodetic Commission – NKG 2022 - Part I
- NKG2020 transformation: An updated transformation between dynamic and static reference frames in the Nordic and Baltic countries
- The three Swedish kings of geodesy – Speech at the NKG General Assembly dinner in 2022
- A first step towards a national realisation of the international height reference system in Sweden with a comparison to RH 2000
- Examining the performance of along-track multi-mission satellite altimetry – A case study for Sentinel-6
- Geodetic advances in Estonia 2018–2022

