Abstract
The beginning of radars goes back to the 1930s where its main boost was related to the second world war. Nowadays, the techniques associated with radars are focused around a vast variety of civil, geodetic, and military applications. The development of the synthetic aperture principle, in the 1950s and 1960s, gave birth to a lot of new applications, and together with the technological progress of the last decades, the technique of interferometry with synthetic aperture radar (SAR) data became one of the most powerful ones for sensing remotely, with high quality and a vast spatial coverage. We used Sentinel-1 data and the differential interferometry SAR (DinSAR) technique to map and measure the surface deformation related to the 2015 Mw 8.3 Illapel earthquake (Chile). We also validated the results, by analysing the temporal variation of coordinates acquired from global navigation satellite system observations and projecting them in the geometry of the SAR system. Using this application we prove the DinSAR technique to be useful and powerful for the observation and analysis of surface deformation caused by the release of stress during the Mw 8.3 Illapel earthquake. It proved to be an efficient tool to detect and map the surface deformation with high spatial resolution in an approximate area of 20,000 km2.
1 Introduction
On 16 September 2015 at 19:54:31 local time, a Mw 8.3 earthquake struck the Coquimbo Region in Chile. This has been the strongest earthquake to hit this tectonically active area since the Maule 2010, the latter being responsible for producing the largest displacements of geodetic observations in terrestrial stations and changes in reference frames such as the International Terrestrial Reference Frame or its regional densification Sistema de Referencia Geocéntrico de las Américas with coordinate changes of up to 4 m (Sánchez and Drewes 2016). Measuring these strong displacements is relevant for various reasons, which includes updating the deformation and velocity models, as shown in the work of Sánchez and Drewes (2016). Therefore, the differential interferometry synthetic aperture radar (DinSAR) technique is useful to provide remote information of displacements of the earth’s surface, from high-resolution synthetic aperture radar (SAR) images (from 3 to 20 m of spatial resolution, approximately, depending on the frequency band in which the SAR system operates (Moreira et al. 2013)).
Over the last decade, the increase in experience with high-resolution SAR systems has brought maturity to the InSAR algorithms; moreover, in the last few years innovative imaging systems have allowed the creation of new SAR systems with increased swath coverage at the expense of spatial resolution (Ansari 2018). This enables these medium-resolution SAR systems to perform global acquisition with a reduced revisit time, from a biweekly time span to a weekly interval. Examples of these are the European Space Agency’s (ESA’s) Sentinel-1 satellites and the future launch of NASA’s NASA-ISRO SAR (NISAR) Mission.
The significant increase in the amount of available SAR data will benefit many applications such as the one for monitoring deformation, allowing, with the introduction of near real-time processing algorithms, the creation of geohazard warning systems based on SAR data.
When mapping the deformation field of an event such as the aforementioned one, the deformation resulting from DinSAR is regarded as line of sight (LOS) displacement, i.e. what we obtain is the information of the movement of a target point on the surface in the direction of the line that joins the satellite to the ground. Decomposing this displacement on its north, east, and up components is not an easy task and usually requires observations with more than one acquisition geometry (Grandin et al. 2016). In this work, we make use of one pair of SAR images, with only one acquisition geometry. Therefore, instead of decomposing the LOS displacement, we compare the results obtained with the DinSAR technique with three-dimensional displacement differences obtained from geodetic highly accurate global navigation satellite system (GNSS) coordinates, which were later projected to the LOS.
2 Methods
We use SAR images acquired with interferometric wide swath, with a level-1 processing single look complex (SLC). The complete image is formed by three sub-swaths and nine bursts per swath. They were chosen to cover the area of interest, being this the one surrounding the epicentre of the 2015 Mw 8.3 Illapel earthquake between the latitudes 30 to 32° south and longitudes 70 to 72° west, spanning 20,000 km2 (Figure 1).
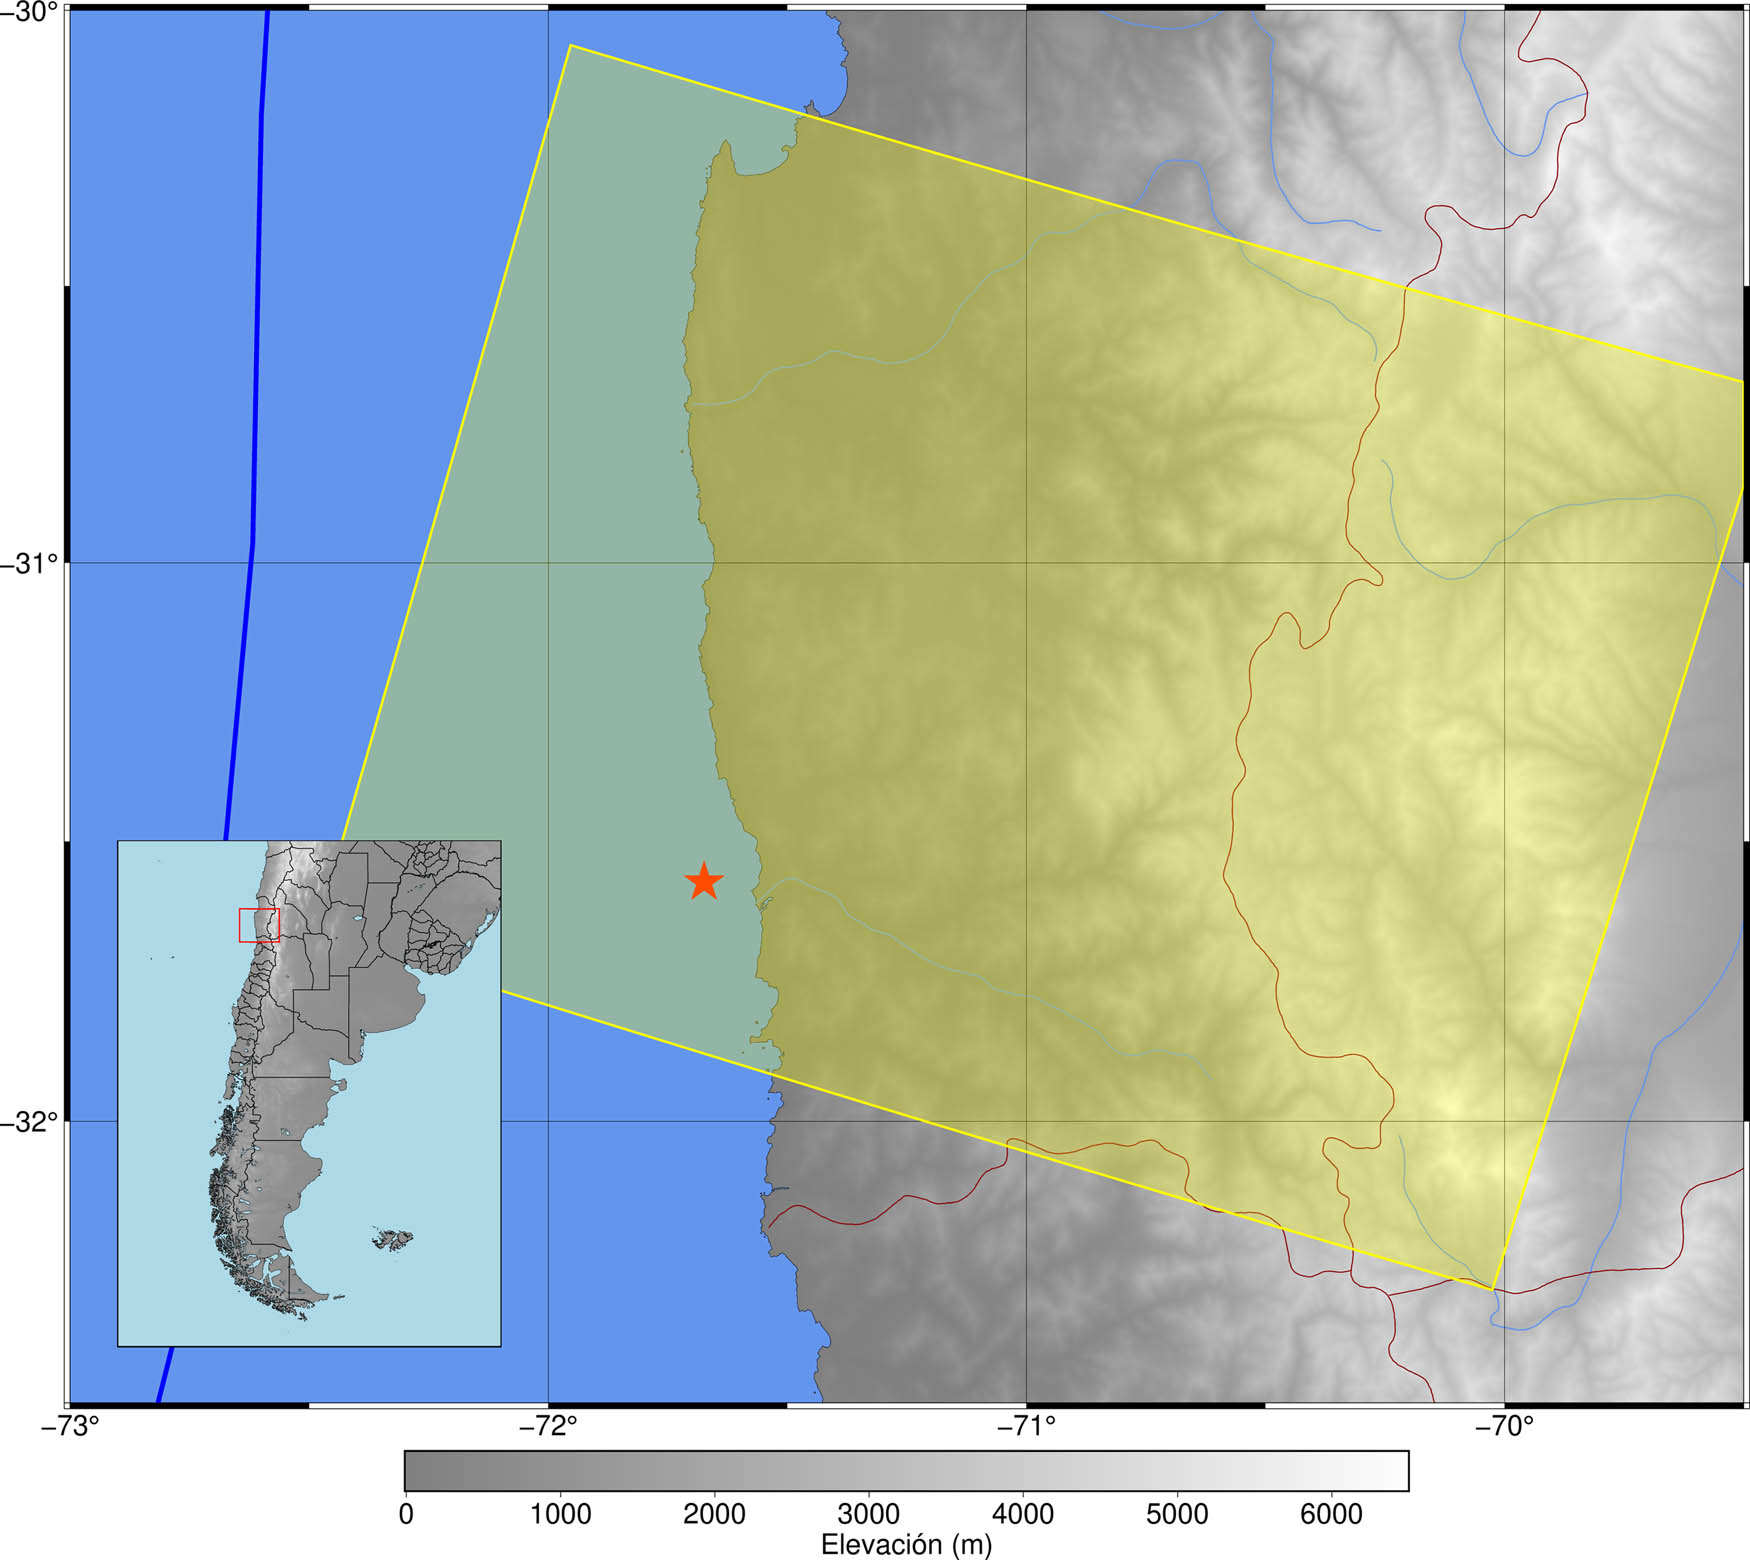
The yellow area is the zone covered by the SAR acquisitions. The red star marks the epicentre. The blue line shows the subduction between Nazca and Sudamerican plates.
Regarding the temporal coverage, it is crucial to find an interferometric pair consisting of an image acquired before the main event and one after. However, there were many aftershocks of considerable magnitude close in time to the main event, making it difficult to isolate the main shock from them. The first scene was acquired on 24 August 2015 (23 days before the main event) and the second was acquired on 17 September 2015 (∼11 h after the main event). Both of them are descending passes corresponding to the Path 156 and Frame 695. The data were obtained from the Sentinel-1 satellite mission corresponding to the ESA, particularly from the Sentinel-1A satellite which operates in C band (5.405 GHz).
Sentinel-1 is an SAR mission that can use the terrain observation by progressive scan (TOPS) mode as a standard acquisition mode. This is because the short revisit time demands the sensor to operate in wide-swath mode to cover the entire globe (Sandwell et al. 2011). A way of increasing the swath size is operating in ScanSAR; nevertheless, the amplitude of the image may not be uniform among bursts. The solution comes with the TOPS mode where the radar scans three sub-swaths successively, as it moves forward, which is accomplished by electronically steering the beam periodically.
The software used for processing was the generic mapping tools InSAR processing system (GMTSAR) (Sandwell et al. 2011), which is an open-source InSAR processing system (GNU general public license) designed for users familiarised with generic mapping tools (GMTs). The processing chain (Figure 2) starts with the coregistration which consists of aligning the slave image to the master. The precision of this alignment depends on the coherence of both images. When it is high it is possible to obtain a precise alignment (0.1 pixel). When it is lower the precision can be worse than 1 pixel. And in extreme cases where the coherence is too low, the alignment fails.
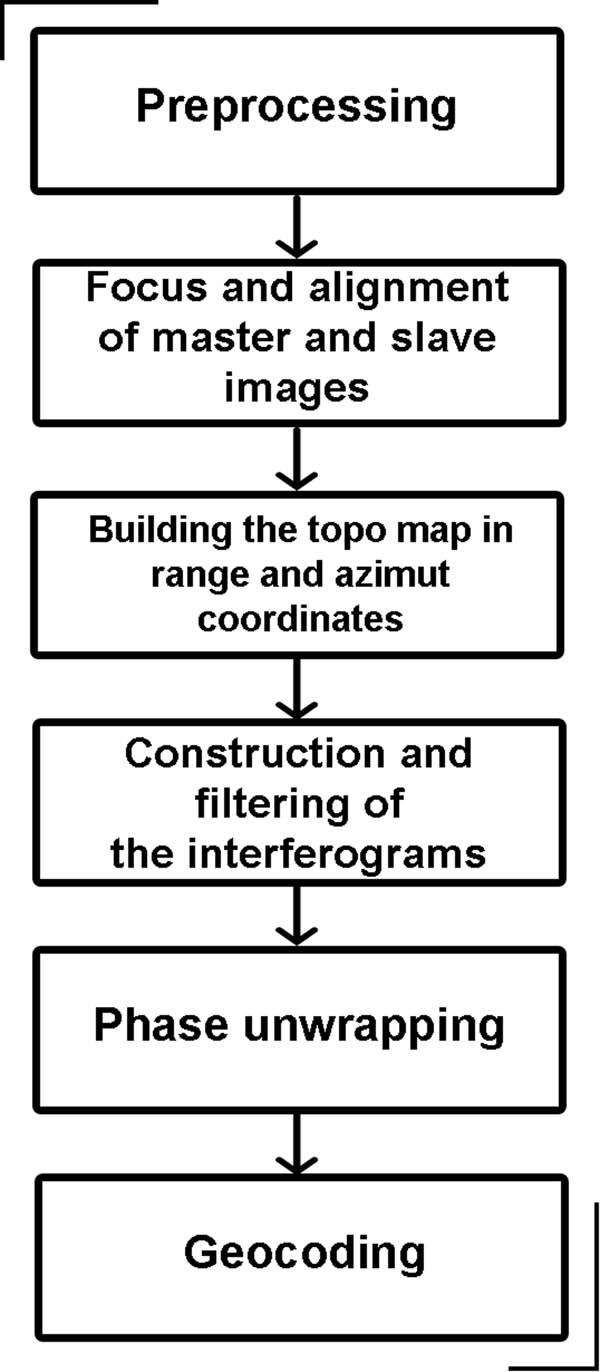
Interferometric processing chain.
Operating in TOPS mode carries two problems that cause the traditional alignment to fail. First of all, it is necessary to have an alignment that is precise to a higher order of magnitude (0.01 pixel). This has to do with the successive change in the squint angle of the sensor on each sub-swath, which introduces a significant change in the Doppler centroid variations of approximately ±2,250 Hz, while traditional systems work with Doppler centroid variations close to 0. Hence to avoid important phase jumps, a more precise alignment is needed (Sandwell et al. 2011).
The second problem is related to the spectrum in azimuth, which in TOPS mode holds frequencies that go past the Nyquist sampling frequency of the SLC data. This causes the traditional sine function interpolation to fail, which is the last part of the alignment algorithm with GMTSAR, where the slave image is resampled to the coordinates of the master image.
To sort out these problems, two strategies are required. For the first problem, a geometric alignment based on precise orbital information is required, and for the second problem, it is necessary to do a deramping of the SLC data before the interpolation, which essentially translates to an increase in the Nyquist sampling frequency.
The next step of the processing chain is the interferogram formation where both SLC images (already aligned) are multiplied. Since each pixel of the image has a complex value, i.e. it has an amplitude and a phase, the multiplication consists of the difference of phases and multiplication of the amplitudes. The phase difference holds the information of interest, i.e. the surface deformation in radar coordinates, along with other components: due to the Earth’s curvature, a topographic phase, orbital errors, tropospheric and Ionospheric delays, and white noise. Some of these are known like the orbital errors, while others like the tropospheric delay are largely unknown and hard to predict. To simulate and remove the topographic phase, we use a digital elevation model (DEM) spanning the area of interest between the latitudes 29.25° to 32.5° south and longitudes 70° to 73.5° west. The model used was the 30 m shuttle radar topography mission. The atmospheric contributions were considered to be of a relatively small magnitude and were not taken into consideration. This is because of a visual analysis and interpretation performed over the wrapped interferograms (Figure 4) where the fringe deformation pattern associated with the earthquake influence can be easily seen without the presence of strong atmospheric artefacts. Nevertheless, for a more precise result this contribution must be taken into consideration, either by modelling it or reducing it using an approach such as the time-series analysis.
The phase of the signal is cyclic, it repeats every 2π and hides the information of the absolute phase, which is what we need to determine. The direct problem consisting of mapping the absolute phase to the interval [−π, π) namely “wrapping the phase” is easy to solve. The inverse problem is the difficult one, essentially because of its ambiguity and non-linearity. The inverse problem is called phase unwrapping. There exist several algorithms and strategies that try to solve the problem, including the branch cuts method (Goldstein et al. 1988) and the least squares and minimal cost flow (MCF) methods (Costantini 1997). In this work, we make use of the statistical-cost, network-flow algorithm for phase-unwrapping (SNAPHU) written by Chen and Zebker (2000), which is based on the MCFs.
The last step in the processing chain is called geocoding and it refers to the conversion from radar coordinates: range, azimuth to WGS84 geodetic coordinates: longitude, latitude.
To compare the results obtained after the interferogram processing chain with the three-dimensional displacement vector obtained from the GNSS time series, as mentioned earlier, we had to project it into the LOS direction for which we used a system transformation expressed by:
where
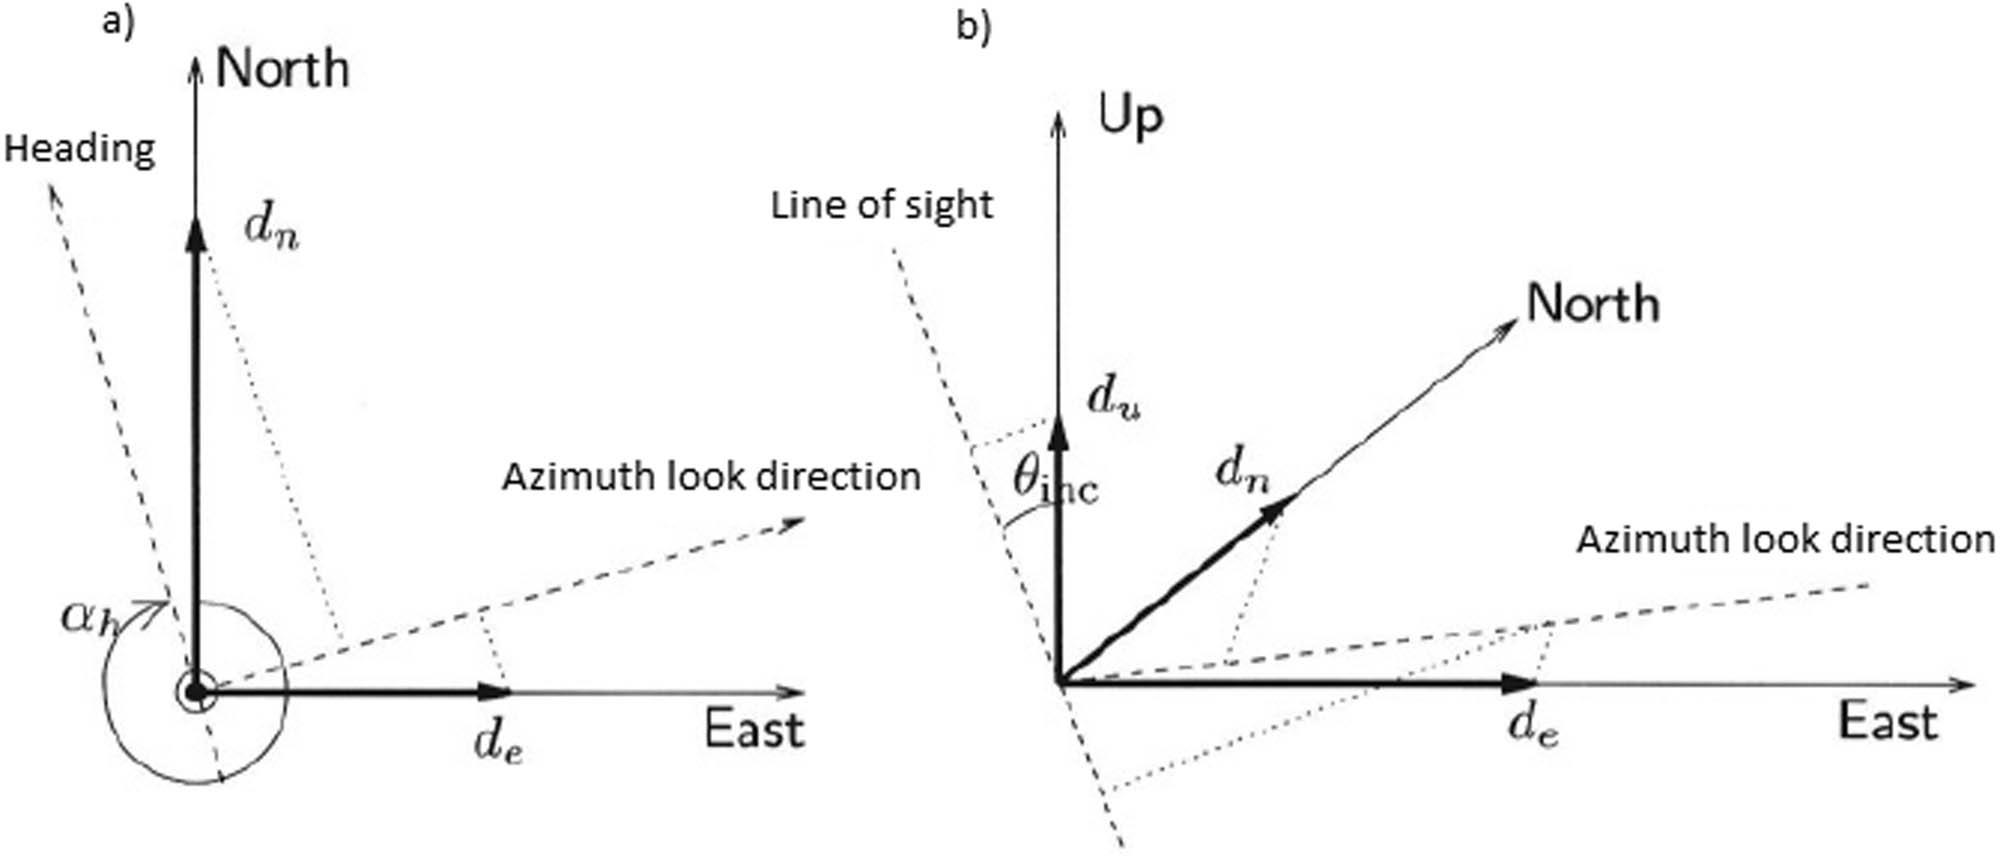
Projection of the three components of the deformation vector into the LOS direction. (a) Top view showing north and east components. (b) Three-dimensional sketch including the projection of the Up component. Modified from Hanssen (2001).
3 Results
The cyclic phase filtered with a low-pass Gaussian filter, with a 200 m wavelength (Figure 4), shows the patterns mentioned previously, and it is also possible to estimate the value of the deformation. Knowing the value of the emitted pulse wavelength of the satellite (5.6 cm for C band) and counting the number of fringes in the wrapped interferogram (around 35 from west to east), since every fringe represents half of the wavelength, we arrived at an approximate value of 98 cm.
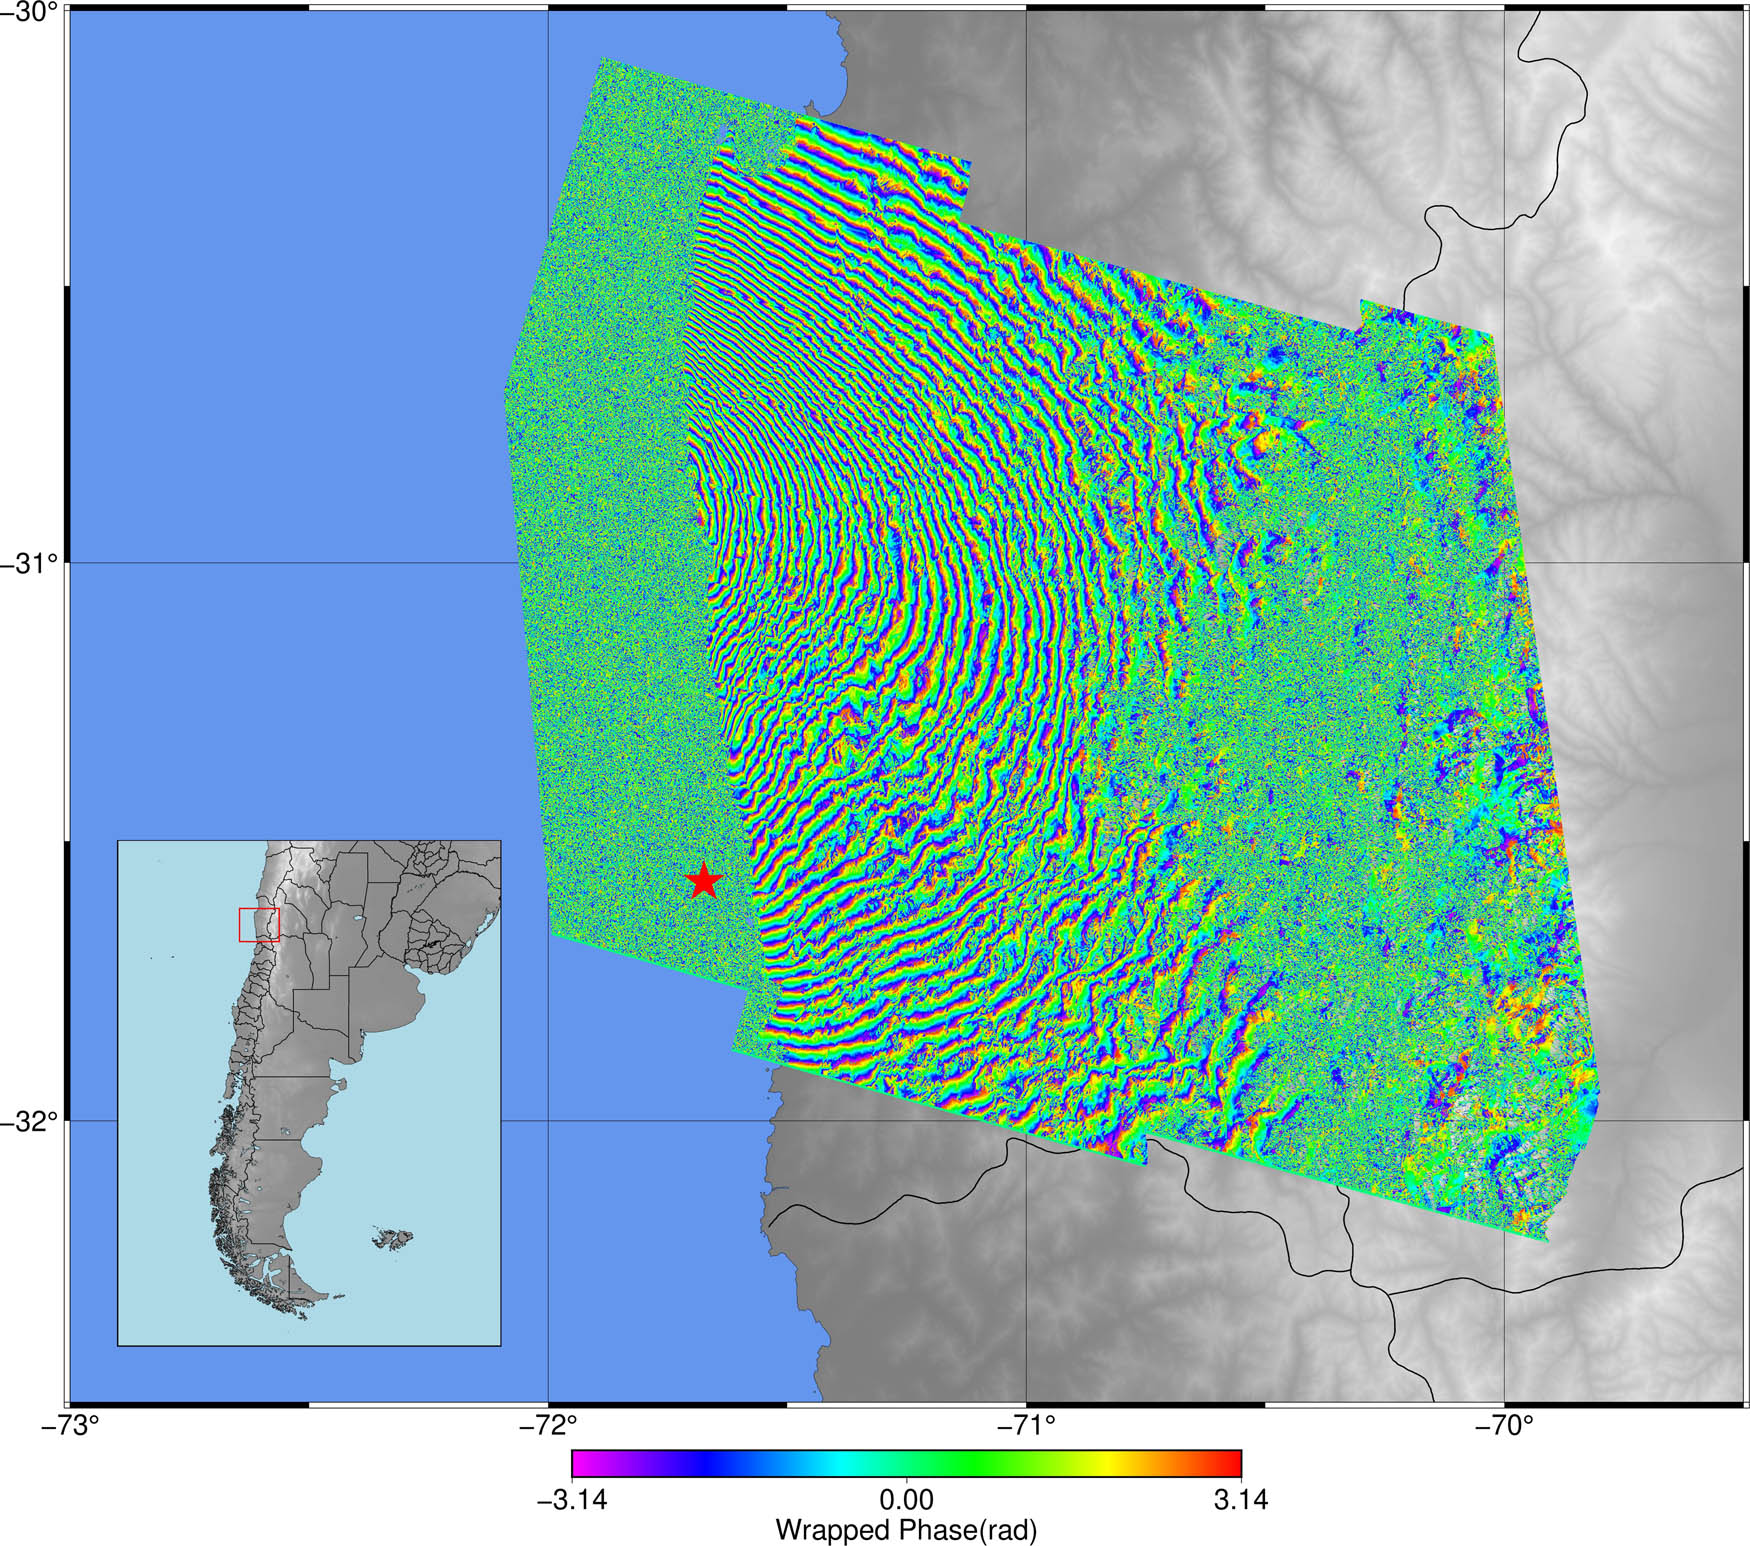
Wrapped Interferogram. The phase cycles every 2π radians.
The unwrapped interferogram (Figure 5) was obtained with a coherence threshold for the SNAPHU program of 0.25, i.e. the unwrapping was only applied to those pixels where the correlation value (between both images) was higher than 0.25. The resolution of the resulting interferogram is approximately 60 m (∼0.0005°) per pixel.
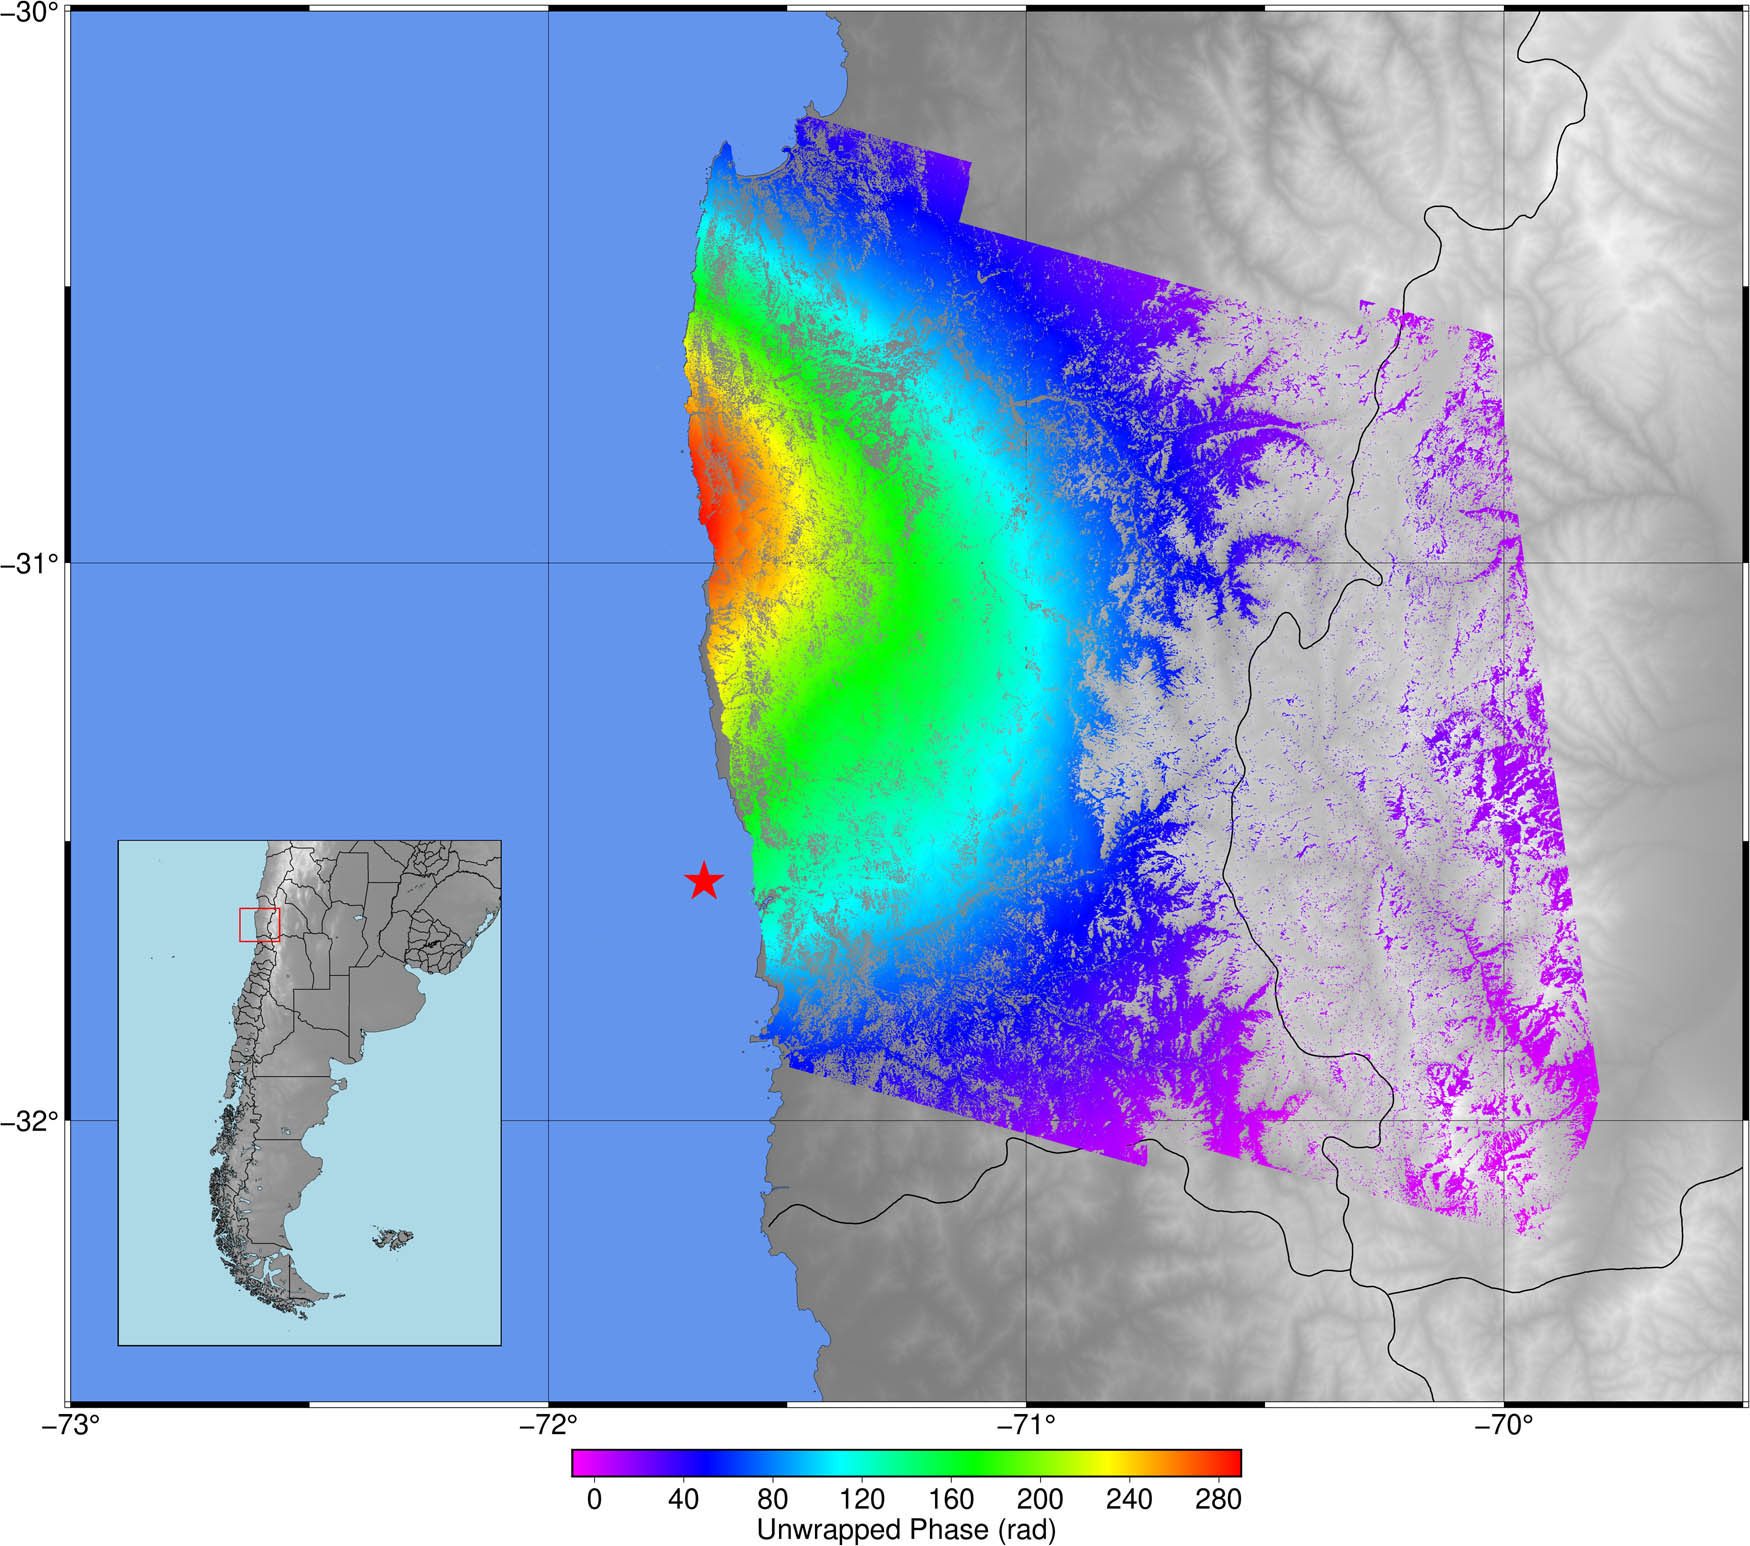
Unwrapped interferogram. The ambiguity of the phase is resolved.
The resulting interferogram, computed with the older image as the master and the newer as the slave, shows mostly positive LOS displacements, peaking at 138.5 cm (Figure 9). The positive values point to an increase in the distance between satellite and target, in the range direction, i.e. the surface moves away from the satellite path. Nevertheless, it is important to note that using observations derived from only one acquisition geometry (descending orbit and right looking) is not enough to decompose the LOS displacement into a three-dimensional displacement. To do so, it is required to include observations of the range changes acquired with different orbits (ascending and descending), different antenna-looking geometries (left and right), different incidence angles for each ascending and descending pass (Wright et al. 2004), or external information regarding the deformation episode. Even so, given the almost polar orbits of the SAR satellites, the north component of the deformation is the most difficult to obtain.
In our analysis, we had both descending and ascending pairs of acquisitions available from Sentinel-1, both in right-looking geometries, which could be used to separate east–west from up displacement components as shown in the work of Solaro et al. (2016). But since this was still not enough to obtain the three-dimensional displacement map, in this work we opted for a different approach where we chose the best resulting interferogram, in terms of their coherence. This resulting interferogram was validated with a three-dimensional displacement vector, projected into the LOS direction, which was derived from GNSS observations.
3.1 GNSS analysis
Figures 6–8 show the time series for the three components in local coordinates, namely north, east, and up for each GNSS station. The three stations where the data were acquired are SLMC, PFRJ, and BN17; they were the closest stations available at the time and are located at a maximum of 126 km from the epicentre. The GNSS observations were processed by the Nevada Geodetic Laboratory (NGL) using the precise point positioning strategy with the state-of-the-art models in order to mitigate all observation biases and international GNSS service (IGS) geodetic products (ephemerides and satellite clock corrections) to obtain the most accurate result in IGS14 reference frame (Blewitt et al. 2018). All the stations used are maintained by the National Seismological Centre of Chile (https://www.sismologia.cl/), and the raw data are publicly available in compress rinex format at http://gps.csn.uchile.cl/.
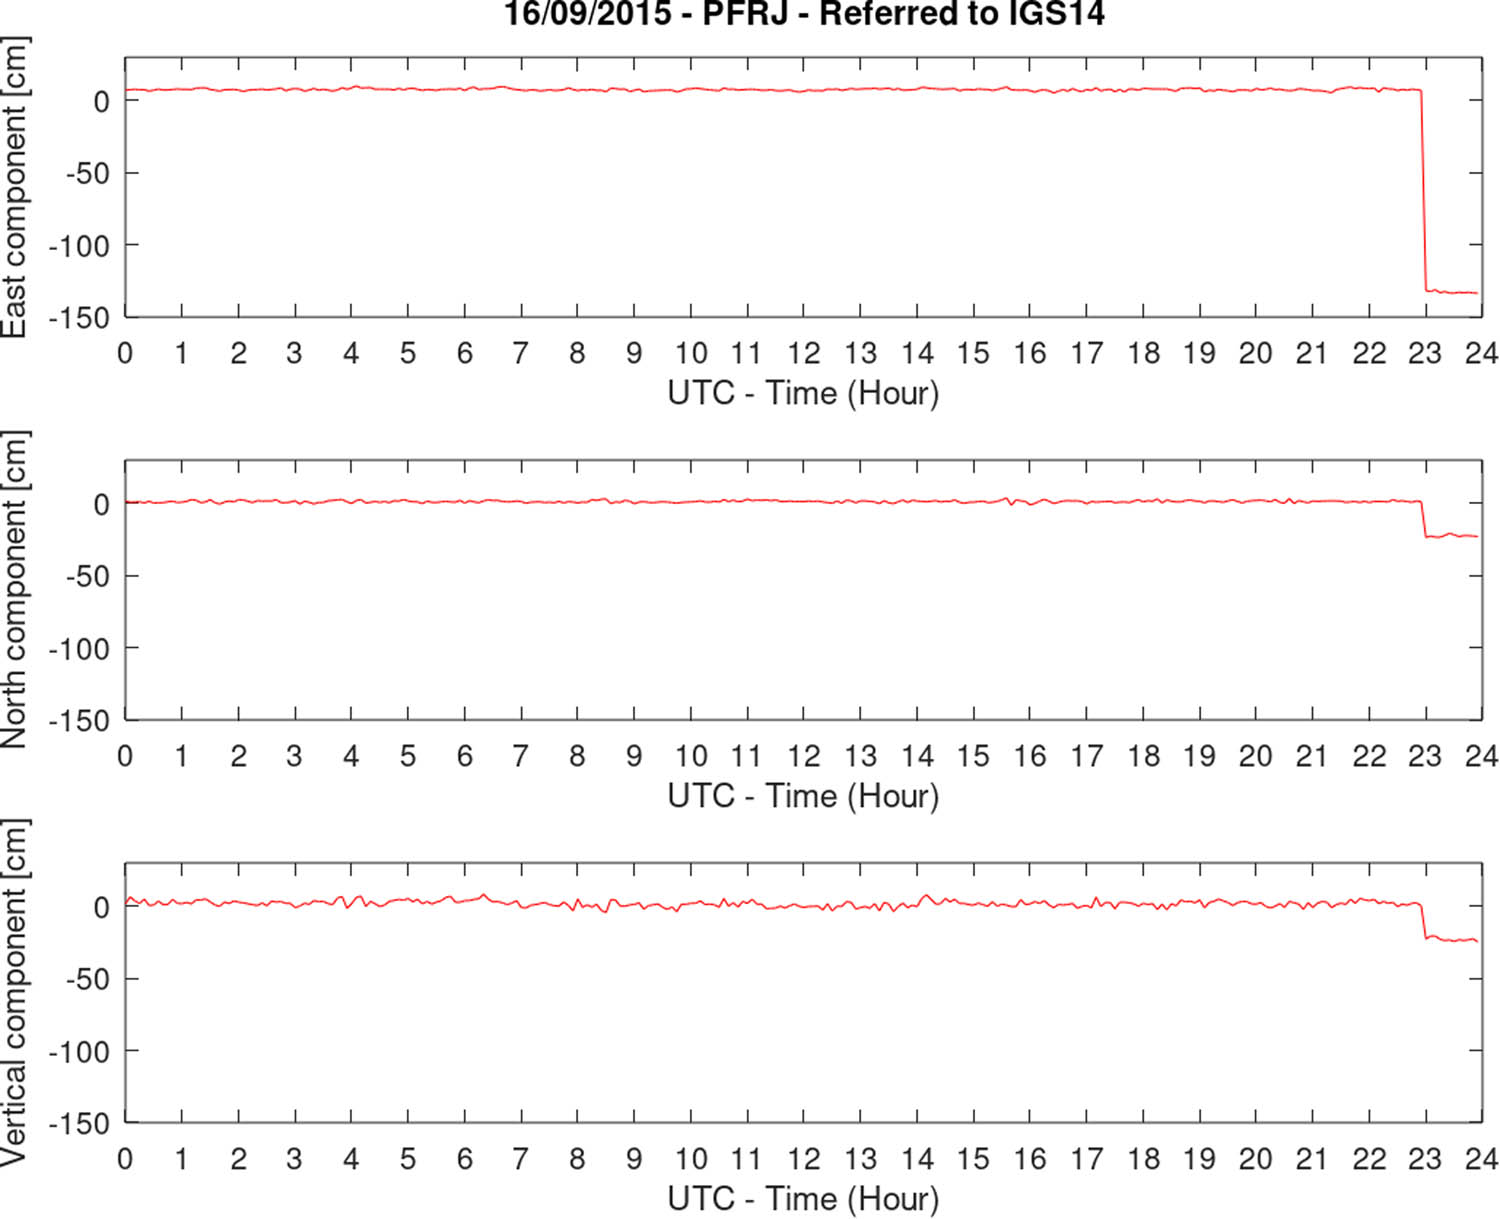
Temporal variation of the coordinates for the GNSS station PFRJ.
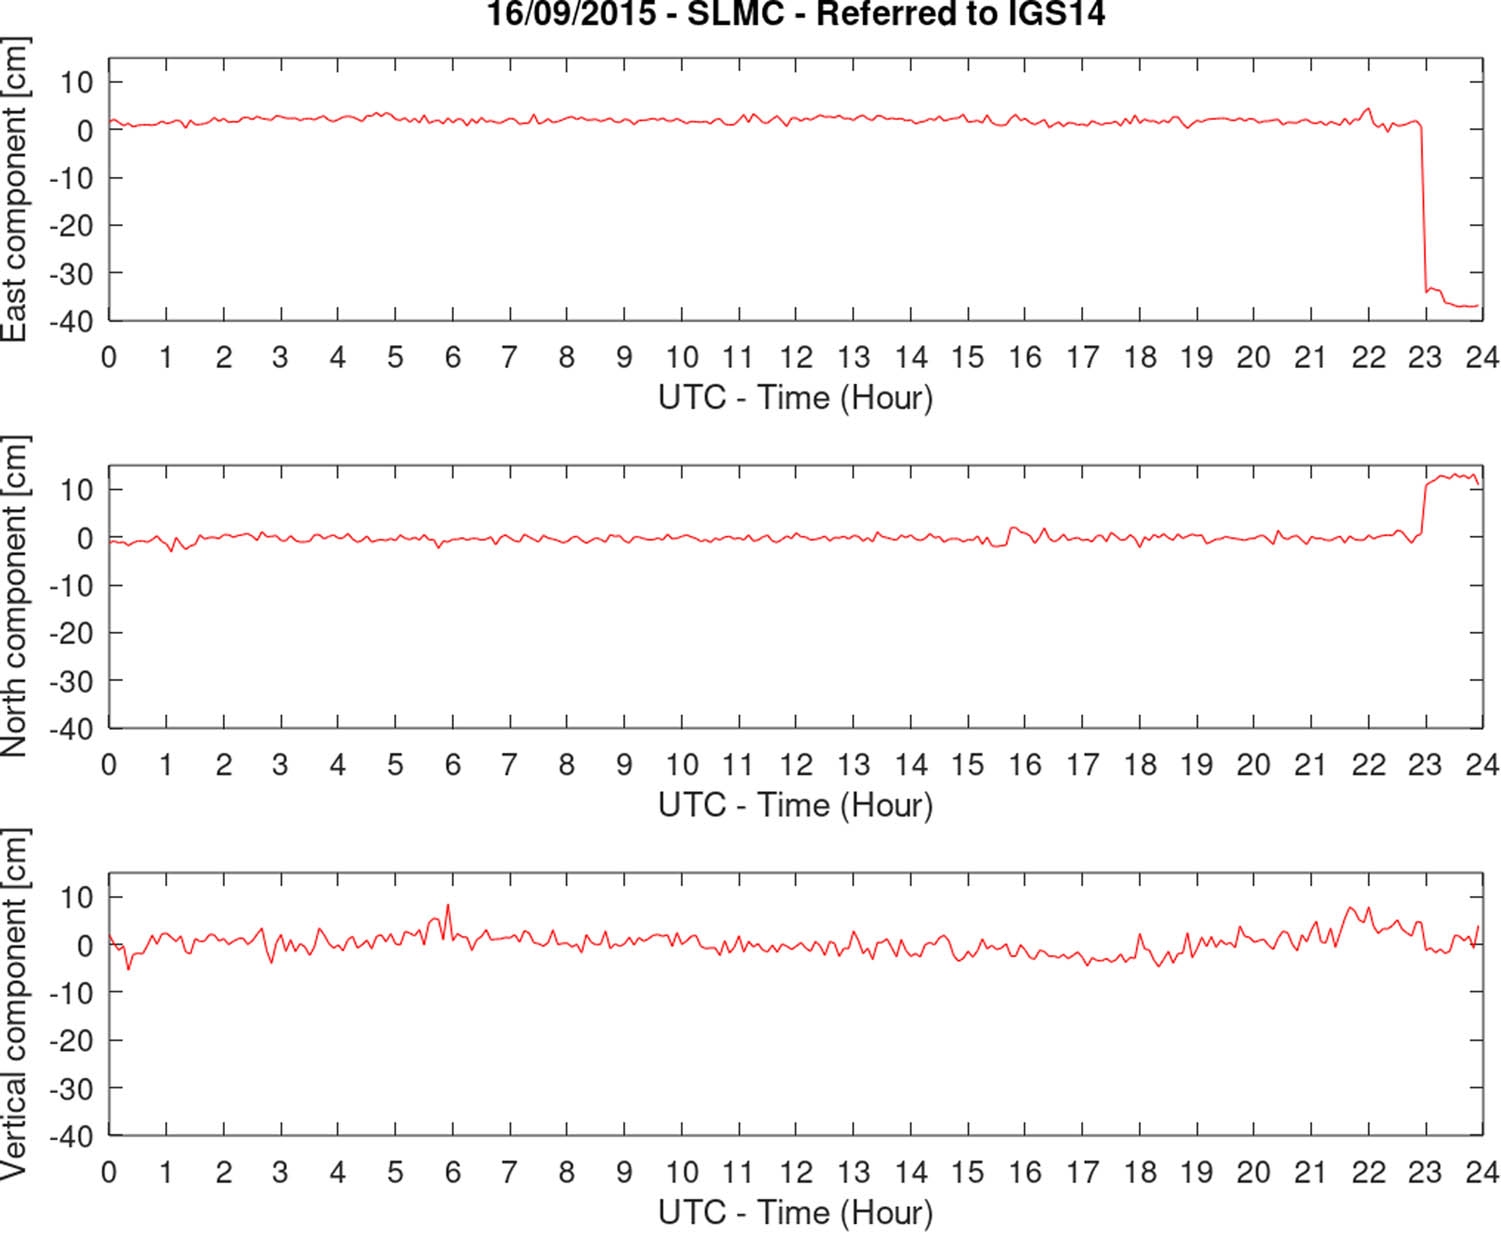
Temporal variation of the coordinates for the GNSS station SLMC.
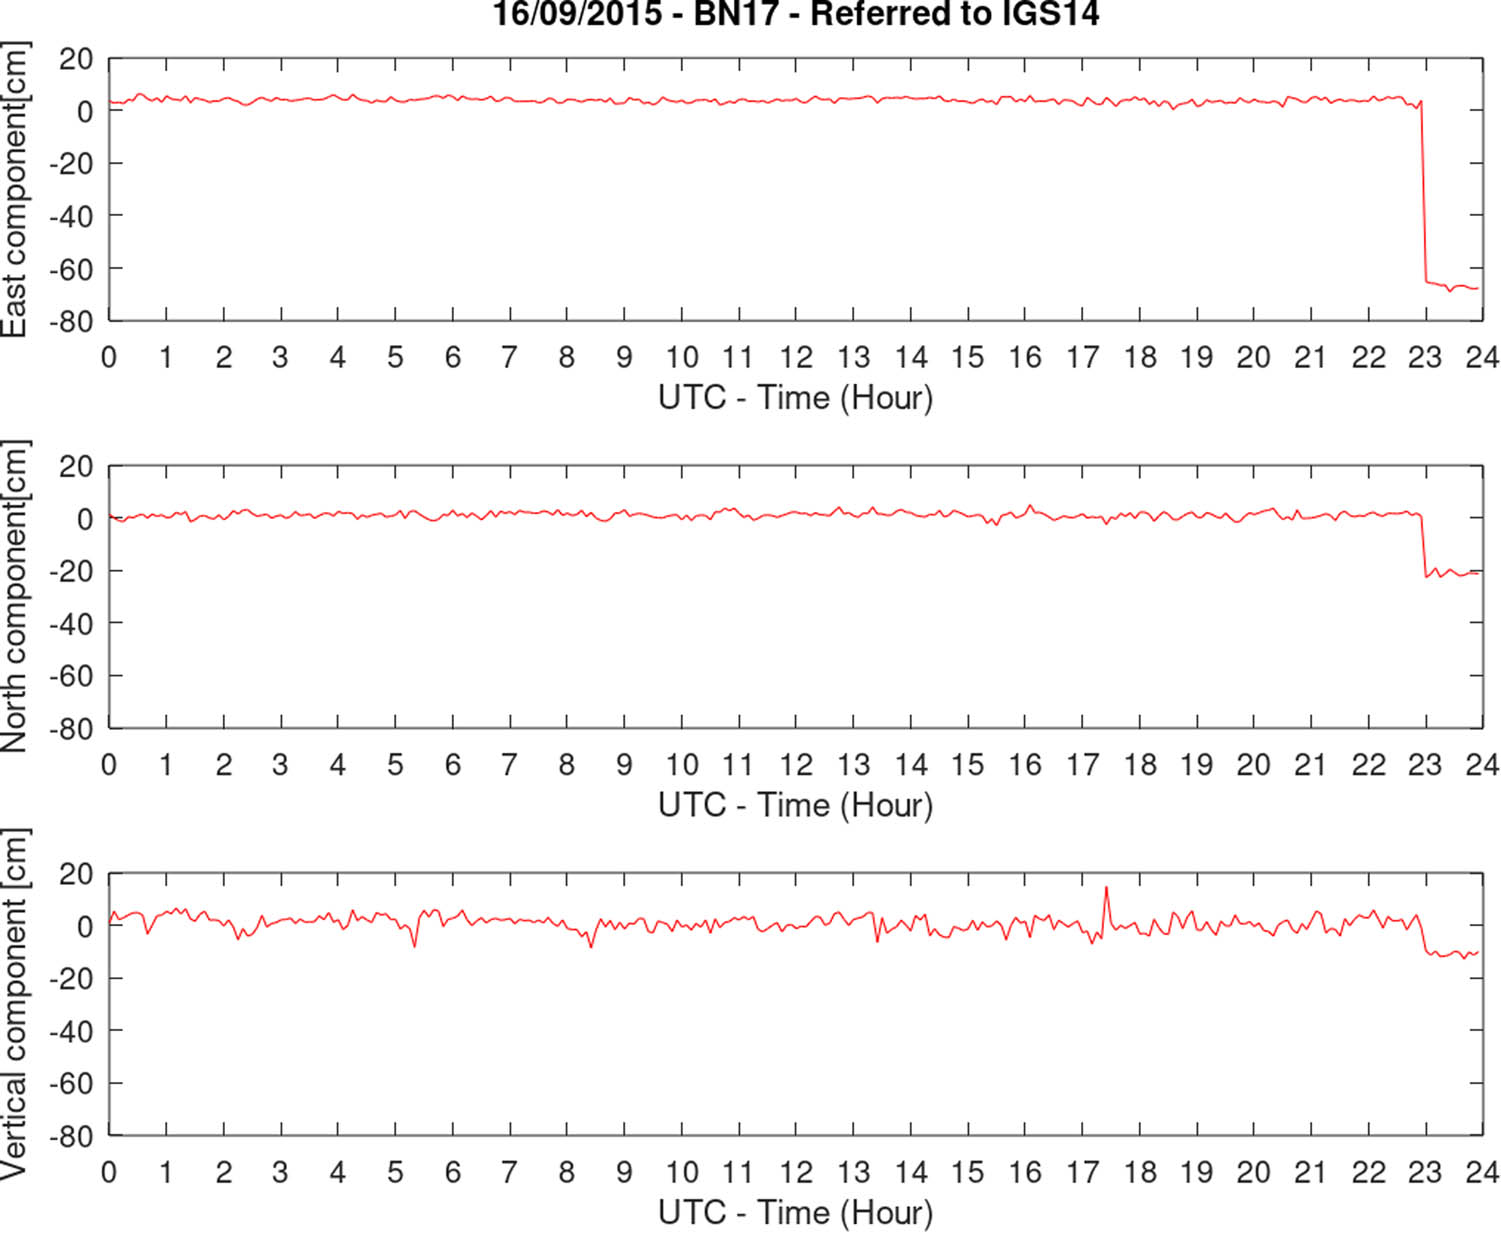
Temporal variation of the coordinates for the GNSS station BN17.
The largest displacement at the time when the main shock took place was observed for the PFRJ station which is not the closest to the epicentre (Figure 9); this can be attributed to the fact that the epicentre of an earthquake is the starting point of the rupture, i.e. the slip distribution is given along a fault plane, not only on that point. This result would suggest that the rupture plane of this earthquake extended to the north of where the epicentre was located. The three-dimensional displacement vectors were calculated by obtaining the components coordinates (Blewitt et al. 2018) measured for the same dates of the acquisitions of the SAR images., i.e. 24 August 2015 and 17 September 2015. And then calculating the difference between them. The maximum displacement value observed was −144 cm on its east component, which was later projected along the LOS direction of the satellite, resulting in a value of approximately 95 cm in that direction (Figure 9).
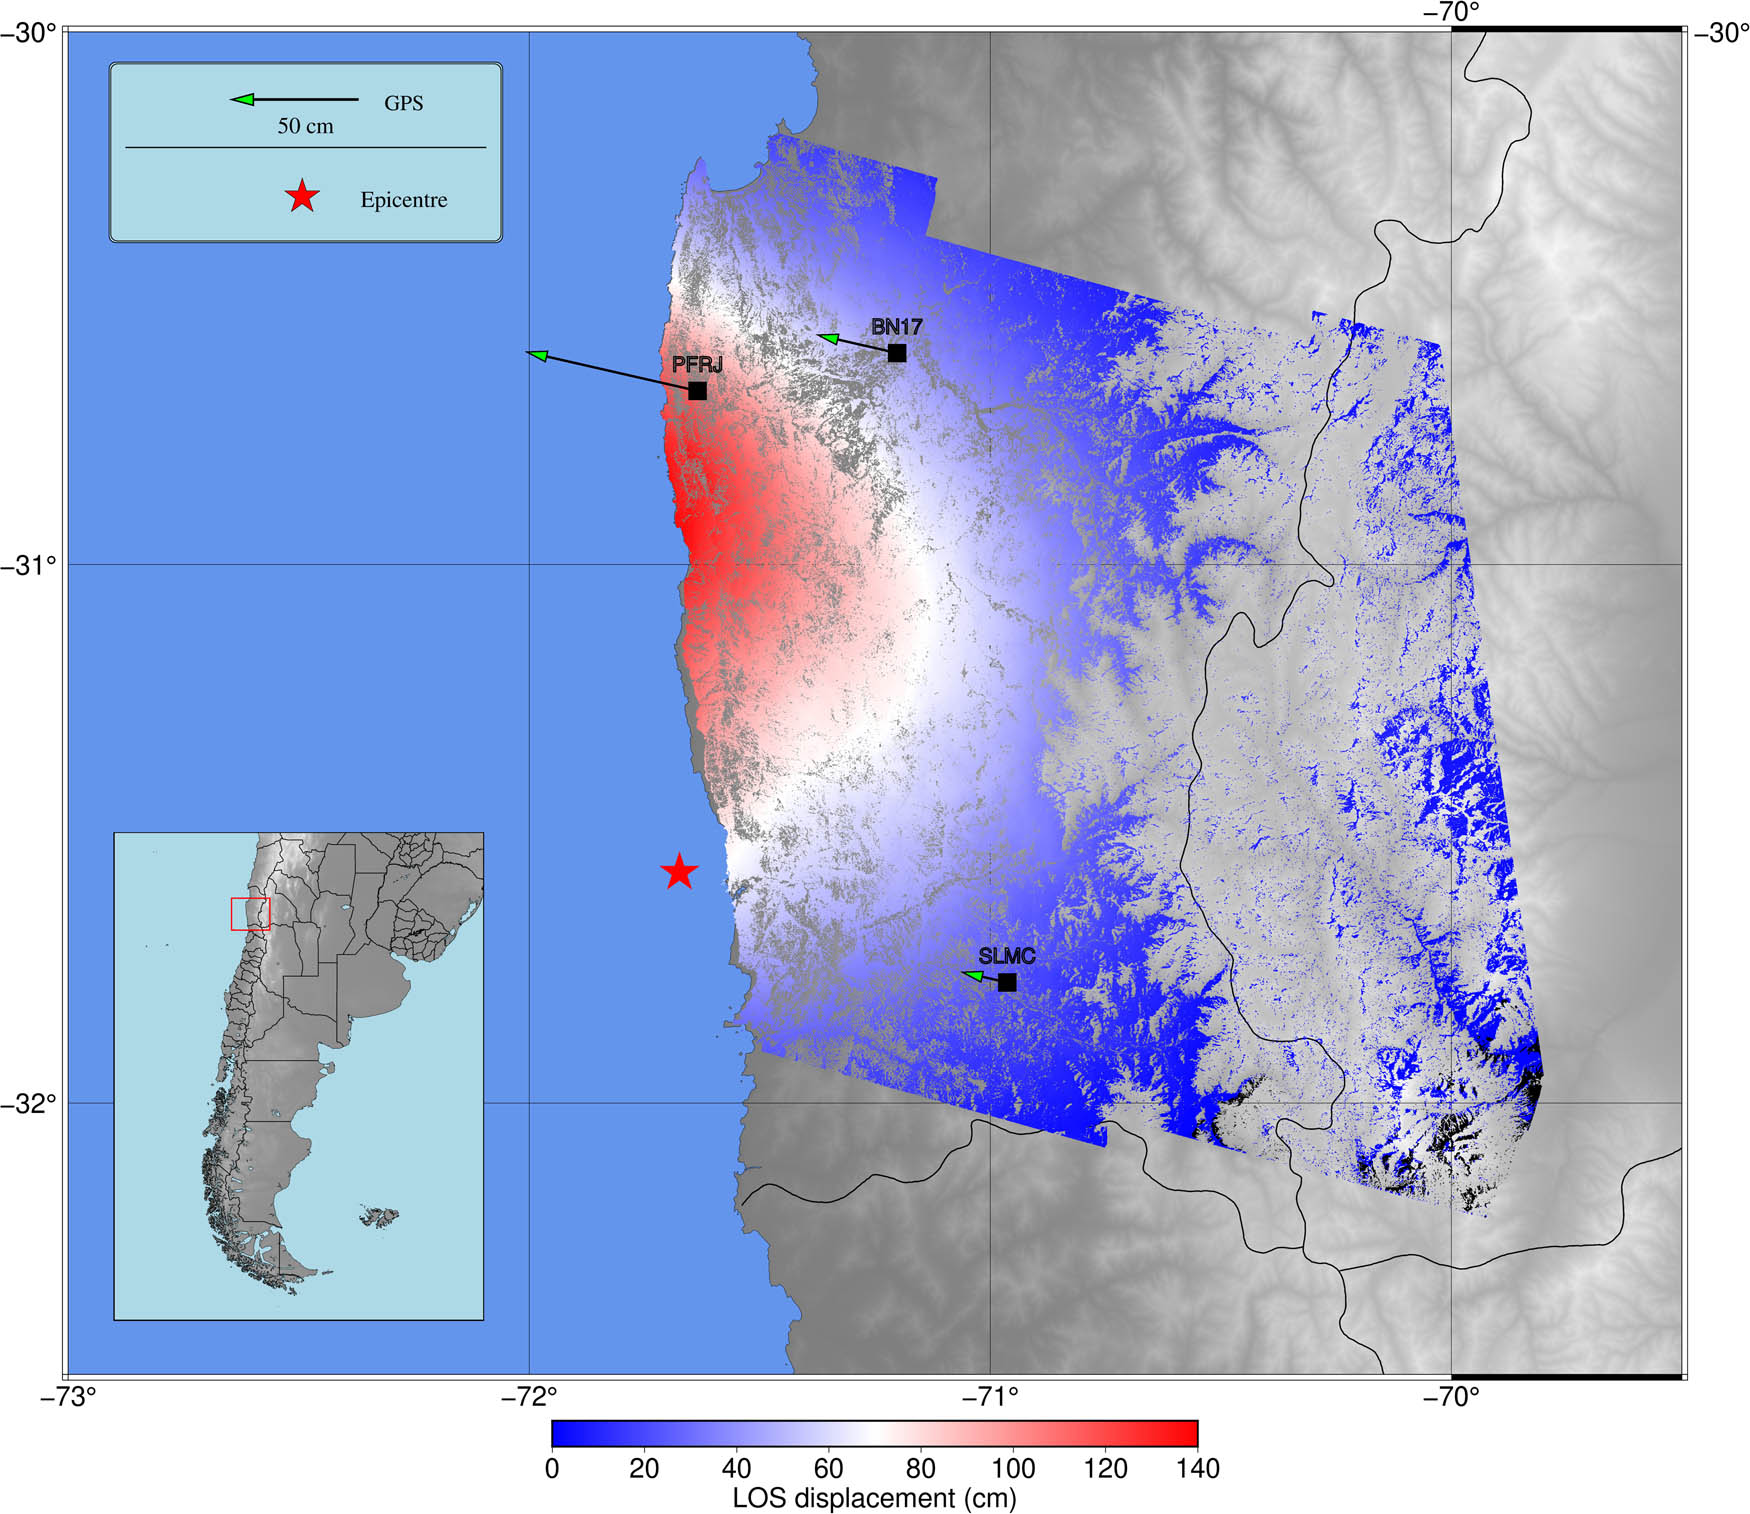
Measured deformation with DinSAR and GNSS in the LOS direction. The arrows show the magnitude of the GNSS displacement projected along the direction of the LOS of the satellite.
According to the United States Geological Survey, the 2015 Illapel earthquake was produced by a sub-horizontal thrust fault, with a 4° north strike (Solaro et al. 2016). Knowing this information beforehand gives us a sense of the deformation that we could expect to find as a result of interferometry. This added to the knowledge about the tectonic frame allows us to venture on the hypothesis that the largest deformation will be in an east–west direction. This hypothesis was confirmed by the GNSS analysis.
We can observe great coherence between the results obtained with DinSAR and GNSS (Figure 8). Moreover, since both techniques are independent from each other, the results acquired with GNSS are a good way to validate the results obtained with the SAR images.
4 Discussion
This work demonstrates the capability of the interferometric processing for the observation and analysis of instant relative surface deformations in the radar LOS direction. The SAR technique provided quick results with high spatial resolution over a wide area, which allowed a comprehensive analysis of the relative surface changes produced by the 2015 Mw 8.3 Illapel earthquake (Chile). On the other hand, GNSS provides absolute coordinates related to a global reference frame, and comparing them for different epochs, before and after the earthquake, we were able to quantify the crustal deformation. As shown in the work of Sánchez and Drewes (2016), a network of GNSS stations is of fundamental importance to estimate regional crustal deformations after strong seismic events. Hence, GNSS is necessary to complement the high spatial resolution estimation provided by the SAR technique.
It is important to remark that both SAR and GNSS are techniques that have been used in the past to study ground surface deformations. This particular study uses both of them and contrasts them bearing in mind that they make use of different principles, methodologies, and equipment to provide information, in this case, about the same phenomenon. They are even affected by different sources of errors. Both have advantages and drawbacks, which make the integration of them, and possibly of other techniques as well, the best approach to give a reasonable description for surface displacements.
Acknowledgements
We thank the National Seismological Centre of Chile and the University of Chile for providing the GNSS observations; we thank the Nevada Geodetic Laboratory for processing the GNSS data; we thank the European Space Agency for providing the Sentinel-1 SAR data; we thank the revisors for improving this work with their reviews and suggestions. Digital Elevation Models were generated from: https://topex.ucsd.edu/gmtsar/; the processing was done with GMTSAR (Sandwell, D., R. Mellors, X. Tong, M. Wei, and P. Wessel (2011)); and figures were generated by Generic Mapping Tools (Wessel and Smith 1998).
-
Funding information: This work was funded by an EVC-CIN Scholarship (Estímulo a las Vocaciones Científicas – Consejo Interuniversitario Nacional – Argentina).
-
Conflict of Interest: Authors state no conflict of interest.
-
Data availability statement: The datasets used in this study are provided by the European Space Agency within the Copernicus Programme and can be downloaded at: https://scihub.copernicus.eu/dhus. The following products were used: S1A_IW_SLC_1SSV_20150824T100452_20150824T100519_007403_00A2FE_3670, S1A_IW_SLC_1SSV_20150917T100453_20150917T100520_007753_00AC77_4371.
References
Ansari, H. 2019. Efficient high-precision time series analysis for synthetic aperture radar interferometry. Cologne, Germany: German Aerospace Center.Search in Google Scholar
Blewitt, G., W. Hammond, and C. Kreemer. 2018. “Harnessing the GPS data explosion for interdisciplinary science.” American Geophysical Union (AGU) 2018, 9.Search in Google Scholar
Chen, C. and H. A. Zebker. 2000. “Network approaches to two-dimensional phase unwrapping: intractability and two new algorithms.” Journal of the Optical Society of America A 17, 401–414.Search in Google Scholar
Costantini, M. A. 1997. “Phase unwrapping method based on network programming.” ERS SAR Interferometry 406, 261.Search in Google Scholar
Goldstein, R., H. Zebker, and C. Werner. 1988. “Satellite radar interferometry: Two-dimensional phase unwrapping.” Radio Science 23, 713–720.Search in Google Scholar
Grandin, R., E. Klein, M. Métois, and C. Vigny. 2016. “Three-dimensional displacement field of the 2015 Mw8.3 Illapel earthquake (Chile) from across- and along-track Sentinel-1 TOPS interferometry.” American Geophysical Union (AGU) 2016, 3.Search in Google Scholar
Hanssen, R. 2001. Radar interferometry: Data interpretation and error analysis. Netherlands: Springer Dordrecht.Search in Google Scholar
Moreira, A., P. Prats-Iraola, M. Younis, G. Krieger, I. Hajnsek, and K. Papathanassiou. 2013. “A tutorial on synthetic aperture radar.” IEEE Trans Geosci Remote Sens 1(1), 6–43. 10.1109/MGRS.2013.2248301.Search in Google Scholar
Sánchez, L. and H. Drewes. 2016. “Crustal deformation and surface kinematics after the 2010 earthquakes in Latin America.” Journal of Geodynamics 102, 1–23.Search in Google Scholar
Sandwell, D., R. Mellors, X. Tong, M. Wei, and P. Wessel. 2011. GMTSAR: An InSAR processing system based on generic mapping tools. UC San Diego: Scripps Institution of Oceanography.Search in Google Scholar
Solaro, G., V. De Novellis, R. Castaldo, C. De Luca, R. Lanari, M. Manunta, and F. Casu. 2016. “Coseismic fault model of Mw 8.3 2015 Illapel Earthquake (Chile) Retrieved from Multi-Orbit Sentinel1-A DInSAR Measurements.” Remote Sensing 8(4), MDPI AG, 323.Search in Google Scholar
Wright, T. J., B. E. Parsons, and Z. Lu. 2004, “Toward mapping surface deformation in three dimensions using InSAR.” Geophysical Research Letters 31, L01607.Search in Google Scholar
© 2023 the author(s), published by De Gruyter
This work is licensed under the Creative Commons Attribution 4.0 International License.
Articles in the same Issue
- Research Articles
- Two adjustments of the second levelling of Finland by using nonconventional weights
- A gap-filling algorithm selection strategy for GRACE and GRACE Follow-On time series based on hydrological signal characteristics of the individual river basins
- On the connection of the Ecuadorian Vertical Datum to the IHRS
- Accurate computation of geoid-quasigeoid separation in mountainous region – A case study in Colorado with full extension to the experimental geoid region
- A detailed quasigeoid model of the Hong Kong territories computed by applying a finite-element method of solving the oblique derivative boundary-value problem
- Metrica – An application for collecting and navigating to geodetic control network points. Part II: Practical verification
- Global Geopotential Models assessment in Ecuador based on geoid heights and geopotential values
- Review Articles
- Local orthometric height based on a combination of GPS-derived ellipsoidal height and geoid model: A review paper
- Some mathematical assumptions for accurate transformation parameters between WGS84 and Nord Sahara geodetic systems
- Book Review
- Physical Geodesy by Martin Vermeer published by Aalto University Press 2020
- Special Issue: 2021 SIRGAS Symposium (Guest Editors: Dr. Maria Virginia Mackern) - Part II
- DinSAR coseismic deformation measurements of the Mw 8.3 Illapel earthquake (Chile)
- Special Issue: Nordic Geodetic Commission – NKG 2022 - Part I
- NKG2020 transformation: An updated transformation between dynamic and static reference frames in the Nordic and Baltic countries
- The three Swedish kings of geodesy – Speech at the NKG General Assembly dinner in 2022
- A first step towards a national realisation of the international height reference system in Sweden with a comparison to RH 2000
- Examining the performance of along-track multi-mission satellite altimetry – A case study for Sentinel-6
- Geodetic advances in Estonia 2018–2022


