Studies on the Parametric Effects of Plasma Arc Welding of 2205 Duplex Stainless Steel
-
 ,
,

Abstract
This research study attempts to create an optimized parametric window by employing Taguchi algorithm for Plasma Arc Welding (PAW) of 2 mm thick 2205 duplex stainless steel. The parameters considered for experimentation and optimization are the welding current, welding speed and pilot arc length respectively. The experimentation involves the parameters variation and subsequently recording the depth of penetration and bead width. Welding current of 60–70 A, welding speed of 250–300 mm/min and pilot arc length of 1–2 mm are the range between which the parameters are varied. Design of experiments is used for the experimental trials. Back propagation neural network, Genetic algorithm and Taguchi techniques are used for predicting the bead width, depth of penetration and validated with experimentally achieved results which were in good agreement. Additionally, micro-structural characterizations are carried out to examine the weld quality. The extrapolation of these optimized parametric values yield enhanced weld strength with cost and time reduction.
Introduction
The weld region involves ferritic solidification creating an epitaxial growth from the parent metal to the boundary of the fusion and the thermal gradient governs the orientation of the growth of dendrites [3, 4]. Moreover, there is insufficient austenite and equilibrium austenite formation due the high cooling rate occurring through the two phases in the weld region. The rate of austenite formation is inversely proportional to the rate of cooling. Generally, weld metals of duplex stainless steels have ferrite contents in the range of about 30–70 % depending on composition and cooling rates. Subsequently, in welding consumables austenitic composition is higher than the parent material leading to an improved mechanical and corrosion properties. Furthermore, phase balance occurs involving the diffusion controlled transformation δ→ δ + γ causing the partitioning of elements between the two phases. As the cooling rate increases, substitution elements (Cr, Ni, Mo etc.) are almost equal in both phases [5] whereas the interstitial elements (N) controlling the reaction are heavily concentrated to the austenite. Therefore, the partitioning of elements in the as-welded condition is always much different than the partitioning in the solutioned conditions [6]. Yurtisik et al. (2013) proposed a novel hybrid technique for duplex steels that collectively deployed the deep penetration characteristics of plasma arc welding in keyhole mode and metal deposition capability of gas metal arc welding. They achieved desired cooling time and good improved weld metal chemistry that aids in reconstructive transformation of austenite in the ferrite phase [7]. Pramanik et al. (2015) analyzed the welding mechanism, phase changes, and governing process parameters for welding techniques for duplex steels for various fusion welding processes. They emphasized that DSS melts during welding for all the processes with varying thermal cycle and maximum heat input. The differential component results in alterations of structural and functional properties of the weld prominently [8]. Shane Fatima et al. (2015) optimized the process parameters of plasma arc welding of SS 304 L and Low carbon steel and observed several contradicting behaviors leading to forecasting with lesser precisions [9]. Schedin et al. (2011) established that duplex grades illustrate lower strength retention in comparison to austenitic grades at higher temperatures [10]. When exposed to extreme or alarming temperatures identical to fire explosions, their absolute strength was in line with austenitic grades.
Literature reports in most cases have eluded the research exhibitions on process parametric effects on the depth of penetration and bead width for plasma arc welding of 2205 DSS expressed with a well-developed analysis tool. The corresponding proportionalities concerning the phase changes expressed by microscopic images are not adequately expressed. Hence, through this research, an attempt is made to address and bridge the research scope prompted through the literature reports. In the present study, experimental investigations are carried out on 2205 DSS of 2 mm thickness by varying the welding current, speed and pilot arc length sequentially based on design of experiments in each trial. Depth of penetration, bead width and the basic metallographic analysis are carried out with the available instrumentation facilities. ANOVA tool is being used to forecast the interdependent parametric relations and ratios and finally employing BPNN and GA algorithms to optimize and create a parametric window. Additionally, the optimized process parameters are utilized for experimentation and establishing the validity.
Materials and methods
Investigations are carried out on plasma arc welding system after preliminary experimentation to understand the influencing parameters associated with the process. The experimental procedure involves a series of bead on plate welding trials to develop and evaluate the knowledge base for PAW of thin duplex stainless steel sheets.
Material for experimentation
The material considered for this study is 2205 duplex stainless steel plate of 2 mm thickness with dimensions of 150×100 mm. This material is being chosen as it finds greater suitability for structural applications in nuclear and power sector plants due to its high resistance to corrosion and creep. Moreover, the weldability feature for this material has been investigated and reported in small scale for plasma arc advanced welding processes. This dimension of the material is preferred in order to suit the holders of the experimental setup deployed for this study. Before bead-on-trials, plates are cleaned with fresh stainless steel wire brush, followed by acetone swabbing to remove the impurities, dirt and sticky/ oily particles impinged on the plates. Bead-on-plate samples (2 mm) are wire cut by electrical discharge machining. The chemical composition of DSS is shown in Table 1.
Chemical composition of Duplex SS 2205 (in wt%).
| Cr | Mo | Ni | N | C | Mn | Si | P | S | V | Ti | Co | Fe |
|---|---|---|---|---|---|---|---|---|---|---|---|---|
| 23.0 | 3.5 | 6.5 | 0.20 | 0.03 | 2 | 1 | 0.03 | 0.02 | 0.06 | 0.004 | 0.01 | Balance |
Experimental welding procedure
The bead-on-plate experimental trials are carried out by deploying plasma arc joining technique with pure argon gas at a flow rate of 5 l/min used as the shield gas. The objective is to identify the implications of welding current, welding speed and the pilot arc length on the bead width and depth of penetration in the weldment. This task is approached through a series of experimental trials conducted on the DSS plates by varying the three process parameters in accordance with design of experiments (DoE). Prior to that, few trials are carried out based on trial and error to identify the range of each parameter between which the optimization is to be carried out in order to improve the performance and weld efficiency. The parameters are varied in the range viz., welding current (60–70A), Welding speed (250–300 m/min) and pilot arc (1–2 mm), respectively for the subsequent trials (refer Table 2).
Process parameters employed for bead on plate welding.
| Parameter | Unit | Factor | Level | ||
|---|---|---|---|---|---|
| 1 | 2 | 3 | |||
| Current | A | A | 60 | 65 | 70 |
| Speed | mm/min. | B | 250 | 275 | 300 |
| Pilot arc | Mm | C | 1 | 1.5 | 2 |
Design of experiments using Taguchi method
Design of experiments based trials are carried out by usage of Taguchi L27 orthogonal array (refer Table 3). Plasma arc welding is carried out by varying the input process parameters namely the welding current, welding speed and pilot arc length respectively set with three levels indicated in Table 2 and the welded samples are presented in Figure 1. The welded samples are sectioned to measure the weld bead geometry and some of the weld macrographs are depicted in Figure 2. Based on the results, a sequential approach as presented in Figure 3 is adopted in this study to perform the parametric optimization.
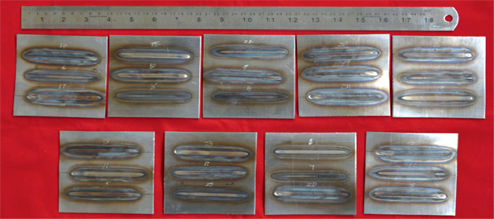
Plasma arc welded bead on plate welding of 2205 duplex stainless steel.

Depth of penetration for bead on plate trials for 2205 duplex stainless steel.
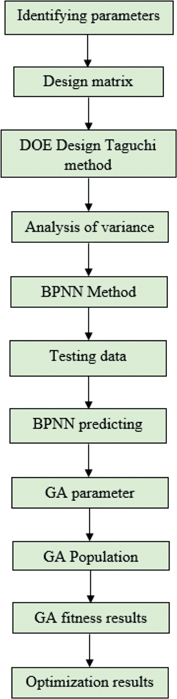
Sequential approach adopted.
Heat input for each of the weld may be estimated from eq. (1).
Taguchi L27 orthogonal array experimental layout.
| Experimental trials | Factor | ||
|---|---|---|---|
| A | B | C | |
| 1 | 1 | 1 | 1 |
| 2 | 1 | 1 | 2 |
| 3 | 1 | 1 | 3 |
| 4 | 1 | 2 | 1 |
| 5 | 1 | 2 | 2 |
| 6 | 1 | 2 | 3 |
| 7 | 1 | 3 | 1 |
| 8 | 1 | 3 | 2 |
| 9 | 1 | 3 | 3 |
| 10 | 2 | 1 | 1 |
| 11 | 2 | 1 | 2 |
| 12 | 2 | 1 | 3 |
| 13 | 2 | 2 | 1 |
| 14 | 2 | 2 | 2 |
| 15 | 2 | 2 | 3 |
| 16 | 2 | 3 | 1 |
| 17 | 2 | 3 | 2 |
| 18 | 2 | 3 | 3 |
| 19 | 3 | 1 | 1 |
| 20 | 3 | 1 | 2 |
| 21 | 3 | 1 | 3 |
| 22 | 3 | 2 | 1 |
| 23 | 3 | 2 | 2 |
| 24 | 3 | 2 | 3 |
| 25 | 3 | 3 | 1 |
| 26 | 3 | 3 | 2 |
| 27 | 3 | 3 | 3 |
where Q is the heat input, I – Current (A), V represents voltage (V) and S is the welding speed (mm/min). In the orthogonal array, three factors (current, welding speed, pilot arc) with three levels are selected as shown in Table 2. By using the S/N ratio (signal-to-noise) which is having three categories such as the higher the better (HB), lower the better (LB) and the nominal the better (NB), the optimum value of parameters for attaining optimum weld conditions is determined using Taguchi method. The optimization criterion is selected in the performance statistics method. The characteristic value is identified by aspect ratio (ASR). Higher the better criterion is given by the S/N ratio eq. (2).
The strategy for conducting the bead-on plate welding trials and the subsequent ANOVA analysis are to study the effect of process parameters on the depth and width of the welding seam. The heat input for each of those trials is estimated using eq. (1) and are collectively recorded in Table 4.
Cumulative experimental data and the corresponding S/N ratio and the heat inputs.
| Trial no | Current, A | Speed, mm/min. | Pilot arc, mm | Depth of penetration, mm | Bead width, mm | S/N (dB) ratio | Heat input, kJ/min |
|---|---|---|---|---|---|---|---|
| 1 | 60 | 250 | 1 | 0.9232 | 1.832 | 5.9525 | 0.2894 |
| 2 | 60 | 250 | 1.5 | 1.3549 | 3.17 | 7.383 | 0.324 |
| 3 | 60 | 250 | 2 | 1.4269 | 3.39 | 7.5161 | 0.3297 |
| 4 | 60 | 275 | 1 | 0.7416 | 1.2665 | 4.6487 | 0.2749 |
| 5 | 60 | 275 | 1.5 | 0.8234 | 1.5209 | 5.3297 | 0.2814 |
| 6 | 60 | 275 | 2 | 1.1832 | 2.641 | 6.966 | 0.3102 |
| 7 | 60 | 300 | 1 | 0.3363 | 0.7132 | 6.5295 | 0.2424 |
| 8 | 60 | 300 | 1.5 | 0.621 | 0.888 | 3.1064 | 0.2652 |
| 9 | 60 | 300 | 2 | 1.0551 | 2.242 | 6.5468 | 0.3 |
| 10 | 65 | 250 | 1 | 1.7897 | 4.54 | 8.0855 | 0.3588 |
| 11 | 65 | 250 | 1.5 | 1.4973 | 3.613 | 7.6511 | 0.3354 |
| 12 | 65 | 250 | 2 | 1.7312 | 4.3544 | 8.0116 | 0.3541 |
| 13 | 65 | 275 | 1 | 0.9392 | 1.881 | 6.0326 | 0.2907 |
| 14 | 65 | 275 | 1.5 | 1.2404 | 2.819 | 7.1306 | 0.3148 |
| 15 | 65 | 275 | 2 | 1.5061 | 3.64 | 7.6649 | 0.3361 |
| 16 | 65 | 300 | 1 | 0.669 | 1.0399 | 3.8313 | 0.2691 |
| 17 | 65 | 300 | 1.5 | 0.8477 | 1.5968 | 5.5001 | 0.2834 |
| 18 | 65 | 300 | 2 | 1.1887 | 2.658 | 6.9896 | 0.3107 |
| 19 | 70 | 250 | 1 | 1.5467 | 3.7689 | 7.7361 | 0.3393 |
| 20 | 70 | 250 | 1.5 | 1.97 | 5.4348 | 8.3775 | 0.3813 |
| 21 | 70 | 250 | 2 | 2 | 5.834 | 8.4803 | 0.3914 |
| 22 | 70 | 275 | 1 | 1.4476 | 3.4557 | 7.5577 | 0.3314 |
| 23 | 70 | 275 | 1.5 | 1.5048 | 3.636 | 7.6629 | 0.336 |
| 24 | 70 | 275 | 2 | 2 | 5.271 | 8.3304 | 0.3772 |
| 25 | 70 | 300 | 1 | 0.8927 | 1.737 | 5.7818 | 0.287 |
| 26 | 70 | 300 | 1.5 | 1.2774 | 2.934 | 7.2226 | 0.3178 |
| 27 | 70 | 300 | 2 | 1.6094 | 3.9688 | 7.8399 | 0.3744 |
| Average | 1.2638 | 2.9573 | 2.2316 | ||||
Welding current shows insignificant influence on the weld bead width. Increase in welding speed between 250 and 300 mm/min decreases the bead width indicating inverse proportionality. It is inferred from the tabulated results that maximum influence is being impacted by pilot arc length. The depth of penetration depends on welding current and welding speed but bead width depend on pilot arc. The maximum heat input obtained from the parameters considered in this study is 0.39144 kJ/mm and the minimum heat input is 0.2424 kJ/mm. Applying the maximum value of the parameter facilitates in achieving a maximum depth of penetration of 2.1976 mm and a bead width of 5.834 mm while maintain minimal process parametric values lead to minimum depth of penetration 0.621 mm and bead width 0.7132 mm is obtained. The depth of penetration is recorded against the welding current, welding speed and arc length for each of the experimental trials conducted based on design of experiments.
In Taguchi design, S/N is defined as the signal-to noise ratio (S/N unit: dB) n is the number of repetition for an experimental combination and Yi is a performance value of the ith experiment. The total mean S/N ratio for aspect ratio is ηm=(total S/N ratio)/(number of experimental runs)=2.21593 dB. By employing depth of penetration and bead width S/N ratio is calculated [S/N]Predicted= 17.73554. The mean S/N ratio for each level of the parameters is calculated and summarized in Table 5. In order to calculate the aspect ratio the average performance of the factor A at level 1 (denoted as A1), the results for 27 trials including factor A1 added and then divided by the number of such trials:
S/N response table.
| Parameter | Notation | Level 1 | Level 2 | Level 3 | Delta (D) maximum | Rank minimum |
|---|---|---|---|---|---|---|
| Current | A | 5.9977 | 6.7664 | 7.6655 | 1.6678 | 2 |
| Speed | B | 7.6882 | 6.8138 | 5.9276 | 1.7606 | 1 |
| Pilot | C | 6.2395 | 6.596 | 7.5939 | 1.3544 | 3 |
To examine the reliability of the methodology, confirmation F and P test has been performed as per the equation given below
n=2 Parameters
Figure 4 shows the effect of input process parameters on depth of penetration (estimated value) at different parameters like current, welding speed and plasma arc length in PAW of duplex stainless steel sheet. From the figure, it can be noticed that:
Welding current effect: Depth of penetration increases with the increase in welding current (most influential parameter) at constant plasma arc length and welding speed.
Welding speed effect: Penetration depth is affected more by welding speed than any variable other than welding current. Depth of penetration decreases with the increase in welding speed at constant plasma arc length and welding current. High welding speed leads to minimum HAZ and finer grains in the weld.
Plasma arc length effect: There is a decrease in depth of penetration and further increase in value when the plasma arc length is operated between 1 mm and 2 mm, at constant welding speed and current.

Effect of welding current, welding speed and pilot arc length on the depth of penetration (Estimated).
For formulating the ANOVA table optimal and effective method is used from the calculated F and P test. The contribution of F test and P test show that the welding current and welding speed is forerunner in contributing to the depth of penetration by S/N ratio calculating method. Further, analysis of variance is done by using DOE software and the result of contribution of each factor by degrees of freedom and F distribution and P distribution factors are listed in Table 6.
ANOVA analysis.
| Source | Seq SS | Adj SS | DF | Adj MS | F | P |
|---|---|---|---|---|---|---|
| Current (A) | 2.0696 | 2.0696 | 2 | 1.0348 | 12.858 | 40.34 |
| Speed (B) | 2.0289 | 2.0289 | 2 | 1.0144 | 12.605 | 45.29 |
| Pilot (C) | 0.0017 | 0.0017 | 2 | 0.0008 | 0.0103 | 13.37 |
| Error | 1.6096 | 1.6096 | 2 | 0.0805 | 1.00 | |
| Total | 5.7097 | 8 | 100 |
The ANOVA analysis clearly indicates that the pilot arc length had major impact on the depth of penetration and bead width while welding current and welding speed had a considerably lesser impact (refer Table 6). This study, however, establishes the direct proportionality prevailing among the process parameters and the bead width and depth of penetration.
Back propagation error method
Back propagation algorithm is a globally popular tool for optimization and parametric analysis [11, 12] and hence it has been extrapolated for welding applications in the present study as well. MATLAB software is used as the platform for executing the BPNN error method. Artificial neural networks being a powerful technique used for nonlinear regression and classification. For the Bead-on-plate plasma arc welding process, the process parameters viz., welding current, welding speed and pilot arc length are incorporated to map the complex and highly interactive process to predict, estimate and evaluate the depth of penetration.
A multilayer feed-forward network BP network based on error-back-propagation supervised learning algorithm is developed capable of revealing nonlinear interpolation. The BP network comprises of the input and output layers. A number of neurons which is obtainable in every layer are attached by the corresponding correlation weight. The BPNN model adopted for this study is shown in Figure 5.

BPNN model used for parameter analysis and optimization.
j=1, 2, 3, … n, k=1, 2, 3, … n
Initially, the notation which refers to weights in the network is established. Wjk denotes the weight for the connection from the kth neuron in the layer to the jth neuron in the hth layer.
v=1, 2, 3, … n, m=1, 2, 3, … n
Wvm denotes the weight for the connection from the mth neuron in the layer to the vth neuron in the lst layer. The task involves maximum number of iterations and the accuracy of the cycle of training with well-defined termination conditions. The parameters used for developing BPNN model is listed in Table 7. In BPNN method by training the ample data the output accuracy is calculated. The experiments are randomly selected as 1, 2, 4, 10, 14, 17, 22, 23 and 25 to test the BPNN model.
BPNN parameters and interlayer details.
| Name | Number | No. | DP | BW |
|---|---|---|---|---|
| Parameter | 50 | 1st | 8 | 8 |
| Maximum parameter. Epochs | 1000 | |||
| Number of input parameter | 3 | 2nd | 7 | 8 |
| Number of output parameter | 1 |
The error percentage is predicted by the BPNN model for bead width and depth of penetration [{Experimental value – Estimated value}/Experimental value]×100 as shown in Tables 8 and 9. It is noticed that BPNN model is used for estimating the weld bead geometric parameters, i e. bead width and depth of penetration could be effectively implemented, with small percentage of error difference between the experimental and estimated results.
From the BPNN error Tables 8 and 9, error value is calculated for depth of penetration and bead width as shown as 2 %, 4 % and 6 % and the maximum average error is around 15 %. The errors in testing experiments may be attributed to experimental error like angle of the plasma torch, process fluctuation and setting of sheet metal in the fixture. It is noted from the table that some abnormal errors like 45.74 % and 25.31 % come out. These abnormal errors owing to flow rate of plasma gas, measurement of weld bead profile and welding environment, have some adverse effect on the testing experiments. Figure 6(a)–(d) reveals the best fitness value for each output parameter predicted by using BPNN model. It is clear from the figures that the best testing performance is made for the present problems, i e. PAW of duplex stainless steel due to its high degree of repeatability and also utilized for interfacing with Genetic Algorithm for optimization.

The best fitness value estimated by BPNN model (a) DOP for 1st trials (b) BW for 1st trials (c) DOP for 2nd trials and (d) BW for 2nd trials.
First bead on plate welding conditions employed for process parameter.
| No | DP (mm) | BW (mm) | ||||
|---|---|---|---|---|---|---|
| EOP | BPOP | ERROR | EOP | BPOP | ERROR | |
| 1 | 0.9232 | 0.8904 | 3.55286 | 1.8320 | 1.5168 | 17.20524 |
| 2 | 1.3549 | 1.3764 | −1.58683 | 3.1700 | 3.3294 | −5.02839 |
| 4 | 0.7416 | 0.737 | 0.62028 | 1.2665 | 1.3013 | −2.74773 |
| 10 | 1.7897 | 1.6633 | 7.062636 | 4.5400 | 4.5634 | −0.51542 |
| 14 | 1.2404 | 1.1426 | 7.884553 | 2.8190 | 2.7390 | 2.837886 |
| 17 | 0.8477 | 1.2355 | −45.7473 | 1.5968 | 2.7445 | −71.875 |
| 22 | 1.4476 | 1.4037 | 3.032606 | 3.4557 | 3.5023 | −1.3485 |
| 23 | 1.5048 | 1.5749 | −4.65843 | 3.6360 | 3.8439 | −5.71782 |
| 25 | 0.8927 | 0.9087 | −1.79232 | 1.7370 | 1.7691 | −1.84801 |
Second bead on plate welding conditions employed for process parameter.
| No | DP (mm) | BW (mm) | ||||
|---|---|---|---|---|---|---|
| EOP | BPOP | ERROR | EOP | BPOP | ERROR | |
| 3 | 1.4269 | 1.3677 | 4.148854 | 3.3900 | 4.2482 | −25.3156 |
| 6 | 1.1832 | 1.1810 | 0.185936 | 2.6410 | 2.1850 | 17.26619 |
| 9 | 1.0551 | 1.0986 | −4.12283 | 2.2420 | 2.2708 | −1.28457 |
| 12 | 1.7312 | 1.7243 | 0.398567 | 4.3544 | 4.4160 | −1.41466 |
| 15 | 1.5061 | 1.5299 | −1.58024 | 3.6400 | 3.4476 | 5.285714 |
| 18 | 1.1887 | 1.1744 | 1.202995 | 2.6580 | 3.7906 | −42.611 |
| 20 | 1.9700 | 1.5427 | 21.69036 | 5.4348 | 4.7217 | 13.121 |
| 24 | 2.0000 | 2.0417 | −2.085 | 5.2710 | 5.3178 | −0.88788 |
| 26 | 1.2774 | 1.3020 | −1.92579 | 2.9340 | 2.9263 | 0.26244 |
Results of BPNN-GA optimization.
| Sl. No. | Input parameters | Output parameters | |||
|---|---|---|---|---|---|
| Current, A | Welding speed, mm/min. | Pilot arc length, mm | Optimal value (mm) | Weld bead geometry | |
| 1. | 57.2 | 245 | 1.3 | 1.1768 | Depth of penetration |
| 2. | 56 | 260 | 1.4 | 2.1903 | Bead width |
Genetic algorithm methodology
A set of computer-based programming and procedures are implemented for executing genetic algorithms for process parameter optimization with respect to concept involved in mechanics of natural selection and genetics [13, 14]. The algorithm functions act over a set of individuals, typically represented by binary string involving 1’s and 0’s. The program facilitates the algorithm to generate on the search space vectors randomly with each element presenting individual solutions. The genetic algorithm considers all the possible solution sets in the pipeline parallel while determination process is under execution. This processing in the parallel pattern eludes the convergence of one particular local extreme point. The other prominent feature of these algorithms the fitness value of each string; where fitness function need not be differentiable and continuous. The PAW welding optimization procedure using genetic algorithm is shown in Figure 3. In this figure, initial population means the possible solutions of the optimization problem, and each possible solution is called an individual. In this study, a suitable solution is generated by values of the welding current, welding speed, and pilot arc length expressed as binary numbers. Conversely, it is imperative to convert it to real numbers when subjected to optimization problem as the experiment sets the welding conditions with real values, instead of binary codes. The generated codes and the solutions obtained are presented in the following section.
Parameter of genetic algorithm
The parameter used for GA Population size=120
Selection operation=roulette method, crossover function=two point operator, crossover fraction=0.470149, Mutation=Gaussian scale=2.11676, shrink=0.722628 and fitness parameter depth of penetration and bead width
Bounce of Welding current
WC L<≤WL≤WLU
Lower and upper bounce of welding current respectively.
Bounce of Welding speed
WSL≤WS≤WSU
Lower and upper bounce of welding speed respectively.
Bounce of Welding pilot arc
WPL≤WP≤WPU
Lower and upper bounce of welding pilot arc, respectively.
The optimization process is continuously checked throughout the generations. The mean fitness and best fitness from generation to generation is monitored and recorded in the form of fitness plot as depicted in Figure 7. From the GA plot, it can be clearly visualized that the fitness value is converging toward the optimal between one generation and the next. Figure 8 shows the vector entries of individuals with the best fitness function value. From the bar chart, it is inferred that the best fitness value is obtained for both welding current and speed. Table 10 shows the optimal results of BPNN-GA optimization of plasma arc weld bead geometry, i e. depth of penetration and bead width and corresponding input process parameters. The quality of a weld joint is strongly influenced by bead geometry size includes bead width and depth of penetration. Actually, the predicted optimal values for depth of penetration and bead width of weld bead geometry are difficult to separately guide plasma arc welding process since bead geometry and the resulting mechanical property are jointly affected by depth of penetration and bead width. Hence, the generated results are used to study the effect of bead geometry on weld quality and even make it possible to be utilized in the actual plasma arc welding process.

Genetic algorithm convergence plot.

Best individual parameter in GA optimization.
Confirmation test
Finally, the confirmation experiments are conducted as shown in Table 11 to demonstrate the application of BPNN-GA model for optimizing the plasma arc welding process by selecting depth of penetration and bead width as the objectives. Based on the tabulated results, it is inferred that the errors of 2.9 % and −1.6 % are noticed between experiment result and predicted value by BPNN-GA model for depth of penetration and bead width, respectively. Hence, the proposed model is observed to be more reliable and effective in the prediction of defect free weld bead geometry of plasma arc welding of duplex stainless steel.
Plasma arc welding process parameters and error of confirmation experiment.
| Input parameters | Output parameters | ||||
|---|---|---|---|---|---|
| Current, A | Welding speed, mm/min. | Pilot arc length, mm | Depth of penetration, mm | Bead width, mm | |
| Experiment | 60 | 275 | 1 | 0.7416 | 1.2665 |
| Predicted by BPNN-GA model | 59.8 | 274 | 1.2 | 0.7201 | 1.2863 |
| Error % | 2.9 | −1.6 | |||
Microscopic analysis
Micro-structural analysis is a key factor while appraising the efficiency, quality and bonding characteristics of a weldment. Microscopic images and the corresponding EDAX results reveal several vital information pertaining to the intermetallic, heat affected zone, grain size, diffusion pattern, cracks, orientations of crack growth etc. However, prior to welding, Vickers micro-hardness measurement mechanism is deployed for recording the hardness values. Micro-hardness was measured at the base metal and the well-defined weld zone. The samples prepared as per AWS 8.0 standards are subjected to 500 g load to understand the extent of resistance against abrasion and scratch. The base metal displayed hardness values in the range of 210–220 HV. Nevertheless, the weld zone and the narrow heat affected zone showed an increase in hardness up to 280–330 HV. The improvement in hardness is attributed to the uniform and optimized heat fed during welding and there is an increase of hardness to about 20 percentages. This is a prominent enhancement while ensuring that the brittleness has been maintained within the secure limits. Figure 9(a) shows that the microstructure at the base metal consists of elongated austenite grains in Ferrite matrix which approximately amounts to 52 % of the fraction. The grains at the weld metal is coarse (columnar grains), and the austenite grains are restructured and grown as Widmanstätten plates (refer Figure 9(b)). The weld metal presents volume fraction of ferrite, measured by Feritscope which recorded 55 % (45 % austenite). The HAZ nearer to the fusion boundary is very thin and presents lower amount of austenite as compared to the weld zone (refer Figure 9(c)). The ferrite content in this zone increases significantly as noticed in the weld zone with approximately 58 % and the results agree well with Aguiar et al. [15]. Further, it is observed that the HAZ fully transforms to ferrite during the process and then the austenite grains are reformed upon cooling to room temperature. The ferrite content is measured in three different zones, i e. weld zone, heat affected zone and base metal using Feritscope is listed in Table 12.

Microstructure of the (a) base metal: austenite is white and ferrite is dark (b) weld metal and (c) HAZ + base metal.
Measurement of Ferrite content in welded 2205 DSS.
| Location | Ferrite % | Average Ferrite % | |||||
|---|---|---|---|---|---|---|---|
| 1 | 2 | 3 | 4 | 5 | 6 | ||
| Weld zone | 54 | 53 | 55 | 56 | 55 | 56 | 55 |
| HAZ | 59 | 56 | 58 | 59 | 57 | 58 | 58 |
| Base metal | 51 | 51 | 52 | 53 | 52 | 53 | 52 |
This is followed by metallographic analysis involving the weld sample scanning using SEM. The images obtained from SEM and the corresponding EDAX (refer Figure 10) have shown uniform and gradual transformations. The pieces joined using PAW method is sectioned in transverse direction of the weld for micro-structural characterization. Various grades of SiC papers are used for polishing using colloidal solutions. Good quality, deep penetration welds are successfully produced in the duplex stainless steel by plasma arc welding (PAW) with keyholes in penetration depths. The pure base material consisted of the ferrite matrix with austenite spray over’s [16]. The weld center illustrated formation of columnar and equiaxed grains at the weld metal structure of PA weldments. Weld center of the fusion zone shoed greater equiaxed structures indicating higher solidification rate which has gradually decreased in the HAZ. The alterations in microstructure may be attributed to the phase transformations occurring due to solidification and subsequent solid state transformations. Maximum thermal gradient and well defined heat flow has led to deeper penetration. The prominent observation apart from the weld integrity is the notable reduction in the volume fraction of the austenite. Contrarily, there is grain grown observed in the HAZ and the fusion line. There are few elemental precipitations as may be observed from the EDAX (refer Figure 10) which an increase in welding heat. The positive facet in these images is the indications of absence of embrittlement causing factors assuring the correctives of the post annealing mechanism. Since, the volume fraction of ferrite has increase drastically, the specimens are susceptible to hydrogen cracking (Images of this study are free from cracks). The SEM image revelations for various zones have been provided in Figures 11 and 12. The images illustrate a configured transformation of allotriomorphic austenite. There is an insignificant deformation in the shape which may govern hydro-static stress. The orientation among the Widmanstätten and allotropic austenite respectively has a disparity in orientations. The precipitations of Mn and Cr rich elements are seen from the different metal matrix in chemical contents as detected from EDX results (refer Figure 10).

EDX analysis results of duplex SS 2205 weld metal at three different locations (a) weld metal (b) Heat affected zone and (c) weld metal.

SEM photograph of PAW of 2205 showing the various zone (a) heat affected zone and (b) weld metal.

SEM photograph of PAW of duplex SS 2205 showing the various zones (a) Widmanstätten austenite and (b) allotriomorphic.
These precipitations are in small scale, though they are undefined by the crystallographic and metallurgical methods. Pre-existing voids, fine precipitations and inclusions are existent with no new impurities or intermetallic formation. This metallic precipitation was deficient at weld metal in the duplex–austenite weldment. Nevertheless, the sigma phases may be of submicron size in order to restrict growth of the micron-sized grains in hot deformation of the duplex stainless steels. This may be attributed to iron content (48.76 wt% – Table 13) at the duplex and austenite parent metals and their HAZs.
Element composition of welded duplex SS 2205.
| Elements (wt%) | 1 | 2 | 3 | 4 | Average |
|---|---|---|---|---|---|
| Iron | 41.99 | 57.26 | 49.96 | 45.84 | 48.76 |
| Chromium | 15.74 | 20.81 | 19.43 | 19.43 | 18.85 |
| Nickel | 4.60 | 6.81 | 7.37 | 5.72 | 6.12 |
| Cobalt | 2.26 | 3.79 | 3.38 | 2.52 | 2.98 |
| Sulfur | 19.55 | 10.65 | 18.20 | 25.15 | 18.18 |
| Silicon | 1.00 | 0.68 | 1.67 | 1.34 | 1.17 |
Conclusions
The objectives of this study are to examine the parametric influences on the bead width and the depth of penetration on plasma arc welded 2205 duplex stainless steel. Experimental investigations and design matrix using ANOVA are followed by predictions and parametric optimization using BPNN. Further, an effective approach of optimizing plasma arc welding process parameters by integrating BPNN and GA algorithm (BPNN-GA model) is made and verified by experiment. Significant observations are listed below:
The average heat input used on bead on plate with minimum of 0.2424 kJ/min and maximum heat input is 0.39144 kJ/mmm.
S/N ratio method in Taguchi algorithm revealed that welding speed, pilot arc have a significant impact of depth of penetration while welding current attributes largely to the bead width. The optimized values for maximum bead width and depth of penetration for the process parameters are 1.7606, 1.6679, and 1.3544 respectively.
BPNN method is used in depth of penetration and bead width and the error was calculated. BPNN appears to yield an error percentage of 2, 3 and 6 respectively indicating its high degree of reliability.
In confirmation test, the errors of 2.9 % and −1.6 % are noticed between confirmation experiment result and predicted value by BPNN-GA model for depth of penetration and bead width, respectively.
Microstructural analysis confirmed an increase in ferrite volume fraction after welding grain boundary austenite while allotriomorphic, Widmanstätten austenite, secondary austenite had the difference forms of austenite.
The generated results are used to study the effect of bead geometry on weld quality and even make it possible to be utilized in the actual plasma arc welding process.
References
[1] T.G. Gooch, Weld. J., 75 (1996) 135s–154s.Search in Google Scholar
[2] S. Ghosal and S. Chaki, Int. J. Adv. Manuf. Technol., 47 (2010) 1149–1157.10.1007/s00170-009-2234-1Search in Google Scholar
[3] Y.W. Park and S. Rhee, Int. J. Adv. Manuf. Technol., 37 (2008) 1014–1021.10.1007/s00170-007-1039-3Search in Google Scholar
[4] S. Mandal, P.V. Sivaprasad, S. Venugopal et al., Appl. Soft Comput., 9 (2009) 237–244.10.1016/j.asoc.2008.03.016Search in Google Scholar
[5] M. Rahmani, A. Eghlimi and M. Shamanian, J. Mater. Eng. Perform., 23 (2014) 3745–3753.10.1007/s11665-014-1136-zSearch in Google Scholar
[6] F. Sarsilmaz and U. Caydas, Int. J. Adv. Manuf. Technol., 43 (2009) 248–255.10.1007/s00170-008-1716-xSearch in Google Scholar
[7] K. Yurtisik, S. Tirkes, I. Dykhn et al., Soldagem E Inspecao, 18 (2013) 207–216.10.1590/S0104-92242013000300003Search in Google Scholar
[8] A. Pramanik, G. Littlefair and A.K. Basak, Mater. Manuf. Process., 30 (2015) 1053–1068.10.1080/10426914.2015.1019126Search in Google Scholar
[9] S. Fatima, M. Khan, S.H.I. Jaffery et al., Proc. Imeche Part L J. Mater. Des. Appl., 230 (2016) 640–653.Search in Google Scholar
[10] E. Schedin, B. Ivarsson, M. Andersson et al., Proceedings of 7th European Stainless Steel Conference: Science and Market, Como, September 21–23, 2011, AIM, Milano, Italy (2011), pp. 29.Search in Google Scholar
[11] A. Ureña, E. Otero, M.V. Utrilla et al., J. Mater. Process. Technol., 182 (2007) 624–631.10.1016/j.jmatprotec.2006.08.030Search in Google Scholar
[12] B. Šimeková, I. Kovaříková and K. Ulrich, Adv. Mater. Res., 664 (2013) 578–583.10.4028/www.scientific.net/AMR.664.578Search in Google Scholar
[13] K. Deb, Optimizations for Engineering Design – Algorithm and Examples, Prentice Hall of India, New Delhi (1996), pp. 30–72.Search in Google Scholar
[14] K. Deb, Multi-Objective Optimization Using Evolutionary Algorithms, John Wiley and Sons Ltd, England (2001), pp. 12–25.Search in Google Scholar
[15] I.V. Aguiar, D.P. Escobar, D.B. Santos et al., Revista Materia, 20 (2015) 212–226.10.1590/S1517-707620150001.0022Search in Google Scholar
[16] J.R. Davis, ASM Specialty Handbook on Stainless Steels, ASM International, USA (1994).Search in Google Scholar
© 2018 Walter de Gruyter GmbH, Berlin/Boston
This article is distributed under the terms of the Creative Commons Attribution Non-Commercial License, which permits unrestricted non-commercial use, distribution, and reproduction in any medium, provided the original work is properly cited.
Articles in the same Issue
- Frontmatter
- Research Articles
- Effect of the Basicity on the Crystallization Behavior of Titanium Bearing Blast Furnace Slag
- Distribution Behavior of B and P during Al-Si Melt Directional Solidification with Open-Ended Crucible
- Effect of CeO2 on TiC Morphology in Ni-Based Composite Coating
- Studies on the Parametric Effects of Plasma Arc Welding of 2205 Duplex Stainless Steel
- Finite Element Analysis of Surface Residual Stress in Functionally Gradient Cemented Carbide Tool
- Effect of Sulfur and Chlorine on Fireside Corrosion Behavior of Inconel 740 H Superalloy
- High-Temperature Creep Behaviour and Positive Effect on Straightening Deformation of Q345c Continuous Casting Slab
- Effects of Rare Earth Lanthanum on the Solidification Structure and Hot Ductility of Fe-43Ni Expansion Alloy
- Influence of Heat Treatment on γ´ Phase and Property of a Directionally Solidified Superalloy
- An Abnormal Increase of Fatigue Life with Dwell Time during Creep-Fatigue Deformation for Directionally Solidified Ni-Based Superalloy DZ445
- Competition between Chemical and Gravity Forces in Binary Alloys