Effect of CeO2 on TiC Morphology in Ni-Based Composite Coating
-
Yangchuan Cai
 and
Yao Chen
and
Yao Chen

Abstract
The TiC/Ni composite coating with different content of CeO2 was fabricated on the Cr12MoV steel by laser cladding. The microstructure of cladding layers with the different content of CeO2 from the bottom to the surface is columnar crystal, cellular crystal, and equiaxed crystal. When the content of CeO2 is 0 %, the cladding layer has a coarse and nonuniform microstructure and TiC particles gathering in the cladding layer, and then the wear resistance was reduced. Appropriate rare-earth elements refined and homogenised the microstructure and enhanced the content of carbides, precipitated TiC particles and original TiC particles were spheroidised and refined, the wear resistance of the cladding layer was improved significantly. Excessive rare-earth elements polluted the grain boundaries and made the excessive burning loss of TiC particles that reduced the wear resistance of the cladding layer.
Introduction
Ceramic metal coating, using laser cladding technology, can greatly improve the performance of the material surface, because that the composite coating has excellent hardness, thermal stability, corrosion resistance, wear resistance, and metallurgical bonding with the matrix [1]. The thermal expansion coefficient, elastic modulus, and coefficient of thermal conductivity between the ceramic and metal matrix are varied greatly due to the melting point of ceramic phase is much higher than the substrate. As a result, the temperature gradient in the molten pool is great under the condition of the same laser irradiation. The defects, such as holes and micro-cracks, existed in the cladding layer via the thermal stress caused by the temperature gradient [2].
Rare earth, as one of the surface active elements, can decrease the surface tension. The amount of the core and crystallisation rate can be increased by reducing the work of nucleation, at last, the microstructure of the cladding layer be refined [3]. Rare earth is easy to react with oxygen, sulphur, silicon, and other elements to generate the stable, low melting point compounds; the microstructure will be purified because the compounds will rise from the liquid phase and form the slag on the surface of the cladding layer. A result shows that the influence of rare earth on the microstructure and mechanical properties of the laser cladding layer is one of the hotspots in laser cladding technology. Kunlin Wang et al. researched the effect of La2O3 on the microstructure and wear resistance of the nickel-based alloy laser cladding layer [4]. Results showed that La2O3 could refine and purify the microstructure, reduce the dilution rate of the cladding layer and the lattice constant of solid solution, increase the micro-hardness and decrease the friction coefficient, the wear resistance was improved. Y. M. Zhang et al. analysed the microstructure of 4wt% CeO2+20wt% WC+ NiCrBSi laser cladding layer via X-ray diffraction (XRD) and transmission electron microscopy (SEM) [5]. The result found that the grain size of the γ-(Fe, Ni) phase before and after adding rare earth in the coating was 3.0 μm and 1.5 μm, respectively, thus, the grain of organisation was refined significantly. The new phase CeNi8Si5 was formed in the composite coating after adding rare earth, and the content of some carbide, such as (CrW)7C3, was enhanced.
To sum up, scholars systematically investigated the effect of rare-earth elements on the metal matrix in the cladding layer, but the effect of rare earth on ceramic metal coating is rarely studied. The influence mechanism of rare earth on the microstructure, phase composition, and properties of the ceramic metal coating is not clear.
Consequently, the CeO2 was selected to add in the TiC/Ni composite powder, cladding a ceramic-metal layer on the surface of Cr12MoV steel. The effect of different content of rare earth on the microstructure, micro-hardness and wear resistance of the TiC/Ni composite coating was studied systematically.
Experimental procedures
Cr12MoV steel scaled 300×200×10 mm in bulk was used as a work piece in the study. The steel was conducted by general annealing (i. e. 850~870°C×3~4 h, cooled to 740~760°C×4~5 h, air cooling) before the test. The nominal chemical composition of Cr12MoV steel is shown in Table 1. The chemical composition of cladding layer powders is shown in Table 2; the ratio of TiC and Ni60 was 1/9, and the micro-hardness of TiC was 3000 kg/mm2. The nominal chemical composition of Ni-based alloy powders is shown in Table 3. The purity of the powder was higher than 99.5 wt%, and the particle size was less than 60 μm. The average particle sizes ranging was 30–40 μm after the mixing operation.
Nominal chemical composition of Cr12MoV steel (wt%).
| C | Mn | Si | Cr | Mo | Ni | Cu | V | Fe |
|---|---|---|---|---|---|---|---|---|
| 1.45–1.70 | ≤0.40 | ≤0.40 | 11.00–12.50 | 0.40–0.60 | ≤0.25 | ≤0.30 | 0.15–0.30 | Bal. |
Chemical composition of cladding layer powders (wt%).
| Group | CeO2 | TiC + Ni60 |
|---|---|---|
| A1 Coating | 0 | 100 |
| A2 Coating | 2 | 98 |
| A3 Coating | 4 | 96 |
| A4 Coating | 6 | 94 |
Nominal chemical composition of Ni-based alloy powders (wt%).
| C | Cr | B | Si | Fe | Ni |
|---|---|---|---|---|---|
| 1.0–0.6 | 17–14 | 4.5–2.5 | 4.5–3 | ≤15 | Bal. |
Figure 1 shows the schematic diagram of the laser cladding. Substrates were grounded with sand paper and then cleaned with alcohol to remove any organic elements. Then, the cladding powders were mixed with alcohol and the concentration of the powders was similar to the cream. Finally, the powders were coated on the surface of the substrate, and the thickness was about 1.2 mm. The JK2003SM type Nd: YAG laser equipment was used to clad the powders on the substrate, the welding parameters are shown in Table 4, 1# parameters were used simple tracks laser, and 2# parameters were used the multi-tracks laser with overlap.

Schematic of laser cladding process.
Welding parameters.
| Group | Laser output power (W) | Laser beam scanning velocity (mm/min) | Laser beam spot diameter (mm) | Number of superimposed tracks | Overlap ratio (%) | Argon flow rate (mL/min) |
|---|---|---|---|---|---|---|
| 1# | 1600 | 180 | 0.8 | – | – | 20 |
| 2# | 1600 | 180 | 0.8 | 9 | 30 | 20 |
After the laser cladding, the cross-section of the cladding layer was studied by the Olympus stereomicroscope, and the microstructure of the composite coating was characterised by the Olympus optical microscope, S4800 scanning electron microscopy (SEM) and JEM-2100F transmission electron microscope (TEM). The phase of the polished coating was identified by a D8 Advance X-ray diffractometer (XRD, 40 kV, 40 mA, Cu Kα radiation, scanning speed was 4°/min), and the OrignPro 8.5 software was used to analyse the data. An Image-Pro Plus image analyser was used to determine the shape and size of TiC within the composite coating and the average size of primary crystallisation. The micro-hardness distribution from the surface of the composite coating to the substrate was measured by an MHV2000 type digital micro-hardness tester with a 100 g load, and 10 s dwell time; the distance between the two points was 0.2 mm.
An MM-200 dry sliding wear tester was used to conduct the wear resistance test. The ring material of the friction pairs was GCr15 with macro-hardness 60 HRC. The outer radius of the wear ring was 50 mm, and the width was 10 mm. The size of test specimens was 25×7×7 mm. The wear load is 49N, the sliding speed is 200r/min, and the sliding time is 120min. Equation (1) was used to calculate the wear volume:
where B is the width of specimens (mm), L is the width of wear track (mm), and R is the outer radius of wear ring (mm). The weight of specimens before and after the test was measured by an analytical balance, and then the weight loss was calculated. After the wear test, the worn surface of the composite coating was studied by an S4800 scanning electron microscopy (SEM).
Results and discussion
Macro-morphology of the cladding layer
Figures 2 and 3 show the surface morphology and cross-section of cladding layers with different content of CeO2 respectively. The surface of composite coatings is smooth and continuous without obvious defects, and the metallurgical bonding between coating and substrate is excellent. The width of the dilution zone, clad height and width are about 0.4 mm, 1 mm and 2 mm respectively. The surface contour lines of cladding layers are all convex curve.

Macro-morphology of the composite coatings: (a) 0 %; (b) 2 %; (c) 4 % and (d) 6 %.

Cross-section of the composite coatings: (a) 0 %; (b) 2 %; (c) 4 % and (d) 6 %.
The surface tension has a close relation with the temperature [6], and the eq. (2) shows the relationship.
where T is the temperature of the system, σ0 is surface enthalpy, S is surface entropy, σ is surface tension. When the system is under constant pressure conditions, eq. (2) translates to eq. (3), as follows.
The value of
Microstructure of the cladding layer
The microstructure of composite coatings is all composed of solid solutions and hard particles via analysing the XRD patterns of composite coatings before wear test, as shown in Figure 4. The phases of the cladding layer, without rare earth, are γ-(Fe, Ni), TiC and a spot of (Cr,Fe)7C3 and Fe3C. The hard particles, including the original ceramic particles and the new particles, distribute on the soft matrix metal could improve the wear resistance of the cladding layers. Some new phases, such as Ce3Ni6Si2 and CeNi3, occurred in the cladding layer when adding different content of CeO2. The d of some peaks (i. e. CeNi3, Ce3Ni6Si2 and TiC) in the four kinds of samples is list in Table 5. The content of rare-earth compounds (i. e. CeNi3, Ce3Ni6Si2) is increasing with the increase of cerium oxide content. However, the content of TiC has the opposite change law compared to the rare-earth compounds.

XRD patterns of the composite coatings before wear test.
d of peaks in the four kinds of samples.
| Phase | CeNi3 | Ce3Ni6Si2 | TiC |
|---|---|---|---|
| A1 Coating | – | – | 0.23526 |
| 0.21587 | |||
| 0.16275 | |||
| A2 Coating | 0.24648 | 0.19715 | 0.23501 |
| 0.18607 | 0.19261 | 0.21495 | |
| 0.12364 | 0.12528 | 0.15869 | |
| A3 Coating | 0.26192 | 0.19740 | 0.23491 |
| 0.18549 | 0.19261 | 0.21466 | |
| 0.12367 | 0.12551 | 0.15853 | |
| A4 Coating | 0.26225 | 0.19790 | 0.23419 |
| 0.18607 | 0.19261 | 0.21456 | |
| 0.12394 | 0.12583 | 0.15854 |
Evolution law of the cladding layers microstructure
Figure 5 shows the microstructure of cladding layers with different content of CeO2. The microstructure of cladding layers has the same evolution law, namely the microstructure from the bottom to the surface is columnar crystal, cellular crystal, and equiaxed crystal respectively. The phenomenon can be explained by the one-dimensional heat conduction model [8].

SEM microstructure of the cladding layers: (a) 0 %; (b) 2 %; (c) 4 % and (d) 6 %.
In the initial stage of molten pool solidification, the temperature gradient between the bottom of the molten pool and matrix is great, and solidification speed (R) tends to zero, so the value of G/R tends to infinity. The coarse columnar crystal will grow along the normal direction of the substrate because the heat dissipation speed at the direction of perpendicular to the substrate is the highest. After the formation of the columnar crystal, the cooling rate dropped significantly for the increase of substrate temperature. The G/R value decreased for the temperature gradient descent and solidification rate (R) increases. So, the bulky cellular crystal will occur at the stage. At the late stage of molten pool solidification, the heat dissipation speed will be reduced with the increase of solid body thickness. The value of G/R becomes smaller for the temperature gradient decreases and solidification speed increases. Furthermore, there exist a large amount of slag and impurities on the surface of the molten pool that makes the increase of nucleation site. As a result, the microstructure in the top of the cladding layer is fine equiaxed crystal.
Table 6 shows the average size of primary crystallisation in the four kinds of samples. The microstructure of the same position in different cladding layers is compared to find that, there exists coarse and nonuniform microstructure without CeO2, as shown in Figure 5(a). The microstructure will become uniform and tiny with the increase of CeO2 content. And the cladding layer achieves the excellent microstructure when the content of CeO2 is 4 %, as shown in Figure 5(c). While the CeO2 content more than the optimal value, the microstructure becomes coarse and nonuniform again, as shown in Figure 5(d). The following two aspects can be used to interpret the above experimental phenomenon:
Average size of primary crystallisation (μm).
| Group | Columnar crystal | Cellular crystal | Equiaxed crystal | |
|---|---|---|---|---|
| Length | Width | |||
| A1 Coating | 27.3 | 7.3 | 15.3 | 12.7 |
| A2 Coating | 20.9 | 6.1 | 9.5 | 7.3 |
| A3 Coating | 19.7 | 5.5 | 6.1 | 4.5 |
| A4 Coating | 22.7 | 6.4 | 11.1 | 9.1 |
(1) The constitutional supercooling tendency in the solidification process will be increased because of rare-earth elements mainly gather on the liquid side of the liquid–solid interface. The formation speed and amount of dendrite crystal at the columnar crystal will be increased. At the same time, rare-earth elements can reduce the melting point of the dendrite crystal that makes the dendrite crystal fusing; the dissociative dendrite crystal could be as the new crystal nucleus that refines the grain in the cladding layer [9]. The interfacial tension was reduced because of the rare-earth elements segregate at the boundaries of dendritic crystal after crystallisation [10]. As a result, the driving force of grain growth is reduced that refine the microstructure of the cladding layer effectively. When the content of the rare-earth elements is more than the optimal value, the rare earth loses the restriction to the grain growth because of grain boundaries are polluted. The microstructure of the cladding layer will become bulky again.
(2) Rare-earth elements can form inter-metallic compounds with other elements in the cladding layer. The tiny inter-metallic compounds can be used as nucleation cores to reduce the nucleation work and improve the nucleation rate, so as to refine the microstructure.
Evolution law of TiC ceramic particles
In the process of rapid laser heating, the solubility of TiC in the molten pool is bigger than Ni-based alloy powders because the TiC powder has higher absorption of laser energy. Therefore, some tiny TiC particles were completely dissolved, and the edge and convex of larger TiC particles also appeared partly dissolved [11]. The sharp corner position in the TiC particles has a higher surface free energy that makes the rare earth segregate on its surface [12], as shown in Figure 6. The rare-earth elements will accelerate the fusion and decomposition of TiC surface because the rare-earth elements could reduce the melting point of the alloy system.
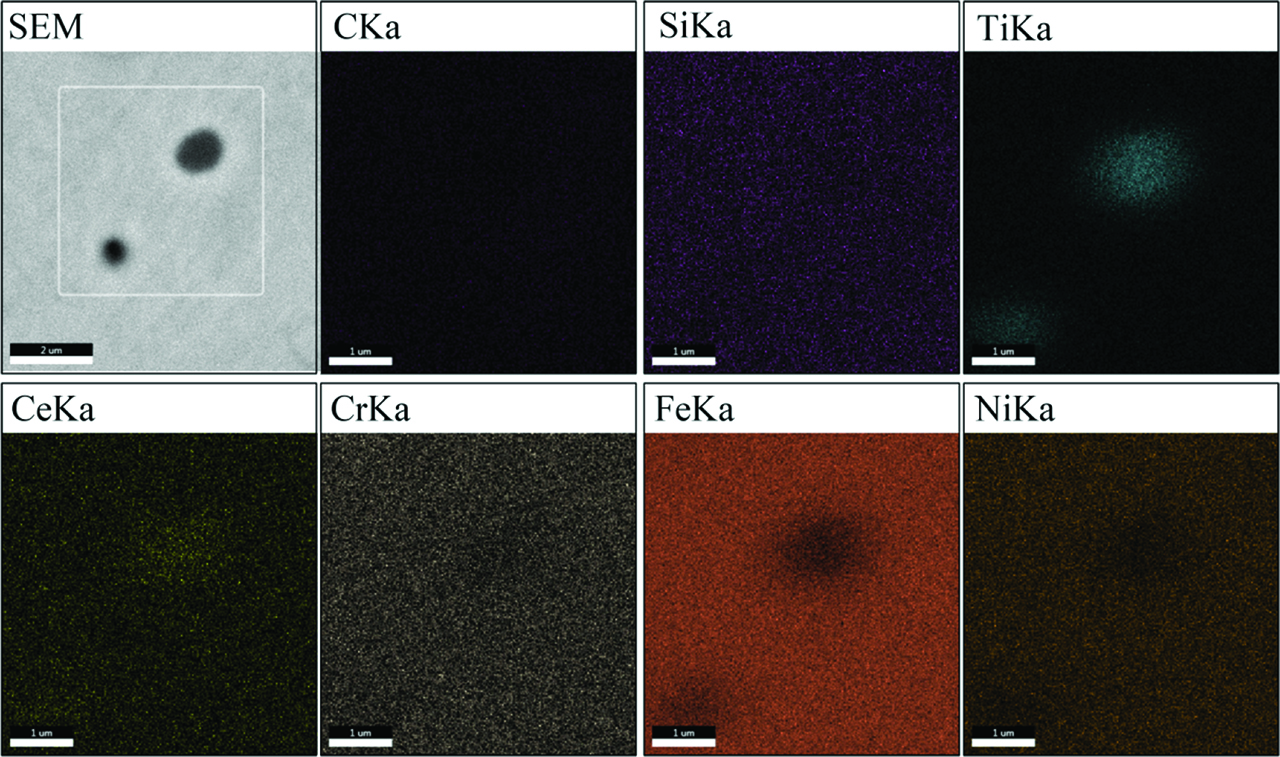
Distribution of elements in the microstructure of A3 cladding layer.
A part of the Ti element and C element in the dissolved TiC ceramic particles will generate new TiC precipitate from γ-(Fe, Ni), as shown in Figure 7. The grain refinement of the rare-earth element makes the precipitated TiC particles have the less size. The new TiC particles have good metallurgy combination with alloy substrate. Figure 6 shows that the Ti element only distributes on the TiC position and its surrounding. Thus, the balance Ti element will generate some Ti-rich compounds with other alloy elements around the original TiC particles, which improved the wettability between the original ceramic particles and metal matrix [13].

(a) TEM micrograph of matrix with reinforce particle; (b) SAED pattern of reinforce particle; (c) SAED pattern of matrix.
The appropriate amount of rare-earth elements not only accelerated the dissolution of the original ceramic particles but also optimised the shape and size of the original and new ceramic particles [14].
The shape factor (Δ) of TiC can be calculated by the eq. (5) [15].
In eq. (5), Δ is the shape factor of TiC, a and b are the maximum length and the minimum width of TiC, respectively.
Table 7 shows the shape factor and size of TiC (i. e. undissolved and new TiC particles). The TiC particles have the larger size and irregular shape without rare earth. The size of TiC particles decrease with the increase of rare earth content, and the shape of particles approach to sphericity. On the one hand, the rare-earth element could accelerate the fusion and decomposition of the sharp corner position in the original TiC particles. On the other hand, the rare-earth element could spherize and refines the new TiC particles that precipitate from the matrix. The content of TiC particles in the four cladding layers is about 9.1 %, 7.9 %, 6.4 % and 3.1 % respectively. The content of TiC particles in the A4 coating is obviously less than other three coatings because the higher rare-earth content will lead to excess fusion of the original TiC particles.
Shape factor and size of TiC.
| Group | Δ (%) | Average size (μm) | ||||
|---|---|---|---|---|---|---|
| 1~1.2 | 1.2~2 | 2~3 | 3~5 | >5 | ||
| A1 Coating | 24.5 | 14.5 | 28 | 25.5 | 7.5 | 4.0 |
| A2 Coating | 40.5 | 26.0 | 11.5 | 16.5 | 6.5 | 2.2 |
| A3 Coating | 54.5 | 23.5 | 14.0 | 3.5 | 2.5 | 1.4 |
| A4 Coating | 65.5 | 20.5 | 11.5 | 2.5 | 0 | 1.0 |
Wear performance
Figure 8 shows the micro-hardness distribution curve from the surface of the cladding layer to the substrate with different CeO2 content. When the content of CeO2 is 0 %, the cladding layer has lower micro-hardness. The micro-hardness will be increased with the increase of CeO2 content, and the micro-hardness achieves the maximum when the content of CeO2 is 4 %. Compared with 4 % content, the micro-hardness decreased when the content of CeO2 is 6 %. Furthermore, the microhardness of the heat affected zone (i. e. 720 MPa-930 MPa) is higher than that of the composite coating (i. e. 220 MPa). Because tempered martensite and network carbide existed in the heat affected zone that increased the microhardness, as shown in Figure 9.

Micro-hardness distribution of the composite coating.

Microstructure of the heat affected zone.
Analysing the wear resistance data of the cladding layer with the different content of rare earth, as shown in Figure 10, find that. The cladding layer adding with rare earth has higher wear resistance than that of without rare earth. The cladding layer with 4 % CeO2 has the optimum wear resistance. The wear resistance will be decreased when the CeO2 content less or higher than the optimal value.

Wear losses of the composite coating.
Figure 11 is the worn surface morphologies of the composite coating with the different CeO2 content. The result shows that, when the content of CeO2 is 0 %, there exist many deep and wide ploughing grooves (PG) and couple with some smooth region (SR) and shedding phenomenon (①) on the worn surface, as shown in Figure 11(a). When the CeO2 content is 2 %, the ploughing grooves on the worn surface become shallow and narrow, and the shedding phenomenon disappeared. When the CeO2 content is 4 %, the shallow and narrow ploughing grooves uniformly distribute on the worn surface. When the CeO2 content is 6 %, the ploughing grooves on the worn surface become deep and wide, and there exist large-area plastic deformation.

Worn surface morphologies of the composite coating: (a) 0 %; (b) 2 %; (c) 4 % and (d) 6 %.
Based on the above experimental data find that the wear resistance of the cladding layer has a close relation with the microstructure and the shape, size and distribution of TiC ceramic particles.
The cladding layer has coarse and nonuniform microstructure when the content of CeO2 is 0 %. TiC ceramic particles have the larger size for it easy to reunite in the laser cladding process. The wettability between hard phase and matrix alloy will be reduced that make the metallurgical bonding force decrease. Therefore, the plough in the microstructure of the worn surface is a deep and wide couple with some shedding phenomenon, as shown in Figure 11(a). The cladding layer has the lowest wear resistance among the four specimens.
After adding appropriate CeO2 (4 %), some rare-earth compounds (Ce3Ni6Si2, CeNi3) can be formed in the laser cladding process that has lubrication during the wear test. The formation and precipitation of carbides also can be promoted; the plough and adhesion effect will be reduced via improving the hardness of the cladding layer. A large amount of tiny TiC particles precipitate in the alloy matrix and dispersively distribute in the cladding layer, the metallurgical combination force between precipitated particles and metal substrate will be increased. Besides, the unfused TiC ceramic particles will be spheroidised and refined. As a result, the wear resistance of the cladding layer is improved significantly; the plough in the worn surface is shallow and narrow without the shedding phenomenon occurs, as shown in Figure 11(c).
As the content of CeO2 is 6 %, the microstructure of the cladding layer will grow up again and become coarse and nonuniform for the pollution of grain boundary. The excessive rare-earth elements will aggravate the decomposition of TiC particles. As a result, the hardness and the wear resistance of the cladding layer will be decreased because of a large amount of TiC particles are burned loss. Therefore, the cladding layer will occur severe plastic deformation during the wear test, and the plough is deep and wide, as shown in Figure 11(d).
Conclusions
The TiC/Ni composite coating was successfully fabricated by laser cladding. The metallurgical combination between the composite coating and the substrate is good.
The main phases in the cladding layer are γ-(Fe,Ni), TiC, (Cr,Fe)7C3 and Fe3C without rare earth. After adding CeO2, some new phases occur in the cladding layer, such as Ce3Ni6Si2 and CeNi3.
The microstructure of the cladding layer with the different content of CeO2 from the bottom to the surface is columnar crystal, cellular crystal and equiaxed crystal.
The cladding layer has coarse and nonuniform microstructure when the content of CeO2 is 0 %, and the wear resistance is lower. Appropriate rare-earth elements could refine and homogenise the microstructure and enhance the content of carbides, and rare-earth compounds have the lubrication in the wear test. Consequently, the wear resistance will be improved significantly. The excessive rare-earth elements can pollute the grain boundaries; the wear resistance will be decreased for the microstructure of the cladding layer become coarse and nonuniform.
TiC particles will gather in the cladding layer without rare-earth elements that will decrease the metallurgical combination with the matrix, and then the wear resistance will be reduced. Appropriate rare-earth element could spheroidise and refine the precipitated TiC particles, and original TiC particles, the metallurgical combination of ceramic reinforced phase and matrix will be increased. Therefore, the wear resistance of the cladding layer was enhanced significantly. The excessive rare-earth elements can make the excessive burning loss of TiC particles that reduced the wear resistance of the cladding layer.
Funding statement: This research is supported by National Nature Science Foundation of China (Grant 51275342 and 51405334).
References
[1] H.C. Man, S. Zhang, F.T. Cheng and T.M. Yue, Scripta. Mater., 44 (2001) 2801–2807.10.1016/S1359-6462(01)00977-0Search in Google Scholar
[2] M.R. Fernandez, A. Garcia, J.M. Cuetos, R. Gonzalez, A. Noriega and M. Cadenas, Wear., 324 (2014) 80–89.Search in Google Scholar
[3] W. Yi, C.Q. Zheng, P. Fan, S.H. Cheng, W. Li and G.F. Ying, J. Alloy. Compd., 311 (2000) 65–68.10.1016/S0925-8388(00)00863-XSearch in Google Scholar
[4] K.L. Wang, Q.B. Zhang, X.G. Wei and Y.M. Zhu, J. Mater. Sci., 33 (1998) 3573–3577.10.1023/A:1004695010456Search in Google Scholar
[5] Y.M. Zhang, M. Hida, H. Hashimoto, Z.P. Luo and S.X. Wang, J. Mater. Sci., 35 (2000) 5389–5400.10.1023/A:1004807214957Search in Google Scholar
[6] E. Siewert, J. Schein and G. Forster, J. Phys. D. Appl. Phys., 46 (2013) SI.10.1088/0022-3727/46/22/224008Search in Google Scholar
[7] Y.P. Kathuria, Surf. Coat. Tech., 132 (2000) 262–269.10.1016/S0257-8972(00)00735-0Search in Google Scholar
[8] H. Tan, Z. Luo, Y. Li, F. Yan, R. Duan and Y. Huang, Wear., 324 (2015) 36–44.10.1016/j.wear.2014.11.023Search in Google Scholar
[9] R.D. Zhu, Z.Y. Li, X.X. Li and Q. Sun, Appl. Surf. Sci., 353 (2015) 405–413.10.1016/j.apsusc.2015.06.071Search in Google Scholar
[10] M. Zheng, A. Fang, Q.B. Liu, D. Fan and J.B. Zhang, Rare. Metal. Mat. Eng., 44 (2015) 2817–2820.Search in Google Scholar
[11] R.L. Sun, J.F. Mao and D.Z. Yang, Surf. Coat. Tech., 155 (2002) 203–207.10.1016/S0257-8972(02)00006-3Search in Google Scholar
[12] P. Farahmand, T. Frosell, M. McGregor and R. Kovacevic, Int. J. Adv. Manuf. Tech., 79 (2015) 1607–1621.10.1007/s00170-015-6936-2Search in Google Scholar
[13] F. Weng, H.J. Yu, C.Z. Chen, J.L. Liu and L.J. Zhao, J. Alloy. Compd., 650 (2015) 178–184.10.1016/j.jallcom.2015.07.295Search in Google Scholar
[14] J. Li, X. Luo and G.J. Li, Wear., 310 (2014) 72–82.10.1016/j.wear.2013.12.019Search in Google Scholar
[15] Y.C. Cai, R.P. Liu, Y.H. Wei and Z.G. Cheng, Mater. Design., 62 (2014) 83–90.10.1016/j.matdes.2014.02.057Search in Google Scholar
© 2018 Walter de Gruyter GmbH, Berlin/Boston
This article is distributed under the terms of the Creative Commons Attribution Non-Commercial License, which permits unrestricted non-commercial use, distribution, and reproduction in any medium, provided the original work is properly cited.
Articles in the same Issue
- Frontmatter
- Research Articles
- Effect of the Basicity on the Crystallization Behavior of Titanium Bearing Blast Furnace Slag
- Distribution Behavior of B and P during Al-Si Melt Directional Solidification with Open-Ended Crucible
- Effect of CeO2 on TiC Morphology in Ni-Based Composite Coating
- Studies on the Parametric Effects of Plasma Arc Welding of 2205 Duplex Stainless Steel
- Finite Element Analysis of Surface Residual Stress in Functionally Gradient Cemented Carbide Tool
- Effect of Sulfur and Chlorine on Fireside Corrosion Behavior of Inconel 740 H Superalloy
- High-Temperature Creep Behaviour and Positive Effect on Straightening Deformation of Q345c Continuous Casting Slab
- Effects of Rare Earth Lanthanum on the Solidification Structure and Hot Ductility of Fe-43Ni Expansion Alloy
- Influence of Heat Treatment on γ´ Phase and Property of a Directionally Solidified Superalloy
- An Abnormal Increase of Fatigue Life with Dwell Time during Creep-Fatigue Deformation for Directionally Solidified Ni-Based Superalloy DZ445
- Competition between Chemical and Gravity Forces in Binary Alloys