Effect of Ultrasonic Treatment on Solidification Quality of ESR Ingots
-
Xiaofang Shi
 ,
Lizhong Chang
,
Lizhong Chang

Abstract
A novel electroslag furnace with the ultrasonic treatment was fabricated in this study. The effect of ultrasonic treatment on the compact density and segregation degree of alloys were studied. Results show that the distribution of carbon, silicon, manganese, chromium and phosphorus become uniform with increase of the ultrasonic power when the ultrasonic power is between 0 and 700 W. But when the ultrasonic power increases to 1,000 W, segregation of alloy elements increases instead. The reasonable ultrasonic power is favorable for improvement of compact density of electroslag remelting (ESR) ingots. When the ultrasonic power increases to 700 W from 0, compact density of ESR ingots increases to 0.9618 from 0.9479 and decreases to 0.9517 when the ultrasonic power increases to 1,000 W. This occurrence is attributed to the cavitation and acoustic flows effect of the ultrasonic which break off the dendritic crystal in the mushy zone and increase crystal nucleus. At the same time, the heat transfer and mass transfer are accelerated which make the distribution of temperature and alloying element more homogeneous. But the excessive ultrasonic power is not conducive to the improvement of solidification structure.
Introduction
At present, the yield and quality of conventional steel in China have reached a higher level. But in the field of the high value-added special steel, there is a big gap between China and foreign countries. One of the important reasons is the solidification quality such as coarse grains and inhomogeneous element distribution. In order to improve the solidification structure of special steel, the electroslag remelting (ESR) technology is often adopted. By integrating refining and solidification, ESR can efficiently improve the solidification structure and remove the nonmetallic inclusions in steel.
But there is a prerequisite for obtaining the excellent solidification quality during the ESR process. The solidification structure of electroslag ingots is closely related to the depth of the metal pool. In an ideal case, the metal pool keeps a shallow shape during the ESR process. An extremely deep pool will result in shrinkage cavity, porosity and other solidification defects, which will decrease the uniformity of the alloying element in the steel. However, keeping a shallow metal pool during the ESR process is difficult. For example, along with the remelting, the heat conduction conditions of ESR ingots would deteriorate and the metal pool would gradually deepen. Thus, the remelting rate must be decreased. This approach is especially applicable for large ingots with extremely poor heat conduction conditions. Low power and low remelting speed are necessary to obtain a shallow metal pool. However, any decrease in remelting speed also bright about a series of problems, such as increased power consumption and poor surface quality. Therefore, producing electroslag ingots with good solidification quality at low cost (or with unchanged technological parameters) has been a challenge in electroslag production.
In recent years, the use of ultrasonic vibration during solidification has attracted considerable attention due to significant microstructure refinement for both metallic and non-metallic materials in addition to other benefits such as degassing [1–7]. Ultrasonic usually refers to high-frequency (20 kHz) sound waves. When the ultrasonic intensity is low, it can be used as carrier and media detecting information which is known as detection ultrasound, such as ultrasonic flaw detection. When the ultrasonic intensity exceeds a certain value, it can interact with sound propagating medium, alter or damage the state, properties and structure of sound propagating medium which is known as power ultrasound.
Ma Qian et al. [8] studied the ultrasonic refinement of magnesium by immersing the titanium sonotrode to pure magnesium melt. The result showed that the columnar grains existed in the magnesium ingot before ultrasonication and a lot of equiaxed grains appeared after ultrasonic treatment. Zhongtao Zhang et al. [9] studied the microstructure evolution of A356 alloy under combination of power ultrasonic field and rotating electromagnetic field by immersing the sonotrode to melt too. The result showed that both the primary aluminum and eutectic silicon were significantly refined, the dendrite of primary aluminum became spherical and the plate-like eutectic silicon turned into rod-like during the solidification process under compound field. Y.L. Li, A. Das, Xinbao Liu, Songli Zhang, Yanfeng Han, etc. found the microstructure could be refined and the segregation of element could be improved with ultrasonic treatment too [10–14].
The above studies show that applying ultrasonic could improve the solidification structure of ingot. But these studies are mainly aimed at the light metal, and there are a few studies for the ferrous metal. One of the main difficulties during the application of ultrasonic in iron and steel materials is how to introduce the ultrasonic to melt. Because of low melting point, it is easy to find some high temperature materials which can immerse directly into the melt during ultrasonic treatment process of light metals. But the operating temperature of liquid steel is more than 1,600°C which makes it difficult to find the suitable waveguide materials. Li Jie et al. [15] found that the alundum rod, molybdenum rod coated with zirconia and tungsten alloy are all not suitable as the waveguide materials. These materials are susceptible to break off or corrosion in molten steel. The metal ceramic rod seems to be more appropriate, but could not last much longer which hinder the application of ultrasonic in iron and steel materials.
By comparison, there is not the obstacle of the waveguide materials if applying the ultrasonic during the ESR process. Metal consumable electrode can be used as the waveguide material and introduce the ultrasonic into solidifying steel. Based on the above reasons, by integrating the advantages of ESR and the ultrasonic, a new electroslag furnace with ultrasonic vibration was designed and the effects of ultrasonic on element segregation and compact density of ESR ingot were studied.
Experimental
Experimental materials
Material used in this research was GCr15 bearing steel and its composition was as follows (wt%): C: 0.96–1.0, Mn: 0.35–0.4, Si: 0.2–0.3, Cr: 1.4–1.5. The slag used was 30% Al2O3 + 70% CaF2 and the arcing agent was composed of 50% CaF2 and 50% TiO2.
Experimental equipment and analytical instrument
Figure 1 shows the electroslag furnace with ultrasonic vibration.
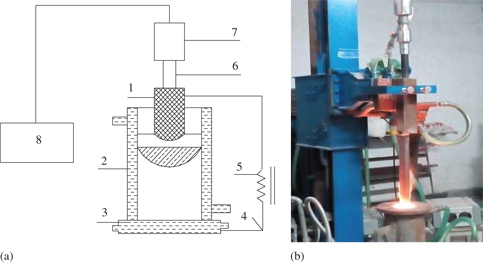
Electroslag furnace with ultrasonic vibration. (a) Schematic diagram of the experimental apparatus. (b) View of hot experiment.
As shown in Figure 1, the technical parameters of the electroslag furnace were as follows: a 5–10 kg ingot can be refined in a water-cooled mold, which has an 85 mm bottom diameter, an 80 mm top diameter and a 40 mm electrode diameter. A 100 kVA ac supply is available for ESR ingot production, with a high-voltage terminal of 380 V, a low-voltage terminal ranging from 28 to 40 V and a maximum current of 2,500 A. Based on pre-established electrical parameters, the consumable electrode can be driven up and down at a certain speed. The speed is controlled manually. An ultrasonic generator converts AC voltage of 50 Hz to high-frequency voltage which is transmitted to the transducer, where it transforms into mechanical vibration introduced to the solidifying steel through metal consumable electrode. The waveguide bar and consumable electrode was connected by welding.
The analytical instrument is the original position analysis (OPA) apparatus (NCS Testing Technology Co., Ltd.). OPA can serve various functions, such as segregation, quantity and distribution of inclusion, as well as porosity and chemical composition of steel ingot and is widely used in the metallurgical industry because of its simple sample preparation, accurate quantization, and high-speed analysis compared with conventional analytical methods [16–17]. The following technical parameters is used for OPA: (1) discharge parameters (continuous excitation system): frequency, 500 HZ; inductance, 120 H; capacitance, 5 F; voltage, 400 V; (2) spectrophotometric system: focal length, 750 mm; spectrum range, 120 nm to 800 nm; distinguish ability surpass, 0.01 nm; (3) sample size: length 500 mm×width 245 mm and (4) load bearing: 20 kg.
Experimental scheme and process
The experimental schemes employed in this study were shown in Table 1.
Experimental schemes.
| Schemes | Ultrasonic power/W | Steel | Ultrasonic Mode | Applying time/µs | Interval time/ms | Frequency/kHz | Electrical parameters | |
| Current/A | Voltage/V | |||||||
| 1 | 0 | GCr15 | Pulse | 8,000 | 2 | 21 | 1,500 | 34 |
| 2 | 400 | GCr15 | Pulse | 8,000 | 2 | 21 | 1,500 | 34 |
| 3 | 700 | GCr15 | Pulse | 8,000 | 2 | 21 | 1,500 | 34 |
| 4 | 1,000 | GCr15 | Pulse | 8,000 | 2 | 21 | 1,500 | 34 |
The experimental procedure was as follows.
ESR. Remelting was carried out by a single-phase ESR furnace with the ultrasonic vibration. The diameter of metal consumable electrode was 40 mm and the filling ratio was 0.5. The remelting process began with a solid slag that weights 0.8 kg. The arc voltage was 31 V and the current was 1,000 A, and the normal melting voltage was 34 V and the current was 1,500 A. The pressure of cooling water was between 0.2 and 0.3 MPa. The scale of the electrode surface was removed by grinding prior to ESR. No deoxidizer was added to the slag bath during the ESR process.
Sample preparation. The finished ingots were horizontally split from the middle and subsequently polished for use.
Sample analysis. The sample was scanned by OPA and the distribution of chemical elements and compact density of the ingot were observed. The line-by-line scan mode was adopted during sample scanning. The X-axis was the continuous scan, and the scan speed was 80 mm/min. The Y-axis was the stepping scan, and the stepping spacing was 2 mm. The argon gas pressure was 0.3 MPa and flow rate was 9 L/min. The in situ scanogram spot of the cross section of the ESR ingot was shown in Figure 2.
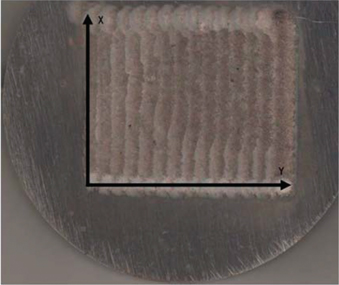
In situ scanogram spot of the cross section of the ESR ingot.
Experimental results
Effects of the ultrasonic treatment on element segregation during ESR process
The relation between the intensity ratio of the single discharge of the elements derived from each spot and the contents of elements at the corresponding position can be given by Wang [18]
where
Figure 3 shows a two-dimensional contour diagram of carbon distribution in the ESR ingots treated by the different ultrasonic power, where the horizontal coordinate represented the X direction and the longitudinal coordinate represented the Y direction (seen in Figure 2). Different colors represented the carbon contents in the ESR ingot. Maximum carbon content was indicated in red and minimum carbon content was indicated in blue. A large variation in colors indicated increased element segregation and vice versa.
The carbon distribution at the cross section of ingot was heterogeneous when the ultrasonic power was zero during ESR process, and especially the carbon at the center of ingot was higher. When the ultrasonic power increased to 400 W, the carbon distribution was dispersed, but the effect was not very obvious. When the ultrasonic power increased to 700 W, the carbon content became more uniform. However, an increased heterogeneity of carbon distribution was observed when the ultrasonic power increased to 1,000 W.
Effects of ultrasonic power on carbon segregation.
To further analyze carbon segregation, carbon statistical segregation and homogeneity were adopted.
Carbon statistical segregation was calculated according to the formula below:
where C0 represents the average carbon content, C represents the carbon contents at different positions, N represents the all-collected spot number,
Carbon statistical homogeneity referred to the ratio of element within certain scope. Greater statistical homogeneity indicated that carbon distribution are more homogeneous. Carbon statistical homogeneity was calculated according to the formula below:
where C0 represents the average carbon content,
The statistical segregation and homogeneity of carbon, silicon, manganese, chromium and phosphorus were shown in Figure 4.
Relation between the segregation, homogeneity and ultrasonic power.
It could be seen from Figure 4 that when no ultrasonic was introduced during the ESR process of GCr15, the statistical segregation and homogeneity of carbon are, respectively, 0.0551 and 0.9329. With increase of the ultrasonic power, the statistical segregation gradually decreased and the homogeneity increased. When the ultrasonic power was 700 W, the statistical segregation and homogeneity of carbon were respectively 0.0409 and 0.9393. When the ultrasonic power increased to 1,000 W, the statistical segregation increased and the homogeneity decreased instead. The distribution of silicon, manganese, chromium and phosphorus had followed a similar trend. This meant that ultrasonic power should have a reasonable range, and element distribution would improve within this range. On the contrary, the solidification structure of steel would deteriorate.
Effects of the ultrasonic treatment on the compact density of electroslag ingots
According to the original position statistic distribution analysis, the content of every element at the position of spark spectrometric single discharge could be obtained. When the spark spectrometric single discharge occurred in the compact position of ingot, the sum of content of all elements should be 100%. If spark spectrometric occurred in the porosity or defective position, the sum of content of all elements should be less than 100%. So the content of all elements at different position of spark spectrometric single discharge could be used to indicate the compact density of different positions which is calculated as follows:
where
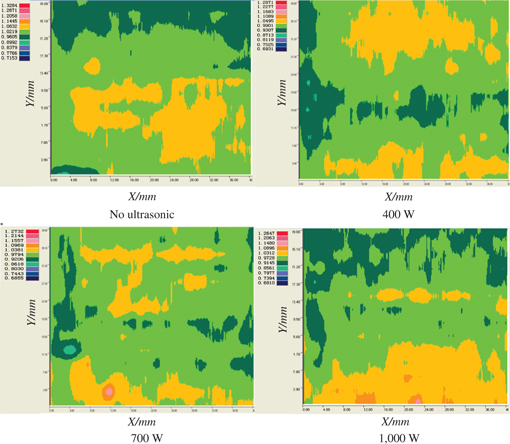
Based on the above principle, the effects of ultrasonic power on the compact density distribution of the ESR ingot were shown in Figure 5. In the two-dimensional contour diagram of compact density, different colors represent the variation in compact density, with a maximum of 1 and a minimum of 0. A higher compact density was desired. The maximum compact density for the electroslag ingot was indicated in red, whereas the minimum compact density was indicated in violet blue. The less variation in color difference was indicative of a more uniform compact density distribution.
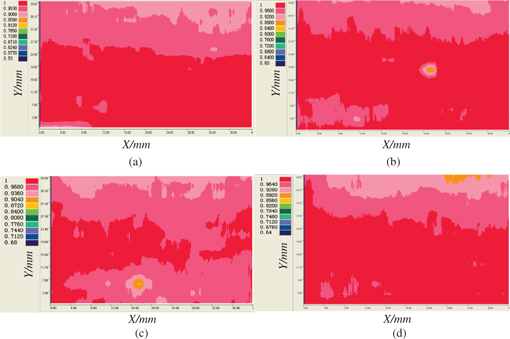
Effects of ultrasonic power on the compact density of ingot. (a) No ultrasonic; (b) 400 W; (c) 700 W and (d) 1,000 W.
Figure 5 shows that the distribution of the compact density was heterogeneous when there is no ultrasonic vibration, where the lower part of Figure 5(a) was compact while the compact density of the upper part was lower. When the ultrasonic power increased to 400 and 700 W, the distribution of the compact density became more homogeneous. But when the ultrasonic power further increased to 1,000 W, the distribution of the compact density was similar with no ultrasonic vibration.
Taking the average value of the compact density of different positions in the cross section of the ESR ingot, namely statistical compact density which is calculated as follows:
where D represents the statistical compact density,
According to Formula (5), the statistical compact density was calculated and the relation between the statistical compact density and ultrasonic power was shown in Figure 6.

Relation between compact density and ultrasonic power.
It could be seen from Figure 6 that ESR ingot became more compact when the ultrasonic power increased to 700 W from 0. But the statistical compact density of the electroslag ingot would decrease when the ultrasonic power increased to 1,000 W.
Discussion
Experimental results shown in Figure 3–6 indicated that the ultrasonic treatment influenced the solidification microstructure of ESR ingot. The beneficial results of ultrasonic vibration on the solidification are mainly due to its cavitation and acoustic streaming effect. It is well known that the equiaxed grain zone in the ingot would be enlarged and the distribution of elements would be more homogeneous if the vibration or stirring is inducted to the liquid steel and the main reasons are as follows.
(1) Viscosity shearing and washing due to the vibration or stirring can break off the grown dendrite and the fine grains can form. (2) The vibration causes temperature fluctuation of the molten steel around the dendrite which is beneficial to dissolution of the dendrite and emergence of new nucleus. (3) Movement of liquid metal increases its degree of supercooling and is conducive to the formation of new nucleus. (4) Compared with static conditions, the vibration or stirring restrains dendrite growth and the solidification microstructure is refined.
For ultrasonic vibration, the mechanism improving solidification quality is generally considered as follows [19]:
Acoustic cavitation effect. Among the physical effects accompanying the propagation of high power ultrasonic oscillations in melts, cavitation, or the formation of cavities filled mainly with gases dissolved in liquid metal, seems to be the most important. Formed by the tensile stresses characteristic of the half-period of rarefaction, these cavities continue to grow by inertia until they collapse under the action of compressing stresses during the compression half-period, thus producing local high-intensity shock waves in the fluid. Consequently, in an external ultrasonic field, gas cavities are produced at the weakest points of the melt during intervals of reduced pressure, and collapse during intervals of increased pressure. The high-intensity shock waves in the fluid are enough to damage the forming dendrite, thereby increasing the number of nuclei which is important to refinement of solidification structure, the improvement of elements segregation and increase of compact density.
Acoustic flows effect. Ultrasonic generates directed hydrodynamic flows in melts. These flows are usually called acoustic flows. They occur both in the bulk of the liquid and near the walls, particles and other objects within oscillating acoustic fields. Although velocity of acoustic streaming is much smaller than that of particle vibration, it is 5–10 times than thermal convection velocity of the fluid which is important to destroy the boundary layer, accelerate the heat transfer and mass transfer of the molten steel and make distribution of alloy elements more homogeneous.
During ESR process, the ultrasonic is introduced to the molten steel through the metal consumable electrode. The forming dendrite in the mushy region is broken off and the number of nuclei increases under the effect of ultrasonic cavitation. At the same time, the temperature in the metal pool become more even due to ultrasonic stirring and a shallow metal pool could be gained which is a prerequisite to gain the excellent solidification structure. In addition, heat transfer and mass transfer of the metal pool is accelerated which make distribution of alloy elements more homogeneous due to the effect of acoustic flows.
In order to further confirm the above inference, the secondary dendrites morphology in the center part of ESR ingot were observed when the power of ultrasonic is 0 and 700 W, respectively, as shown in Figure 7.
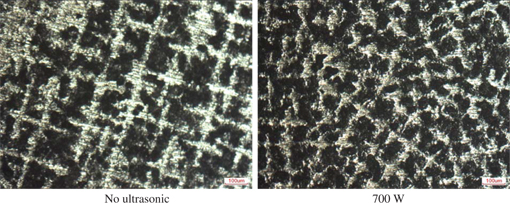
Secondary dendrites morphology in the center part of ESR ingot.
It could be seen from Figure 7 that the secondary dendrite arm spacing became smaller when ultrasonic power was 700 W compared with ESR ingot without ultrasonic treatment, which confirmed the effect of ultrasonic treatment on solidification structure refinement.
But the excessive ultrasonic power is not conducive to the improvement of solidification structure. The excessive ultrasonic power could cause the strong effect of acoustic cavitation and flows which would drive the molten metal pool violent motion and carry off enriched steel surrounding the dendrites in the mushy zone and reduce the solute content in the region. As a result, the severe element segregation would occur.
Conclusions
The segregation of elements can be improved during ESR process due to ultrasonic vibration. The distribution of carbon, silicon, manganese, chromium and phosphorus becomes uniform with the increase of the ultrasonic power when the ultrasonic power is between 0 and 700 W. But when the ultrasonic power increases to 1,000 W, segregation of alloy elements increases instead.
The reasonable ultrasonic power is favorable for improvement of compact density of ESR ingots. When the ultrasonic power increases to 700 W from 0, compact density of ESR ingots increases to 0.9618 from 0.9479, but decreases to 0.9517 when the ultrasonic power increases to 1,000 W.
The improvement in the solidification structure could be attributed to the effect of acoustic cavitation and flows which break off the dendritic crystal in the mushy zone, increase crystal nucleus and accelerate heat and mass transfer of the metal pool. But the excessive ultrasonic power is not conducive to the improvement of solidification structure.
Funding statement: Funding: The authors would like to express their gratitude to national natural science foundation of China for financial support (Grant No. 51104001/51274004).
References
[1] H.J. Ji, Q. Wang, M.Y. Li and C.Q. Wang, J. Mater. Process Technol., 214 (2014), 13–20.10.1016/j.jmatprotec.2013.07.013Search in Google Scholar
[2] Y. Fu and T.J. Li, Mater. Technol., 27 (2012) 176–179.10.1179/175355511X13110717549233Search in Google Scholar
[3] R. Haghayeghi and P. Kapranos, Mater. Lett., 126 (2014) 244–248.10.1016/j.matlet.2014.04.007Search in Google Scholar
[4] H.B. Peng, W.Q. Chen, Y.C. Yu and H.G. Zheng, High Temp. Mater. Process., 32 (2013) 459–465.10.1515/htmp-2012-0159Search in Google Scholar
[5] H.R. Kotadia and A. Das, J. Alloys Compd., 620 (2015) 1–4.10.1016/j.jallcom.2014.09.089Search in Google Scholar
[6] W. Kong and D.Q. Cang, Simulation, 88 (2012) 694–706.10.1177/0037549711422248Search in Google Scholar
[7] M.E. Moussa, M.A. Waly and A.M. EI-Sheikh, J. Alloys Compd., 577 (2013) 693–700.10.1016/j.jallcom.2013.06.189Search in Google Scholar
[8] Q. Ma, A. Ramirez and A. Das, J. Cryst. Growth, 311 (2009) 3708–3715.10.1016/j.jcrysgro.2009.04.036Search in Google Scholar
[9] Z.T. Zhang, J. Li and H.Y. Yue, J. Alloys Compd., 484 (2009) 458–462.10.1016/j.jallcom.2009.04.125Search in Google Scholar
[10] Y.L. Li, H.K. Feng and F.R. Cao, Mater. Sci. Eng., A., 487 (2008) 518–523.10.1016/j.msea.2007.11.067Search in Google Scholar
[11] A. Das and H.R. Kotadia, Mater. Chem. Phys., 125 (2011) 853–859.10.1016/j.matchemphys.2010.09.035Search in Google Scholar
[12] X.B. Liu, Y. Osawa, S. Takamori and T. Mukai, Mater. Sci. Eng., A, 487 (2008) 120–123.10.1016/j.msea.2007.09.071Search in Google Scholar
[13] S.L. Zhang, Y.T. Zhao, X.N. Cheng, G. Chen and Q.X. Dai, J. Alloys Compd., 470 (2009) 168–172.10.1016/j.jallcom.2008.02.091Search in Google Scholar
[14] Y.F. Han, K. Li, J. Wang, D. Shu and B.D. Sun, Mater. Sci. Eng. A, Struct. Mater., Prop. Microstruct. Process., 405 (2005) 306–312.10.1016/j.msea.2005.06.024Search in Google Scholar
[15] J. Li, W.Q. Chen, B.X. He and Q. Liu, J. Univ. Sci. Technol. Beijing, 29 (2007) 1246–1249.Search in Google Scholar
[16] H.Z. Wang, Phys. Test. Chem. Anal. B Chem. Anal., 42 (2006) 1–5.Search in Google Scholar
[17] Z.M. Yang, Y.T. He and Z.Q. Li. Metallurgical Analysis, 24 (2004) 26–33.Search in Google Scholar
[18] H.Z. Wang, Sci. China Ser. B, 46 (2003) 119–123.10.1360/03yb9017Search in Google Scholar
[19] G.L. Eskin, Ultrasonic Treatment of Light Alloy Melts, Gordon and Breach Science Publishers, Moscow (1998).10.1201/9781498701792Search in Google Scholar
©2016 by De Gruyter
This article is distributed under the terms of the Creative Commons Attribution Non-Commercial License, which permits unrestricted non-commercial use, distribution, and reproduction in any medium, provided the original work is properly cited.
Articles in the same Issue
- Frontmatter
- Research Articles
- Creep Behaviors Calculated by Varying Material Constants Obtained from Different Stress Regions for a Closed-End P91 Pipe
- Effect of Ultrasonic Treatment on Solidification Quality of ESR Ingots
- Synthesis of Posnjakite Nanoparticles in the Presence of a New Capping Agent
- Effects of Hot Isostatic Pressing (HIP) on Microstructure and Mechanical Properties of K403 Nickel-Based Superalloy
- Influence of Mechanical Alloying Time on Morphology and Properties of 15Cr-ODS Steel Powders
- Clean Utilization of CuCl Residue by Microwave Roasting under Oxygen-Enriched Condition
- Dry Sliding Wear Behavior of Cast A7075 and A7075/SAF 2205 Composite Material
- Synthesis and Characterization of Nanosized Manganese Oxyhydroxide Compounds by Sonochemical Method
- Synthesis and Characterization of Nanocrystalline Barium–Samarium Titanate
- Kinetics Calculation of the Non-isothermal Reduction of Pellet
- Deposition of Nano Tungsten Oxide on Glass Mat Using Hot Filament Chemical Vapor Deposition for High Catalytic Activity
- Preparation and Dielectric Properties of Si3N4/BN(CB) Composite Ceramic
- Structural and Magnetic Properties of Cr-Substituted NiCuZn Ferrite