On the Structure and Some Properties of LaCo Co-substituted NiZn Ferrites Prepared Using the Standard Ceramic Technique
-
Xiaofei Niu
 ,
Xin Huang
,
Xin Huang

Abstract
Zn0.5Ni0.5-xCoxFe2-yLayO4 ferrites (with x=0, 0.02 and y=0, 0.02) were prepared by an industrial method using the standard ceramic technique and sintered at 1,250°C in air. X-ray diffraction (XRD) was used to obtain the phase formation of the NiZn ferrites. The microstructure of ferrites was investigated by scanning electron microscopy (SEM). The XRD reveals that lattice parameter (a) is decreased and a secondary phase (LaFeO3) is formed in the La–Co co-substituted NiZn ferrite sample, meanwhile, the grain size (D) of this sample decreased obviously by observing SEM photographs. Vibrating sample magnetometry (VSM), B-H analyzer, impedance analyzer and electrometer were carried out in order to characterize some properties of the ferrites. This investigation indicates that, La–Co co-substituted NiZn ferrite sample has higher power loss (Pcv) than other samples at low frequency with an increase in coercive field (Hc) and magnetocrystalline anisotropy (K1), a decrease in initial permeability (μi) and saturation magnetization (Ms). However, at high frequency, the power loss of La–Co co-substituted sample is low, which is attributed to high resistivity (ρ), small grain size (D), less number of Fe2+ ions and low porosity (P).
Introduction
As a group of magnetic materials, spinel ferrites have been widely utilized in various electronic industries owing to their high electrical resistivity, chemical stability, mechanical hardness and reasonable cost [1–3]. The chemical formula of spinel ferrites structure can be described as (A)[B]2O4, where A and B represent tetrahedral and octahedral sites [4]. Among the spinel ferrites, NiZn ferrites play an important role in high-frequency applications due to their high resistivity, low coercive field and low-eddy current losses, which chemical formula can be presented as (ZnxFe1-x)[Ni1-xFe1+x]O4 [5]. NiZn ferrites have been commercially applied for many years in microwave devices, antenna rods, high frequency transformer cores, read/write heads and radio frequency coils [6–8]. In order to satisfy the further requirements for industry in high frequencies, some work about NiZn ferrites have been researched. Recently, many synthesis methods have been used to prepare NiZn ferrites, including sol–gel [9], hydrothermal processing [10], chemical co-precipitation [11], salt-melt method [12] and refluxing [13]. These methods for preparing NiZn ferrites are known to have an advantage of small grain size and uniform mix powders. Moreover, it is general to utilize the standard ceramic technique [14] for producing NiZn ferrites owing to its low cost, simple production process and less environment problems in industry.
In the previous work, many kinds of substituents are substituted to improve magnetic properties and microstructure in the preparation of NiZn ferrites. It has been reported that NiZn ferrites has been investigated by substitution of some substituents such as Cr2+, Ca2+, Na+, Li+, Mg2+, Mn2+, Co2+, Be2+, Al3+, Cu2+, Sn4+, Ti4+, La3+,Y3+, etc. [15–20]. These results have indicated that there is a significant improvement in NiZn ferrites by substituting a relatively small amount of substituents, and rare earth ions with a large radius have the best modification of NiZn ferrites’ structure and properties. S.E. Jacobo et al. analyzed Y, Gd, and Eu influence on microstructure and magnetic properties [21]. Sun et al. studied the effects of La3+ on some properties of NiZn ferrites [22]. Co-substituted NiZn ferrites were researched by M.A. Amer et al. [23]. Their investigation showed a modification of both microstructure and magnetic properties. Till now, some researches have been carried out systematically about La substitution and Co substitution. From previous researches we have known that Co2+ substitutes for Ni2+ and La3+ substitutes for Fe3+ on B sites in NiZn ferrites. However, the effect of La–Co co-substitution on microstructure and properties is not clear. Therefore, one purpose of our investigation is to further research this effect of La–Co co-substitution.
Li et al. have investigated the microstructure and properties of the composition Zn0.5Ni0.5-xCoxFe2O4 by the sol–gel process [24]. Sun et al. have presented the effects of different amounts La2O3 on some properties of Zn0.5Ni0.5Fe2-yLayO4 [22]. Therefore, in order to investigate the microstructure and properties of La–Co co-substituted NiZn ferrites, we have synthesized Zn0.5Ni0.5-xCoxFe2-y LayO4 ferrites (with x=0, 0.02 and y=0, 0.02) by the standard ceramic technique, and X-ray diffraction (XRD), scanning electron microscopy (SEM), vibrating sample magnetometry (VSM), B-H analyzer, impedance analyzer and electrometer have been employed.
Experimental procedure
The magnetic powders of Zn0.5Ni0.5-xCoxFe2-yLayO4 (with x=0, 0.02 and y=0, 0.02) were prepared via the standard ceramic technique, using the industry-purity NiO (99 wt%), ZnO (99 wt%), Fe2O3 (98.5 wt%), La2O3 (99.5 wt%), CoO (99.5 wt%) as raw materials. These raw materials were weighed and mixed, then milled in water for 5 h with an angular velocity of 200 rpm and a ball-to-power weight ratio of 8:1. The mixtures of powders were dried at 120°C for 10 h in an oven. After that the mixtures of powders were calcined at 850°C for 2 h in a muffle, and cooled in a furnace down to room temperature. Then the pre-calcined products were crushed. For the sake of improving the properties, CaCO3, SiO2, V2O5 and Nb2O5 were added to the pre-calcined products. Following the pre-calcined products were pressed into toroidal-shaped samples in an abrasive. The samples were sintered at 1,250°C for 3 h in a muffle, then cooled to room temperature. Sample codes were presented in Table 1.
Sample codes for NiZn ferrites synthesized via standard technique.
| Sample codes | x | y | Constitute of samples |
| A | 0 | 0 | Zn0.5Ni0.5Fe2O4 |
| B | 0.02 | 0 | Zn0.5Ni0.48Co0.02Fe2O4 |
| C | 0 | 0.02 | Zn0.5Ni0.48Fe2La0.02O4 |
| D | 0.02 | 0.02 | Zn0.5Ni0.48Co0.02Fe2La0.02O4 |
Crystalline phase and composition were identified by XRD with a Cu-Kα radiation, and recorded for a 2θ range from 10° to 70°. XRD patterns were utilized to estimate their lattice constants. The microstructure was observed with a SEM (HITACHI S-4800). From SEM images the average size (D) was obtained. Saturation magnetization (Ms) and hysteresis (Hc) parameters were measured in a VSM at room temperature. B-H analyzer (IWATSU SY-8232) was used to measure the power loss (Pcv), hysteresis loss (Ph) and eddy current loss (Pe) of samples. The initial permeability (μi) was measured with a impedance analyzer (Agilent 4287A). At room temperature, the DC electrical resistivity (ρ) measurements were made by the two probe method using a electrometer (model HP-4140B).
Results and discussion
XRD
Figure 1 shows the XRD patterns for the ferrites samples. Samples A and B are single-phase NiZn ferrites with a spinel structure, indicating the absence of any other impurity phases with Co substitution. However, there is a secondary phase (LaFeO3) in samples C and D. The secondary phase (LaFeO3) was formed after the substitution of La3+ in place of Fe3+ in NiZn ferrites [25]. It can be explained that the radius of La3+ (1.06Ǻ) is larger than that of Fe3+(0.64Ǻ) and a portion of La3+ cannot enter into the lattice, so the redundant La3+ will form the secondary phase (LaFeO3) on grain boundaries.

XRD patterns for the samples.
The calculated values of lattice parameter a are displayed in Table 2. It is observed that the lattice parameter a of sample B increases compared to that of sample A. One possible explanation is that the radius of Co2+ (0.72Ǻ) is larger than that of Ni2+ (0.69Ǻ) which makes the lattice expand [23]. Compared to that of sample A, the lattice parameter a of sample C decreases, which was expected to increase considering the radius of La3+ (1.06Ǻ) is larger than that of Fe3+(0.64Ǻ). This can be ascribed to the crystal anisotropy and volume strain that have been changed due to large size mismatch of La3+ and Fe3+. Hence, lattice parameter a decreases in order to relax the lattice strain [26]. Due to the combined effect of both La3+ and Co2+, the value of lattice parameter a of sample D is between that of samples B and C.
Date on lattice parameter (a), grain size (D), bulk density (d), and porosity (P) for samples.
| Sample | a (Å) | D (μm) | d (g/cm3) | P (%) |
| A | 8.3726 | 3.1 | 5.03 | 9.8 |
| B | 8.3870 | 2.4 | 5.11 | 6.5 |
| C | 8.3652 | 2.8 | 5.13 | 5.8 |
| D | 8.3719 | 2.6 | 5.17 | 3.9 |
SEM
Typical SEM micrographs of samples are shown in Figure 2. The average grain size (D) is calculated by the line intercept method and is tabulated in Table 2. It can be seen that the average grain size of the unsubstituted ferrite (Figure 2(A)) displays is about 3.1 μm and other samples (Figure 2(B)–(D)) have a smaller grain size. It is obvious that La3+ and Co2+ lead to the decrease in grain size. On the one hand, due to the reaction course is slowly and homogeneous with Co substitution, the grain size of sample B (Figure 2(B)) decreases to 2.4 μm [27]. On the other hand, due to the secondary phase (LaFeO3) on grain boundaries hinder the growth of grains, the grain size of sample C (Figure 2(B)) decreases to 2.8 μm [28]. Meanwhile, the grain size of sample D (Figure 2(D)) is between that of sample B and C, which is probably attributed to the co-substitution of La–Co leading to the growth of grains slowly, the symmetry of the crystal structure and the secondary phase (LaFeO3).

Typical SEM micrographs of samples.
The effect of La3+ and Co2+ substitution on the porosity (P) of the prepared samples is observed in Figure 2. The porosity of samples has been calculated using the following equation [29]:
where d is bulk density (Table 2), Dx is the X-ray density which has been calculated from XRD patterns. From Table 2, we can see the sample D has the lowest porosity. The porosity formed between the grains, which decreased by substituting La3+ and Co2+ which results in the shrinkage of the crystal lattice, decrease in grain size and formation of secondary phase (LaFeO3). However, the bulk density and porosity behave inversely. Therefore, it is found that the sample D has the highest bulk density (5.17 g/cm3) and the lowest porosity (3.9%).
VSM
The variation of samples saturation magnetization (Ms) is demonstrated in Table 3. According to Miller’s site preference energies of ion s–l [30], the cations distribution in the case of NiZn ferrites can be represented by the formula:
where the ionic magnetic moments of Zn2+, Ni2+, Fe3+, Co2+ and La3+ are 0, 2, 5, 3 and 0μB. In AB2O4 spinel ferrites structure, the saturation magnetization (Ms) is dominated by the superexchange interactions between A-sites and B-sites. It is calculated by the relation
When the smaller magnetic moments of Ni2+ ions (2 μB) on B-sites are replaced by the higher magnetic moments of Co2+ ions (3 μB), the magnetic moments of B-sites (MB) increases. This induces saturation magnetization of sample B increases (in Table 3). The results are in agreement with the report by Nobuhiro et al. [31]. Compared to Co2+ ions, La3+ ions’ contribution to the saturation magnetization is inverse. When the non-magnetic La3+ ions replaced by Fe3+(5 μB) on B sites, the magnetic moments of B-sites (MB) decreased and superexchange interactions weakened. Hence, the saturation magnetization of sample C decreases. As observed from Table 3, the saturation magnetization of sample D decreases. This could be attributed to two factors: (1) It is known that Co2+ (3 μB) substitutes Ni2+ (2 μB) and La3+ (0 μB) substitutes Fe3+ (5 μB) in sample D. Due to x=y=0.02, the magnetic moments of B-sites (MB) decrease which also makes saturation magnetization to decrease. (2) We have revealed that the sample D with La–Co substitution has a smaller gain size (from Table 2). Disordered spins increase with the decrease in grain size which causes the saturation magnetization to reduce [32].
Saturation magnetization (Ms), coercive field (Hc), magnetocrystalline anisotropy (K1) and resistivity (ρ) for the samples.
| Sample | Ms (emu/cm3) | Hc (Oe) | K1 (×103erg/cm−3) | ρ (×106Ω/cm) |
| A | 8.3726 | 3.1 | 5.03 | 9.8 |
| B | 8.3870 | 2.4 | 5.11 | 6.5 |
| C | 8.3652 | 2.8 | 5.13 | 5.8 |
| D | 8.3719 | 2.6 | 5.17 | 3.9 |
All samples exhibit high coercive field (Hc) values compared to sample A in Table 3, meanwhile, the sample D exhibits the highest coercive field. The coercive field is a microstructure property; it mainly depends on the symmetry of crystal and size of grains [33]. On the one hand, CoFe2O4 and NiFe2O4 have an inverse spinel structure, so the substitution of Co2+ results in the increase in K1. The coercive field can be written as the following relation:
In this relation, K1 is the magnetocrystalline anisotropy (see Table 3). According to this relation, Hc would increase with the increase in K1 and decrease with the increase in Ms. When x=0.02, further increase in K1 than Ms leads to increase in Hc. The similar results have been reported by Li et al. [24]. On the other hand, La3+ ions have stronger s-l coupling and weaker crystal field, so the symmetry of crystal is lower, which results in strong magnetocrystalline anisotropy, inducing the Hc to increase. Moreover, the secondary phase (LaFeO3) has a limit in the grain size (see Figure 2). When the grain size decreases, the grains tend to be multi-domains, the Hc starts to increase [34]. Therefore, the sample D has a higher coercive field (Hc).
Thermal variation of initial permeability (μi)
Figure 3 correlates the thermal variation of initial permeability (μi) of samples with temperature in the range from –30°C to the Curie temperature (Tc). The initial permeability is expressed as [35]
where Ms is the saturation magnetization, K1 is the magnetocrystalline anisotropy, λ is the magnetostriction coefficient, σ is the inner stress, a and b are constants.
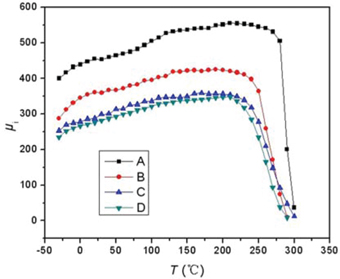
Thermal variation of initial permeability (μi) for NiZn ferrite samples.
As in Figure 3 (tested at 10kHz), all samples exhibit a ferromagnetic behavior that the initial permeability of samples slowly rise with temperature up to the Curie temperature (Tc) and drop to zero sharply. This is attributed to the K1 decreases far more quickly than Ms when temperature changes. According to eq. (4), μi increases with temperature increases to the Curie temperature [36]. When the temperature over Curie temperature, the samples would exhibit a paramagnetism, so μi falls sharply.
With a further observation to Figure 3, it is noticed that, the Curie temperature (Tc) of sample D decreases with La–Co co-substitution. The Tc mainly depends on the A–B superexchange interactions. No-magnetic La3+ ions substitutes Fe3+ ions on B sites, which results in weakening of the A–B superexchange interactions from FeA3+–O2–FeB3+ and decreasing the ferromagnetic region [37]. In addition, Co2+ substitutes Ni2+ on B sites and the Tc of CoFe2O4 (525°C) is less than that of NiFe2O4 (585°C) [38]. Hence, the Tc decreases by substituting La3+-Co2+ ions.
Frequency dependence of initial permeability (μi)
Figure 4 presents the variation of initial permeability with frequency in the range from 10 kHz to 1 GHz. It is well known that the initial permeability of NiZn ferrites is related to two different magnetizing mechanisms: domain wall motion and spin rotation [39]. At lower frequency, the value of initial permeability is mainly contributed by domain wall motion. The domain wall motion is dominated by the grain size, and increases with the increase of grain size. Therefore, big grain size has advantage in initial permeability [40]. As increasing frequency, spin rotation makes a major contribution to the initial permeability. The spin rotation is determined by the chemical composition which is related to the magnetic superexchange interactions between A-sites and B-sites. At higher frequency, a higher initial permeability can be attributed to a reinforce of A–B superexchange interactions [41]. From the above parts we have known that the A–B superexchange interactions of sample D is the weakest. Hence, it has been indicated that the initial permeability is decreased for La–Co co-substituted NiZn ferrite (sample D) in the frequency of 10 kHz to 1 GHz.
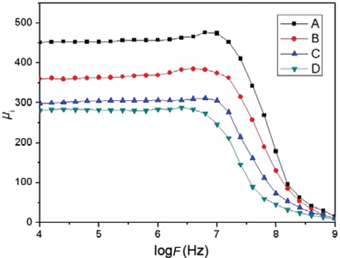
Frequency variation of initial permeability (μi) for NiZn ferrite samples.
From Figures 3–4 we can observed that the value of initial permeability (μi) of unsubstituted ferrite (sample A) is larger than that of other samples. Relying on above analyses, a high initial permeability of sample A depends on chemical composition and microstructural modification such as grain size, magnetocrystalline anisotropy, A–B superexchange interactions, etc.
Resistivity (ρ)
The observed resistivity (ρ) at room temperature is summarized in Table 3. It can be seen that the resistivity increases from 4.5×10⁶ to 9.2×10⁶Ω/cm with Co substitution, to 7.3×10⁶Ω/cm with La substitution and 14.7×10⁶Ω/cm with La–Co co-substitution. This can be explained by the decrease in Fe2+ and the formation of secondary phase (LaFeO3). We have known that the electron exchange between Ni2+ and Fe3+ can be described as the relation
The power loss (Pcv)
As we have known, the power loss (Pcv) usually can be divided into hysteresis loss (Ph), eddy current loss (Pe) and residual loss (Pr) in NiZn ferrites [44]. At low frequency (less than 1 MHz), the hysteresis loss (Ph) is much bigger than eddy current loss (Pe) and residual loss (Pr). So the power loss can be expressed as Pcv ≈ Ph. The hysteresis loss depends on microstructure, magnetocrystalline anisotropy, Saturation magnetization and coercive field, and it has an inverse proportion to initial permeability, i.e.
The relationship between the power loss and exciting flux density (Bm) at 20 kHz of samples is shown in Figure 5. According to the description in above part, the predominant factor in Pcv is Ph when the samples are excited at 20 kHz. Due to the effect of domain wall movement, the Ph of samples increases as increasing in Bm, which is in agreement with the observation in Figure 5. It also can be seen that the sample D with La–Co substitution has the higher Pcv. This behavior can be related to the fact that sample D has a smaller value of μi, which leads to a higher Ph. In addition, the sample D has smaller grain size and more grain boundaries, which induces the higher Ph [46].
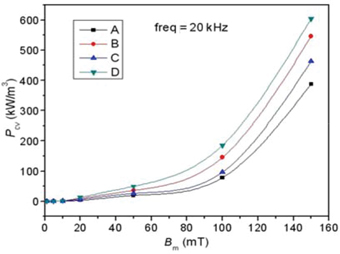
The relationship between power loss (Pcv) and flux density (Bm) at 20kHz.
Frequency dependence of Pcv for samples at a condition of Bm=10 mT is illustrated in Figure 6. Less than 1 MHz, the sample D has the higher Pcv, the similar result has been displayed in Figure 5. As increasing frequency, the Pcv of sample D is lower than other samples. We have known that the Pcv can be regarded as the sum of Pe and Pr at higher frequency. Observed from Tables 2 and 3, the sample D has smaller grain size and higher resistivity, which results in the lower Pe. Furthermore, substituting La3+ and Co2+ ions leads to a decrease in number of Fe2+ ions, which is beneficial to decrease Pr. Consequently, with a lower Pcv over 1 MHz, the sample D is suitable to applications in high frequency [47].
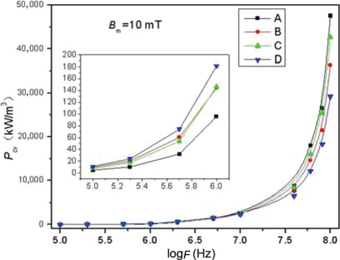
The relationship between power loss (Pcv) and frequency at 10mT.
Conclusion
The Zn0.5Ni0.5-xCoxFe2-yLayO4 ferrites (with x=0, 0.02 and y=0, 0.02) were prepared by the standard ceramic technique. The substitution of La3+ and Co2+ ions was found to affect the microstructure and some properties of NiZn ferrites. The XRD showed that the single phase with substituting Co2+ ions, but a secondary phase (LaFeO3) has been formed with substituting La3+ ions. According to XRD patterns, it has known that the lattice parameter increases with Co substitution and decreases with La substitution. The observation from SEM photographs indicated that the grain size decreased with La and Co substitution, and the sample D with La–Co co-substitution obtained the smallest value of grain size. The magnetic properties for samples were influenced by substituting La3+ and Co2+ ions. At low frequency, the La–Co substituted sample D had obtained the highest Pcv, which was attributed to the decrease in Ms and μi, and the increase in Hc. However, at high frequency, the Pcv of sample D was the lowest compared to other samples due to the higher ρ, smaller grain size and less number of Fe2+. As a result, the NiZn ferrites with co-substituting La3+ and Co2+ ions could be appropriate for high frequency applications.
Funding statement: Funding: This work was supported by the National Natural Science Foundation of China (nos 51072002 and 51272003), the Education Department of Anhui Province (nos KJ2010A008, KJ2013B057 and KJ2012A027), the Anhui University “211 Project” Academic Innovation Team projects (no. 02303402) and the Research Fund for the Doctoral Program of Higher Education of China (20123401110008).
References
[1] S.M.Olhero, D.Soma, V.S.Amaral et al., J. Eur. Ceram. Soc., 32 (2012) 2469–2476.Search in Google Scholar
[2] I.H.Gul, W.Ahmed and A.Maqsood, J. Magn. Magn. Mater., 320 (2008) 270–275.Search in Google Scholar
[3] M.U.Islam, T.Abbas, S.B.Niazi et al., Solid. State Commun., 130 (2004) 353–356.Search in Google Scholar
[4] A.Ghasemi, S.Ekhlasi and M.Mousavinia, J. Magn. Magn. Mater., 354 (2014) 136–145.Search in Google Scholar
[5] F.Li, X.Liu, Q.Yang et al., Mater. Res. Bull., 40 (2005) 1244–1255.Search in Google Scholar
[6] R.V.Mangalaraja, S.Thomas Lee, S.Anathakunmar et al., Mater. Sci. Eng A., 476 (2008) 234–239.10.1016/j.msea.2007.05.078Search in Google Scholar
[7] K.V.Kumar and D.Ravinder, Int. J. Inorgan. Mater., 3 (2001) 661–666.10.1016/S1466-6049(01)00194-5Search in Google Scholar
[8] A.M.El-Sayed, Ceram. Int., 28 (2002) 363–367.10.1016/S0272-8842(01)00103-1Search in Google Scholar
[9] A.Pradeep, P.Priyadharsini and G.Chandrasekaran, J. Magn. Magn. Mater., 320 (2008) 2774–2779.10.1016/j.jmmm.2008.06.012Search in Google Scholar
[10] B.Baruwai, R.K.Rana and S.V.Manorama, J. Appl. Phys., 101 (2007) 14302–14308.Search in Google Scholar
[11] H.Yang, X.Zhang, W.Ao et al., Mater. Res. Bull., 39 (2004) 833–837.Search in Google Scholar
[12] R.H.Arendt, US patent 3793443, 1974.Search in Google Scholar
[13] X.D.Li, W.S.Yang, F.Li et al., J. Phys. Chem. Solids, 67 (2006) 1286–1290.Search in Google Scholar
[14] A.M.El-Sayed, Ceram. Int., 28 (2002) 651–655.Search in Google Scholar
[15] N.Rezlescu and E.Rezlescu, Solid State Commun., 88 (1993) 139–141.Search in Google Scholar
[16] P.K.Maskar, S.V.Kakatkar, A.M.Sankpal et al., J. Czech. Phys., 46 (1996) 397–400.Search in Google Scholar
[17] S.G.Bachhav, R.S.Patil, P.B.Ahirrao et al., Mater. Chem. Phys., 129 (2011) 1104–1109.Search in Google Scholar
[18] J.Sláma, R.Dosoudil, M.Ušáková et al., J. Magn. Magn. Mater., 304 (2006) e758–e761.10.1016/j.jmmm.2006.02.215Search in Google Scholar
[19] X.H.Wang, P.Chen and I.W.Chen, J. Am. Ceram. Soc., 89 (2) (2006) 431.10.1111/j.1551-2916.2005.00763.xSearch in Google Scholar
[20] X.H.Wang, X.Y.Deng, H.L.Bai et al., J. Am. Ceram. Soc., 89 (2) (2006) 438.Search in Google Scholar
[21] S.E.Jacobo, S.Duhade and H.R.Bertorello, J. Magn. Magn. Mater., 272 (2004) 2253–2254.Search in Google Scholar
[22] J.Sun, J.Li and G.Sun, J. Magn. Magn. Mater., 250 (2002) 20–24.Search in Google Scholar
[23] M.A.Amer, A.Tawfik and A.G.Mostafa, J. Magn. Magn. Mater., 323 (2011) 1445–1452.Search in Google Scholar
[24] L.Li, L.Peng, Y.Li et al., J. Magn. Magn. Mater., 324 (2012) 60–62.Search in Google Scholar
[25] P.K.Roy, B.B.Nayak and J.Bera, J. Magn. Magn. Mater., 320 (2008) 1128–1132.Search in Google Scholar
[26] Y.Wang, F.Xu, L.Li et al., Mater. Chem. Phys., 112 (2008) 769–773.Search in Google Scholar
[27] X.Shen, Y.Wang, X.Yang et al., Trans. Nonferrous Met. Soc. China, 19 (2009) 1588–1592.Search in Google Scholar
[28] M.A.Ahmed, E.Ateia, L.M.Salah et al., Mater. Chem. Phys., 92 (2005) 310–321.Search in Google Scholar
[29] M.A.Ahmed, Phys. Status. Solidi A., 111 (1989) 567.Search in Google Scholar
[30] A.Miller, J. Appl. Phys., 30 (1959) 24S.Search in Google Scholar
[31] M.Nobuhiro, N.Tatsuro and A.Masanori, J. Appl. Phys. A., 93 (2003) 10.Search in Google Scholar
[32] L.Kumar and M.Kar, Ceram. Int., 38 (2012) 4771–4782.10.1016/j.ceramint.2012.02.065Search in Google Scholar
[33] L.J.Zhao, H.Yang, L.X.Yu et al., J. Magn. Magn. Mater., 305 (2006) 91.10.1016/j.jmmm.2005.11.043Search in Google Scholar
[34] L.Diandra and P.Leslie, Chem. Mater., 8 (1996) 1770.10.1021/cm960077fSearch in Google Scholar
[35] G.F.Dionme, J. Appl. Phys., 40 (1969) 4486.10.1063/1.1657219Search in Google Scholar
[36] S.S.Bellad, S.C.Watwe and B.K.Chougule, J. Magn. Magn. Mater., 195 (1995) 57.10.1016/S0304-8853(98)01073-7Search in Google Scholar
[37] J.S.Ghodake, R.C.Kamble, S.V.Salvi et al., J. Alloy. Compd., 486 (2009) 830–834.10.1016/j.jallcom.2009.07.075Search in Google Scholar
[38] M.A.Gable, A.M.Asiri and Y.M.Al Angari, Ceram. Int., 37 (2011) 2625–2630.10.1016/j.ceramint.2011.04.007Search in Google Scholar
[39] T.Tsutaoka, M.Ueshima, T.Tokunaga et al., J. Appl. Phys., 78 (1995) 3983–3991.10.1063/1.359919Search in Google Scholar
[40] P.Mathur, A.Thakur, J.H.Lee et al., Mater. Lett., 64 (2010) 2738–2741.10.1016/j.matlet.2010.08.056Search in Google Scholar
[41] T.T.Ahmed, I.Z.Rahman and M.A.Rahman, J. Mater. Process. Technol., 153–154 (2004) 797–803.10.1016/j.jmatprotec.2004.04.188Search in Google Scholar
[42] E.J.W.Verwey and J.H.D.Boer, Recl. Trav. Chim. Pays-Bas., 55 (1936) 531.10.1002/recl.19360550608Search in Google Scholar
[43] E.W.Gorter, Philips Res. Rep., 9 (1954) 295.Search in Google Scholar
[44] H.Su, H.Zhang, X.Tang et al., J. Magn. Magn. Mater., 320 (2008) 483–485.10.1016/j.jmmm.2007.07.005Search in Google Scholar
[45] H.Ji, Z.Lan, Z.Yu et al., J. Magn. Magn. Mater., 321 (2009) 2121–2124.10.1016/j.jmmm.2009.01.001Search in Google Scholar
[46] W.D.Kingery, H.K.Bowen and D.R.Uhlmann, Introduction to Ceramics, Wiley, New York (1976), p. 1012.Search in Google Scholar
[47] K.Kondo, T.Chiba and S.Yamada, J. Magn. Magn. Mater., 541 (2003) 254–255.10.1016/S0304-8853(02)00859-4Search in Google Scholar
©2016 by De Gruyter
This article is distributed under the terms of the Creative Commons Attribution Non-Commercial License, which permits unrestricted non-commercial use, distribution, and reproduction in any medium, provided the original work is properly cited.
Articles in the same Issue
- Frontmatter
- Research Articles
- Effects of Cations on Corrosion of Inconel 625 in Molten Chloride Salts
- Thermodynamic Analysis on the Minimum of Oxygen Content in the Deoxidation Equilibrium Curve in Liquid Iron
- Air Oxidation Behavior of Two Ti-Base Alloys Synthesized by HIP
- Generation of Constant Life Diagram under Elevated Temperature Ratcheting of 316LN Stainless Steel
- Effect of c-BN Size and Content on the Self-Propagating High-Temperature Synthesis of c-BN Composites Bonded with Ti-Al-C System Multiphase Products
- Effect of Welding Speeds on Mechanical Properties of Level Compensation Friction Stir Welded 6061-T6 Aluminum Alloy
- Simulation of Thermo-viscoplastic Behaviors for AISI 4140 Steel
- Transition Metal Nitrides: A First Principles Study
- The Constitutive Relationship and Processing Map of Hot Deformation in A100 steel
- Preparation of Granular Red Mud Adsorbent using Different Binders by Microwave Pore – Making and Activation Method
- On the Structure and Some Properties of LaCo Co-substituted NiZn Ferrites Prepared Using the Standard Ceramic Technique
- Effect of MgO and MnO on Phosphorus Utilization in P-Bearing Steelmaking Slag
- Dependence of Temperature and Slag Composition on Dephosphorization at the First Deslagging in BOF Steelmaking Process