Transition Metal Nitrides: A First Principles Study
-
Ashish Pathak


Abstract
The present work describes the structural stability and electronic and mechanical properties of transition metal nitrides (TmNs: B1 cubic structure (cF8, Fm
Introduction
Binary transition metal nitrides (TmNs) have been the subject of intense scientific interest and technological importance due to an attractive blend of physical and chemical properties. These properties are high melting point, ultra hardness (comparable to diamond), strength and durability, good optical, electrical and thermal conductivity and slow resistance to corrosion [1, 2]. As a result, these nitrides are widely used as refractory materials, wear and corrosion resistance, surface coating and thin film interconnections in integrated circuits. In addition, these are also used in electrochemical systems, including fuel cells, electric storage and secondary battery with low cost and high efficiency and electrocatalyst in the mass production and synthesis fields.
The structure of the TmNs is face centred cubic (fcc) with Fm
Crystallographic data of the cubic TmN phase.
| TmN phase: Cubic | |||||
| Fm | |||||
| cF8 | |||||
| Atomic positions: | |||||
| Atoms | Wyckoff notation | Symmetry | x | y | z |
| Tm | 4(a) | m | 0 | 0 | 0 |
| N | 4(b) | m | 1/2 | 1/2 | 1/2 |
A first principles total energy calculation of nitrides of IVB group (Ti, Zr and Hf), Nb and Mo has been carried out and corresponding structural and electronic properties have been reported [4–8]. However, a comprehensive first principles study of all the TmNs (IV–VIB groups) have been rather lacking in the literature. The present work is thus concerned with a detailed and systematic approach to investigate structural, electronic, single crystal elastic and polycrystalline bulk mechanical properties of TmNs using first principles total energy calculations. An attempt has been made to compare the results obtained in the present calculation with available experimental data.

Crystal structure of TiN phase (B1).
Methodology
The present calculations have been carried out using first principles norm conserving pseudopotential method in the framework of the density functional theory (DFT) [9, 10]. The ABINIT software has been utilized for the same [11–14]. Exchange correlation effects have been treated within generalized gradient approximation (GGA) using Perdew–Burke–Ernzerhof formulation [15]. Convergence with respect to the plane wave cut-off energy has been verified and accordingly plane wave cut-off energy of 80 Ry has been used in the present calculation for TmNs. Fast Fourier transform algorithm [16] has been utilized to convert the wavefunctions between the real and reciprocal lattices. Consequently, conjugate gradient algorithm [17, 18] has been used to determine wave functions within the framework of self-consistency. The integration over the Brillouin zone (BZ) has been done with the Monkhorst–Pack scheme [19]. The convergence with respect to k-points has been checked for different TmNs and the optimum value used for the present calculations is 6×6×6 (Figure 2(a)). The periodic boundary conditions (PBCs) have been considered along 〈100〉 directions in real space. The structural optimization of the TmNs has been performed by relaxing the lattice constant for obtaining the minimum energy. Convergence is assumed when the differences between energies and forces in two consecutive steps are less than 27×10−9 meV and 2.6 meV/Å, respectively.
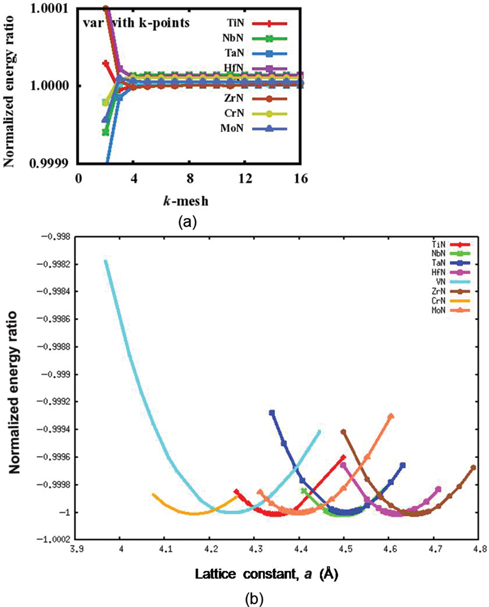
Variation of (a) k-mesh and (b) lattice parameter with normalized energy ratios for TmN.
Both the formation energy per atom and the lattice constant a of TmNs at 0 K have been computed and given in Table 2. The structures of the TmNs have been initially optimized by varying the lattice constant values and corresponding equilibrium lattice constants are obtained with minimum energy. A plot of the normalized energy ratios (system energy/minimum system energy) for different TmNs along with lattice constant is shown in Figure 2(b).
The energy of formation/atom has been defined as
Equilibrium lattice constants and formation energy/atom of metal nitrides TmN (Tm=Ti, Zr, Hf, V, Nb, Ta, Cr, Mo) and corresponding atomic size and volume of Tm metals.
| System | Lattice constant (Å) | Atomic size of Tm atoms | Efor/atom (eV) | ||
| Present study | Expt. | Seitz radius (Å) | Atomic volume (Å3) | ||
| TiN | 4.35 | 4.238 | 1.614 | 17.65 | −3.024296007 |
| ZrN | 4.66 | 4.577 | 1.771 | 23.27 | −3.105911247 |
| HfN | 4.62 | 4.520 | 1.743 | 22.16 | −3.025780776 |
| VN | 4.25 | 4.137 | 1.491 | 13.88 | −2.253613957 |
| NbN | 4.50 | 4.389 | 1.625 | 17.98 | −2.262022735 |
| TaN | 4.50 | 4.331 | 1.626 | 18.01 | −2.122243185 |
| CrN | 4.16 | 4.148 | 1.423 | 12.00 | −1.650151855 |
| MoN | 4.40 | – | 1.550 | 15.58 | −1.466222009 |
where
The elastic constants have been calculated using the linear response method implemented in ABINIT software. The linear response method is used to calculate the second derivative of the total energy with respect to the strain. The Xcrysden [20] software has been utilized for visualization of the crystal structure and 2D charge density.
Results and discussion
A first principles total energy calculation has been carried out for TmNs. A normalized energy ratio versus lattice constant plot for different TmNs is shown in Figure 2(b) and equivalent equilibrium lattice constant values are given in Table 2. The calculated lattice constant values are in good agreement with the available experimental and theoretical values [3, 5]. The calculated lattice parameter values of different TmNs depend on the size of respective transition metal [21]. For example, ZrN exhibits highest value of lattice constant because of high Seitz radius as well as high atomic volume among all transition metals (Table 2).
The calculated values of formation energy/atom of these nitrides are given in Table 2. These values do not reveal definite trend within the group; however, the values of formation energy/atom of group increase from IVB to VIB nitrides. This indicates that the stability of these nitrides decreases from IVB to VIB groups.
The electronic density of states (DOS) and 2D charge density of all the TmNs are shown in Figures 3–10. The DOS of individual atoms are also given for the comparison. Fermi level (EF) is set at 0 eV in all the DOS figures. The highest peak observed in DOS of the TiN is located near 2.5 eV (above EF). The locations of the highest peak appear below EF with increase in period from TiN to HfN (Figures 3–5). The presence of these peaks is due to the contribution of individual atoms, i.e., Tm and N since they also exhibit peaks at similar positions. Therefore, the major contributions towards bonding behaviour of IVB group nitrides are due to Tm(d)–N(p) orbitals below EF (Figures 3–5). Similar bonding characteristics are also observed in corresponding 2D charge density maps. The electronic charges are localized towards nitrogen atoms which is more predominant in ZrN. This can probably be attributed to a combined effect of atomic size and change in electronic structure.

Electronic DOS and 2D charge density of TiN.

Electronic DOS and 2D charge density of ZrN.

Electronic DOS and 2D charge density of HfN.
The groups VB and VIB nitrides exhibit similar change in locations of the highest intensity peaks in total DOS (Figures 6–10). The bonding behaviour of these nitrides is also due to peaks below EF exhibiting Tm (d)–N(p) orbitals. The 2D charge density maps show electronic charge localization towards N atoms and this tendency increases with increase in period in both the groups.

Electronic DOS and 2D charge density of VN.

Electronic DOS and 2D charge density of NbN.

Electronic DOS and 2D charge density of TaN.

Electronic DOS and 2D charge density of CrN.

Electronic DOS and 2D charge density of MoN.
The elastic properties of single crystal describe the behaviour of a solid that undergoes deformation and then recovers and returns to its original unstrained form. For cubic structures, the elastic properties of a single crystal are described by three elastic constants namely, C11, C12 and C44. The values of single-crystal elastic constants and available experimental data [22–25] are given in Table 3. The calculated values of elastic constants are in good agreement with experimental data available in the literature except the C44 values for NbN and HfN [22–25]. The elastic constant C11 is significantly stiffer than those of C12 and C44. The C44 values are considerably low and negative for CrN and MoN, respectively. This can be attributed to weak Tm (d)–N(p) bonding in CrN and MoN [26]. These values do not reflect systematic change within the group. This can probably be ascribed to a combined effect of atomic size of Tm atoms and corresponding electronic structure.
Calculated bulk modulus (K), elastic constants and anisotropy (A) of metal nitrides TmN (Tm=Ti, Zr, Hf, V, Nb, Ta, Cr, Mo) and available experimental data [22–25].
| System | Bulk modulus (GPa) | C11 (GPa) | C12 (GPa) | C44 (GPa) | A=2C44/(C11–C12) | ||||
| Present study | Expt. | Present study | Expt. | Present study | Expt. | Present study | Expt. | Present study | |
| TiN | 263 | 277, 318 | 508 | 625, 631 | 141 | 165, 171 | 150 | 163, 170 | 0.817 |
| ZrN | 260 | 240, 216 | 530 | 471 | 126 | 88 | 131 | 138 | 0.649 |
| HfN | 210 | 235, 306 | 453 | 679 | 89 | 119 | 84 | 150 | 0.462 |
| VN | 279 | 268 | 473 | 182 | 94 | 0.646 | |||
| NbN | 289 | 287, 292 | 586 | 608 | 140 | 134 | 62 | 117 | 0.278 |
| TaN | 339 | 686 | 166 | 63 | 0.242 | ||||
| CrN | 281 | 408 | 217 | 9.54 | 0.0999 | ||||
| MoN | 309 | 534 | 196 | −58 | −0.343 | ||||
The nature of metallic bonding of TmNs can be predicted based on Cauchy pressure which is defined as C12–C44<0. The negative Cauchy pressure indicates more directional bonding whereas positive value exhibits predominant metallic bonding [27, 28]. As a result, both TiN and ZrN show directional bonding while the other nitrides reflect metallic bonding [29]. The value of Cauchy pressure becomes positive for HfN and it further increases from VB to VIB groups. Therefore, the propensity of formation of metallic bonding increases from IVB to VIB groups.
The values of elastic constants also provide information about the stability of materials. The Born stability criteria for cubic crystal is given as [30]
All TmNs follow the Born stability criteria except CrN and MoN. Both CrN and MoN exhibit C11<|2C12| and C44<0, respectively. It is important to mention here that CrN exists in two forms. The CrN with orthorhombic (oP4, Pmmn) structure is stable below 285 K while the one with cubic (cF8, Fm
The values of Zener anisotropy factor (A) of the TmNs are given in Table 3. If the value of A is 1, the material is isotropic and away from 1 indicates the presence of anisotropy in elastic constants. Table 3 shows that the values of A for all the TmNs are less than 1 and it decreases from IVB to VIB groups. It also decreases within the group with increase in period. This clearly indicates that the extent of anisotropy increases from IVB to VIB groups. In addition, the extent of anisotropy also decreases within the group with increase in period. For example, TiN behaves close to isotropic material while HfN has comparatively strong anisotropy. This observation is also in agreement with results obtained by Nagao et al. [5].
The effective elastic modulus of isotropic polycrystalline materials can be evaluated from the elastic constants by following two approximations namely, the Voigt [36] and Reuss [37] assumptions that provide information about the upper and lower limit. These are
where B is bulk modulus while GV and GR are shear modulus values obtained by Voigt and Reuss approximations, respectively. The average value of these two estimates mentioned above is given by Hill [38] approximation. The Voigt–Reuss–Hill (VRH) average values are given by
where BH, GH, E and ν are bulk modulus, shear modulus, Young’s modulus and Poisson’s ratio, respectively.
The calculated Bulk modulus B (=BH) values of TmNs are given in Table 3. Some of the calculated values of bulk modulus are in good agreement with the available experimental data [39]. The bulk modulus values decrease within IVB group while increasing in groups VB and VIB with increase in period. A definite trend observed from IVB to VIB groups within the same period can therefore be attributed to the addition of one valence d-electron that contributes towards strong bonding. Grossman et al. [4] have also observed similar trend and attributed this behaviour to the addition of valence d-electrons.
The calculated Shear modulus (G) and Young’s modulus (E) values are given in Table 4 which do not reflect definite trend either within the group or from IVB to VIB groups. However, the calculated values in the present study for groups IVB and VB nitrides are comparatively in good agreement with those experimentally observed [39]. It is to be noted that the negative values of Shear and Young’s modulus of MoN are related with instability of the phases as mentioned above. Poisson’s ratio (ν) values, on the other hand, reflect definite trends in both within the group as well as from IVB to VIB groups within the same period (Table 4). These values increase within the group with increase in period and also increase from IV to VIB groups within the same period. It is important to mention here that the values of Poisson’s ratio are interlinked with both G and E which do not follow a definite trend as mentioned above. The experimental values of Poisson’s ratios reported in the literature are in good agreement with the present calculations [39].
Calculated Bulk modulus (B), Shear modulus (G), Young’s modulus (E) and Poisson’s ratio (ν) of TmNs (Tm=Ti, Zr, Hf, V, Nb, Ta, Cr, Mo) and reported experimental values [35].
| System | Bulk modulus (GPa) | Gv (GPa) | Gr (GPa) | G (GPa) | E (GPa) | ν | ||||
| Present study | Expt. | Present study | Expt. | Present study | Expt. | Present study | Expt. | |||
| TiN | 263 | 277 | 163.4 | 161.8 | 162.6 | 187 | 405 | 463 | 0.2439 | 0.220 |
| 318 | 189 | 469 | 0.254 | |||||||
| ZrN | 260 | 216 | 159.4 | 152.4 | 156 | 138 | 390 | 390 | 0.2506 | 0.186–0.250 |
| 240 | 155 | 392 | ||||||||
| HfN | 210 | 235 | 123.2 | 107.06 | 115 | 150 | 292 | 333 | 0.2685 | 0.259–0.350 |
| 306 | 175 | |||||||||
| VN | 279 | 268 | 114.6 | 109.5 | 112 | 156 | 296 | 393 | 0.3229 | 0.256 |
| NbN | 289 | 287 | 126.4 | 87.2 | 107 | 117 | 285 | 387 | 0.3353 | 0.275 |
| 292 | ||||||||||
| TaN | 339 | 141.8 | 90.4 | 116 | 313 | 0.3464 | ||||
| CrN | 281 | 43.9 | 14.9 | 29 | 85 | 0.4494 | ||||
| MoN | 309 | 32.8 | −125.3 | −46 | −146 | 0.5789 | ||||
The values of shear and bulk modulus can also be utilized to predict the brittle and ductile behaviour of materials [40]. This can be envisaged by taking the ratio G/B. The ratio
In addition, the melting temperature (TM) of the materials can be roughly estimated using elastic constant (C11) and bulk modulus [41]. The TM for cubic structure materials can be given as
where TM,

Estimated and experimental melting temperatures of TmNs.
Conclusions
First principles DFT within GGA has been utilized to investigate the structural stability and mechanical properties of TmNs.
The lattice constant values of TmNs increase with increasing the atomic radii of the Tm. Stability of the TmNs decreases from IVB to VIB groups due to increase in formation energy/atom.
Bonding characteristics of the TmNs have been explained based on electronic DOS and charge density.
All the TmNs satisfy the Born structural stability criteria in terms of elastic constants except CrN and MoN that do not exist in equilibrium binary phase diagrams.
The groups IVB and V–VIB nitrides are associated with brittle and ductile behaviour based on G/B ratio, respectively.
Acknowledgment
The authors are grateful to the Ministry of Defence, Government of India, for financial support. The authors are indebted to Dr. Amol A. Gokhale, Director, Defence Metallurgical Research Laboratory (DMRL), Hyderabad, for his encouragement and Dr. R. Sankarasubramanian for many fruitful discussions. They extend their thanks to Director ANURAG, Hyderabad, for the provision of computational facilities and Shri A. Mondal for technical support.
References
[1] R.Buhl, H.K.Pulker and E.Moll, Thin Solid Films, 80 (1981) 265–270.10.1016/0040-6090(81)90233-9Search in Google Scholar
[2] R.B.Kaner, J.J.Gilman and S.H.Tolbert, Science, 308 (2005) 1268–1269.10.1126/science.1109830Search in Google Scholar
[3] P.Villars and L.D.Calvert, Pearson’s Handbook of Crystallographic Data for Intermetallic Phases, ASM International, Materials Park OH (1991) 44073.Search in Google Scholar
[4] J.C.Grossman, A.Mizel, M.Côté, M.L.Cohen and S.G.Louie, Phys. Rev. B, 60 (1999) 6343–6347.Search in Google Scholar
[5] S.Nagao, K.Nordlund and R.Nowak, Phys. Rev. B, 73 (2006) 144113–144116.10.1103/PhysRevB.73.144113Search in Google Scholar
[6] J.Chen, L.L.Boyer, H.Krakauer and M.J.Mehl, Phys. Rev. B, 37 (1988) 3295–3298.Search in Google Scholar
[7] R.Nowak, F.Yoshida, Y.Miyagawa and S.Miyagawa, Nucl. Instrum. Methods, Phys. Res. B, 148 (1999) 232–237.10.1016/S0168-583X(98)00841-6Search in Google Scholar
[8] Y.Gotoh, M.Y.Liao, H.Tsuji and J.Ishikawa, Jpn. J. Appl. Phys., 42 (2003) L778–L780.10.1143/JJAP.42.L778Search in Google Scholar
[9] P.Hohenberg and W.Kohn, Phys Rev., 136 (1964) B864.10.1103/PhysRev.136.B864Search in Google Scholar
[10] W.Kohn and L.Sham, J. Phys. Rev., 140 (1965) A1133.10.1103/PhysRev.140.A1133Search in Google Scholar
[11] Ab initio calculations, (1998–2006). http://www.abinit.orgSearch in Google Scholar
[12] X.Gonze et al., Comput. Mater Sci., 25 (2002) 478–492.10.1016/S0927-0256(02)00325-7Search in Google Scholar
[13] X.Gonze, Z. Kristallogr., 220 (2005) 558–562.Search in Google Scholar
[14] X.Gonze et al., Comput Phys. Commun., 180 (2009) 2582–2615.10.1016/j.cpc.2009.07.007Search in Google Scholar
[15] J.P.Perdew, K.Burke and M.Ernzerhof, Phys. Rev. Lett., 77 (1996) 3685–3688.10.1103/PhysRevLett.77.3685Search in Google Scholar
[16] S.Goedecker. SIAM J. Sci. Comput., 18 (1605) 1997.Search in Google Scholar
[17] M.C.Payne, Rev. Mod. Phys., 64 (1992) 1045–1098.10.1103/RevModPhys.64.1045Search in Google Scholar
[18] X.Gonze, Phys. Rev. B., 54 (1996) 4383–4386.Search in Google Scholar
[19] H.J.Monkhorst and J.D.Pack, Phys. Rev. B, 13 (1976) 5188–5192.10.1103/PhysRevB.13.5188Search in Google Scholar
[20] A.J.Kokalj. Mol Graphics Modell., 17 (1999) 176–179. http://www.xcrysden.org.10.1016/S1093-3263(99)00028-5Search in Google Scholar
[21] H.W.King, J. Mater. Sci., 1 (1966) 79–90.10.1007/BF00549722Search in Google Scholar
[22] X.J.Chen, V.V.Struzhkin, Z.G.Wu et al., Proc. Natl. Acad. Sci., 102 (2005) 3198–3201.10.1073/pnas.0500174102Search in Google Scholar
[23] H.L.Brown, P.E.Armstrong and C.P.Kempter, J. Chem. Phys., 45 (1966) 547–549.10.1063/1.1727602Search in Google Scholar
[24] J.O.Kim, J.D.Achenbach, P.B.Mirkarimi, M.Shinn and S.A.Barnett, J. Appl. Phys., 72 (1992) 1805–1811.10.1063/1.351651Search in Google Scholar
[25] V.P.Zhukov, V.A.Gubanov, O.Jepsen, N.E.Christensen and O.K.Anderson, J. Phys. Chem. Solids, 49 (1988) 841–849.10.1016/0022-3697(88)90037-6Search in Google Scholar
[26] B.Alling, A.Karimi and I.A.Abrikosov, Surf. Coat. Technol., 203 (2008) 883–886.10.1016/j.surfcoat.2008.08.027Search in Google Scholar
[27] K.Chen, L.R.Zhao and J.S.Tse, J. Appl. Phys., 93 (2003) 2414–2417.10.1063/1.1540742Search in Google Scholar
[28] D.G.Pettifor, Mater. Sci. Technol., 8 (1992) 345–349.10.1179/mst.1992.8.4.345Search in Google Scholar
[29] A.Riedl, R.Daniel, M.Stefenelli, T.Schöberl, O.Kolednik, C.Mitterer and J.Keckes, J. Scr. Mater., 67 (2012) 708.10.1016/j.scriptamat.2012.06.034Search in Google Scholar
[30] M.Born, Proc. Cambridge Philos. Soc., 36 (1940) 160.10.1017/S0305004100017138Search in Google Scholar
[31] E.J.Saur, H.D.Schechinger and L.Rinderer, IEEE Trans. Magn., 17 (1981) 1029.10.1109/TMAG.1981.1061053Search in Google Scholar
[32] N.J.Savvides, J. Appl. Phys., 62 (1987) 600–610.10.1063/1.339787Search in Google Scholar
[33] A.Bezinge, K.Yvon, J.Muller, W.Lengaurer and P.Ettmayer, Solid State Commun., 63 (1987) 141–145.10.1016/0038-1098(87)91183-5Search in Google Scholar
[34] B.Cendlewska, A.Morawski and A.Misiuk, J. Phys. F (Metal Phys.), 17 (1987) L71.10.1088/0305-4608/17/4/005Search in Google Scholar
[35] L.L.Jing Chen, B.H.Krakauer and M.J.Mehl, J. Phys. Rev. B, 37 (1988) 3295–3298.10.1103/PhysRevB.37.3295Search in Google Scholar
[36] W.Voigt, Lehrburch Der Kristallphysik, Teubner, Leipzig (1928).Search in Google Scholar
[37] A.Reuss, Ztschr Angew. Math. Mech., 9 (1929) 49.10.1002/zamm.19290090104Search in Google Scholar
[38] R.Hill, Proc. Phys. Soc. London A, 65 (1952) 349–454.10.1088/0370-1298/65/5/307Search in Google Scholar
[39] X.G.Lu, M.Selleby and Bo.Sundman, Acta Metall., 55 (2007) 1215–1226.10.1016/j.actamat.2006.05.054Search in Google Scholar
[40] S.F.Pugh, Philos. Magn., 45 (1954) 823–843.10.1080/14786440808520496Search in Google Scholar
[41] M.E.Fine, L.D.Brown and H.L.Marcus, Scripta Metall., 18 (1984) 951–956.10.1016/0036-9748(84)90267-9Search in Google Scholar
[42] A.W.Weimer, Carbide, Nitride and Boride Materials Synthesis and Processing, Chapman and Hall, London (1997).10.1007/978-94-009-0071-4Search in Google Scholar
©2016 by De Gruyter
This article is distributed under the terms of the Creative Commons Attribution Non-Commercial License, which permits unrestricted non-commercial use, distribution, and reproduction in any medium, provided the original work is properly cited.
Articles in the same Issue
- Frontmatter
- Research Articles
- Effects of Cations on Corrosion of Inconel 625 in Molten Chloride Salts
- Thermodynamic Analysis on the Minimum of Oxygen Content in the Deoxidation Equilibrium Curve in Liquid Iron
- Air Oxidation Behavior of Two Ti-Base Alloys Synthesized by HIP
- Generation of Constant Life Diagram under Elevated Temperature Ratcheting of 316LN Stainless Steel
- Effect of c-BN Size and Content on the Self-Propagating High-Temperature Synthesis of c-BN Composites Bonded with Ti-Al-C System Multiphase Products
- Effect of Welding Speeds on Mechanical Properties of Level Compensation Friction Stir Welded 6061-T6 Aluminum Alloy
- Simulation of Thermo-viscoplastic Behaviors for AISI 4140 Steel
- Transition Metal Nitrides: A First Principles Study
- The Constitutive Relationship and Processing Map of Hot Deformation in A100 steel
- Preparation of Granular Red Mud Adsorbent using Different Binders by Microwave Pore – Making and Activation Method
- On the Structure and Some Properties of LaCo Co-substituted NiZn Ferrites Prepared Using the Standard Ceramic Technique
- Effect of MgO and MnO on Phosphorus Utilization in P-Bearing Steelmaking Slag
- Dependence of Temperature and Slag Composition on Dephosphorization at the First Deslagging in BOF Steelmaking Process