Abstract
The gasification of a sub-bituminous coal using CO2–O2 gas mixtures was studied in a plasma-augmented fluidized bed gasifier. Firstly, the coal was chemically characterized and the gasification process was examined using Thermogravimetric and Differential Thermal Analysis (TGA/DTA) in CO2, O2 and at a CO2 to O2 ratio of 3 to 1. Secondly, the equilibrium gas compositions were obtained using the Gibbs free energy minimization method (HSC Chemistry®7). Thirdly, gasification tests were performed in a plasma-augmented fluidized bed and the off-gas temperatures and compositions were determined. Finally, for comparison purposes, control tests were conducted using a conventional fluidized bed coal gasifier and these results were compared to those achieved in the plasma-augmented fluidized bed gasifier. The effects of bed temperature and CO2 to O2 ratio were studied. For both gasifiers, at a given bed temperature, the off-gas compositions were in general agreement with the equilibrium values. Also, for both gasifiers, an experimental CO2 to O2 ratio of about 3 to 1 resulted in the highest syngas grade (%CO + %H2). Both higher off-gas temperatures and syngas grades could be achieved in the plasma-augmented gasifier, in comparison to the conventional gasifier. These differences were attributed to the higher bed temperatures in the plasma-augmented fluidized bed gasifier.
Introduction
Recently, there has been an increased interest in the utilization of carbon dioxide in coal processing, mainly because of environmental considerations, in particular reduced greenhouse gas emissions [1]. In a typical coal gasification process using air, a syngas containing carbon monoxide and hydrogen is produced and this can be utilized as a fuel. The off-gas contains about 15% carbon dioxide and at these levels it is not feasible to capture and sequester the carbon dioxide. For sequestration, it has been reported that carbon dioxide concentrations of over 90% are required [2]. Nitrogen can be removed from the air utilized in the gasification process. However, at high oxygen concentrations, the temperature becomes excessive and this can damage the reactor. To control the temperature, some steam can be added but this again dilutes the off-gas. Another potential gasification reagent is carbon dioxide and since this is present in the off-gas, the recycle of the off-gas is of interest [1–3]. As a result, there is considerable research effort being devoted to the gasification of coals in CO2–O2 environments [3, 4]. In a manner similar to steam, the presence of carbon dioxide lowers the operating temperature, but in the absence of nitrogen and/or steam, high concentrations of carbon dioxide in the off-gas should be feasible and this should facilitate capture and sequestration.
Another application for gasification technology is in the metallurgical industry, in particular in ironmaking, there is need for a high-grade syngas (%CO + %H2), which can be utilized as a reducing gas in alternative ironmaking processes or direct reduced iron (DRI) processes [5, 6]. Currently, blast furnace technology accounts for approximately 95% of the world’s iron production. Despite considerable research and development efforts, alternative iron production techniques, such as the DRI processes, have not been able to capture a significant portion of the iron production capacity. This situation is mainly attributed to the high productivity rates and the high efficiencies of modern blast furnaces. Reduction processes which can effectively utilize coal would likely have an economic advantage since deposits of these are widespread and long-term low-cost sources are available. The blast furnace process utilizes coal as the major source of fuel and also as a reducing agent. However, first the coal has to be converted into metallurgical coke, using specific coal grades with both high carbon contents and low impurities. Furthermore, the process of conversion of the coal into coke results in the release of emissions which are not environmentally acceptable. Both of these factors have resulted in a high production cost for metallurgical coke.
In alternative ironmaking processes, which utilize coal as the source of fuel and/or as a reducing agent there are two major options. Firstly, the gasification of the coal can occur in the same reactor as the reduction process and this results in efficient utilization of the coal. However, it is usually necessary to prepare the coal before it is added to the reduction process and/or select coals with very specific properties. Coals with large amounts of ash, some specific ash compositions and high sulfur contents are not suitable for this process since they have negative impacts on the reduction process and/or the metal composition. The second major option is to gasify the coal in a separate reactor so that the ash component in the coal cannot have any significant effect on the reduction process. Additionally, the majority of the sulfur in the coal can be removed either in the gasification reactor or between the gasification process and the ironmaking process. Thus, low-grade coals can be employed to produce iron. The major disadvantage is a decrease in efficiency in comparison to processes in which both the gasification and the reduction reactions occur in the same reactor. Furthermore, it has proven difficult to produce a syngas both with a high grade and at a high temperature.
Fluidization is the operation by which fine particles are transformed into a fluid-like state through contact with a gas or a liquid [7, 8]. One of the main advantages of fluidized bed technology is the thorough particle mixing, which results in essentially an isothermal bed, which prevents “hot spots,” which are typical of fixed bed processes. Temperature control is rarely a problem due to the significant particle motion and the very high bed-to-surface heat transfer. Another key advantage of this technology involves the fluid-like properties of the gas–solid mixture which allows for the addition and removal of solids. This facilitates improved process control and a more flexible technology. In recent years there has been a growing interest in the potential application of plasma technology for the processing of materials. In particular, in coal processing, there has been considerable interest in the combination of both plasma and fluidized bed technologies for coal gasification [9–11]. Firstly, the utilization of electrical energy for ignition eliminates the need for expensive fuels such as gaseous or liquid hydrocarbons. Secondly, in gasification or combustion processes, the electrical energy input can facilitate endothermic reactions such as the oxidation of the coal by carbon dioxide and also a higher grade (%CO + %H2) syngas may be obtained. Thirdly, the extra energy input can increase the coal processing rate without necessitating an increase in reactor size. Fourthly, lower grade coals can be employed and the coal can be processed at a coarser size, thus minimizing grinding requirements. Finally, there is potential for reduced emissions at higher temperatures, which can be achieved in plasma processes.
The aim of the present work was to investigate the effect of some electrical energy input, through the use of a plasma, on both the temperature and the composition of the syngas, which was generated by coal gasification in CO2–O2 atmospheres and also to compare the results with those from conventional gasification. Firstly, the sub-bituminous Highvale coal was characterized and also Thermogravimetric and Differential Thermal Analysis (TGA/DTA) tests were performed in order to predict the gasification characteristics of this particular coal. Secondly, equilibrium simulations were performed to determine the expected syngas compositions as a function of temperature. Finally, gasification tests were performed in a fluidized bed reactor, in which the electrical energy input was produced by a plasma arc. The results of these tests were compared to those observed for conventional fluidized bed coal gasification. The major variables studied in the tests were as follows: (1) the effect of bed temperature on both the grade and temperature of the off-gas and (2) the effect of the CO2 to O2 ratio on the grade of the off-gas.
Experimental
Raw materials characterization
Both the proximate and the ultimate dry analyses of the Highvale low-sulfur coal which was employed in this work are shown in Table 1. The volatile materials (VM) content of the coal was 33.2% and the ash content (ASH) was 16.9%. The carbon content was 61.0%, the hydrogen content was 3.6% and the sulfur content was 0.31%. The coal was crushed, ground and sieved to a size fraction of −48 + 100 mesh Tyler (−300 + 150 µm). This size fraction was chosen after a review of the literature indicated that coal with this size distribution should have good fluidization characteristics [12]. The coal was dried at 100°C overnight to remove the free moisture.
Proximate and ultimate analysis of Highvale coal (dry basis).
| Proximate analysis (mass percent) | % |
| VM | 33.21 |
| ASH | 16.85 |
| FCM | 49.81 |
| Ultimate Analysis (mass percent) | % |
| Carbon | 61.00 |
| Hydrogen | 3.64 |
| Nitrogen | 0.63 |
| Sulfur | 0.31 |
TGA/DTA studies
In order to better understand the reactions between the coal and the CO2–O2 gas mixtures, TGA/DTA studies were performed in a Netzsch STA 449, in which the sample was heated in a silicon carbide furnace. Samples weighing approximately 20 mg were placed in an alumina crucible and heated from room temperature to 1,200°C at a rate of 10°C/min. The reaction gas passed through the sample chamber at 80 ml/min and the following gas compositions were tested: pure O2, pure CO2 and a 3/1 CO2 to O2 ratio.
Fluidized bed gasifier
The fluidized bed gasifier consisted of four major parts: (i) the gas train, (ii) the fluidized bed reactor and the heating systems, (iii) the off-gas and gas analysis systems and (iv) the temperature monitoring system. These are described in more detail below.
Gas train
Argon, carbon dioxide and oxygen were fed into the system through flowmeters. The argon was employed to flush out the system prior to the experiment. Then, carbon dioxide and oxygen were introduced into the bed at predetermined flowrates. The gases passed through a diffuser, which ensured that the carbon dioxide and oxygen were mixed prior to entering the gasification chamber. At the completion of the experiment, argon was employed to stop the gasification process and to cool down the system.
Fluidized bed reactor and heating system
The gases entered the fluidized bed reactor via a porous, water-cooled, stainless steel mesh. This mesh in combination with the diffuser ensured that the gases were evenly distributed across the cross-section of the furnace. The reaction chamber consisted of a 10 cm in diameter by 36 cm in height quartz tube. This transparent tube permitted the direct observation of the fluidization conditions in the reactor. The bed could be heated by two techniques: (1) resistance heating for ignition for conventional gasification or (2) single-phase plasma arc heating as shown in Figure 1(a) and (b), respectively. In the conventional gasification tests, as shown in Figure 1(a), the reaction chamber was heated to the ignition temperature of about 600°C, using split Nichrome resistance heating elements. The heating elements operated at 90 V and 5.3 A, thus the power input was 0.48 kW. This reactor setup was used to establish a baseline for the coal gasification tests. In the single-phase plasma arc system, the arc was used for both ignition and post-ignition heating. The following power inputs were employed: 2.3 kW (75 A and 30 V), 2.6 kW (105 A and 25 V) and 3.6 kW (90 A and 40 V). The energy was transferred to the coal bed via the plasma arc, which was established between two graphite electrodes, which were 0.8 cm in diameter and 30 cm in length. The electrodes were threaded and screwed into water-cooled brass holders. The holders passed through an O-ring in the quartz tube which ensured that the system was gas-tight. The electrodes could be moved manually on a geared track and were connected to the power supply at the brass holders.
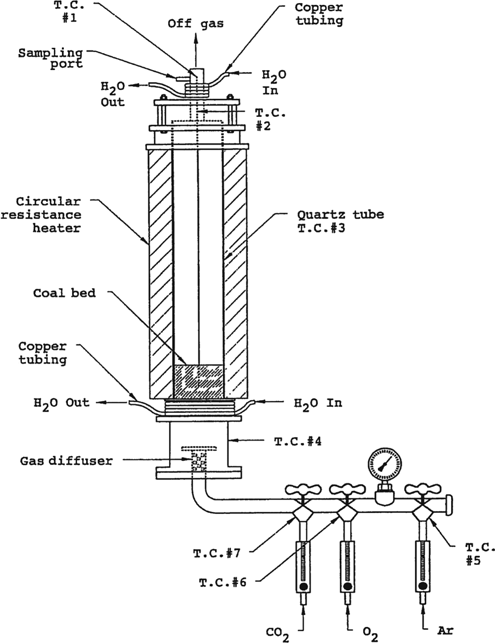
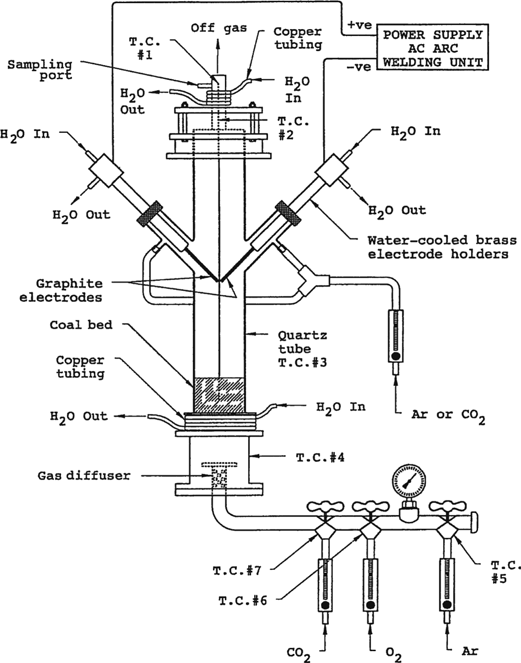
(a) Conventional fluidized bed coal gasification reactor. (b) Plasma-augmented fluidized bed coal gasification reactor.
During a typical experiment, 600 g of coal was weighed and placed into the gasifier. The coal was fluidized using argon gas for 15 minutes in order to flush the air out of the system. In the conventional gasification tests, the coal was preheated to 600°C, and then the CO2–O2 mixture was introduced into the system at the predetermined flowrates. In the single-phase plasma arc tests, the bed was both ignited by the arc and continuously heated. Only results for bed temperatures of over 650°C were considered in the analysis.
Off-gas system and gas analysis
The off-gases could be either vented into a fumehood or redirected using a butterfly valve into a gas sampling port. The gas was collected in a 0.1 L standard glass gas sampling tube, which had previously been evacuated to a pressure of 0.1 torr using a rotary vacuum pump. A number of gas sampling tubes were connected to the sampling port and then one of the valves was opened, drawing the off-gas sample through the gas sampling port into the sampling tube. All the gas samples were analyzed by gas chromatography (GC) for CO, H2, CO2 and CH4 (dry basis). Two standard gases were obtained from Canox, with the following compositions: (1) 59.32% CO, 7.17% CO2, 1.01% CH4 and 32.50% H2 and (2) 49% CO2 and 1% CO. Furthermore, individual calibration standards, of varying composition, for CH4, CO2, CO, H2 and air were used to establish the correction factors for the gas samples analyzed. Prepurified argon was used as the carrier gas to allow for the detection of hydrogen.
Temperature measurements
The temperature of the gas was measured at four locations as follows: (1) the gas inlet, (2) directly below the stainless steel mesh, (3) the bed and (4) the off-gas sampling port. All temperatures were measured every 30 seconds with Type K chromel-alumel thermocouples and the temperatures were recorded by a data acquisition system. When the off-gas temperature reached the desired temperature, a sample of the off-gas was obtained.
Results and discussion
TGA/DTA studies
Figure 2(a) and (b) shows the TGA and the DTA results for the Highvale coal, respectively, for pure O2, pure CO2 and a 3/1 CO2 to O2 mixture. The relationships between the drying, pyrolysis, gasification and combustion characteristics of various coals and the corresponding TGA and DTA plots have been discussed by a number of authors [13–16]. Prior to gasification or combustion, the mass loss is due to the release of moisture and devolatilization. The differences in the TGA and the DTA behaviors between CO2 and O2 can be explained in terms of the differing mechanisms in the coal conversion processes. In carbon dioxide, the primary mechanism of coal conversion to gaseous products is char gasification, an endothermic process which occurs at temperatures above 800°C, whereas in pure oxygen, the dominant mechanism is combustion, an exothermic reaction beginning at around 400°C [17]. It can be seen from the TGA results in Figure 2(a) that in pure oxygen the gasification/combustion rate is high, while in pure carbon dioxide, the ignition of the coal is significantly delayed and also the gasification/combustion rate is considerably reduced. Furthermore, the addition of some oxygen to carbon dioxide results in an intermediate behavior, with a decrease in the ignition temperature and an increase in the gasification/combustion rate. The area under the DTA plot in Figure 2(b) gives some idea of the exothermic energy released during gasification and combustion. The reaction of carbon dioxide with the coal generates much less energy than oxygen. Also, for carbon dioxide, the temperature range over which the energy is generated widens and shifts to higher temperatures in comparison to pure oxygen. Again as for the TGA results, the addition of some oxygen to the carbon dioxide gives intermediate results.
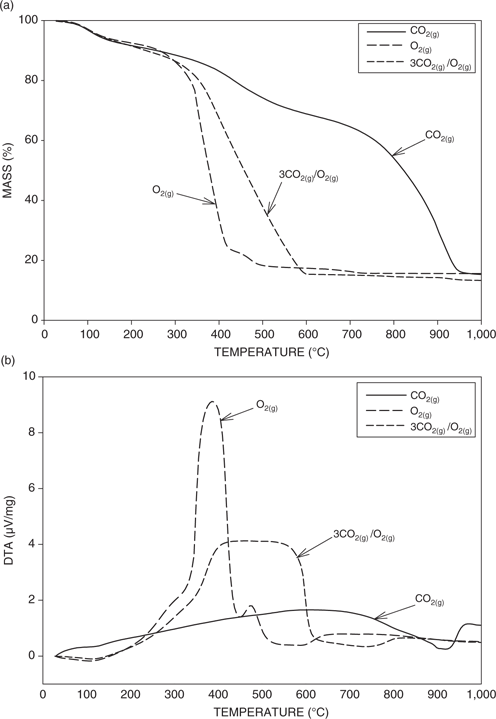
(a) TGA results for the three different gas compositions. (b) DTA results for the three different gas compositions.
Equilibrium simulations
Both kinetic and thermodynamic factors can influence any gasification process but if the gasification temperature is high then it could be expected that equilibrium would be closely approached. A number of equilibrium thermodynamic studies of coal gasification have been performed [18–20]. In general, there is reasonable agreement between the off-gas compositions and the equilibrium values at a given temperature. In the present work, the equilibrium calculations were performed using HSC Chemistry®7 [21]. This technique uses the Gibbs free energy minimization method to determine the equilibrium amounts of the various species at constant temperature and pressure. The gaseous species formed as a result of combusting the coal would be expected to consist of the elements which comprise the ultimate analysis, i.e., C, H, O, S and N as shown in Table 2. Normalizing the data with respect to wt%, converting to moles and then normalizing with respect to carbon gives the empirical chemical formula for the coal as CH0.72O0.21N0.0088S0.0037. Inputting these elements into the HSC program results in a possible 131 species but most of these would be considered unstable under the current gasification conditions. Species which were present in amounts less than about 1 × 10⁻⁶ kmole were excluded from the analysis. Thus, the species included in the calculations were CO2(g), CO(g), H2O(g), H2(g), N2(g), CH4(g), O2(g), COS(g), SO2(g), H2S(g), HS(g), NH3(g), NO(g) and the elements C and S.
Ignoring the various minor nitrogen- and sulfur-containing species and assuming that the majority of the oxygen is present as stable metal oxides, the gasification of this coal in a CO2/O2 environment should proceed according to the following overall reaction:
Calculation of the empirical formula (CHwOxNySz) of the Highvale coal based on the ultimate analysis.
| Element | (%) | Normalized (%) | Moles | Normalized (C) |
| Carbon | 61.00 | 73.64 | 6.137 | 1.00 |
| Hydrogen | 3.64 | 4.39 | 4.390 | w = 0.72 |
| Oxygen | 17.26 | 20.84 | 1.303 | × = 0.21 |
| Nitrogen | 0.63 | 0.76 | 0.054 | y = 8.80 × 10⁻³ |
| Sulfur | 0.31 | 0.37 | 0.023 | z = 3.75 × 10⁻³ |
| Total | 82.84 | 100.00 |
This results in a gas consisting of about 80% CO and 20% H2 on a molar basis. The two major factors determining the equilibrium off-gas compositions are the reaction temperature and the CO2 to O2 ratio of the input gas. Figure 3 shows the effect of temperature on the equilibrium composition of the gas for conditions similar to those utilized in the experiments. Also included is the amount of solid carbon. Although a large number of reactions are possible in coal gasification, the following are most important [22]: (i) partial oxidation, (ii) steam gasification and (iii) carbon dioxide gasification.
At room temperature, the gas consists of mainly carbon dioxide, water vapor and methane. Methane is relatively unstable, thus the amount decreases with increasing temperature according to the following reaction:
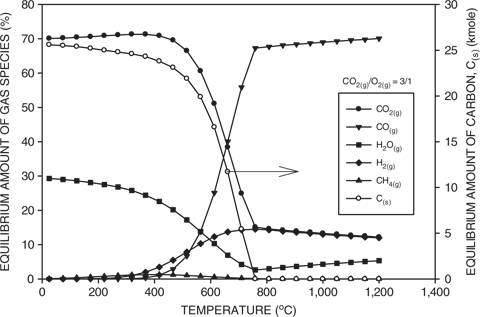
Calculated equilibrium amounts of gaseous species as a function of temperature for a CO2(g) to O2(g) ratio of 3/1. Also included is the amount of carbon.
By about 700°C most of the methane has disappeared. At low temperatures, the relatively slow decrease in the amount of carbon corresponds to both an increase in the amount of hydrogen and a decrease in the amount of water vapor. Consequently, at about 300°C, the water vapor begins to be decomposed by carbon to hydrogen and carbon monoxide by the water gas reaction as follows:
At about 500°C, the amount of carbon begins to drop off rapidly. By about 600°C, most of the water has been converted to hydrogen and the amount of hydrogen remains relatively constant. From about 400°C to 700°C, the amount of carbon monoxide increases, while the amount of carbon dioxide decreases according to the Boudouard reaction as follows:
At about 750°C, the carbon has been totally consumed and this corresponds to a minimum in the amount of water vapor and a significant lowering of the rate of carbon monoxide production from carbon dioxide. Above 700°C, the amounts of carbon monoxide and water vapor increased slowly, while the amounts of carbon dioxide and hydrogen decreased, indicating that the higher temperature equilibrium is determined by the reversible water–gas shift reaction:
Based on the above analysis, it can be seen that at low temperatures, the gas composition is mainly determined by the gas–solid reaction between water vapor and carbon. At intermediate temperatures, the gas–solid reaction between carbon dioxide and carbon predominates. Once the carbon is totally consumed, then the equilibrium is controlled by the gas–gas reaction between carbon dioxide and hydrogen. Above about 750°C and in the absence of carbon, only relatively small changes in the gas composition are possible. Consequently, in a coal gasification process, the gas composition will be determined by the conditions in the bed and only marginal changes in the gas composition would be expected after it leaves the bed.
Figure 4 shows the effect of the CO2 to O2 ratio on the gas composition at a temperature of 800°C. Also included is the amount of solid carbon. At low ratios and large amounts of carbon, the gas mainly consists of carbon dioxide and hydrogen. As the ratio increases, the amount of solid carbon decreases. Consequently, the amount of carbon monoxide increases according to reaction (4) and this dilutes the amount of hydrogen. However, once all the carbon is consumed, then further increases in the CO2 to O2 ratio dilute the off-gas with carbon dioxide. As a result, the amount of carbon monoxide decreases, while the amount of carbon dioxide increases. Additionally, when all of the carbon has been consumed, then the reaction equilibrium is determined by reaction (5), and the reaction of hydrogen with carbon dioxide results in an increase in the amount of water vapor.
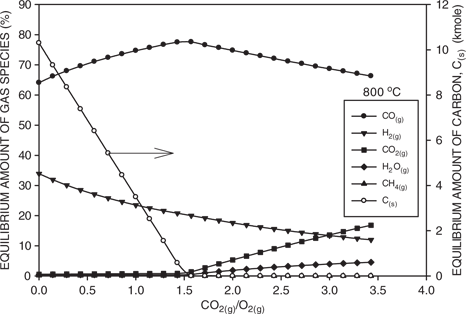
Calculated equilibrium amounts of gaseous species as a function of the CO2(g) to O2(g) ratio at 800°C. Also included is the amount of carbon.
Bed and off-gas temperatures
Figure 5(a) and (b) shows the typical bed and off-gas temperatures versus time for conventional gasification and plasma arc heating of the bed, respectively. It can be seen that the curve for the bed temperature consisted of four stages. In Stage I, the temperature increased slowly during devolatilization and bed ignition. This was followed by a rapid increase in temperature (Stage II) as the coal combusted and then in Stage III the rate of temperature increase decreased as the amount of coal available for gasification decreased. Finally, in Stage IV, after a maximum temperature was achieved, the temperature began to decrease as there was insufficient coal to maintain the maximum bed temperature. On the other hand, the rate of increase of the off-gas temperature was relatively constant as the heat of the bed was transferred to the upper chamber. A maximum was reached at the maximum bed temperature and then, the off-gas temperature decreased. In the conventional gasification tests, on average about 39% of the coal was consumed in 5,534 s for a coal gasification rate of 0.042 g/s. In the plasma arc runs, about 50% of the coal was consumed in 2,405 s for a coal gasification rate of 0.125 g/s. Thus, it can be seen that with the presence of the plasma arc in the bed, the gasification rate was about three times higher than that observed in conventional gasification.
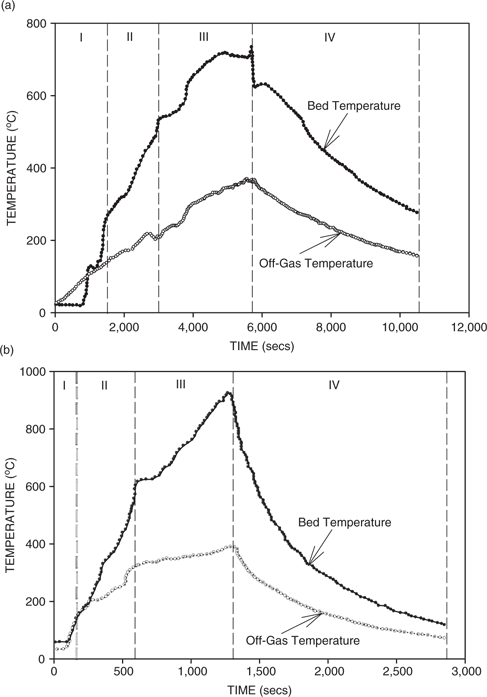
(a) Bed and off-gas temperature as a function of time for conventional gasification.(b) Bed and off-gas temperature as a function of time for plasma gasification.
Figure 6(a) and (b) shows the off-gas temperature as a function of bed temperature for the two different gasification conditions. For the case of conventional gasification, the bed temperature varied from about 680°C to 790°C and the off-gas temperature increased only slightly with the bed temperature and varied in the range of about 370°C to 430°C. For plasma arc heating of the bed, the bed temperature varied from about 830°C to almost 970°C, while the off-gas temperature varied from about 390°C to 405°C. For the conventional and plasma arc gasification tests, the off-gas temperatures were typically around 400°C and exhibited a slight increase with the bed temperature, reflecting the increased heat transfer to the upper portions of the chamber. For conventional gasification, the processing times were longer than plasma arc heating, and this allowed for increased heat transfer and thus relatively high off-gas temperatures despite the lower bed temperatures. Also this resulted in a slightly higher increase in the rate of increase of the off-gas temperature with bed temperature for conventional gasification in comparison to plasma arc heating.
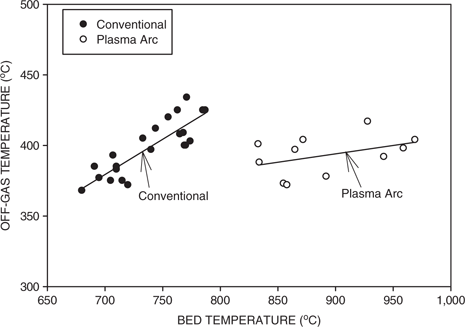
Off-gas temperature as a function of bed temperature for conventional and plasma arc fluidized bed gasification.
Off-gas compositions
Figure 7 shows the typical off-gas compositions for both conventional and plasma arc processing as a function of temperature. As discussed previously, the conventional processing temperatures were lower than the plasma arc temperatures but the data points for both test conditions followed common trends. The amount of carbon monoxide increased with temperature, while the amounts of methane, hydrogen and carbon dioxide decreased with increasing temperature. This behavior is consistent with the equilibrium predictions as discussed previously and shown in Figure 3. Additionally, the experimentally determined numerical values for each of the gas components were in reasonable agreement with the equilibrium values.
Figure 8 shows the effect of the CO2 to O2 ratio on the experimental syngas composition, which was averaged over the various bed temperatures, for both conventional and plasma arc gasification. Also included are the equilibrium compositions calculated at the average bed temperatures. Again, it can be seen that there is reasonably good agreement between the measured and the equilibrium values. However, it should be kept in mind that kinetic factors also play a significant role in the experimental values. It can be noted that maxima occur in the experimental values at a CO2(g) to O2(g) ratio of about 3. At values below the maxima, the amount of CO2(g) is relatively low and this results in lower values of carbon monoxide. At values beyond the maxima, there is insufficient time for the carbon dioxide to react with the carbon in the coal and thus the syngas is diluted.
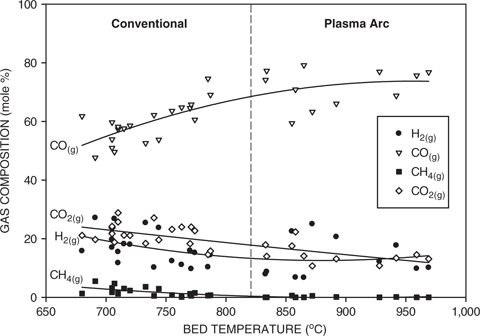
Effect of bed temperature on the gas composition for both conventional and plasma arc processing.
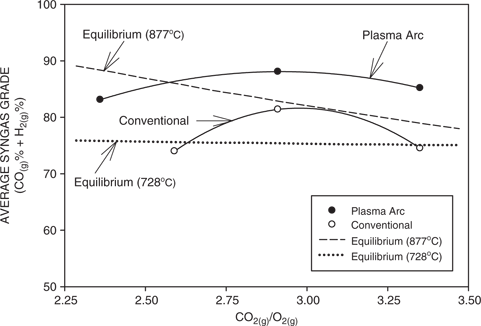
Average syngas grade (%CO(g) + %H2(g)) as a function of the CO2(g) to O2(g) ratio for both conventional and plasma arc gasification. Also included are the calculated equilibrium syngas grades at the average temperatures of 728°C and 877°C for conventional and plasma arc gasification, respectively.
Figure 9 shows the syngas (%CO + %H2) grade as a function of temperature for the conventional and plasma arc tests in the CO2/O2 atmospheres. Also included are some typical syngas grades for the Winkler process [23], various U-Gas operations [24] and the Westinghouse process [25]. It can be seen that for the results from the present study, the grade increased with temperature and higher grades were obtained with the plasma arc gasifier due to the higher bed temperatures. The average grades were 76% and 85% in the conventional and plasma arc gasifiers, respectively. For the Winkler process, the various U-Gas operations and the Westinghouse process, the grades varied over a similar range of about 75–85%. These processes used H2O/O2 to gasify the coal and thus the hydrogen to carbon ratios of the off-gas were much higher than in the present work. However, despite considerable differences in the conditions, the syngas grades are in reasonable agreement with those observed in the present work for CO2/O2. Replacing carbon dioxide by water vapor as a reagent in eq. (1) simply increases the amount of hydrogen relative to carbon monoxide. Also, once the gas exits the bed then the final equilibrium gas composition is determined by the water–gas shift reaction according to eq. (5). When water is utilized as a gasifying agent then the amount of hydrogen in the off-gas increases, while if carbon dioxide is used then the amount of carbon monoxide increases. However, the syngas grade ((%CO + %H2) remains relatively constant at a given temperature.
Conclusions
Highvale sub-bituminous coal was characterized with regard to its chemical composition and an empirical chemical formula for the coal was derived based on the carbon, hydrogen, oxygen, nitrogen and sulfur contents. TGA/DTA studies of the gasification characteristics of the coal were performed in pure oxygen, pure carbon dioxide and at a CO2(g) to O2(g) ratio of three. In comparison to oxygen, gasification of coal by carbon dioxide requires a higher energy input and a higher gasification temperature. The addition of some oxygen to the carbon dioxide results in lower energy requirements and thus a decrease in the gasification temperature.
Using the empirical formula of the coal, thermodynamic calculations were performed using HSC Chemistry®7 to determine the equilibrium compositions of the gas as a function of temperature and the CO2(g) to O2(g) ratio. Above about 600°C, the grade of the syngas increased rapidly and then more slowly above about 800°C. At a given temperature, there was a critical CO2(g) to O2(g) ratio, which corresponded to the consumption of all the carbon. Below this ratio the grade decreased slowly, but above the critical ratio there was a dramatic decrease in the syngas grade due to dilution by carbon dioxide.
A plasma arc-based fluidized bed coal gasifier was tested and the gasification characteristics of the sub-bituminous coal were compared to the results obtained in a conventional fluidized bed gasifier. The bed temperatures in the plasma arc gasifier were higher than in the conventional fluidized bed gasifier and this resulted in higher carbon monoxide contents and as a result, higher syngas grades. The gas compositions were in general agreement with the equilibrium values at a given temperature. The maximum syngas grades in both the conventional and the plasma arc gasification processes were obtained at a CO2(g) to O2(g) ratio of about 3/1.
The gasification rate in the plasma-augmented fluidized bed gasifier was about three times higher than in the conventional fluidized bed gasifier. Under the optimum conditions in the fluidized bed gasifier, an average syngas grade of about 76% could be achieved, while in the plasma arc gasifier, an average syngas grade of about 85% could be realized. These grades are in agreement with those reported by other researchers for fluidized bed reactors using H2O/O2.
Acknowledgments
The authors wish to thank the Natural Sciences and Engineering Research Council of Canada (NSERC) for supporting this research.
References
1. IrfanMF, UsmanMR, KusakabeK. Energy2011;36:12–40.Search in Google Scholar
2. WoycenkoDM, van de KampL, RobertsPA. Report No. JOU2-CT92-0093, IFRF Doc F98/Y/4, Summary of the APG Research Program, 1995.Search in Google Scholar
3. CifernoJP, PoutTE, JonesAP, MurphyJT. Chem Eng Prog2009;105:33–41.Search in Google Scholar
4. ChmielniakT, PopowiczJ. Chemik2013;67:415–22.Search in Google Scholar
5. DashRN, DasC. J of Eng Innov Res2009;1:23–33.Search in Google Scholar
6. ChatterjeeA. Sponge iron production by direct reduction of iron oxide. Chapter 7. New Delhi: Published by A. K. Ghosh, PHI Learning Private Limited, 2010:243–70.Search in Google Scholar
7. TavoulareasES. Annu Rev Energy Environ1991;16:25–57.10.1146/annurev.eg.16.110191.000325Search in Google Scholar
8. BasuP. Chem Eng Sci1999;54:5547–57.Search in Google Scholar
9. FlamantG. Pure & App Chem1994;66:1231–8.10.1351/pac199466061231Search in Google Scholar
10. AskarovaAS, KarpenkoEI, MesserleVE, UstimenkoAB In: 35th EPS Conference on Plasma Phys., Hersonissos, Greece, 9–13 June 2008 ECA Vol.32D, P-5.148 (2008).Search in Google Scholar
11. MesserleVE, UstimenkoAB. High Temp Mater Process2012;16:97–107.Search in Google Scholar
12. PsofogiannakisM. PhD. Eng Thesis, Carleton University, Ottawa, 1982.Search in Google Scholar
13. CahyadiAS, NugrohoYS. Energy Procedia2013;37:1423–34.Search in Google Scholar
14. MengF, YuJ, TahmasebiA, HanY. Energy Fuels2013;27:2923–32.Search in Google Scholar
15. LiZ, ZhangX, SugaiY, WangJ, SasakiK. J Combust2013;2013:15.Search in Google Scholar
16. LiQ, ZhaoC, ChenX, WuW, LiY. J Anal Appl Pyrolysis2009;85:521–8.Search in Google Scholar
17. BellDA, TowlerBF, FanM. Coal gasification and its applications. Chapter 3. Oxford: Published by William Andrew, Kidlingon, 2011:35–71.10.1016/B978-0-8155-2049-8.10003-8Search in Google Scholar
18. WatkinsonAP, LucasJP, LimCJ. Fuel1991;70:519–27.Search in Google Scholar
19. LiX, GraceJR, WatkinsonAP, LimCJ, ErgüdenlerA. Fuel2001;80:195–207.Search in Google Scholar
20. ShabbarS, JanajrehI. Ener Conserv Manage2013;65:755–63.Search in Google Scholar
21. RoineA. HSC Chemistry®7, chemical reaction and equilibrium software with thermochemical database and simulation module. Pori, Finland: Outotec Research Oy, 2013.Search in Google Scholar
22. LeeS. Handbook of alternative fuel technologies. Chapter 2. Boca Raton, FL, USA: CRC Press, Taylor & Francis Group, LLC, 2007:25–76.Search in Google Scholar
23. BanchikIN. Clean fuels from coal symposium II. Chicago: Institution of Gas Technology, 1975:359.Search in Google Scholar
24. LeppinD, GoyalA. Advances in coal utilization technology IV. Denver, CO: Institute of Gas Technology, 1981.Search in Google Scholar
25. Westinghouse Fuels Division. Coal gasification – clean fuels chemical feedstocks. Madison, WI: Westinghouse Electrical Corporation, 1981.Search in Google Scholar
©2016 by De Gruyter
This article is distributed under the terms of the Creative Commons Attribution Non-Commercial License, which permits unrestricted non-commercial use, distribution, and reproduction in any medium, provided the original work is properly cited.
Articles in the same Issue
- Frontmatter
- Research Articles
- The Effect of Aging Heat Treatment on the Microstructure and Mechanical Properties of 10Cr20Ni25Mo1.5NbN Austenitic Steel
- Weldability Characteristics of Sintered Hot-Forged AISI 4135 Steel Produced through P/M Route by Using Pulsed Current Gas Tungsten Arc Welding
- Marker Method in Studying the Defect Structure in Products of the Oxidation of Highly Disordered Substrates
- Research on the Semi-Solid Compressive Deformation Behavior of Ti-7Cu Alloy
- Numerical Prediction of the Thermodynamic Properties of Ternary Al-Ni-Pd Alloys
- Study on Control of Inclusion Compositions in Tire Cord Steel by Low Basicity Top Slag
- An Improved Arrhenius Constitutive Model and Three-Dimensional Processing Map of a Solution-Treated Ni-Based Superalloy
- Reaction between Steel-Making Slag and Carbonaceous Materials While Mixing with High Density Polyethylene
- Mechanism Research on Melting Loss of Coppery Tuyere Small Sleeve in Blast Furnace
- Research on Fracture Toughness of Flattened Brazilian Disc Specimen after High Temperature
- Plasma-Augmented Fluidized Bed Gasification of Sub-bituminous Coal in CO2–O2 Atmospheres
- Structure and Properties of the Aluminide Coatings on the Inconel 625 Superalloy
- Dynamic Transmission Performances of Alumina and Mullite Refractory Ceramics in Microwave High-Temperature Heating

![Figure 9: Syngas grade as a function of bed temperature for conventional and plasma arc processing. Also included are the results for the Winkler [23], U-Gas [24] and Westinghouse [25] processes using steam gasification.](/document/doi/10.1515/htmp-2014-0162/asset/graphic/htmp-2014-0162_figure9.gif)
