Preparation of high surface area activated carbon from Eupatorium adenophorum using K2CO3 activation by microwave heating
-
Hongying Xia
Hongying Xia is an Associate Professor at Kunming University of Science and Technology. He is mainly engaged in microwave heating in application of metallurgy, chemical engineering and material.
Jinhui Peng is a PhD supervisor at Kunming University of Science and Technology. He is mainly engaged in microwave heating in application of metallurgy, chemical engineering and materials science. He has received many awards, among which are the State Technological Invention Award and the Natural Science Award of Kunming province.
Libo Zhang is a PhD supervisor at Kunming University of Science and Technology. He is mainly engaged in microwave heating in the application of metallurgy, chemical engineering, material, etc.


Abstract
The present study attempts to utilize Eupatorium adenophorum to prepare high surface area activated carbon (HSAAC) with K2CO3 activation using microwave heating. The operational variables including microwave power, K2CO3/C mass ratio and heating time on the adsorption capability and yield were identified. Additionally, the surface characteristics of HSAAC were characterized by nitrogen adsorption isotherms, X-ray diffraction, Fourier transform infrared (FTIR) spectroscopy and scanning electron microscopy (SEM). The optimum conditions resulted in HSAAC with an iodine number of 1696 mg/g and a yield of 32.88%. The Brunauer-Emmett-Teller (BET) surface area and total volume were 2768 m2/g and 1.149 ml/g, respectively. The findings strongly support the feasibility for preparation of HSAAC from E. adenophorum by microwave heating.
1 Introduction
The increasing appeals for species diversity conservation and environment protection and the global invasion of flora forces more and more countries to focus on species protection. Significant efforts are made globally to explore multipurpose utilization technologies to dispose of the invasive alien species. At present, Eupatorium adenophorum is a kind of global exotic weed originating from Mexico which has spread extensively in many countries around the world such as America, Australia and the countries in Southeast Asia [1]. Since the 1940s, E. adenophorum has spread extensively in Southwest China. Many farm lands, pasture fields and forests have been destroyed, causing huge economic losses. This has been drawn to the attention of the society and many methods have been developed to control it, such as manual, chemical and biological means, however without any realistic means to eradicate it [2, 3]. There is a large amount of E. adenophorum in Yunnan Province of China – more than 12,000,000 tons. Compared with simple control processes, utilization of the weed provides more benefits [4].
Activated carbon is widely used in a variety of industries for applications which include separation/purification of liquids and gases, removal of toxic substances, and as catalysts and catalyst support because of their abundantly developed pore structure, strong adsorption ability, high surface area and thermostability [5, 6]. With the development of technology, the applications of activated carbon keep expanding, with newer applications such as super-capacitors, electrodes, gas storage, and so on [7–9]. Activated carbon has been produced from different materials like wood, sawdust, coconut shell, almond shell, feces of silkworms and so on [10–13].
Generally, activated carbon was prepared either by physical or chemical activation [14]. In physical activation, the gasification of char is performed at high temperature with steam, carbon dioxide or a mixture of both [15–18]. In chemical activation, the precursor is impregnated with chemical agents like K2CO3 [19–21], KOH [22, 23], ZnCl2 [24], H3PO4 [25, 26] and the activation is at comparatively lower temperatures than the physical activation, however it involves a washing stage wherein the respective salts are removed from the activated material.
The conventional heating method results in surface heating from the hearth wall, which does not ensure a uniform temperature as it is based on heat transfer through conduction and convection [27]. Microwave heating is volumetric and the heat is generated from inside the material as the materials receive energy through dipole rotations and ionic conduction [24]. Microwave heating has been proved beyond doubt to possess qualities such as fast heating, is energy efficient, easy to control, and has small thermal inertia and selective heating. Application of microwave heating is increasingly being adopted for processes such as biomass conversion, activated carbon preparation and so on [28–31].
The present work attempts to utilize E. adenophorum to prepare high surface area activated carbon (HSAAC) with K2CO3 activation by microwave heating. Effects of microwave power, K2CO3/C mass ratio and heating time on the yield and iodine number of HSAAC were evaluated systematically. The resultant product was characterized using the nitrogen adsorption isotherm, Fourier transform infrared (FTIR) spectroscopy, X-ray diffraction and scanning electron microscopy (SEM) analysis.
2 Materials and methods
2.1 Materials
Eupatorium adenophorum obtained from Kunming, Yunnan Province, China was crushed to a size of 5–7 mm and washed thoroughly with distilled water; it was then oven-dried (Taisite company, Zhengzhou, Henan, China) at 110°C and stored in a moisture-free environment for further experiments. The proximate analyses of E. adenophorum are shown in Table 1. K2CO3 (Tianjin Chemicals Reagent, Tianjin, China) with analytical grade was used as the activation agent. High purity nitrogen was used to provide the inert atmosphere.
Proximate analyses of Eupatorium adenophorum.
| Content | Volatile matter (wt.%) | Fixed carbon (wt.%) | Ash (wt.%) |
| Value | 76.41 | 21.69 | 1.90 |
2.2 Preparation of HSAAC
2.2.1 Carbonization of E. adenophorum:
Carbonization was performed in a muffle furnace by electric heating, and E. adenophorum was loaded on to a ceramic crucible. The sample was heated up to a carbonization temperature of 500°C at a heating rate of 10°C/min and was held for 2 h under N2 (100 cm3/min) flow; the carbonization yield was about 30%. After carbonization, the sample was cooled down under N2 (100 cm3/min) flow, and the char was crushed and sieved to obtain particles with sizes ranging from 600 μm to 1000 μm.
2.2.2 Microwave heating system and preparation of HSAAC:
A diagram of the microwave heating oven, which was employed in the preparation of HSAAC, is shown in Figure 1. The activation was carried out in a 2.45 GHz microwave oven (WP1000) with suitable modification. Approximately 8 g of char was mixed uniformly with K2CO3 according to a certain K2CO3/C mass ratio. The reaction was carried out in a ceramic crucible reactor fixed in the chamber of the microwave oven. N2(300 cm3/min) flow was used to purge any air in the chamber before the microwave heating process and it continued to flow through the chamber during the whole process. The activated sample was rapidly transferred to the beaker loaded with distilled water after the microwave heating, and washed with volume ratio 50% HCl to eliminate the residual alkali. Then, the sample was washed with hot distilled water, until the pH of the filtrating solution was 6.5–7. Finally, the sample was dried at 110°C for 12 h. The activated sample with high temperature was rapidly transferred to the distilled water for the gasification reaction char to produce more holes. The experimental variables of microwave power (400 W, 500 W, 600 W and 700 W), K2CO3/C mass ratio (0.5, 1.0, 1.5, 2.0 and 2.5) and heating time (10 min, 15 min, 20 min, 25 min and 30 min) on the yield and iodine number of HSAAC were evaluated. The yield was calculated by equation:
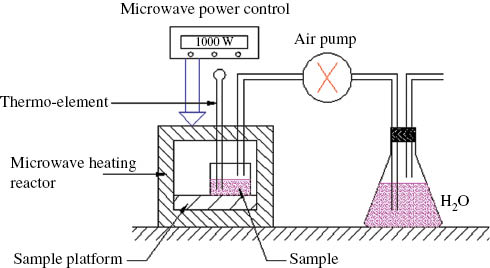
Diagram of the preparation of high surface area activated carbon (HSAAC) from Eupatorium adenophorum char with K2CO3 activation by microwave heating.
where M is weight of HSAAC and M0 is weight of char.
2.3 Characterization
The standard testing method of PR China (GB/T12496.8-1999) [32] was used for testing the iodine adsorption number of prepared HSAAC produced from the activation step. The porosity of the resultant sample was characterized with N2 adsorption at -196°C using an automatic adsorption apparatus (Autosorb-1-C, Quantachrome). HSAAC was initially outgassed at 300°C for 12 h at vacuum conditions prior to testing. The surface area was calculated by the Brunauer-Emmett-Teller (BET) method. The total pore volume was determined at a relative pressure (P/P0) of 0.98. The t-plot method was applied to calculate the micropore volume and external surface area, and the mesopore volume was obtained by deducting the micropore volume from the total pore volume. In addition, the pore size distribution was determined by use of the non local density function theory (NLDFT) method. FTIR spectroscopy was applied to qualitatively identify the chemical function groups present in the HSAAC. An FTIR spectrum was operating in the range of 4000–400 cm-1 by using an AVATAR 330 (Thermo Nicolet Co., USA) spectrophotometer. The transmission spectra of the sample were prepared by mixing with KBr crystals and pressing into a pellet. The microstructure was analyzed using a scanning electron microscope (Philips XL30ESEM-TMP).
3 Results and discussion
3.1 Effects of microwave power on adsorption capacity and yield of HSAAC
Figure 2 shows the effect of microwave power on the iodine number and yield of HSAAC at the K2CO3/C mass ratio of 2.0 and heating time of 20 min. It was clearly indicated that the iodine number of HSAAC increased gradually with increasing microwave power. The yield of HSAAC decreased progressively with increasing microwave power. This was due to the formation of K2O and CO2 arising from the decomposition of K2CO3, giving rise to the formation of pores of carbon. Meanwhile, K2CO3 and K2O were reduced by carbon to form K and CO2 so that more pores were formed. Furthermore, when the temperature reached the boiling point of potassium, 762°C, potassium would diffuse into the layers of carbon, also causing the formation of more pores [33]. So, the temperature was determined by microwave power directly; greater microwave power and higher temperatures form more pores. However, with further irradiation beyond the optimum power, the pores were widened and burned off resulting in reduction in adsorption capacity.
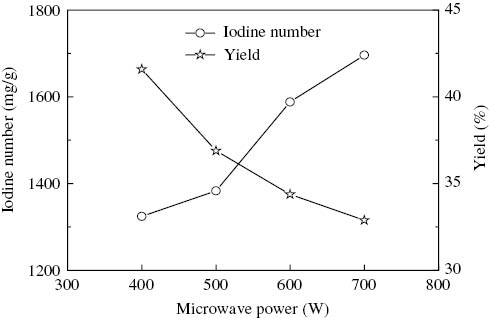
Effect of microwave power on iodine number and yield of high surface area activated carbon (HSAAC).
3.2 Effect of K2CO3/C ratio on adsorption capacity and yield of HSAAC
It is important to understand that the potassium carbonate to char ratio is the most influencing factor on the porosity of HSAACs [19–21]. Figure 3 shows the effect of K2CO3/C mass ratio on iodine number and the yield of HSAAC under the experimental conditions of microwave power 700 W and heating time 20 min. It was clearly observed that the iodine number of HSAAC increased gradually, reached the maximum value at the K2CO3/C mass ratio of 2.0, and then decreased with increasing K2CO3/C mass ratio. The yield of HSAAC decreased progressively with increasing K2CO3/C mass ratio, for the deepening reaction of K2CO3 to the char. When the ratio was lower than 2.0, the carbon on the active site reacted incompletely and only a few pores formed. With increasing the K2CO3/C mass ratio, the activation reaction would be deepened and many more pores would be formed. When the K2CO3/C mass ratio reached 2.0, the carbon on the active site had reacted completely and resulted in the maximum amount. The pore would be widened and burnt off when the K2CO3/C mass ratio is more than 2.0 [33].
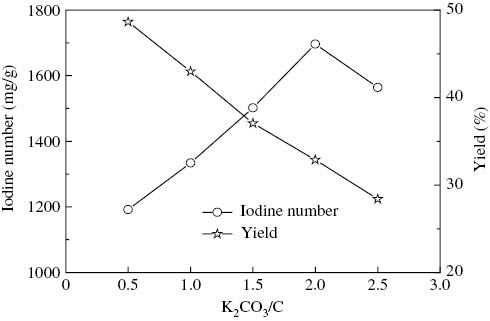
Effect of K2CO3 ratio on iodine number and yield of high surface area activated carbon (HSAAC).
3.3 Effect of heating time on adsorption capacity and yield of HSAAC
Figure 4 show the effect of heating time on iodine number and the yield of HSAAC under the conditions of microwave power 700 W and K2CO3/C mass ratio 2.0. It was clearly revealed that the iodine number of HSAAC increased gradually from 1028 mg/g to 1696 mg/g when heating time increased from 10 min to 20 min, and then decreased a little when heating time was further increased. The activation degree corresponded to the heating time; the longer the heating time, the more pores formed in the carbon. However, when heating time was over a certain value, the pores would be burnt off and the iodine number and yield of HSAAC would be lower.
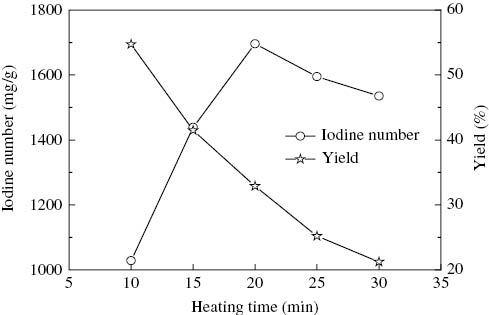
Effect of heating time on iodine number and yield of high surface area activated carbon (HSAAC).
3.4 Pore structures characterization
It is well known that pore volume and surface area are important indicators of the adsorption capacity of an adsorbent. Figure 5 show the N2 adsorption isotherm exhibited by char and HSAAC prepared in the optimization conditions: a K2CO3/C mass ratio of 2.0, a heating time of 20 min and a microwave power of 700 W.
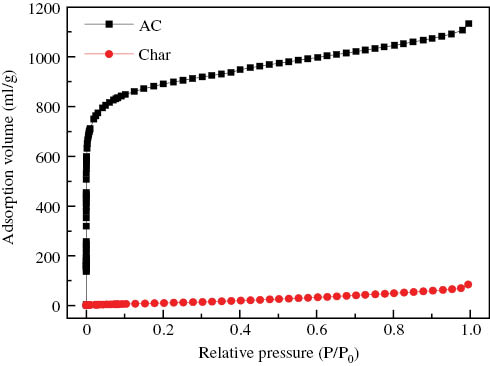
Nitrogen adsorption isotherms of char and high surface area activated carbon (HSAAC).
It can be ascertained from Figure 5 that the N2 adsorption isotherm of char is evidenced by the type II of the referred IUPAC classification [34]. N2 adsorption quantity is very small and increases slowly for the char, which indicated that the char has only a few pores. The N2 adsorption quantity of the resultant HSAAC is higher than the char, clearly indicating the higher amount of pores in HSAAC. The isotherm shape of the HSAAC belongs to type I of the referred IUPAC classification, as reflected by its initial adsorption and flatter plateau region at higher relative pressure. When the relative pressure (P/P0) is below 0.1, N2 adsorption increases quickly for the HSAAC. When the relative pressure reaches 0.1, the adsorption capacity reaches 75% of saturation adsorption capacity. After a sharp increase up to 0.1 of relative pressure, the isotherm shows a very small increment in the further adsorption. This suggests that the HSAAC made from E. adenophorum would be more microporous with a narrow pore size distribution. However, the isotherm also displayed a pronounced hysteresis loop, indicating the presence of mesopores.
In accordance to the classification adopted by the IUPAC, adsorbent pores are classified into three groups: micropore (<2 nm), mesopore (2–50 nm), and macropore (>50 nm) [34]. Figure 6 shows the pore size distribution of the char and HSAAC obtained by NLDFT analysis from N2 adsorption isotherms. The pores of char are not very obvious and underdeveloped especially, and the pore size distribution curve suggested predominant mesopores owing to the sharp increase of the pore size distribution curve to pore diameter >3 nm. The pore size distribution of HSAAC suggested predominant micropores owing to the sharp increase of pore size distribution curve to pore diameter <0.8 nm. Most of the pores concentrate at 0.7 nm; activated carbon has a very wide distribution between 1 nm and 2 nm, and a few mesopores >2 nm.
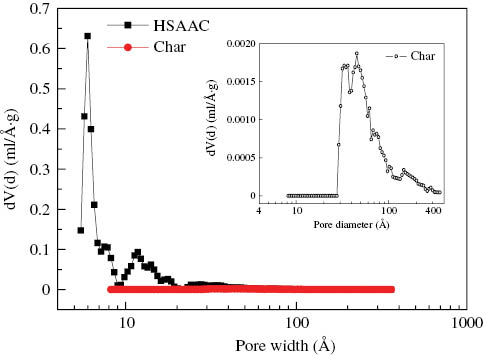
Pore size distribution of char and high surface area activated carbon (HSAAC).
The pore structural parameter of char and HSAAC derived from E. adenophorum is shown in Table 2. As can be seen from Table 2, a comparison of the quality of HSAAC with the char exhibits a significant increase in the pore volume, the micropore volume and the surface area attributed to the activation process. Also, the char only has a few mesopores, and it has no micropores.
Pore structural parameter of high surface area activated carbon (HSAAC) versus char.
| Properties | AC | Char |
|---|---|---|
| BET Surface area (m2/g) | 2768 | 61 |
| Micropore surface area (m2/g) | 2230 | 0 |
| External surface area (m2/g) | 538 | 61 |
| Total Pore volume (ml/g) | 1.717 | 0.109 |
| Micropore volume (ml/g) | 1.149 | 0 |
| Mesopore volume (ml/g) | 0.568 | 0.109 |
| Average pore diameter (nm) | 2.482 | 7.15 |
Table 3 compares the surface area of various activated carbons prepared using different activation agents utilizing different precursors as reported in literature. Although it is a small sample from the large number of activated carbons reported in literature, the high surface area of the activated carbon prepared in the present work as compared with the literature is clearly evident. A surface area as high as 2768 m2/g is very rarely reported in literature, which could form the basis for additional work on exploring the combination of E. adenophorum precursor with the K2CO3 activation agent.
Comparison surface area of activated carbon with different activation agent.
| Activating agent | Precursor | Heating method | SBE(m2/g) | References |
|---|---|---|---|---|
| K2CO3 | Eupatorium adenophorum | Microwave heating | 2768 | Present study |
| Sisal waste | Conventional heating | 1038 | [19] | |
| Edible fungi residue | Microwave heating | 684 | [20] | |
| Waste PET | Conventional heating | 1608 | [21] | |
| KOH | Coconut husk | Microwave heating | 1356 | [22] |
| Cane pith | Conventional heating | 2299 | [23] | |
| ZnCl2 | Palm shell | Conventional heating | 1672 | [24] |
| Microwave heating | 1195 | [24] | ||
| H3PO4 | Acacia mangium wood | Conventional heating | 1040 | [25] |
| Olive-waste cake | Conventional heating | 1020 | [26] |
3.5 FTIR analysis
Figure 7 shows the FTIR spectra of char and HSAAC. It is can be seen from Figure 7 that there are some differences between the char and HSAAC from the shapes of the FTIR spectra. The spectrum of HSAAC has peaks at 3443 cm-1, 2926 cm-1, 1710 cm-1, 1630 cm-1, 1420 cm-1, 1363 cm-1, 1083 cm-1 and 905–650 cm-1, and the char has peaks at 3440 cm-1, 1692 cm-1, 1590 cm-1, 1375 cm-1, 880 cm-1, 812 cm-1, 748 cm-1 and 610 cm-1. The band at 3440 cm-1 can be assigned to the O-H stretching vibration mode of hydroxyl functional groups, while the band at around 2926 cm-1 can be assigned to the C-H symmetric and asymmetric vibration mode of methyl and methylene groups, for the decomposition of cellulose aliphatic group. The band at 1590 cm-1, 1630 cm-1 and 1710 cm-1 can be assigned to C=C symmetrical stretching of pyrone and C=O of carboxylic groups [35]. The peak at 1083 cm-1 is caused by stretching vibration of ester (-C-O) [36] and the bands at 748 cm-1, 812 cm-1, 880 cm-1 and 905–650 cm-1 are produced by plane external bending of -C-H for different substituted benzene rings [37].
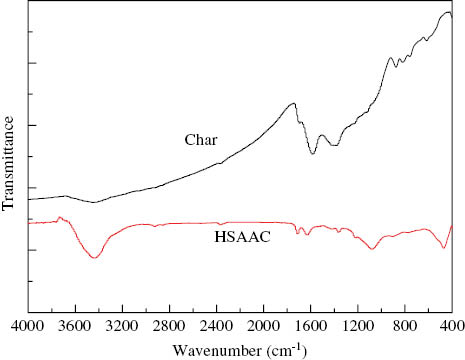
Fourier transform infrared (FTIR) spectra of char and high surface area activated carbon (HSAAC) from Eupatorium adenophorum.
3.6 SEM analysis
The microscopic structures of the char and HSAAC are shown in Figure 8. As seen from Figure 8, the surface of char is devoid of any tangible pores since it is covered by impurities. The surface of HSAAC has a large number of pores of irregular and heterogeneous morphology. A comparison of the microstructure of HSAAC with the char indicates that the activation process plays an important role in removing surface impurities contributing to pore formation.
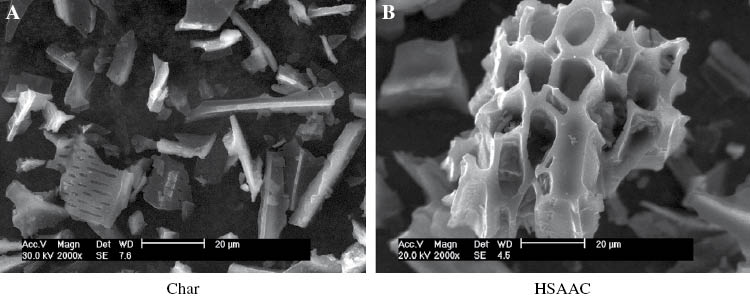
Scanning electron microscopy (SEM) image of char and high surface area activated carbon (HSAAC).
4 Conclusion
E. adenophorum, a harmful biomass, is utilized for preparing HSAAC with K2CO3activation by microwave heating exhibiting a well-developed pore structure. The optimum preparation parameters were identified to be a microwave power of 700 W, a K2CO3/C mass ratio of 2.0 and a heating time of 20 min, with the resultant iodine number and yield being 1696 mg/g and 32.88%, respectively. The pore structure parameters were also characterized by N2 adsorption isotherms. Results showed that HSAAC had a predominant micropore and a few mesopores; the BET specific surface area and total pore volume were 2768 m2/g and 1.149cm3/g, respectively. FTIR spectroscopy shows that the surfaces of char and HSAAC have many chemistry groups. Additionally, SEM illustrates that the HSAAC has a relatively well-developed pore structure.
About the authors

Hongying Xia is an Associate Professor at Kunming University of Science and Technology. He is mainly engaged in microwave heating in application of metallurgy, chemical engineering and material.

Jinhui Peng is a PhD supervisor at Kunming University of Science and Technology. He is mainly engaged in microwave heating in application of metallurgy, chemical engineering and materials science. He has received many awards, among which are the State Technological Invention Award and the Natural Science Award of Kunming province.

Libo Zhang is a PhD supervisor at Kunming University of Science and Technology. He is mainly engaged in microwave heating in the application of metallurgy, chemical engineering, material, etc.
Acknowledgments
The authors would like to express their gratitude to the National Technology Research and Development Program of China (863Program) (no. 2015AA020201), the Kunming University of Science and Technology Personnel Training Fund (no. KKSY201252077) and the Yunnan Provincial Science and Technology Innovation Talents Scheme-Technological Leading Talent (no. 2013HA002) for financial support.
References
[1] Sang W, Zhu L, Axmacher JC. Biol. Invasions 2010, 12, 1721–1730.10.1007/s10530-009-9584-3Suche in Google Scholar
[2] Weyerstahl P, Marschall H, Seelmann I, Kaul VK. Flavour Fragrance J. 1997, 12, 387–396.Suche in Google Scholar
[3] Guo S, Li W, Zhang L, Peng J, Xia H, Zhang S. Process Saf. Environ. Prot. 2009, 87, 343–351.Suche in Google Scholar
[4] Liao F, Wang Y, Huang Y, Mo Q, Tan H, Wei Y, Hu Y. Toxicon. 2014, 77, 87–92.Suche in Google Scholar
[5] Moon S-H, Shim J-W. J. Colloid Interface Sci. 2006, 298, 523–528.Suche in Google Scholar
[6] Fuente AM, Pulgar G, González F, Pesquera C, Blanco C. Appl. Catal., A 2001, 208, 35–46.10.1016/S0926-860X(00)00699-2Suche in Google Scholar
[7] Yuan A, Zhang Q. Electrochem. Commun. 2006, 8, 1173–1178.Suche in Google Scholar
[8] Oda H, Nakagawa Y. Carbon 2003, 4, 1037–1047.10.1016/S0008-6223(03)00013-7Suche in Google Scholar
[9] Biloé S, Goetz V, Guillot A. Carbon 2002, 40, 1295–1308.10.1016/S0008-6223(01)00287-1Suche in Google Scholar
[10] Gratuito MKB, Panyathanmaporn T, Chumnanklang RA, Sirinuntawittaya N, Dutta A. Bioresour. Technol. 2008, 99, 4887–4895.Suche in Google Scholar
[11] Wang ZH, Chen Y, Zhou C, Whiddon R, Zhang YW, Zhou JH, Cen K. Int. J. Hydrogen Energ. 2011, 36, 216–223.Suche in Google Scholar
[12] de Yuso AM, Rubio B, Izquierdo MT. Fuel Process. Technol. 2014, 119, 74–80.Suche in Google Scholar
[13] Elshafei GMS, Elsherbiny IMA, Darwish AS, Philip CA. Chem. Eng. Res. Des. 2014, 92, 461–470.Suche in Google Scholar
[14] Li W, Yang KB, Peng JH, Zhang LB, Guo SH, Xia HY. Ind. Crop. Prod. 2008, 28, 190–198.Suche in Google Scholar
[15] Minoda A, Oshima S, Iki H, Akjba E. J. Alloys Compd. 2013, 580, 5301–5304.Suche in Google Scholar
[16] Belhachemi M, Rios RVRA, Addoun F, Silvestre-Albero J, Sepúlveda-Escribano A, Rodríguez-Reinoso F. J. Anal. Appl. Pyrolysis 2009, 86, 168–172.10.1016/j.jaap.2009.05.004Suche in Google Scholar
[17] Ramos ME, Bonelli PR, Blacher S, Ribeiro Carrott MML, Carrott PJM, Cukierman AL. Colloids Surf., A 2011, 378, 87–93.10.1016/j.colsurfa.2011.02.005Suche in Google Scholar
[18] Suzuki RM, Andrade AD, Sousa JC, Rollemberg MC. Bioresour. Technol. 2007, 98, 1985–1991.Suche in Google Scholar
[19] Mestre AS, Bexiga AS, Proença M, Andrade M, Pinto ML, Matos I, Fonseca IM, Carvalho AP. Bioresour. Technol. 2011, 102, 8253–8260.Suche in Google Scholar
[20] Xiao H, Peng H, Deng SH, Yang XY, Zhang YZ, Li YW. Bioresour. Technol. 2012, 111, 127–133.Suche in Google Scholar
[21] Chen JY, Liu F, Ruan R, Li Z. In: Remote Sensing, Environment and Transportation Engineering (RSETE), 2011 International Conference onIEEE, Nanjing, China, pp. 6995–6998.Suche in Google Scholar
[22] Foo KY, Hameed BH. Chem. Eng. J. 2012, 184, 57–65.Suche in Google Scholar
[23] Tseng R-L, Tseng S-K. J. Hazard. Mater. 2006, 136, 71–80.Suche in Google Scholar
[24] Hesas RH, Arami-Niya A, Daud WMAW, Sahu JN. J. Anal. Appl. Pyrolysis 2013, 104, 176–184.10.1016/j.jaap.2013.08.006Suche in Google Scholar
[25] Danisha M, Hashim R, Mohamad Ibrahim MN, Sulaiman O. J. Anal. Appl. Pyrolysis 2013, 104, 418–425.10.1016/j.jaap.2013.06.003Suche in Google Scholar
[26] Baccar R, Bouzid J, Feki M, Montiel A. J. Hazard. Mater. 2009, 162, 1522–1529.Suche in Google Scholar
[27] Yang KB, Peng JP, Srinivasakannan C, Zhang LB, Xia HY, Duan XH. Bioresour. Technol. 2010, 101, 6163–6169.Suche in Google Scholar
[28] Kong JJ, Yue QY, Wang B, Huang LH, Gao BY, Wang Y, Li Q. J. Anal. Appl. Pyrolysis 2013, 104, 710–713.10.1016/j.jaap.2013.05.024Suche in Google Scholar
[29] Mubarak M, Shaija A, Suchithra TV. Algal Res. 2015, 7, 117–123.Suche in Google Scholar
[30] Hesas RH, Arami-Niya A, Daud WMAW, Sahu JN. Chem. Eng. Res. Des. 2013, 91, 2447–2456.Suche in Google Scholar
[31] Hesas RH, Arami-Niya A, Daud WMAW, Sahu JN. J. Anal. Appl. Pyrolysis 2013, 100, 1–11.10.1016/j.jaap.2012.12.019Suche in Google Scholar
[32] Zheng Z, Xia H, Srinivasakannan C, Peng J, Zhang L. Chem. Eng. Process. 2014, 82, 1–8.Suche in Google Scholar
[33] Li W, Zhang L-B, Peng J-H, Li N, Zhu X-Y. Ind. Crops Prod. 2008, 27, 341–347.Suche in Google Scholar
[34] Ravikovitch PI, Neimark AV. Characterization of nanoporous materials from adsorption and desorption isotherms. Colloids Surf., A. 2001, 187, 11–21.Suche in Google Scholar
[35] Xu JZ, Chen LZ, Qu HQ, Jiao YH, Xie JX, Xing GG. Appl. Surf. Sci. 2014, 320, 674–680.Suche in Google Scholar
[36] Huang FC, Lee CK, Han YL, Chao WC, Chao HP. J. Taiwan Inst. Chem. Eng. 2014, 45, 2805–2812.Suche in Google Scholar
[37] Ncibi MC, Mahjoub B, Seffen M. Bioresour. Technol. 2008, 99, 5582–5589.Suche in Google Scholar
©2015 by De Gruyter
This article is distributed under the terms of the Creative Commons Attribution Non-Commercial License, which permits unrestricted non-commercial use, distribution, and reproduction in any medium, provided the original work is properly cited.
Artikel in diesem Heft
- Frontmatter
- In this issue
- Editorial
- Electrification of chemistry – what is the synergy between plasma synthesis and chemical plant modularization?
- Original articles
- Optimization of biodiesel synthesis under simultaneous ultrasound-microwave irradiation using response surface methodology (RSM)
- The synthesis of optically enriched 2-benzyl- 3-nitropropionic amide
- Cobalt, nitrogen-codoped carbon quantum dots as a synergistic catalyst for oxygen reduction reaction
- Sulfonated poly (arylene ether sulfone) proton exchange membranes for fuel cell applications
- Preparation of high surface area activated carbon from Eupatorium adenophorum using K2CO3 activation by microwave heating
- An environmental procedure to extract titanium components and metallic iron from Ti-bearing blast furnace slag
- Recovery of molybdenum from alkali leaching solution of low-grade molybdenum concentrate by ion exchange
- Impacts of ultrasound on leaching recovery of zinc from low grade zinc oxide ore
- Study on the calcination experiments of rare earth carbonates using microwave heating
- Conference announcement
- Conferences 2015–2017