Integrated processing for the separation of biobutanol. Part B: model-based process analysis
-
Sebastian Heitmann
Dipl.-Ing. Sebastian Heitmann studied biochemical engineering at TU Dortmund University from 2004 to 2010. Since April 2010, he is working as a PhD student at the Laboratory of Fluid Separations at TU Dortmund University. The focus of his research is innovative membrane processes and membrane materials for the separation of organics from fermentation broth.
Dipl.-Ing. Martin Stoffers studied chemical engineering at TU Dortmund University and finished his degree with his diploma thesis in December 2008. Since 2009, he works as a PhD student at the Laboratory of Fluid Separations at TU Dortmund University. The focus of his research is the experimental and model-based investigation, analysis and optimization of the processing of bioproducts using extraction with ionic liquids.
Dr. Philip Lutze studied energy and process engineering at the Technical University of Berlin. He graduated in November 2008. Thereafter, he worked on the “Development of a systematic synthesis/design methodology to achieve process intensification” in the groups CAPEC & Process at the Technical University of Denmark in Lyngby. Since December 2011, Philip Lutze is working as an assistant professor at the Laboratory of Fluid Separations at TU Dortmund University. His main scientific focus is in the area of experimental as well as model-based investigation of process intensification for chemical and biobased processes, including hybrid and reactive separation, membrane-assisted separations, novel energy forms and intensified mass transfer.


Abstract
The biochemical production of n-butanol by fermentation is an interesting option for the sustainable production of a chemical that can be used as a fuel additive or solvent. However, n-butanol is toxic towards the production organisms, resulting in low concentrations of biobutanol in the aqueous fermentation broth. Therefore, conventional purification by distillation is very energy intensive. Extraction with ionic liquids and pervaporation as alternative separation technologies are two promising options for energy-efficient n-butanol recovery. These processes are analysed on detailed economics, including the influence of the uncertainty of the used model parameters and the sensitivity of the production costs to model parameters and design variables. It is shown that the costs for n-butanol purification by means of distillation are strongly dependent on the costs for thermal energy. For extractive recovery, the solubility of the extraction solvent in the raffinate is one of the main cost drivers as it affects the solvent loss. The costs of the pervaporation-based recovery mainly depend on the price for the membranes and are strongly dependent on the permeate fluxes. For all processes, the feed concentration has a noteworthy effect on the total downstream costs. This study allows not only an analysis of existing technologies but also helps to guide future research.
1 Introduction
The increasing oil prices and the increasing demand for a sustainable production of chemicals promote the fermentative production of alcohols such as bioethanol and biobutanol. Similar to bioethanol, biobutanol – in this case, n-butanol (hereinafter, butanol) – can be used as a fuel additive. Within this context, butanol has several advantages as compared with ethanol, such as better blending properties and a higher energy content [1]. However, up to now, butanol is mainly used as a solvent and for the production of paints and coatings, the global production in 2002 was estimated to a value of 5.1 million tons year-1 [2], which was mainly based on a petrochemical basis [3]. Sustainable production of butanol can be realised by acetone-butanol-ethanol (ABE) fermentation, which has already been operated in a large scale at the beginning of this century [4]. Within this process, carbon sources such as sugars, starch or (hydrolysed) biomass are converted to butanol, often connected to the production of acetone and ethanol as by-products. Mainly clostridial organisms such as Clostridium acetobutylicum, Clostridium beijerinckii, Clostridium saccharoperbutylacetonicum or Clostridium saccharobutylicum are applied for the biotechnological production of butanol [4, 5].
Whereas the large-scale production of bioethanol has already been established worldwide, the economic production of biobutanol is still in its early stages. Nevertheless, during the last years, several pilot- and industrial-scale ABE processes were started, including plants in Brazil, China, Russia, the United States and the United Kingdom [6–10].
One main reason limiting the economic competitiveness is the toxicity of butanol towards the production strains, which often limits the butanol concentration to values of <0.01 to 0.02 g g-1 [11]. On the one hand, the toxicity limits the space time yields in fermentation; on the other hand, low butanol concentrations increase the technical and energetic effort required for butanol purification. Therefore, improving butanol separation is one key factor influencing the competitiveness of biotechnological butanol production [12]. Several separation techniques have been investigated and reviewed in the literature [13, 14], including distillation, extraction with oleyl alcohol or ionic liquids, pervaporation, gas stripping, adsorption or perstraction [8, 15–22]. Evaluating all of these processes with regard to their capacity, their ability for a selective butanol separation, the fouling behaviour and the technical maturity, especially extraction and pervaporation are promising alternatives next to distillation, which is currently used for industrial-scale butanol recovery [6, 8, 23].
When designing a distillation sequence for the separation of binary mixtures of water and butanol, a low boiling azeotrope (75.3 mol% water) has to be considered. Because the boiling point of the azeotrope (92.4°C) is lower than the boiling points of water and butanol, in a distillation column purified butanol can only be obtained as a bottom product. Distillation is reported to cause up to 40% of the total production costs for butanol [24]. If by-products such as acetone and ethanol are present in the fermentation broth, the distillation sequence becomes more complex. On the whole the separation of the solvents from water consumes energy and accounts for >80% of the total energy demand of a distillative downstream process [25]. Therefore, in this work, only binary mixtures of butanol and water were considered for process modelling and cost estimations.
Extraction of butanol from aqueous solutions and in particular the fermentation broth can be carried out using long-chain acids and alcohols such as oleyl alcohol [15, 26] or ionic liquids [27–29]. The feasibility of in situ extraction to avoid butanol inhibition was shown by Groot et al. [26] and Roffler et al. [15] resulting in increased productivities. Compared with classic organic extraction solvents, ionic liquids are promising alternatives. Ionic liquids are salts composed of anions and cations that are liquid at temperatures <100°C. Their physical and chemical properties can be tuned by combining different types of anions and cations and can thus be adjusted to a specific separation task [30]. Besides others, ionic liquids with tetracyanoborate anions were reported to be promising for butanol extraction [31, 32].
Similar to extraction, pervaporation is able to overcome the product inhibition of butanol and leads to increased productivities when a pervaporation unit and a fermentation process are combined [33, 34]. Overviews about different organophilic membranes applied for butanol pervaporation were published by Oudshoorn et al. [14], Vane [35] and Liu et al. [36]. One of the best-studied membrane materials applied for butanol recovery is poly(dimethylsiloxane) [17, 34, 37, 38].
In comparison with distillation, the product purity obtained in extraction or pervaporation is not dependent on the vapour-liquid equilibrium and thus not limited by the azeotropic composition, but is dependent on the properties of the extraction solvent and the membrane. Nevertheless, after separation of the butanol fraction from the aqueous feed stream or the fermentation broth, a second separation unit is required to obtain butanol with the desired purity.
To evaluate the suitability of the distillation-based, extraction-based and pervaporation-based purification processes, process simulations were carried out and the total production costs per kilogram of butanol were estimated. In general, for a model-based process design, reliable models are needed that are usually based on experimental data. However, all experimental data have a certain experimental error depending on the experimental procedure and the accuracy of the measurements and analytics. Therefore, each of the experimentally determined model parameters are subject to uncertainties that influence the overall process performance. The quality of cost estimates is another factor with a large impact on the process costs. The knowledge of their influence on the total costs is important for a reliable decision making between processes. Additionally, it may be of interest how the process design or configuration will change with changing cost factors. Hence, a fair comparison of different processes using model-based approaches is also difficult and often only a snapshot.
Especially for extraction and membrane operations, the uncertainty in experiments for model parameter estimation causes difficulties, which might influence the calculation of transmembrane fluxes and selectivities in membrane operations as well as distribution coefficients and selectivities in extraction operations. Additionally, certain model assumptions and model parameters such as price indices for solvents and membranes are highly uncertain. The evaluated processes and the associated costs, which are the criteria for comparing the different process configurations, can be highly sensitive to those parameters. Therefore, a detailed sensitivity and uncertainty analysis of important parameters as well as design variables is performed and their influence on process economics in each process configuration is investigated. This analysis not only allows a comparison of existing technologies but also helps guide future research. By identification of the most important parameters (e.g., mutual solubility of the extraction solvent and the feed stream in extraction or transmembrane flux and selectivity in pervaporation), objectives for material improvement or increased accuracies in experiments to enhance the reliability of model parameters can be targeted to ensure that the required process performance is achieved.
2 Process configurations and modelling
Distillation, extraction and pervaporation for butanol separation were investigated and modelled. This section provides an overview of the three different processes and the corresponding models used. Detailed information on the process modelling can be found elsewhere [23].
2.1 Process configurations
For separating binary mixtures of butanol and water, a conventional heteroazeotropic distillation process employing two distillation columns and a decanter can be used (Figure 1A). Because of a low boiling heteroazeotrope, vapour containing <24.7 mol% of butanol is obtained in the first column, whereas water leaves the process through the bottom of the first column. The condensed vapour splits into an organic and an aqueous phase, which are fed to the second column and fed back to the first column, respectively. Within the second distillation column, purified butanol is obtained at the bottom, whereas the vapour with azeotropic composition is condensed and recirculated to the decanter. As distillation is a well-known process that is also applied for large-scale butanol recovery from fermentation broth, it is considered as a benchmark process [8].
![Figure 1 Separation of butanol from aqueous solutions by using heteroazeotropic distillation (A), an integrated extraction-distillation process (B) and an integrated pervaporation-distillation process (C) (figures taken from Stoffers et al. [23]).](/document/doi/10.1515/gps-2013-0021/asset/graphic/gps-2013-0021_fig1.jpg)
Separation of butanol from aqueous solutions by using heteroazeotropic distillation (A), an integrated extraction-distillation process (B) and an integrated pervaporation-distillation process (C) (figures taken from Stoffers et al. [23]).
Because this benchmark process suffers from high energy costs, two alternative processes were identified to be promising for butanol separation, namely extraction and pervaporation [13, 14, 23]. The scheme of a process for extraction of butanol is shown in Figure 1B. Within this integrated extraction-distillation process, ionic liquid is used as an extraction solvent. Extraction takes place in an extraction column, while butanol is recovered from the ionic liquid by flashing. The vapour from the flash is condensed, and the organic phase is – similar to the benchmark process – fed to a column, in which purified butanol is obtained at the bottom of the column. The aqueous phase is recirculated, mixed with the feed stream and fed to the extraction column again. A small part of the ionic liquid is lost due to a low solubility in the fermentation broth or because of chemical degradation. Therefore, a make-up stream of fresh ionic liquid is mixed with the ionic liquid stream from the flashing unit.
Next to distillation and extraction, pervaporation is considered for butanol separation. The flow scheme for an integrated pervaporation-distillation process is shown in Figure 1C. A mixture of butanol and water is obtained as a vaporous permeate, which is condensed. Because of the miscibility gap, the organic and aqueous phases are separated in a decanter. The organic phase is fed to a distillation column, in which purified butanol is obtained as a bottom product, whereas the aqueous phase is recirculated to the pervaporation and mixed with the feed stream.
It is assumed that all product streams, butanol and the aqueous stream, leave the separation processes at a temperature of 35°C. Therefore, additional heat exchangers are considered in the process flow schemes.
2.2 Process modelling
The three processes and the associated unit operations, such as the distillation and extraction columns, decanters, flash drum, heat exchangers and pumps, were implemented into Aspen Plus® (Aspen Technologies, Inc., Cambridge, MA, USA). The pervaporation unit was modelled using Aspen Custom Modeler®. The non-random two-liquid (NRTL) model was employed for description of vapour-liquid equilibria (VLEs) and liquid-liquid equilibria (LLEs). The parameter sets used for modelling in the different processes are shown in Tables 1–3; these were varied during the later uncertainty analysis to investigate the influence of inaccuracies during experiments and parameter estimation on the production costs.
Binary NRTL parameter set for VLE calculation (VLE-HOC), α = 0.3.
| Component 1 | Component 2 | i | j | aij (-) | bij (K) |
|---|---|---|---|---|---|
| Water | Butanol | 1 | 2 | 7.56 | -1390.56 |
| 2 | 1 | -1.19 | 455.48 |
NRTL parameter set for binary LLE calculation (LLE-Aspen), α = 0.2.
| Component 1 | Component 2 | i | j | aij (-) | bij (K) | eij(K) |
|---|---|---|---|---|---|---|
| Water | Butanol | 1 | 2 | 90.53 | -4983.15 | -12.06 |
| 2 | 1 | 204.23 | -9291.70 | -30.58 |
Binary NRTL parameter sets for ternary LLE calculations (LLE-Corr.) at 35°C, α = 0.2 [32].
| Component 1 | Component 2 | i | j | aij (-) |
|---|---|---|---|---|
| Water | Butanol | 1 | 2 | 5.22 |
| 2 | 1 | -1.12 | ||
| Water | Im10.1 tcb | 1 | 2 | 12.32 |
| 2 | 1 | 0.06 | ||
| Im10.1 tcb | Butanol | 1 | 2 | -1.36 |
| 2 | 1 | 0.92 |
2.2.1 Distillation
For simulation of the distillation columns present in all three processes, the equilibrium RadFrac model in Aspen Plus® (V7.2) was used. The Aspen parameter set NRTL VLE-HOC was applied for the description of the vapour-liquid equilibrium, shown in Table 1. The miscibility gap for the binary system butanol-water and heat losses were not considered for the distillation.
2.2.2 Decanter
Liquid-liquid demixing occurs in all of the three investigated processes. Because the VLE-HOC parameter set cannot adequately describe the phase splitting in the decanter, an additional parameter set is used that is available in Aspen (LLE-Aspen; see Table 2). This parameter set is valid for temperatures >35°C.
2.2.3 Extraction
For simulation of the extraction process, the equilibrium extraction model available in Aspen Plus® is used. The ternary liquid-liquid equilibrium Im10,1 tcb-water-butanol is described by using the binary parameter sets published by Domańska and Królikowski [32]. These were implemented into Aspen Plus® and are valid for a temperature of 35°C. The parameter set is presented in Table 3.
2.2.4 Flash
The recovery of butanol and water from the ionic liquid is performed in a flash drum. This separation is modelled by using a split fraction, as data describing the vapour-liquid equilibrium for the ternary system Im10,1 tcb-water-butanol are not available. To consider the non-ideal recovery behaviour, for butanol and water a split fraction of 0.99 is assumed, while the ionic liquid does not evaporate (split fraction of 0.00). Heat capacities and the evaporation enthalpies for butanol and water were used to calculate the required energy for separation.
2.2.5 Pervaporation
Pervaporation was modelled using Aspen Custom Modeler®. The model structure is described elsewhere [39]. Simulation results from Aspen Custom Modeler® for the membrane module and Aspen Plus® for the rest of the process are matched using Microsoft Excel as interface. Partial fluxes of butanol and water dependent on the feed concentrations wi,F, temperature T and permeate pressure pp are calculated using Eq. (1) and the parameters in Table 4 [23].
Parameter set for the partial flux correlation of butanol and water [23].
| Butanol | Water | ||
|---|---|---|---|
| Qi* | g m-2 h-1 | 243.43 | 14.46 |
| EA | kJ mol-1 | 44.496 | 44.496 |
| Ap,i | -0.406 | -0.220 | |
| Bs,i | 0 | 0.242 |

2.3 Cost estimation
For estimation of the total production costs (TC) and the production costs per kilogram of butanol, the total investment costs (TIC) and total operating costs (TOC) for all processes are calculated. Details about the assumptions, correlations, and indices used for the cost analysis are presented in more detail by Stoffers et al. [23]. Prices for ionic liquid, membrane module and replacement or utility costs are given in Table 5 and were varied during a sensitivity analysis to investigate the influence of these cost factors onto the total production costs later.
Assumptions for cost estimations.
| Cost factor | Price | Unit | Reference |
|---|---|---|---|
| Ionic liquid | 30 | € kg-1 | [40] |
| Depreciation period | 10 | years | [41] |
| Membrane module (TIC) and replacement (TOC) | 200 | € m-2 | [42] |
| Membrane lifetime | 3 | years | [43] |
| Low-pressure steam (5 bar) | 16 | € t-1 | [41] |
| Cooling water (15°C →35°C) | 0.05 | € t-1 | [41] |
| Refrigerated water (5°C →15°C) | 3.35 | € GJ-1 | [44] |
| Low-temperature refrigerant (-20°C) | 5.96 | € GJ-1 | [44] |
| Electricity | 0.06 | € kWh-1 | [41] |
3 Process analysis
To investigate the influence of model parameter uncertainties onto the process costs and to perform a sensitivity analysis, a base case for each of the processes is designed. The assumptions and results for the base case design are presented in Section 3.1 [23]. The influence of uncertainties in parameter estimation and experiments onto the production costs for butanol is evaluated compared with the base case (Section 3.2). By means of a sensitivity analysis, which is presented in Section 3.3, different process and design parameters and variables, e.g., temperatures, pressures or concentrations, were varied to obtain a better process understanding. The sensitivity of the total production costs towards cost factors such as costs for thermal energy, extraction solvent or membranes, and cost-related parameters such as the membrane lifetime is analysed in Section 3.4. For all variations, a local sensitivity analysis is used, which means that each parameter or variable is varied independently from the others.
3.1 Base case design
The results of the base case design for each of the three processes are presented in this section. A detailed description of all assumptions made for process design is presented by Stoffers et al. [23]. The three processes are designed to separate an amount of 3500 kg h-1 butanol from an aqueous feed stream delivered at a temperature of 35°C.
3.1.1 Benchmark process
The benchmark process consists of two distillation columns and a decanter. Because high product purity is required for the water and the butanol stream leaving columns C1 and C2 through the bottom, a relatively high number of stages (nth=20) is chosen. To obtain the required butanol purity of 99.8 wt.%, the bottom-to-feed mass ratio was adjusted. The most important design variables are shown in Table 6.
Design variables for the benchmark distillation process, the integrated extraction-distillation process and the integrated pervaporation-distillation process [23].
| Parameter | Benchmark/distillation | Extraction/distillation | Pervaporation/distillation |
|---|---|---|---|
| Butanol mass fraction in feed (g g-1) | 0.01 | 0.01 | 0.01 |
| Feed temperature (°C) | 35 | 35 | 35 |
| No. of theoretical stages (-) | 20 (C1) 20 (C2) | 10 (EXT) 20 (C2) | 20 (C) |
| Feed stage | 10 (C1) 1 (C2) | 1 (C2) | 1 (C) |
| Pressure (bar) | 1 (C1) 1 (C2) | 1 (C2) | 0.01 (Permeate) 1 (C) |
| Decanter temperature (°C) | 60 | 60 | 60 |
| Butanol recovery (%) | 99.98 | 98.3 | 10.0 |
| Solvent-to-feed ratio (EXT) | - | 0.176 | - |
For the production of 3500 kg h-1 butanol, the investment costs and operating costs per kilogram of butanol were calculated to €0.008 and €0.281, respectively, resulting in total productions costs of €0.289 kg-1 butanol as shown in Figure 2. The main cost driver for this process is column 1, which generates 70% of the TOC [23]. Owing to the depreciation period of 10 years, the influence of the capital costs on the total costs is comparatively small.
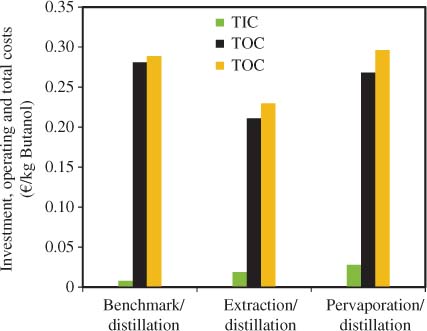
TIC (green), TOC (black) and TC (orange) for the benchmark distillation process, the integrated extraction-distillation process and the integrated pervaporation-distillation process.
3.1.2 Integrated extraction-distillation process
The important design variables that influence the performance of the integrated extraction-distillation process are the solvent-to-feed mass ratio, the number of theoretical stages in the extraction column and the HETP (height equivalent to a theoretical plate) value for the extraction, which were chosen to values of 0.176, 10 and 2 m. A recovery of 98% butanol was chosen for the base case design, and the butanol fraction remaining in the aqueous phase is recirculated back to the fermentation with the aqueous phase.
As shown in Figure 2, for separation of 3500 kg h-1 butanol from an aqueous stream containing 0.01 g g-1 butanol, the investment costs and operating costs per kilogram of butanol were calculated to €0.019 and €0.211, respectively, resulting in the total production costs of €0.230 kg-1 butanol. The extraction-distillation process therefore is about 20% cheaper than the conventional distillation process. The increased investment costs compared with the benchmark process mainly result from the required start-up extraction solvent; the extraction unit requires about 80% of the total investment costs. In contrast to the benchmark process, the operating costs are not dominated by the costs for utility streams but by the solvent loss in the raffinate stream responsible for 77% of the operating costs [23].
3.1.3 Integrated pervaporation-distillation process
The costs for the integrated pervaporation-distillation process are strongly dependent on the membrane area required for separation, which in turn is influenced by the permeate flux of butanol. To ensure high permeate fluxes, the decrease of the feed concentration along the membrane has to be small, meaning that the recovery rate in the pervaporation is low. The butanol recovery was chosen to a value of 10% (see Table 6). Because the capacity of the overall separation process was set to a value of 3500 kg h-1, this comparatively low recovery results in high feed streams to be processed.
For the recovery of 3500 kg h-1 butanol from the aqueous feed stream, the investment costs and operating costs per kilogram of butanol were calculated to €0.028 and €0.268, respectively, resulting in the total productions costs of €0.296 kg-1 butanol. The costs for the pervaporation-distillation process therefore are slightly higher than the costs for the conventional distillation process. Eighty-seven per cent of the total investment costs are allocated to the costs for the membrane module; membrane replacement, permeate condensation and heating of the retentate cause >90% of the operating costs [23].
3.2 Uncertainty of model parameters
In the previous section it was shown that the overall costs for butanol purification are in the same order of magnitude for all of the three processes. However, the integrated extraction-distillation process was about 20% cheaper than the other processes. Because the costs are strongly dependent on model parameters, which, e.g., describe the liquid-liquid equilibrium for extraction or the partial fluxes of butanol and water, for each process configuration, the uncertainty of the model parameters and their influence on process performance is investigated. These investigations provide an idea of how inaccuracies during experiments or parameter fitting affect the whole process.
3.2.1 Benchmark process
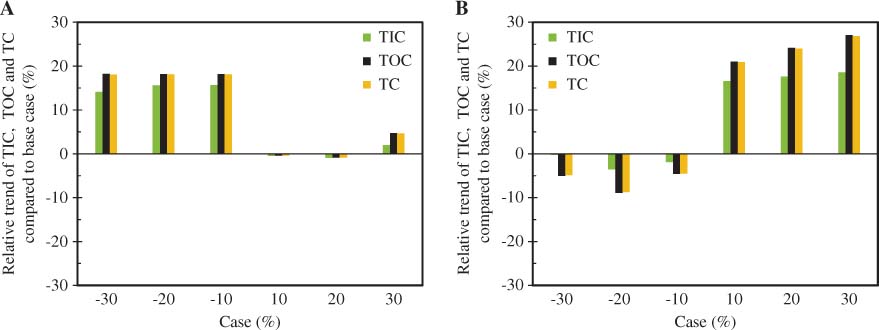
Two parameter sets for the calculation of activity coefficients, one for the vapour-liquid equilibrium and one for the liquid-liquid equilibrium, are used in this process. These parameter sets were varied by multiplication of each interaction parameter by 0.93 and 1.07, respectively. The influence of the VLE parameter set on the process costs is larger than the influence of the LLE parameter set (see Figure 3). A positive change of 7% in the value of the VLE parameter set causes 4% less total costs owing to a reduced distillate and reflux mass flow. However, a negative change of 7% in the value influences the costs scarcely. Deviations in the LLE parameter set have an influence of only 1%, increasing the costs slightly for the positive and the negative case. If both parameter sets are changed at the same time, the effects on the costs are summed.
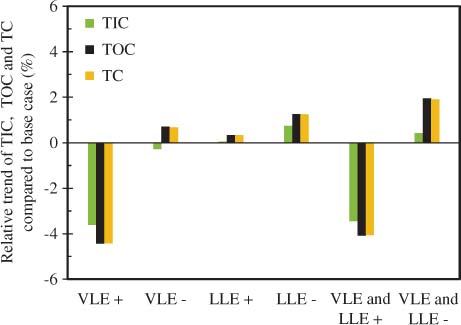
Influence of uncertainties in NRTL binary interaction parameters for the VLE and LLE parameter sets on TIC (green), TOC (black) and TC (orange) compared with the base case configuration of the benchmark process.
3.2.2 Integrated extraction-distillation process
Uncertainties in the binary interaction parameter data can affect the integrated extraction-distillation process by three parameter sets: the VLE set, the LLE describing the miscibility gap for water-butanol and the LLE correlation (LLE-Corr.). Analogous to Section 3.2.1, the parameter sets were varied by ±7%.
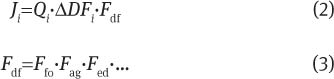
A change in the VLE parameter set by 7% does not influence the costs of the process (Figure 4A). In contrast to the benchmark process, the investment costs as well as the annual operating costs remain constant because the distillation column does not play a big role in the total costs. In contrast, the influence of the LLE-Corr. is noticeably larger. By a change of 7% to smaller values, total costs of nearly 40% can be saved, while a change of 7% to greater binary interaction parameters causes additional costs of 117%. These effects are caused by a decrease in the solubility of ionic liquid in the raffinate in the first case and an increase in the solubility in the second case. Thus, small uncertainties in the VLE and LLE parameter sets can be neglected, while the correlated parameter set for the extraction unit influences the costs in a very sensitive way. The loss of ionic liquid is a main cost driver due to the high solvent costs.
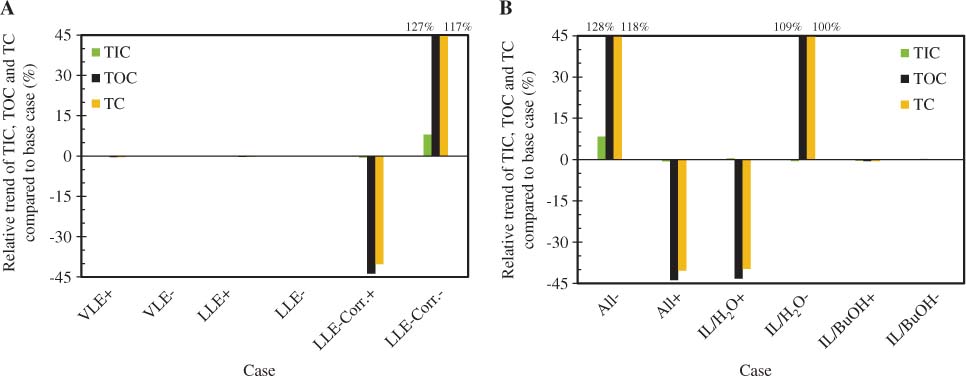
Influence of uncertainties in NRTL binary interaction parameters for the VLE, LLE and LLE-Corr. parameter sets (A) and of uncertainties in NRTL binary interaction parameters for the VLE, LLE and LLE-Corr. calculation (B) on TIC (green), TOC (black) and TC (orange) compared with the base case configuration of the integrated extraction-distillation process.
A variation of all three parameter sets leads to the sum of the single influences (Figure 4B), which has already been observed in Section 3.2.1. Owing to the high influence of the correlated LLE set, a detailed study of the parameters is done. Therefore, the binary parameter of ionic liquid-water and ionic liquid-butanol are varied independently. The interaction of ionic liquid and water is identified as the parameter that influences the costs strongly. In particular, the operating costs increase owing to a change in the mutual solubility of the two key components in the extraction column.
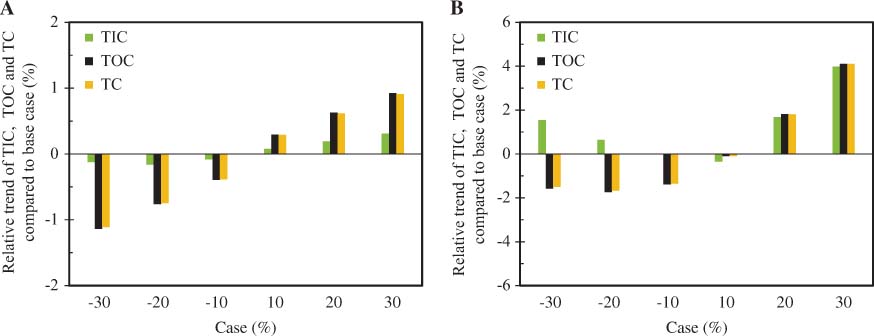
Because the HETP values for extraction packings can change over a wide range depending on the chemical system, the influence of uncertainties of this model parameter is of special interest. Therefore, the value was varied in the range of ±30% compared with the base case, which considers an HETP value of 2 m height per theoretical stage. This parameter influences mainly the investment costs and the height, and thus the costs for the extraction column increase. The trend for the positive and negative deviation influences the costs in the same magnitude (Figure 5). Investment costs are saved proportional to the lowered HETP value; a change of 30% results in savings up to 15%. However, this effect causes only small changes in the total costs of a maximum of 2% because the depreciated costs are relatively small compared with the operating costs.
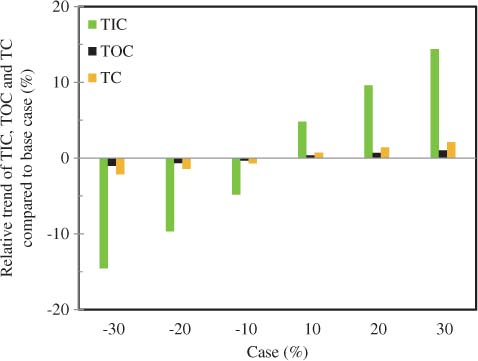
Influence of uncertainties in the HETP value of the extraction packings on TIC (green), TOC (black) and TC (orange) compared with the base case configuration of the integrated extraction-distillation process.
3.2.3 Integrated pervaporation-distillation process
Analogous to the benchmark and the extraction-based process, the VLE and LLE parameter sets are varied by ±7%. The results are shown in Figure 6A. An uncertainty in the VLE parameters does not have an effect on the process costs compared with the base case. This is a result from the oversized column with 20 theoretical stages, which facilitates a high separation efficiency. In contrast to the VLE parameters, the variations of parameters describing the LLE of water and butanol have a larger impact. The parameter variation by ±7% mainly affects the butanol concentration of the aqueous phase that leaves the decanter. The mass fraction changes by -30% (LLE+7%) and +48% (LLE-7%), whereas the composition of the organic phase is mainly unaffected (-0.2% and +3%, respectively). According to this, the width of the miscibility gap in the binary system changes and thus influences the organic-to-aqueous phase ratio in the decanter. The variation of the LLE parameters by +7% results in a widened miscibility gap and a smaller aqueous stream, which is recycled to the membrane and therefore lowers the required membrane area and the operating costs of the condenser.
Because during pervaporation experiments and modelling of the experimental results, deviations might occur, the parameters that describe the partial fluxes of butanol and water are varied to investigate the sensitivity of the process to these parameters (see Table 4). Simultaneously variation of all parameters by ±7% would result in increased or lowered permeate fluxes, which have a direct impact on the membrane area required for the production of 3500 kg h-1 butanol (Figure 6B). Furthermore, the quotient of  , which represents membrane selectivity, was varied, as the permeate concentration plays an important role in the overall process. was changed by ±7% by altering
  and
and  in opposite directions. As shown in Figure 6A, an increased selectivity of the membrane results in production costs lowered by -7.4%, whereas a selectivity decrease results in an increase of 7.7% in the total production costs. The selectivity change influences the permeate concentration (0.243 and 0.218 g g-1, respectively) and therefore also the ratio of the organic to the aqueous stream. Due to lower permeate concentrations of butanol in case of a lowered selectivity, the aqueous stream that is recycled to the membrane module increases, leading to an increase in the internal flow rates in the cycle decanter-pervaporation-permeate condenser-decanter. The resulting larger membrane area thus increases the total production costs.
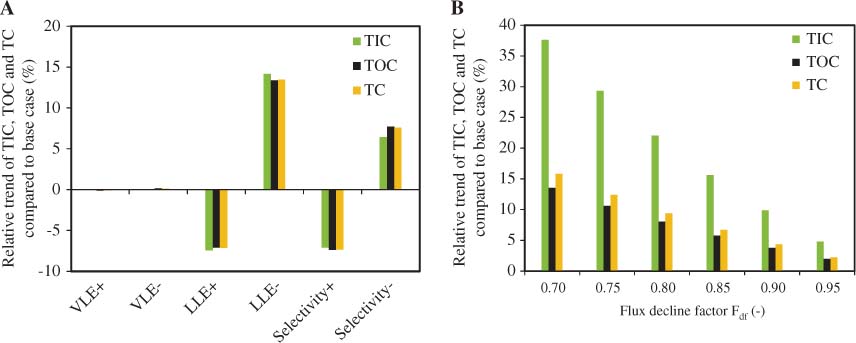
Influence of uncertainties in the parameters describing VLEs, LLEs and the partial flux ratio (selectivity) (A) and influence of the decline of permeate fluxes (B) on TIC (green), TOC (black) and TC (orange) compared with the base case configuration of the integrated pervaporation-distillation process.
One important factor that influences the permeate fluxes and the required membrane area is fouling (fo), especially when using pervaporation in combination with fermentation broths. A deviation of the permeate fluxes from the expected values might further be a result from membrane aging (ag), inaccurate experimental investigations (ed) or other factors. A decline in the fluxes was considered by combining all these effects within one factor, Fdf [Eq. (2)], that sums up all effects [Eq. (3)]:
Declined fluxes directly influence the required membrane area for this separation task. Because the factor affects both partial fluxes of butanol and water, the membrane selectivity and thus the subsequent downstream processing is not influenced. Assuming values for the declined flux factor Fdf of 0.7, 0.8 and 0.9 leads to total costs increased by 16%, 9% and 7% (Figure 6B).
3.2.4 Conclusion
The variation of model parameters showed that an uncertainty of the determined parameters of around 7% might have a large impact on the model-based estimation of the performance of each configuration. For the benchmark process, the costs are mostly related to the first distillation column, and thus, uncertainty in the VLE parameters shows a large impact on costs. The most important model parameter for the integrated extraction-distillation process is the set of LLE parameters of the correlation describing the behaviour of the ionic liquid, especially the parameters that describe the binary system of water and ionic liquid. This shows that thorough experimental investigations are necessary to determine this parameter with the highest possible accuracy. Another aim is to identify solvents (ionic liquids) that further decrease the mutual miscibility of water and the solvent rather than to obtain a high selectivity of butanol. For the pervaporation-distillation process, changes in the permeate fluxes and in the LLE parameter set, as well as the selectivity of the membrane, play an important role. However, it must be mentioned that membranes with a higher selectivity often suffer from lower permeate fluxes. As this analysis focuses only on uncertainties in the experimental and modelling procedure, the influence of the relation of selectivity and permeability should be examined in future research.
3.3 Sensitivity of design parameters and variables
For each process configuration, the base case design parameters are varied to identify their influence on the process performance.
3.3.1 Benchmark process
The theoretical number of stages of the two distillation columns, the feed position of column C1 and the feed composition are the investigated design parameters of the benchmark process. By variation of the feed position, no significant effect on the costs is observed (results not shown for this reason).
Increasing the number of stages in one of the columns requires more packing material and a higher column. Thus, the investment costs increase. The effect is stronger for column C1 (Figure 7A) than for column C2 (Figure 7B) because of the larger dimensions. Operating costs are not influenced by an increase in the number but by a decrease in column C1. Reducing the packing height influences the performance of the column. As a smaller number of theoretical stages in column C2 does not increase the operating costs, a base case design with 20 stages seems not to be the best choice. However, savings in total costs are insignificantly low.
Influence of the number of theoretical stages in column C1 (A) and the number of theoretical stages in column C2 (B) on TIC (green), TOC (black) and TC (orange) compared with the base case configuration of the benchmark process.
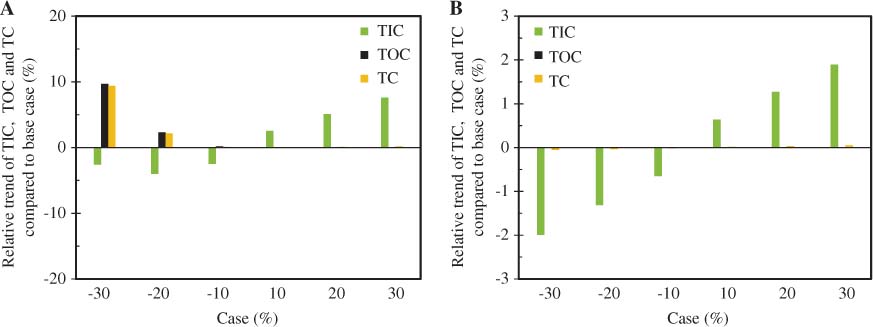
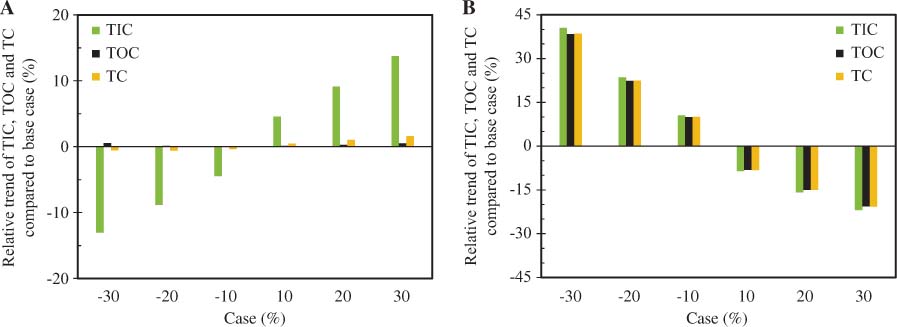
There are several reasons for a change in the feed composition. Strain improvement or metabolic engineering are able to increase product titres, whereas continuous fermentation with direct product removal might be operated at lower butanol fractions in the fermentation broth. Therefore, butanol fractions of 0.7–1.3 g g-1 are investigated (Figure 8). Already a -10% change in composition can cause 11% additional total costs, whereas +10% changes in the composition lead to savings of 9%. For changes of ±30%, the savings (by 23%) increase less than the additional costs (by 43%). All in all, the fermentation broth composition is a main factor influencing the costs for the purification by distillation.
Influence of the feed composition on TIC (green), TOC (black) and TC (orange) compared with the base case configuration of the benchmark process.
As described in Section 3.1.1, the bottom-to-feed ratio is varied to achieve product purity and to maximise the product mass flow. Figure 9A illustrates the necessity to preheat the feed stream of column C1. For a deep undercooled feed, total costs can increase by up to 18%, even for a negative change of 10% in the temperature. There are different effects that cause this kind of cost trend. On the one hand, the operating costs for the reboiler of column C1 increase more than those of the preheater with increasing feed temperature. On the other hand, the reboiler of column C2 needs less steam and the decanter less cooling water. This is a result of lower mass flows in the distillate stream of column C1, which causes smaller streams through the decanter and column C2. With an increase in temperature of 30%, the distillate stream of column C1 is increased again so that there is no chance to save money in comparison with the base case any longer.
Influence of feed temperature in column C1 (A) and top pressure in column C1 (B) on TIC (green), TOC (black) and TC (orange) compared with the base case configuration of the benchmark process.
The total costs increase strongly with an increase in the top pressure of column C1 (Figure 9B). An increase of up to 27% in the costs for the separation of butanol compared with the base case is the result of a positive shift of 30% in the pressure. In contrast, the costs can be dropped by a maximum of 9% operating under vacuum. The vapour-liquid equilibrium and the liquid-liquid equilibrium are shifted so that the reflux to column C1 is lower under vacuum.
With increasing pressure in column C2 from 0.7 to 1.3 bar, the total costs increase steadily from 1% savings to 1% additional costs (Figure 10A). Thus, operating column C2 under vacuum could be an option, although the effect on the total cost is relatively low. The temperature in the decanter DEC influences both columns (Figure 10B). Lowering the temperature by 10% decreases the operating and thus the total costs slightly. However, further cooling increases the investment costs owing to smaller driving forces between the cooling and process medium. Secondary, the mass flow through column C2 increases and causes a higher investment for column C2. If the decanter temperature is increased by 30%, the butanol fraction in the organic phase of the decanter is decreased. Thus, the reboiler heat duty in column 2 increases and additional costs of 4% compared with the base case can be observed.
Influence of top pressure in column C2 (A) and decanter temperature (B) on TIC (green), TOC (black) and TC (orange) compared with the base case configuration of the benchmark process.
3.3.2 Integrated extraction-distillation process
Design parameters such as the theoretical number of stages in the extraction and distillation column as well as the feed composition are investigated for the integrated extraction-distillation process. No significant effect of the number of stages in the distillation column on the costs is observed (results not shown for this reason). The number of stages in the extraction has an influence, especially on the investment costs (Figure 11A). An increase in the number causes higher investment costs owing to the increased packing height. The deviation from the base case is up to 14% for a variation of ±30% in the number. The operating costs and thus the total costs change only slightly. Obviously, the extraction from the aqueous phase into the ionic liquid still works with seven stages without a significant change in the annual operating costs.
Influence of the number of theoretical stages in the extraction column (A) and of the feed composition (B) on TIC (green), TOC (black) and TC (orange) compared with the base case configuration of the integrated extraction-distillation process.
As mentioned before, the influence of different feed compositions on the performance of the purification process is of interest. Therefore, feed compositions are varied in the same way for the integrated extraction-distillation process. Lower butanol fractions cause higher investments, annual operating and thus total costs (Figure 11B). Even a 10% deviation in the butanol mass fraction causes additional total costs of 10%. For a butanol fraction of 0.007 g g-1, an increase by 38% is observed. In contrast, the higher the butanol fraction in the fermentation broth is, the more costs can be saved. Up to 20% of the total costs can be saved operating with a feed composition of 0.013 g g-1.
Furthermore, the model variables top pressure in column C2, solvent-to-feed ratio and decanter temperature are investigated. As the top pressure did not influence the costs significantly, the results are not shown for this reason. The solvent-to-feed ratio influences the amount of extracted butanol and thus, directly, the annual operating and investment costs (Figure 12A). For an increased solvent-to-feed ratio, more butanol is extracted but more solvent is necessary. Investment costs increase by up to 11%; operating costs increase by up to 4%. For a small decrease of the ratio, all costs are reduced slightly. If the ratio is decreased further, operating costs increase again. Less butanol is extracted into the ionic liquid, affecting the total costs. Investment costs are reduced because of a reduced start-up amount of ionic liquid. As a result with changing solvent-to-feed ratios the total cost pass through a minimum. While lower values increase the costs due to product loss through the raffinate stream, higher values increase the costs because of big solvent mass flows.
Influence of the solvent-to-feed mass ratio in the extraction column (A) and of the decanter temperature (B) on TIC (green), TOC (black) and TC (orange) compared with the base case configuration of the integrated extraction-distillation process.
Analysing the effect of the decanter temperature on the overall process shows that a lowered temperature does not influence the costs significantly (Figure 12B). If the decanter is operated at higher temperatures compared with the base case, mainly the operating costs increase. However, compared with the solvent-to-feed ratio, the effect is rather small. Total costs are increased by a maximum of 1.5% for a temperature shift from 60°C to 78°C.
3.3.3 Integrated pervaporation-distillation process
Figure 13A shows the influence of the feed composition on the costs of butanol production. As one would expect, a decreased feed concentration leads to an increase in the costs. Because of the lowered driving force for mass transfer and the larger membrane areas that are used for the production of 3500 kg h-1 butanol, the costs increase by >50%, even when the concentration is lowered by only 0.003 g g-1. In contrast, slight increases in the feed concentration result in significant savings. The investment and operating costs are mainly influenced by changes in the required membrane area, which varies between +60% and -27% compared with the base case; the operating costs for the condenser change by +55% and -24%, respectively. Deviations of the feed concentration by ±30% result in permeate concentrations in a range between 0.18 and 0.28 g g-1. Thus, the phase ratio of the aqueous to the organic phase in the decanter changes, leading to altered flow rates for the recycled aqueous phase, which influences the required membrane area directly.
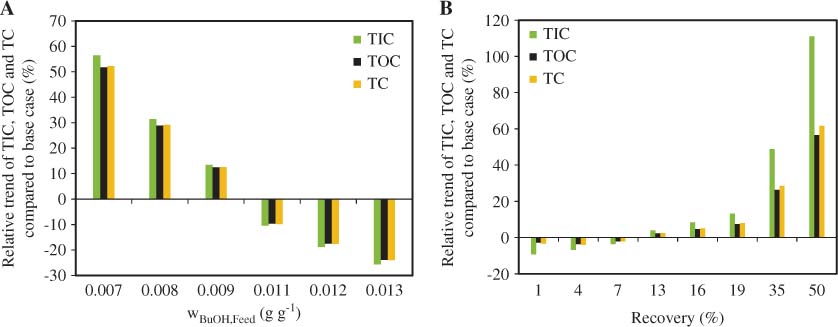
Influence of the feed concentration of butanol (A) and of the butanol recovery in the pervaporation unit (B) on TIC (green), TOC (black) and TC (orange) compared with the base case configuration of the integrated pervaporation-distillation process.
The recovery of butanol from the aqueous stream was chosen to be 10% for the base case design because higher recoveries lead to lowered mean concentrations along the membrane and therefore to increased membrane costs. While a recovery of 10% gives butanol mass fractions in the retentate of 0.0090 g g-1, retentate mass fractions of 0.0099 and 0.0081 g g-1 butanol are obtained in case of 1% or 19% recovery. As shown in Figure 13B, this affects the total costs per kilogram of butanol by -3% or +8%. The influence on the investment costs is higher compared with the operating costs, as the costs for membrane modules represent the major part of the investment costs, whereas the membrane area accounts only for one-third of the operating costs. However, one must keep in mind that the annualised total investment costs only amount to about 10% of the total costs. Similar to changes in the feed concentrations, altered recoveries lead to variations in the permeate mass fraction of butanol, which in turn affects the organic-to-aqueous phase ratio and thus the membrane area. Higher recoveries lead to a lower temperature in the retentate (23°C for a recovery of 35%) and a higher energy demand of the retentate heater. Nevertheless, one must consider that low recoveries require higher efforts for fluid pumping and – in case a cell separation is required – also higher costs for an ultrafiltration unit. A change in the recovery by 1% leads to doubling of the feed stream to be processed and thus is limited by the hydrodynamic constraints of the membrane modules. For plate modules (applied for reverse osmosis) with a total membrane area of 8 m2, maximum feed flow rates of up to 540 kg h-1 are recommended [45]. With consideration of the membrane area required for production of 3500 kg h-1 butanol, these requirements would be fulfilled for a recovery of 16% with a membrane area of 37,900 m2, if the modules are arranged in parallel.
Most fermentation processes for the production of butanol are operated at temperatures between 35°C and 37°C. However, McNeil and Kristiansen [46] and Baer et al. [47] have shown that clostridia can produce butanol even at temperatures of up to 42°C. The feed temperature has a large influence on the permeate fluxes and therefore also has an influence on the investment and operating costs of the membrane-aided butanol separation process. By a temperature increase up to 42°C, the total production costs can be reduced by 12% as compared with the base case process operated at 35°C (Figure 14A). The elevated temperatures increase the permeate fluxes and thus reduce the required membrane area. In this case, however, it must be checked if it is worth it to increase the fermentation temperature because maintaining the temperature at a higher level results in an increased heat requirement for the fermentation and might also affect the fermentation productivity. While a temperature increase of 30% reduces the total costs by 16%, a temperature decrease of 30% has a larger impact on the total production costs, which increase by 31% in this case. This finding suggests that temperature losses, e.g., when pumping the fermentation broth from the fermenter to the pervaporation unit, should be kept as small as possible. Furthermore, the temperature decrease along the membrane module should be minimised.
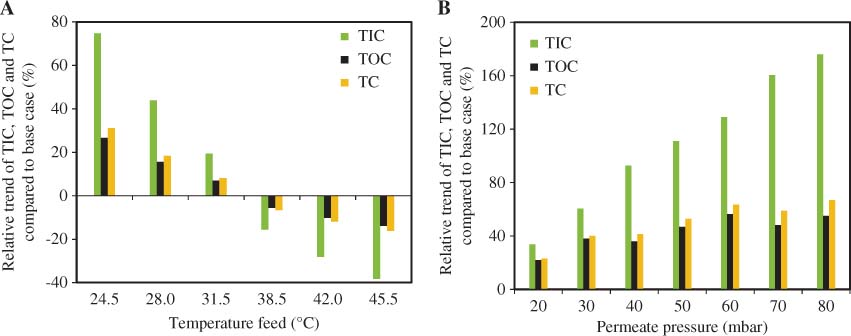
Influence of the feed temperature (A) and the permeate pressure (B) on TIC (green), TOC (black) and TC (orange) compared with the base case configuration of the integrated pervaporation-distillation process.
Another option for an enhancement of the permeate fluxes is the increase of the fermentation broth temperature by an internal heat exchange. The stream from the fermenter can be pumped through a heat exchanger, which uses the retentate stream from the membrane modules as feed source. However, because of the minimal temperature difference required for heat transfer, at least one additional heating and one cooler are needed. Because of the large feed streams to be processed for low recovery rates, the costs for the heat duty of this heater and cooler are uneconomical, especially in comparison with the retentate heater, which consumes one-third of the total operating cost and increases the temperature of the retentate stream only by 2.9°C.
Another option for lowering the operating costs of a pervaporation is the increase of the permeate pressure. As permeate pressure and condensation temperature are interdependent, a higher permeate pressure enables the use of an alternative, cheaper cooling medium. Table 7 lists the required condensation temperatures for different permeate pressures. For permeate pressures of 40 mbar and higher, refrigerated water can be used instead of a refrigerant, leading to cost savings of 25% for the cooling medium compared with the base case. For permeate pressures >70 mbar, process cooling water can be used, if the minimal required temperature difference for heat exchange is reduced to 5°C and the water is fed back to the cooling water system at temperatures lower than <35°C. Because of the lower price for cooling water and the higher admitted temperature increase of the cooling water compared with refrigerated water, the costs for the cooling medium are decreased by 83% compared with the base case. By adjusting to a higher permeate pressure, the costs for cooling medium can be lowered from €0.070 kg-1 (10 mbar) to €0.053 kg-1 (40 mbar) and €0.012 kg-1 (80 mbar). At the same time, the required heat exchange area increases by 290% compared with the base case because of the lowered mean temperature difference between the condensate and the cooling medium. However, the main reason for the increasing investment and operating costs that are shown in Figure 14B is that higher permeate pressures lower the driving force for permeation of butanol (and water) and thus result in large required membrane areas. A higher permeate pressure would only be profitable if the costs for a low-temperature refrigerant increase threefold.
Permeate condensation temperatures and required cooling media.
| pp(mbar) | Tcondensation(°C) | Tcool,max(°C) | Cooling medium |
|---|---|---|---|
| 10 | 5.6 | -4.4 | Low-temp. refrigerant |
| 20 | 15.5 | 5.5 | Low-temp. refrigerant |
| 30 | 21.7 | 11.7 | Low-temp. refrigerant |
| 40 | 26.3 | 16.3 | Refrigerated water |
| 50 | 30.0 | 20.0 | Refrigerated water |
| 60 | 33.1 | 23.1 | Refrigerated water |
| 70 | 35.8 | 30.8a | Process cooling water |
| 80 | 38.1 | 33.1a | Process cooling water |
aDetermined for a minimal temperature difference of 5°C.
The temperature in the decanter mainly influences the process by altering the phase ratio of the aqueous to the organic phase. With an increasing temperature, the organic phase mass flow increases, which is fed to the column. Because the bottom flow rate in the column is a design specification, the internal flow rates in the cycle decanter-column-column condenser-decanter increase. This leads to increased costs for the column, reboiler and column condenser, and furthermore to higher butanol concentrations in the decanter (Figure 15A). In parallel, the aqueous phase flow from the decanter passes through a minimum at a temperature between 54°C and 66°C. For lower or higher temperatures, the aqueous stream increases the internal flow rates and therefore influences the most important cost drivers, which are the required membrane area and permeate condenser.
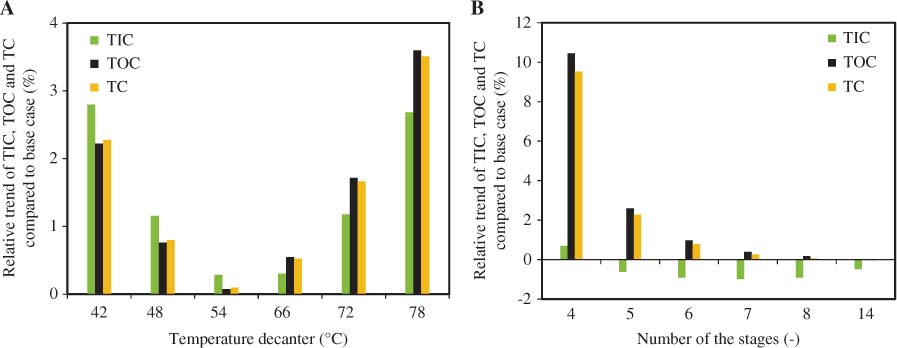
Influence of the decanter temperature (A) and the number of theoretical stages in column C2 (B) on TIC (green), TOC (black) and TC (orange) compared with the base case configuration of the integrated pervaporation-distillation process.
Next to adjusting the temperature in the decanter, another operating possibility is to remove the permeate heater from the process, which preheats the permeate before it is fed to the decanter. The decanter temperature would then be determined by the temperature of the streams from the permeate condenser and the column condenser. Assuming that the column condenser is operated as a total condenser without subcooling, the temperature in the decanter is 15.3°C. Unfortunately, this process could not be examined during these process studies because the binary parameters describing the liquid-liquid equilibrium of butanol and water are only valid at temperatures >35°C. Nevertheless, it can be expected that the influence of this process modification is rather small, as the preheater and the condenser account only for a minor part of the investment and operating costs.
Analogous to the other processes, the influence of the number of stages in the second column is rather small (Figure 15B). The base case design employed a column with 20 theoretical stages and thus makes a nearly ideal separation possible. A reduction of the number of stages first decreases the investment costs by a maximum of 1% without having a large impact on the separation efficiency and process flow rates. The impact of savings from the column investment is negligibly small because they are outweighed by membrane module costs. At a certain number of stages, the separation behaviour deteriorates, leading to larger internal streams to be processed and therefore to larger equipment and energy costs for reboiler, column condenser, decanter and heater for the column feed. For a number of four theoretical stages, the column feed increases by 150%, leading to an increased column diameter (+75%) as well as increased operating costs for the reboiler and the vapour condensation (+200%). It should be mentioned that the increased internal streams do not affect the costs for membrane and permeate condensation. Because of increased ratios of condensed vapour flow to permeate flow, the mean concentration in the decanter increases, leading also to an increased ratio of the organic to the aqueous phase in the decanter. The flow rate of the aqueous phase changes only marginally; thus, the costs for pervaporation do not change.
3.3.4 Conclusions
All processes show a high sensitivity towards the feed concentration. Therefore, metabolic engineering approaches should be used for the identification and engineering of improved microorganisms resistent to higher butanol concentrations. For the benchmark process, the theoretical number of stages, a slightly lowered pressure in the first column C1, as well as the theoretical number of stages in column C2 have a moderate influence on process performance. A pressure above ambient or feed temperatures below 50°C increase the total costs by up to 27%, while vacuum lowers them by up to 9%. Note that for an operation under vacuum as well as under increased pressure, additional costs for pumps would be necessary, which are not considered here. Therefore, those are important design variables for the optimisation of the benchmark process. In the integrated extraction-distillation process, the theoretical number of stages of the extraction column and the solvent-to-feed-ratio play an important role in the investment costs. For this process, the investigation of more efficient solvents in terms of solvent loss through the raffinate and the solubility of the solute will have a positive effect. In the integrated pervaporation-distillation process, the recovery as well as the permeate pressure are important parameters. It can be concluded that the pressure difference across the membrane should be maximal to achieve high fluxes and small membrane areas. The price for membranes is the most dominant factor in the design of a cost-optimal integrated pervaporation-distillation process. One possibility to overcome the limitation by the membrane costs is to increase the permeate fluxes further by optimising the membrane material.
3.4 Sensitivity of cost parameters
To identify the most cost-driving model variables, the sensitivity of the total production costs to cost factors, such as prices for thermal energy, extraction solvent or membranes, and cost-related parameters, such as the membrane lifetime, is analysed.
3.4.1 Benchmark process
As pointed out in Section 3.1.1, in the benchmark process the main cost driver is the thermal energy. Therefore, an analysis of the price for this energy provided in the form of heat steam is done. The price for electric energy is assumed to be €0.06 kWh-1 (see Section 2.3). The price for thermal energy was varied in a range of €0.014 kWh-1 to €0.056 kWh-1. Furthermore the price for cooling medium (water) was varied. The total costs for the purification of 1 kg butanol from the fermentation broth are investigated as a function of the costs for thermal energy relative to electric energy (Ctherm/Celect) and the costs for cooling medium relative to electric energy (Ccool/Celect) (Figure 16). The total costs for the purification increase proportionally with the ratio of thermal costs to costs for electric energy, the influence of the cooling medium price is negligible. All in all, the total costs for the purification of 1 kg butanol vary between €0.15 and €0.57.
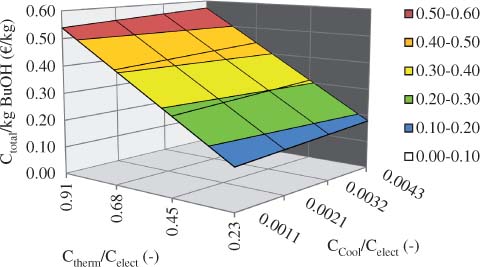
Influence of the costs for thermal energy and cooling medium relative to electric energy on the total production costs per kilogram of butanol of the benchmark process.
3.4.2 Integrated extraction-distillation process
The main cost drivers in the extraction-based process are the price for ionic liquid and thermal energy in terms of heat steam. It has to be noted that the price for ionic liquid assumed for this study (€10–30 kg-1 [40]) is not necessarily the price that accounts for the ionic liquid used as the basis for the process modelling. Therefore, the total costs for the purification of 1 kg butanol from the fermentation broth are investigated as a function of the prices for thermal energy relative to electric energy (Ctherm/Celect) and the prices for ionic liquid relative to electric energy (CIL/Celect) (Figure 17). The costs to compensate the ionic liquid loss through the raffinate stream accounts for >70% of the total operating costs and were varied in a range of €15 to €60 per kilogram of ionic liquid, whereas the price for electric energy was assumed to be €0.06 kWh-1. The price for thermal energy was varied in a range of €0.014 kWh-1 to €0.056 kWh-1. For a small ratio between ionic liquid and electric energy prices, the influence of the thermal-to-electric price ratio on the total costs is high, increasing from €0.13 kg-1 butanol by 60% to €0.21 kg-1 butanol. The higher the ratio between the ionic liquid and the electric energy prices, the lower the effect of the ratio of thermal-to-electic energy prices is. Thus, the relative change in the total costs decreases from the above-given 60% to only 20% for the highest ratio of 1000 kWh kg-1. All in all, the total costs vary in a range of €0.13 and €0.45 per kilogram of butanol.
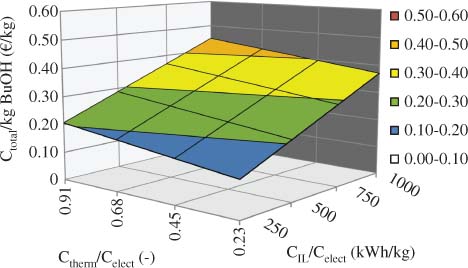
Influence of the costs for thermal energy and ionic liquid relative to electric energy on the total production costs per kilogram of butanol of the integrated extraction-distillation process.
3.4.3 Integrated pervaporation-distillation process
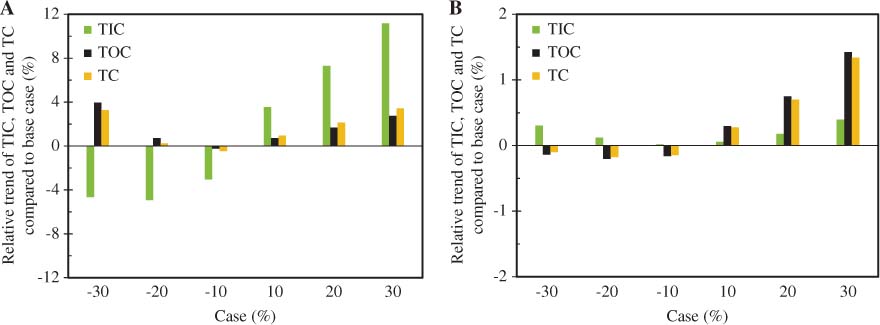
The costs for membranes and module production are crucial for the economic assessments of every membrane process and are often chosen too optimistically [35]. For the base case, costs of €200 m-2 for plate-frame modules and €200 m-2 for membrane replacements were assumed. To examine the influence on the total downstream costs, prices for module and membrane replacement were varied simultaneously as they affect either the investment costs or the operating costs. As shown in Figure 18A, cost variations of up to ±30% directly lead to an increase in the investment costs by ±26% because the modules represent the main part of the investment. As the annualised investment costs are relatively small compared with the total operating costs, the prices for membrane modules do not influence the total operating costs drastically. In contrast, changes in the membrane replacement costs by ±30% result in changes in the operating cost by <±10%. Because both permeate condensation and heating of the retentate stream cause costs in the same order of magnitude, there is only a moderate influence of the membrane price on the total operating costs. An increase of the costs up to €400 m-2 would thus increase the investment costs by 87%, whereas the total operating costs grow by 31% (not shown in Figure 18A).
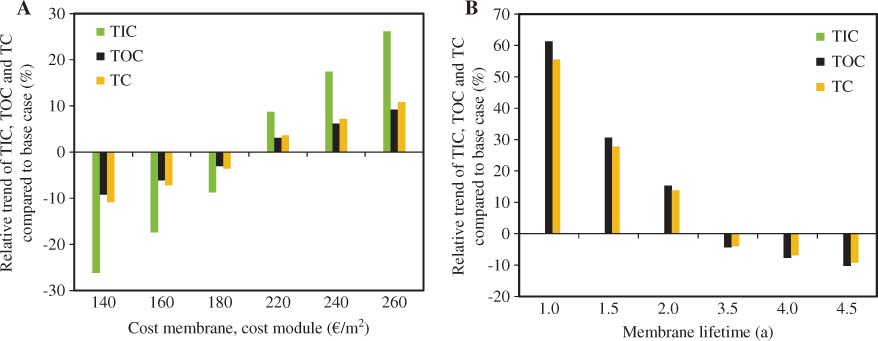
Influence of the costs for membrane and membrane modules (A) and lifetime of the membrane (B) on TIC (green), TOC (black) and TC (orange) compared with the base case configuration of the integrated pervaporation-distillation process.
Similar to the membrane costs, the influence of the membrane lifetime on the operating costs is attenuated, as the membrane costs account for only one part of the total operating costs. A decrease in the lifetime from 3 years to 1 year results in an increase in the total production costs by 55% compared with the base case (Figure 18B). In contrast, an extended lifetime of 4.5 years lowers the costs by 9%.
Figure 19 shows the influence of the prices for thermal energy relative to the prices for electricity (Ctherm/Celect), and the prices for membranes and modules relative to the prices for electricity (Cmemb/Celect) on the total production costs per kilogram of butanol. The prices for thermal energy amount to one-third of the total operating costs and were varied in a range of €0.014 kWh-1 to €0.056 kWh-1, whereas the price for electric energy was assumed to be €0.06 kWh-1. The costs for membrane replacement and modules account for 30% of the total operating costs and for 87% of the total investment costs; they were varied between €50 m-2 and €425 m-2 in this sensitivity study. Both cost factors show a high influence on the production costs. For low ratios of thermal-to-electric energy prices an increase in the membrane and module costs by a factor of >8 leads to an increase in the butanol purification costs by >125%. At high prices for thermal energy, the influence of the membrane price is lowered. In this case, the increase of prices for membrane and modules increases the total costs only by 60%. For low membrane/module-to-electricity price ratios the total production costs increase by >100% for an increase in the thermal energy price by a factor of 4, whereas the total production costs increase by only 50% for high membrane and module prices. Next to prices for thermal energy and membranes, the prices for a low-temperature refrigerant cause 26% of the total production costs as shown for the base case [23]. Its influence on the total costs is smaller compared with the influence of thermal energy costs. For low membrane/module-to-electricity price ratios, an increase in the refrigerant costs by a factor 4 results in a total production cost increase by 58%; for high membrane-to-module prices, the total production costs increase only by 28%.
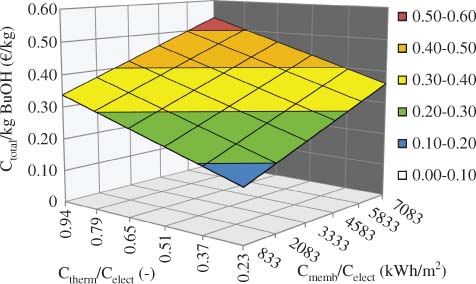
Influence of the costs for thermal energy and membranes/module relative to electric energy on the total production costs per kilogram of butanol of the integrated pervaporation-distillation process.
3.4.4 Conclusions
All processes have in common that with decreasing ratios of Ctherm/Celect as well as CIL/Celect or Cmemb/Celect, respectively, the purification costs for butanol decrease. Depending on the prices for solvents, membranes and thermal energy, the integrated processes have the potential to be more profitable than the benchmark process. The costs for the integrated membrane process varies in the range of €0.16 kg-1 to €0.54 kg-1, while costs for the integrated extraction process vary between €0.13 kg-1 and €0.45 kg-1. In comparison, the benchmark process shows costs in the range of €0.15 kg-1 to €0.57 kg-1 of purified butanol. The high dependency of the benchmark process on costs for thermal energy and cooling medium might benefit the profitability of the extraction- and the pervaporation-based process if costs for ionic liquids and membrane are sufficiently low or if ionic liquid loss and the membrane area can be reduced.
4 Conclusion
The costs of three different processes for the separation of butanol from aqueous feed streams were analysed: a conventional heteroazeotropic distillation process, an integrated extraction-distillation process and an integrated pervaporation-distillation process. Uncertainty analyses were carried out to examine the influence of inaccuracies during experimental investigations or in the fitted model parameters on the total process performance. It was shown that especially uncertainties in the liquid-liquid equilibria, either for binary butanol-water mixtures or for ternary ionic liquid-butanol-water mixtures and uncertainties in the membrane properties such as selectivities and permeances have a large impact on the downstream of butanol. For a better understanding of the processes, the sensitivity of the downstream costs towards changing operating conditions, various design variables such as temperatures and pressures, solvent-to-feed ratios and recovery rates was investigated. The maximum influence of uncertainties, process variables, design parameters and cost variables on the total production costs for butanol determined within this work is summarised in Table 8. It was shown that the solubility of the extraction solvent in the raffinate is one of the main cost drivers in the extraction-based process as it affects solvent loss. The costs of the pervaporation-based recovery strongly depend on the costs for the membrane material and on the permeate fluxes. Identification of parameters having a large influence on the process performance and production costs helps guiding future research by defining objectives for material improvement or experimental investigations. For all processes, the feed concentration has a noteworthy effect on the total downstream costs. An increase in the butanol mass fraction by 0.003 g g-1 reduces the downstream costs by 20–24% for all process configurations.
Maximum deviation of the total production costs compared with the base case configurations. The range process variables, design parameters and cost variables were varied within is described in Sections 3.2 – 3.4.
| Benchmark/distillation | Extraction/distillation | Pervaporation/distillation | ||||
|---|---|---|---|---|---|---|
| Uncertainties | VLE and LLE parameters | -4%/+2% | LLE-Corr. (EXT) | -40%/+118% | Selectivity | -7%/+8% |
| HETP (EXT) | -2%/+2% | Flux decline | -16% | |||
| Design parameters and variables | nth (C1) | +9% | nth (EXT) | -0.6%/+1.6% | Recovery | -3%/+62% |
| wBuOH,Feed | -23%/+43% | wBuOH,Feed | -21%/+39% | wBuOH,Feed | -24%/+52% | |
| Tfeed (C1) | -1%/+18% | ṁSol/ṁFeed | -0.5%/+3.4% | TFeed | -16%/+31% | |
| p (C1) | -9%/+27% | T (DEC) | -0.2%/+1.3% | pPerm (PV) | +67% | |
| Cost variables | Ctherm and Ccool | -37%/+142% | Ctherm and CIL | -44%/+96% | Ctherm and Cmemb | -46%/+82% |
| Memb. lifetime | -9%/+55% | |||||
About the authors

Dipl.-Ing. Sebastian Heitmann studied biochemical engineering at TU Dortmund University from 2004 to 2010. Since April 2010, he is working as a PhD student at the Laboratory of Fluid Separations at TU Dortmund University. The focus of his research is innovative membrane processes and membrane materials for the separation of organics from fermentation broth.

Dipl.-Ing. Martin Stoffers studied chemical engineering at TU Dortmund University and finished his degree with his diploma thesis in December 2008. Since 2009, he works as a PhD student at the Laboratory of Fluid Separations at TU Dortmund University. The focus of his research is the experimental and model-based investigation, analysis and optimization of the processing of bioproducts using extraction with ionic liquids.

Dr. Philip Lutze studied energy and process engineering at the Technical University of Berlin. He graduated in November 2008. Thereafter, he worked on the “Development of a systematic synthesis/design methodology to achieve process intensification” in the groups CAPEC & Process at the Technical University of Denmark in Lyngby. Since December 2011, Philip Lutze is working as an assistant professor at the Laboratory of Fluid Separations at TU Dortmund University. His main scientific focus is in the area of experimental as well as model-based investigation of process intensification for chemical and biobased processes, including hybrid and reactive separation, membrane-assisted separations, novel energy forms and intensified mass transfer.
The research leading to these results received funding from the European Union Seventh Framework Programme (FP7/2007–2013) under grant agreement no. 241718 EuroBioRef.
References
[1] Dürre P. Biotechnol. J. 2007, 2, 1525–1534.Search in Google Scholar
[2] Dow Chemical Company. Available at http://www.dow.com/productsafety/finder/nbut.htm [accessed on 01 February, 2013].Search in Google Scholar
[3] Weissermel, K, Arpe, H. Industrial Organic Chemistry, Wiley-VCH: Weinheim, Germany, 2003.10.1002/9783527619191Search in Google Scholar
[4] Dürre P. Curr. Opin. Biotechnol. 2011, 22, 331–336.Search in Google Scholar
[5] Ezeji TC, Qureshi N, Blaschek HP. Curr. Opin. Biotechnol. 2007, 18, 220–227.Search in Google Scholar
[6] Green EM. Curr. Opin. Biotechnol. 2011, 22, 337–343.Search in Google Scholar
[7] Zverlov VV, Berezina O, Velikodvorskaya GA, Schwarz WH. Appl. Microbiol. Biotechnol. 2006, 71, 587–597.Search in Google Scholar
[8] Ni Y, Sun Z. Appl. Microbiol. Biotechnol. 2009, 83, 415–423.Search in Google Scholar
[9] Green Energy News. Cobalt Technologies and American Process to Build World’s First Cellulosic Biobutanol Refinery 2011. Availabe at http://www.green-energy-news.com [accessed on 03 February, 2012].Search in Google Scholar
[10] Beckwith, P. The Development of Butamax 2010, http://www.butamax.com/_assets/pdf/LLC_development.pdf [Accessed 25 January, 2013].Search in Google Scholar
[11] Kumar M, Gayen K. Appl. Energy 2011, 88, 1999–2012.10.1016/j.apenergy.2010.12.055Search in Google Scholar
[12] Tao L, Aden A. In Vitro Cell. Dev. Biol.-Plant 2009, 45, 199–217.10.1007/s11627-009-9216-8Search in Google Scholar
[13] Groot WJ, van der Lans RGJM, Luyben KCAM. Process Biochem. 1992, 27, 61–75.Search in Google Scholar
[14] Oudshoorn A, van der Wielen LAM, Straathof AJJ. Ind. Eng. Chem. Res 2009, 48, 7325–7336.10.1021/ie900537wSearch in Google Scholar
[15] Roffler SR, Blanch HW, Wilke CR. Bioprocess Eng. 1987, 2, 1–12.Search in Google Scholar
[16] Huang J, Meagher MM. J. Membr. Sci. 2001, 192, 231–242.Search in Google Scholar
[17] Heitmann S, Krings J, Kreis P, Lennert A, Pitner W, Górak A, Schulte M. Sep. Purif. Technol. 2012, 97, 108–114.Search in Google Scholar
[18] Groot WJ, den Reyer MCH, Baart de la Faille T, van der Lans RGJM, Luyben KCAM. Chem. Eng. J. 1991, 46, B1.Search in Google Scholar
[19] Gapes J, Nimcevic D, Friedl A. Appl. Environ. Microbiol. 1996, 62, 3210–3219.Search in Google Scholar
[20] Setlhaku M, Heitmann S, Górak A, Wichmann R. Bioresour. Technol. 2013, in press. http://dx.doi.org/10.1016/j.biortech.2013.02.046.10.1016/j.biortech.2013.02.046Search in Google Scholar PubMed
[21] Qureshi N, Hughes S, Maddox IS, Cotta MA. Bioprocess Biosyst. Eng. 2005, 27, 215–222.Search in Google Scholar
[22] Groot WJ, Luyben KCAM. Appl. Microbiol. Biotechnol. 1986, 25, 29–31.Search in Google Scholar
[23] Stoffers M, Heitmann S, Lutze P, Górak A. Green Process. Synth. 2013, 2, 117–136.Search in Google Scholar
[24] Nigam PS, Singh A. Prog. Energy Combust. Sci. 2011, 37, 52–68.Search in Google Scholar
[25] Kraemer K, Harwardt A, Bronneberg R, Marquardt W. Comput. Chem. Eng. 2011, 35, 949–963.Search in Google Scholar
[26] Groot WJ, Soedjak HS, Donck PB, van der Lans RGJM, Luyben KCAM, Timmer JMK. Bioprocess Eng. 1990, 5, 203–216.Search in Google Scholar
[27] Davis S, Morton SA. Sep. Sci. Technol. 2008, 43, 2460–2472.Search in Google Scholar
[28] Simoni LD, Chapeaux A, Brennecke JF, Stadtherr MA. Comput. Chem. Eng. 2010, 34, 1406–1412.Search in Google Scholar
[29] Cascon HR, Choudhari SK, Nisola GM, Vivas EL, Lee DJ, Chung WJ. Sep. Purif. Technol. 2011, 78, 164–174.Search in Google Scholar
[30] Werner S, Haumann M, Wasserscheid P. Annu. Rev. Chem. Biomol. Eng. 2010, 1, 203–230.Search in Google Scholar
[31] Santangelo F, Stoffers M, Górak A, Pitner W, Schulte M. Conference Proceedings on ISEC 2011, 19th International Solvent Extraction Conference; 3–7 October 2011, Santiago, Chile, 2011.Search in Google Scholar
[32] Domańska U, Królikowski M. J. Chem. Thermodyn. 2012, 53, 108–113.Search in Google Scholar
[33] Izák P, Schwarz K, Ruth W, Bahl H, Kragl U. Appl. Microbiol. Biotechnol. 2008, 78, 597–602.Search in Google Scholar
[34] van Hecke W, Vandezande P, Claes S, Vangeel S, Beckers H, Diels L, de Wever H. Bioresour. Technol. 2012, 111, 368–377.Search in Google Scholar
[35] Vane LM. J. Chem. Technol. Biotechnol. 2005, 80, 603–629.Search in Google Scholar
[36] Liu G, Wei W, Wu H, Dong X, Jiang M, Jin W. J. Membr. Sci. 2011, 373, 121–129.Search in Google Scholar
[37] Qureshi N, Blaschek HP. Sep. Sci. Technol. 1999, 34, 2803–2815.Search in Google Scholar
[38] Claes S, Vandezande P, Mullens S, de Sitter K, Peeters R, van Bael MK. J. Membr. Sci. 2012, 389, 265–271.Search in Google Scholar
[39] Kreis P, Górak A. Chem. Ing. Tech. 2005, 77, 1737–1748.Search in Google Scholar
[40] Meindersma GW, Haan AB. de Chem. Eng. Res. Des 2008, 86, 745–752.10.1016/j.cherd.2008.02.016Search in Google Scholar
[41] Baerns, M, Behr, A, Brehm, A, Gmehling, J, Hofmann, H, Onken, U, Renken, A. Technische Chemie, WILEY-VCH Verlag &Co. KGaA: Weinheim, Germany, 2006.Search in Google Scholar
[42] O’Brien DJ, Roth LH, McAloon AJ. J. Membr. Sci. 2000, 166, 105–111.Search in Google Scholar
[43] Baker, R. Membrane Technology and Applications, Wiley & Sons: West Sussex, UK, 2004.Search in Google Scholar
[44] Turton, R. Analysis, Synthesis, and Design of Chemical Processes, 3rd ed., Prentice Hall: Upper Saddle River, NJ, 2009.Search in Google Scholar
[45] Tiwari, SA, Bhattacharyya, K, Goswami, D, Srivastava, V, Hanra, M. BARC Newsletter, Bhabha Atomic Research Centre, 2004, pp. 220–225.Search in Google Scholar
[46] McNeil B, Kristiansen B. Biotechnol. Lett. 1985, 7, 499–502.Search in Google Scholar
[47] Baer S, Blaschek H, Smith T. Appl. Environ. Microbiol. 1987, 53, 532854–2861.Search in Google Scholar
©2013 by Walter de Gruyter Berlin Boston
Articles in the same Issue
- Masthead
- Masthead
- Graphical abstracts
- In this Issue
- Editorial
- Scientific spring metamorphosis
- Original articles
- Development highlights of micro-nano technologies in the MENA region and pathways for initiatives to support and network
- Integrated processing for the separation of biobutanol. Part A: experimental investigation and process modelling
- Integrated processing for the separation of biobutanol. Part B: model-based process analysis
- Direct saccharification of lignocellulosic biomass by hydrolysis with formic acid solution
- A facile synthesis of 2H-chromen-2-ones via Pechmann condensation under solvent free conditions using grinding technique
- Counter-current arrangement of microfluidic liquid-liquid droplet flow contactors
- Organization profiles
- The Centre for Green Process Engineering (CGPE) opens with launch event at London South Bank University (LSBU)
- King Saud University: nanoscience and nanotechnology research highlights
- Kuwait Institute for Scientific Research
- University profile
- Nanoscience and nanotechnology research highlights at Kuwait University
- Laboratory profiles
- Microfluidics Group – Department of Chemistry, Sultan Qaboos University
- Assiut Microfluidics Laboratory
- Company profiles
- Hikma Pharmaceuticals
- SÜSS MicroTec and iX-factory: qualified process and equipment support for development, research and production – made in Germany
- LionX: our chips enable your products
- Conference announcements
- 17th Annual Green Chemistry and Engineering Conference (GC&E; North Bethesda, MD, USA, June 18–20, 2013)
- 17th IUPAC Conference on Organometallic Chemistry Directed Towards Organic Synthesis (OMCOS 17), Fort Collins, CO, USA, July 28–August 1, 2013
- Conferences 2013/2014
- Book review
- Chemicals from biomass: integrating bioprocesses into chemical production complexes for sustainable development