
A dynamic network approach to language in aphasia: Individual differences in spoken and non-verbal communication
-
Antje Endesfelder Quick
 ,
Marvin Zurek
,
Marvin Zurek

Abstract
Aphasia is an acquired language disorder that can affect comprehension and production. While traditionally categorized into subtypes such as Broca’s, Wernicke’s, and anomic aphasia, many individuals exhibit features from multiple types, challenging rigid classifications. Historically, linguistic research into aphasia has often been guided by rule-based theories, influencing both assessment and treatment. However, alternative perspectives, such as the Usage-Based (UB) approach, offer a more dynamic view, emphasizing individual differences in language capabilities, and predicting variation along a continuum. Within this theoretical perspective, we apply a “Dynamic Network Model” (DNM), which combines word frequencies and transitional probabilities to elucidate individual networks of usage patterns for each person’s language. This study extends the DNM approach to clinical data, analyzing the language networks of six speakers with aphasia (two each with anomic, Wernicke’s, and Broca’s) alongside two control participants, to explore individual differences in spoken language and non-verbal communication. Results reveal that the speakers with aphasia generally have smaller networks, with disrupted connections. However, network size varies within and across aphasia types. Additionally, the speakers with aphasia use more non-verbal communication than control participants, with those with Broca’s and Wernicke’s aphasias using it the most. While some findings may be predicted based on traditional aphasia sub-classifications, the results indicate considerable individual differences within each of the participant groups, both in their spoken language and non-verbal communication, supporting a usage-based approach and adding to questions about the validity of discrete aphasia classifications.
1 Introduction
Aphasia is the most common acquired language disorder in adults (e.g. Kent 2010), resulting from brain damage, most often stroke (Code 2021). The disorder can affect both language production and comprehension, in any/all modalities of language (spoken, written, signed) (Code 2021). It can therefore severely disrupt the ability to communicate and thus to participate in everyday life, with devastating consequences for, amongst others, mood and relationships, and contributing to a reduced quality of life (see Worrall et al. 2016; Rotherham et al. 2024). People with aphasia are often diagnosed with a subtype of the disorder that is described as having a particular cluster of linguistic symptoms. For example, the National Aphasia Association (n.d.) currently lists eight aphasia subtypes, including four non-fluent (Broca’s, transcortical motor, mixed transcortical and global) and four fluent aphasias (Wernicke’s, transcortical sensory, conduction and anomic). Such classifications are problematic, however, as discussed below.
The study of language in people with aphasia, and related clinical practice, have been substantially influenced by the rule-based, generative approach (stemming from the work of Chomsky 1957 onwards), for example in the strict separation of lexis and grammar that has informed aphasia classifications: grammar traditionally being seen as impaired, and lexis preserved, in non-fluent aphasias, and the opposite pattern suggested for fluent aphasias (Hatchard 2021, pp. 17–28; see also Hatchard et al., submitted). However, this approach has been questioned for various reasons. For example, Bates and Goodman (1997) argue that since all speakers with aphasia have some degree of word-finding difficulty, grammar is never affected in isolation from lexis. Aphasia classification has also faced criticism. One key challenge is that people with aphasia often exhibit a combination of symptoms that do not neatly fit into the predefined classifications: there is much variability amongst people diagnosed with the same subtype (e.g. Marshall 2010), and individuals may display symptoms associated with several subtypes (see Murdoch 2010, p. 96). Furthermore, a person’s diagnosis might change over time, for example transitioning from non-fluent to fluent aphasia (Murdoch 2010, pp. 55–56). By failing to account for such issues, these classifications may be counterproductive for understanding the nature of the disorder, as they could oversimplify the complexity of aphasic symptoms and their potential interplay. Since aphasia classification may inform therapy planning and treatment, these issues have implications for the effectiveness of clinical practice in this area. Indeed, subtype diagnosis has been recognized as difficult (Royal College of Speech and Language Therapists 2014), and clinicians and researchers often use the broader ‘non-fluent’ or ‘fluent’ labels instead.
In general, the rule-based, generative approach has been increasingly questioned, including more recently in aphasiology (e.g. Hatchard 2021). An alternative approach that is emerging as a promising perspective from which to characterize language in aphasia is the constructivist usage-based approach (see Ambridge and Lieven 2011), informed by Construction Grammar (Goldberg 1995).
The constructivist usage-based approach rejects a categorical differentiation between lexicon and grammar, instead assuming that language is learned, stored and processed as ‘constructions’, that is, form-meaning pairings of various sizes and degrees of abstraction (see Ambridge and Lieven 2011, pp. 130–131). These range from lexically specific items (single words and fully-filled constructions, e.g. what’s up) to partially filled constructions that have both fixed lexis and at least one schematic slot (e.g. V the hell out of NP; see Perek 2016), to fully schematic (abstract grammatical) constructions (e.g. the ditransitive S V IO DO, underpinning utterances such as she whistled him a tune; see Goldberg 1995, p. 9). Constructions are therefore seen as falling along a syntax-lexicon continuum (Croft 2001), and they make up a structured inventory that constitutes a speaker’s total linguistic knowledge (see Croft and Cruse 2004, pp. 262–265; Ambridge and Lieven 2011, pp. 130–131).
In this approach, there is a heavy emphasis on individual differences, because language acquisition is regarded as a bottom-up, experience-driven process in which language emerges from usage and interaction, and productivity develops gradually (e.g. Ambridge and Lieven 2011, pp. 133–136). Individual differences are therefore expected and have indeed been reported in both children (Kidd et al. 2018) and adults (e.g. Dąbrowska 2012). In the case of aphasia, the issue of individual differences may be particularly pertinent, since many more factors influence language preservation and potential recovery, for instance the extent and location of brain damage, pre-morbid language use, cognitive abilities, and neural plasticity of the brain, social circumstances, as well as factors such as personal motivation and therapy availability/engagement (see Papageorgiou et al. 2024, for a discussion of various such factors). Consequently, individual differences in speakers’ language networks are again expected.
The usage-based approach has only recently begun to gain traction in aphasiology (e.g. Gahl and Menn 2016; Hatchard and Lieven 2019; Martínez-Ferreiro et al. 2020; Hatchard 2021). Hatchard (2021) argues that since aphasia is known to reduce lexical diversity, from a usage-/construction-based perspective, it should reduce the diversity of constructions of all kinds (i.e. at all sizes and degrees of abstraction). However, she argues that constructions that are more lexically-specific may be better candidates for preservation, since these should have been encountered and entrenched more in the speaker’s mind in order to be stored as chunks. In line with this, Hatchard’s (2021) analyses of narratives from six people with various aphasia types indicated that rather than differing categorically by aphasia type, the speakers fell along a continuum, whereby with greater restriction of spoken language, they appeared to have access to fewer constructions overall, and showed reduced schematicity/productivity in their constructions, being increasingly reliant on more frequent, lexically-specific items.
New insight into individual differences in speakers with aphasia may be provided by Ibbotson et al.’s (2019) ‘Dynamic Network Model’ approach. This method uses distributional information – combining word frequencies and transitional probabilities – to build a holistic, pictorial network of usage patterns for each person’s language. In the resulting network, the words used by a speaker are shown as ‘nodes’, and links between these nodes signify which words are used in combination by the speaker. Words that are frequently used together are shown to form certain ‘hubs’ (so-called ‘communities’ of frequently occurring strings of words). Lexical diversity is visualized by the number of nodes, and the number of links between such nodes then indicates levels of language productivity: the more nodes and links a speaker has, the more productive their spoken language patterns are; the fewer nodes and links, the more reduced their speech is. This method thus helps to visualize individual differences in language output between speakers.
To produce the network diagram, all utterances are firstly parsed into bi-grams and the DNM algorithm constructs a network using these bigrams and their transitional probabilities. When the model encounters a word for the first time, it adds it as a new node in the network. If two words co-occur, an edge (link) is created between the corresponding nodes. Each subsequent co-occurrence strengthens the edge, represented visually by increased line thickness (see Figure 2 in section 2). The more often words are used together, the more likely they are to be one multi-word unit in the speaker’s language network: “[…] dips in transitional probability profiles represent likely phrase boundaries, and peaks indicate likely groupings of words” (Ibbotson et al. 2019, p. 655). The ‘chunking’ of frequently occurring multiword sequences in this way could yield a fully-filled (lexically-specific) construction or a frame (lexically-specific part) of a frame-and-slot (partially-filled) pattern (Ibbotson et al. 2019, pp. 38–39). Studies using network approaches to investigate language in neurotypical speakers have demonstrated a ‘small-world’ effect, where words (nodes) are closely connected in local clusters but are globally accessible through short paths that connect distant words in different clusters. Local clustering of frequently co-occurring words and short paths to other clusters support rapid navigation through the network and efficient word retrieval (e.g. Cancho and Solé 2001). However, such an approach has not been explored in speakers with aphasia. Applying a DNM approach to language from speakers with this disorder might shed new light on the degree of preservation of both words and the co-occurrence links between these (distributional information) in aphasia. It could contribute to the examination of individual differences across speakers in general, but also how any differences may manifest within and across speakers with different aphasia subtypes and compared with those without aphasia.
In addition, existing applications of the DNM (in typical speakers) have concentrated on language, so far in the spoken modality. However, where transcribed data also includes notation of non-verbal communication, such non-verbal instances can also be incorporated into the generated network. Various studies using methods other than the DNM approach have reported greater use of gesture in people with aphasia compared with control speakers without this disorder (e.g. Sekine and Rose 2013; de Beer et al. 2019), potentially as a compensatory mechanism for language difficulty (e.g. Ozturk and Özçalışkan 2024). This could also be influenced by aphasia type; for example, individuals with Broca’s aphasia (a non-fluent subtype in which spoken output is especially restricted) may particularly use higher degrees of gesture (Ozturk and Özçalışkan 2024). It is therefore interesting to examine the degree of any non-verbal communication present in speakers’ data through a DNM approach, exploring how this is integrated in the speakers’ networks, and, again, any differences within and between the participant groups.
Therefore, this study applies a usage-based perspective, specifically a dynamic network model approach, to connected speech samples from six speakers with one of three different aphasia subtypes (one non-fluent type: Broca’s aphasia; and two fluent types: Wernicke’s and anomic aphasias), as well as from two control speakers without aphasia. We use the DNM method to visualize the language networks in the different speakers and to provide a descriptive and holistic picture of language use in this spoken output.
Specifically, we investigate:
Individual differences in spoken language usage between and within speakers with different aphasia types and those without aphasia
Individual differences in the degree of non-verbal communication between and within the different participant groups.
2 Method
2.1 Participants/language samples
The language samples analyzed were taken from the AphasiaBank database (MacWhinney et al. 2011). Here, we included six speakers with aphasia: two with fluent aphasias (Wernicke’s and anomic) and one with non-fluent (Broca’s) aphasia, as well as two control participants without speech or language impairment. The participants were selected to be of a similar age range, between 48-63 years old (mean=56). Details of these participants and the source corpora are summarized in Table 1. The aphasia types are those listed in the respective corpus.
Summary of participant and corpus details.
| Participant group (aphasia type/control) | Aphasia Bank Corpus | Participant ID | Gender | Age at time of sample recording | Number of words | Duration of recording |
|---|---|---|---|---|---|---|
| Anomic | Adler (Szabo 2008) | Adler01a | Male | 58;11 | 1824 | 01:02:50 h |
| Adler08a | Male | 56;09 | 932 | 00:59:10 h | ||
| Wernicke’s | ACWT (Binek & Shelley 2012) | ACWT10a | Male | 48;04 | 699 | 00:30:31 h |
| ACWT11a | Male | 61;08 | 2739 | 00:53:52 h | ||
| Broca’s | Adler (Szabo 2008) | Adler13a | Male | 52;04 | 1421 | 00:49:10 h |
| Adler16a | Male | 63;06 | 930 | 00:33:25 h | ||
| Control | Capilouto (Capilouto 2008) | Capilouto11a | Male | 53;05 | 2619 | 00:20:02 h |
| Capilouto19a | Male | 60;09 | 893 | 00:09:53 h |
To give some indication of the speakers’ connected speech profiles, Figure 1 shows the Mean Length of Utterance (MLU) in morphemes for each person. Here, the control speakers have longer utterances than all speakers with aphasia. The speakers with anomic aphasia produce slightly longer utterances than those with Broca’s or Wernicke’s subtypes. The lowest MLU was measured for one of the speakers with Broca’s aphasia (Adler16a).
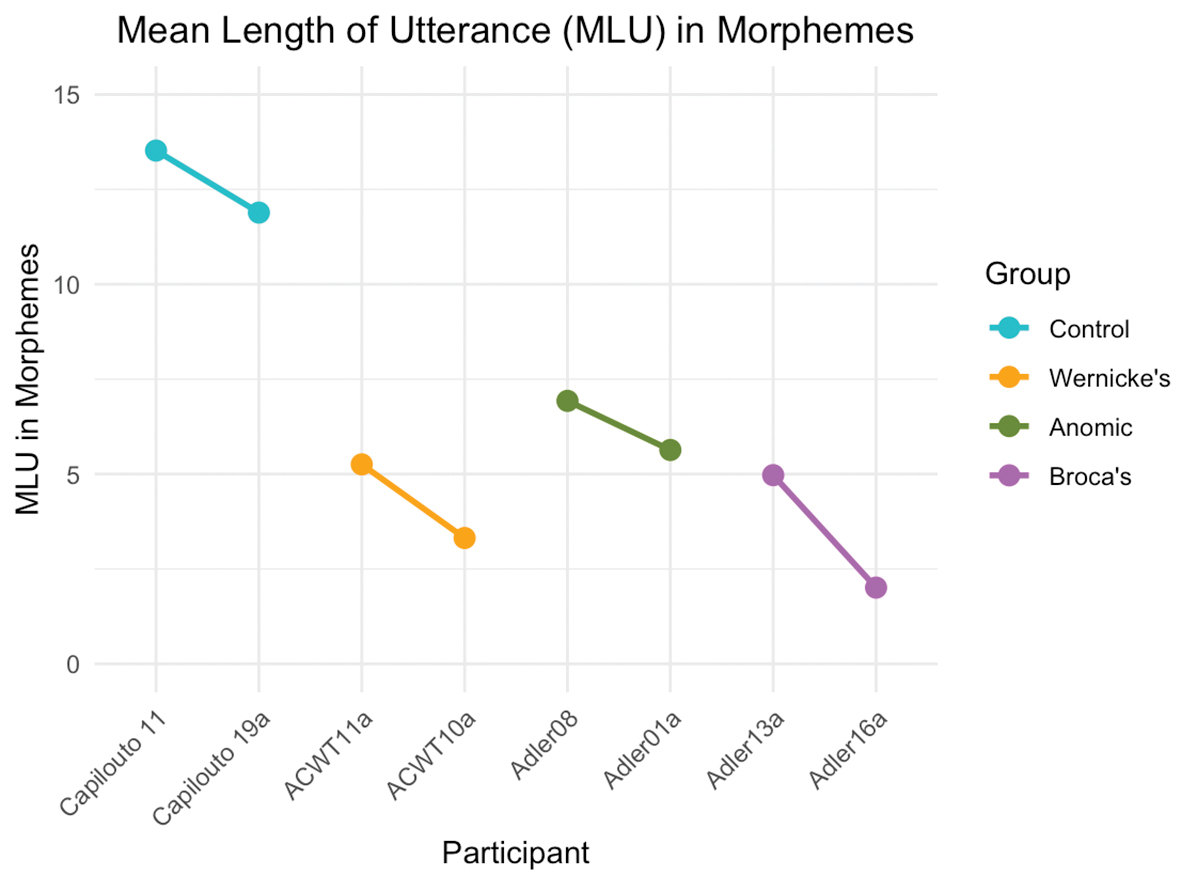
MLU scores for each speaker.
2.2 Language sample elicitation and transcription
The spontaneous speech samples were gathered during discourse elicitation tasks. The participants with aphasia completed several elicitation tasks, including: talking about their speech; talking about their stroke, talking about an important life event; telling three different stories each from a sequence of pictures (referred to in AphasiaBank as the ‘window’, ‘umbrella’, and ‘cat’ tasks), narrating the Cinderella story (including a preceding introductory discussion to the task) and describing a process (how to make a peanut butter and jelly sandwich). The two control speakers completed the same tasks, except that instead of talking about their own speech, they were asked about any experience they had had “with people who have a difficult time communicating”, and rather than being asked about a stroke, they were asked to talk about any illness or injury they had sustained. In our analysis, we included only overlapping tasks completed by all participants with aphasia and left out further tasks from these same language samples that were only completed by individuals (e.g. the ‘flood’ story) and/or were single-word production tasks, rather than connected speech (e.g. the Boston Naming Test [Kaplan et al. 1983]).
The speech samples were fully transcribed and annotated in SONIC CHAT format (MacWhinney 2000) by the Adler Institute and the Aphasia Centre of West Texas. The annotations include error codes for phonological [p:w] and semantic [s:r] errors, neologisms [n:k], corrections, repetitions, pauses, and, important to our study, it also includes non-verbal cues [&=]; all such annotations were included in the model.
2.3 Analyses
We applied the DNM approach introduced by Ibbotson et al. (2019), which combines word frequencies and the frequency of co-occurring words (represented by the edges). At first, we parsed all utterances into bi-grams. For example, the utterance and I couldn’t talk was broken down into the following bi-grams: and I, I couldn’t, couldn’t talk. Based on their frequencies in the corpus, the transitional probabilities between these pairs vary. The DNM algorithm constructs a network using these bigrams and their frequency of co-occurrence. As explained, when the model encounters a word for the first time, it adds it as a new node in the network. Each subsequent occurrence is reflected in node size: the more frequently a word occurs, the bigger its node. If two words co-occur, an edge (link) is created between the corresponding nodes. Each subsequent co-occurrence strengthens the edge, represented visually by increased line thickness (Figure 2 for and I couldn’t talk, And I said). In this way, the network grows to reflect patterns of use based on distributional data (Ibbotson et al. 2019, pp. 656). Since we were also interested in the degree of usage of non-verbal communication, we constructed two networks for each speaker, one including instances of non-verbal communication and one without these instances.
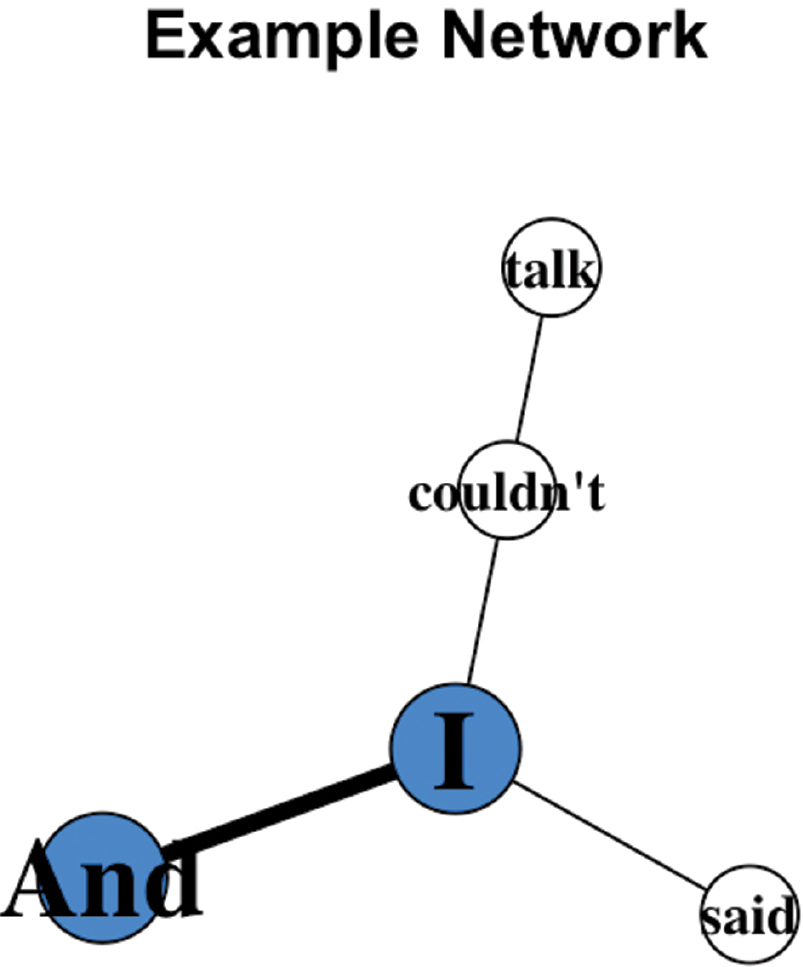
Example network, showing nodes for and, I, said, couldn’t, talk, and ‘edges’ (shown by connecting lines) between these. Blue colors show that ‘and’, ‘I’ belong to the same community (frequently co-occurring words), whereas the non-colored nodes are not part of a community. The weighting of edges signifies the strength of collocation.
For visualizing the individual networks, we used the Gephi network visualization and analysis software (Bastian et al. 2009). The non-verbal instances are colored orange for legibility. The size of nodes is set according to their weight in a one-to-one scale. The same applies for edges. The network is tested for communities with the modularity function of Gephi, with a resolution of 1, edge weight on, and the randomize function on. Afterwards, the nodes are colored according to the community of nodes they belong to, and the colors of the nodes are generated randomly. The layout is created by applying the ‘force-atlas 2’ algorithm, which applies a gravitational force to the weight of nodes and edges. It pulls the most frequent nodes and edges into the middle of the network and towards each other, making the network concentric. To detect communities (groups of nodes) in the speech, we used the Louvain Method (Blondel et al. 2008), which was developed to uncover communities in a network that are more densely connected internally than with the rest of the network (modularity). Modularity measures the density of links inside communities compared to links between communities and thus measures the strength of the division of a network into communities. Links inside a community are stronger than links between communities. The idea is to partition the network into communities such that the modularity is maximized. To do so, the algorithm evaluates any change in modularity if the node is moved to a different community and performs the move if it increases (maximizes) modularity.
3 Results
In this section, we firstly provide an overview of numerical data across the participants, before presenting the networks and an accompanying short commentary for each speaker. The numerical data is summarized in Table 2. For each participant, we provide data for the two networks: one including non-verbal communication and one without non-verbal communication. For each of these networks, we provide the number of types, tokens and type-token ratios both for nodes, edges and (in the relevant networks) non-verbal communication. Taking the total number of nodes as an indication of network size, there is some suggestion that this is generally decreasing across the groups from the control group speakers, Wernicke’s group, anomic group and Broca’s group; but not all speakers fit this trend, and there are also clear differences in network size within these groups (see Figure 3).
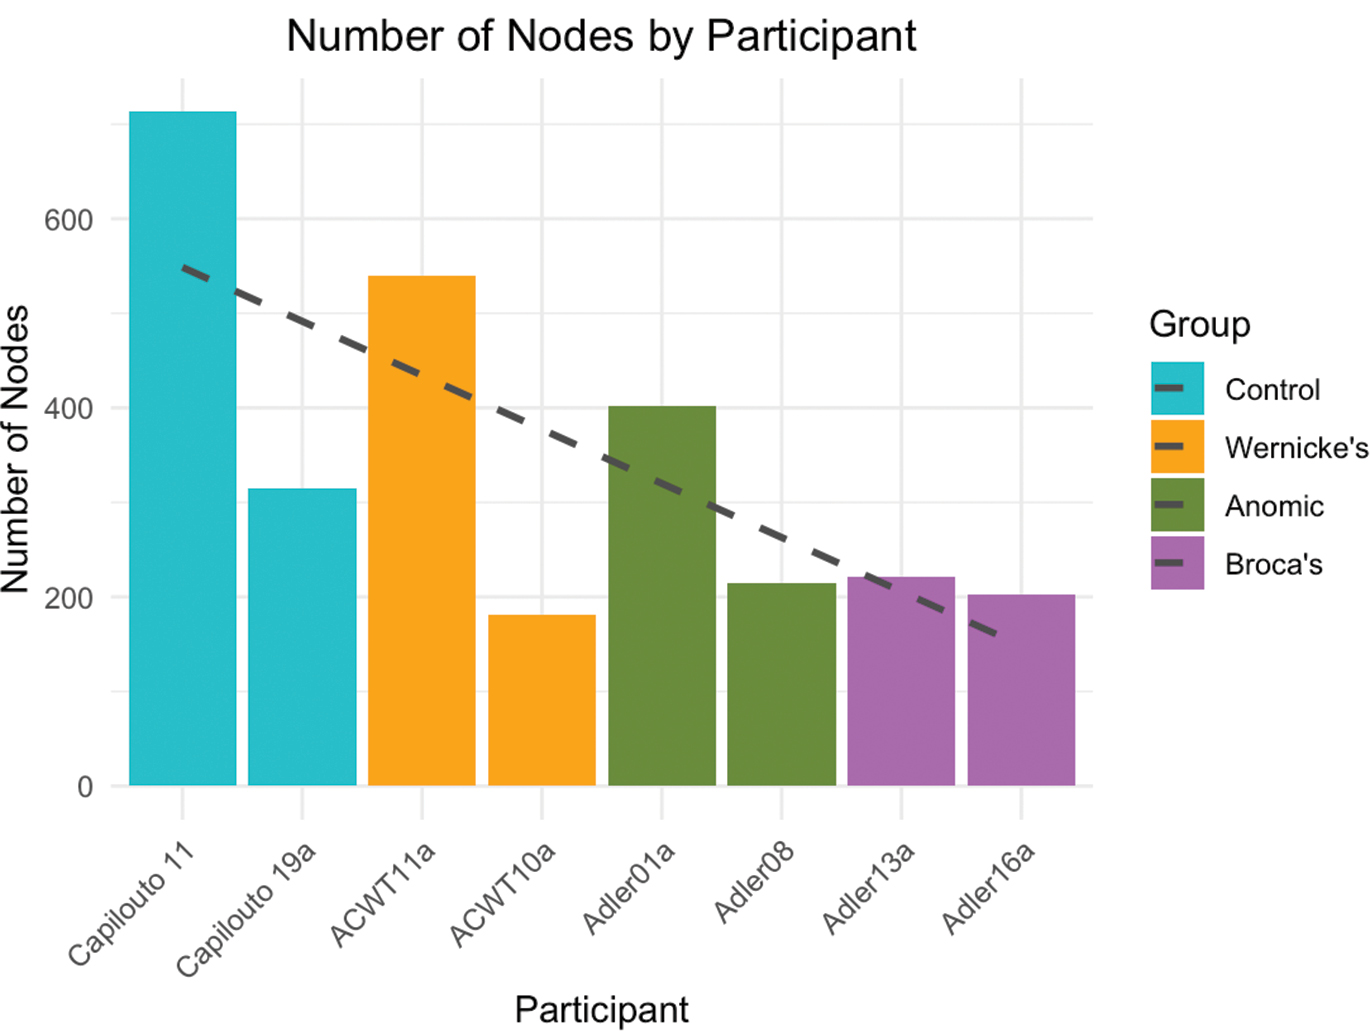
Number of nodes per speaker.
Comparison of the networks including and excluding non-verbal communication.
| Aphasia type/control status and participant ID | Network with/without non-verbal communication | Nodes | Edges |
|---|---|---|---|
| Control speaker Capilouto11a |
With | 713 types 2582 tokens 0.27 type/token ratio |
1838 types 2375 tokens 0.77 type/token ratio |
| Without | 704 types 2571 tokens 0.27 type/token ratio |
1825 types 2364 tokens 0.77 type/token ratio |
|
| Difference | −9 types −11 tokens |
−13 types −11 tokens |
|
| Control speaker Capilouto19a |
With | 315 types 884 tokens 0.35 type/token ratio |
620 types 781 tokens 0.79 type/token ratio |
| Without | 312 types 878 tokens 0.35 type/token ratio |
615 types 776 tokens 0.79 type/token ratio |
|
| Difference | −3 types −6 tokens |
−5 types −5 tokens |
|
| Wernicke’s Aphasia ACTW10a |
With | 181 types 568 tokens 0.31 type/token ratio |
318 types 432 tokens 0.73 type/token ratio |
| Without | 124 types 466 tokens 0.26 type/token ratio |
224 types 335 tokens 0.66 type/token ratio |
|
| Difference | −57 types −102 tokens 0.05 type/token ratio |
−94 types −97 tokens 0.07 type/token ratio |
|
| Wernicke’s Aphasia ACTW11a |
With | 540 types 2291 tokens 0.23 type/token ratio |
1579 types 1958 tokens 0.80 type/token ratio |
| Without | 376 types 1935 tokens 0.19 type/token ratio |
1210 types 1605 tokens 0.75 type/token ratio |
|
| Difference | −164 types −356 tokens |
−369 types −353 tokens |
|
| Anomic Adler01a |
With | 402 types 1737 tokens 0.23 type/token ratio |
1007 types 1541 tokens 0.65 type/token ratio |
| Without | 383 types 1698 tokens 0.22 type/token ratio |
967 types 1502 tokens 0.64 type/token ratio |
|
| Difference | −19 types −39 tokens |
−40 types −39 tokens |
|
| Anomic Adler08a |
With | 215 types 876 tokens 0.24 type/token ratio |
528 types 755 tokens 0.69 type/token ratio |
| Without | 200 types 821 tokens 0.24 type/token ratio |
481 types 700 tokens 0.68 type/token ratio |
|
| Difference | −15 types −55 tokens |
−47 types −55 tokens |
|
| Broca’s Adler13a |
With | 221 types 1110 tokens 0.19 type/token ratio |
471 types 803 tokens 0.58 type/token ratio |
| Without | 93 types 750 tokens 0.12 type/token ratio |
187 types 457 tokens 0.40 type/token ratio |
|
| Difference | −128 types −360 tokens |
−284 types −346 tokens |
|
| Broca’s Adler16a |
With | 202 types 745 tokens 0.27 type/token ratio |
489 types 647 tokens 0.75 type/token ratio |
| without | 149 types 609 tokens 0.24 type/token ratio |
350 types 512 tokens 0.68 type/token ratio |
|
| Difference | −53 types −136 tokens |
−139 types −135 tokens |
We now present the individual networks for each speaker, starting with the control speakers. As previously mentioned, the color coding of the different communities is not uniform but generated for each network individually. Spoken items are shown as nodes in black text, while instances of non-verbal communication are displayed as nodes in orange text. The larger a node is, the more weight (frequency) it has. The darker and thicker the edges are, the more frequently the two words co-occur. For each speaker, the first network includes non-verbal cues, and the second network excludes non-verbal cues. We describe the networks in terms of the most frequent nodes and also provide some qualitative descriptions for each speaker’s network, e.g. types of words, biggest communities, or specific instances of non-verbal communication.
3.1 Control speakers
3.1.1 Capilouto11a
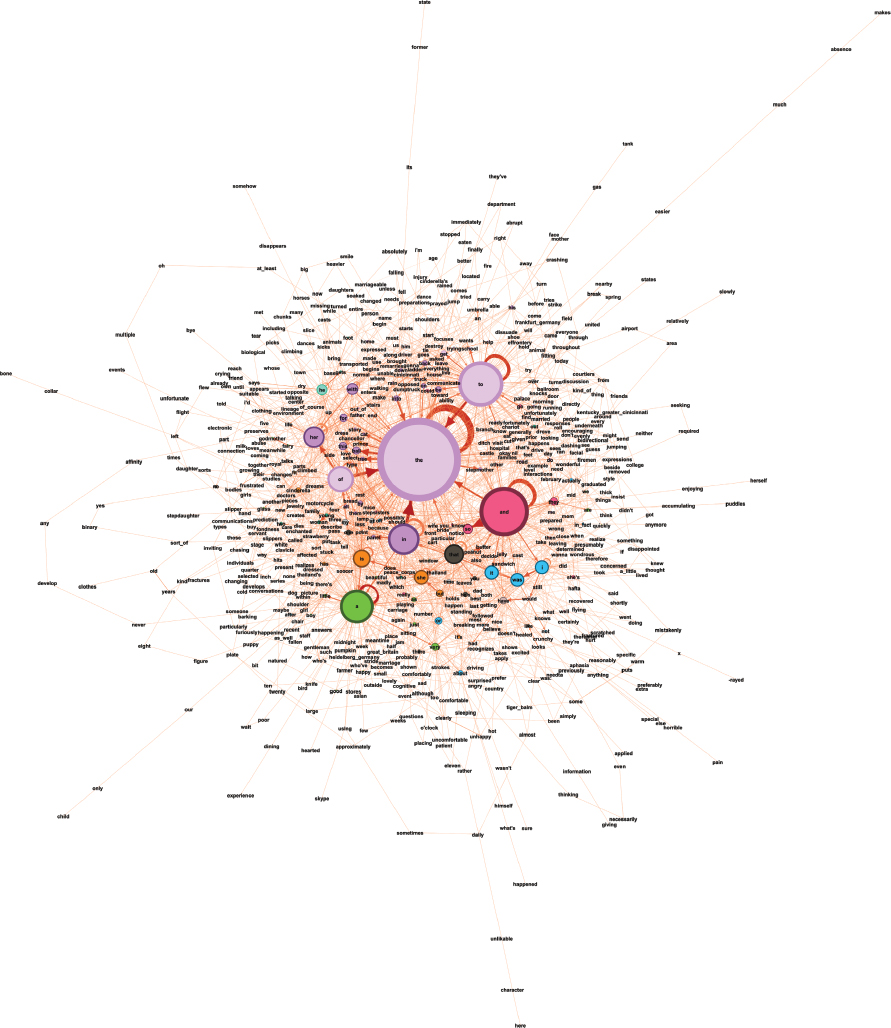
Capilouto11a’s network including non-verbal communication is the largest network of all speakers (Figure 4), with 713 individual nodes (M=348; SD=191.65) and the highest total weight (frequency) of nodes with 2582 (M=1349; SD=758.76). He has the most connections with 1838 unique edges (M=856.25; SD=566.37) and with a total weight of edges of 2375 (M=1161.5; SD=705.73). The most common nodes are: the, and, to, a, in, of, her, that, is, she. These are therefore all words traditionally classed as grammatical/function words: articles, prepositions, pronouns, a coordinating conjunction, a form of the verb BE, and that (which could be a pronoun or conjunction). The general structure of the network shows a ring of the highest frequency nodes around a core of highly interconnected but lower frequency nodes. All nodes are connected to the network, indicating that there are no single words produced in isolation.
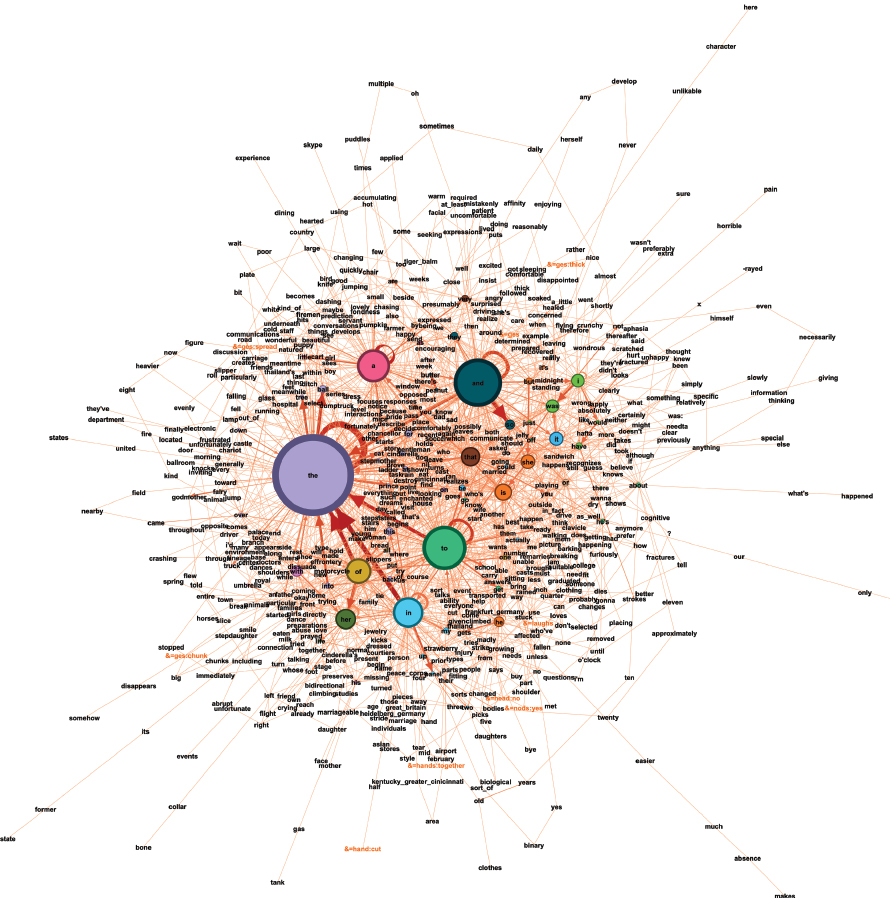
Capilouto11a’s network with non-verbal communication.
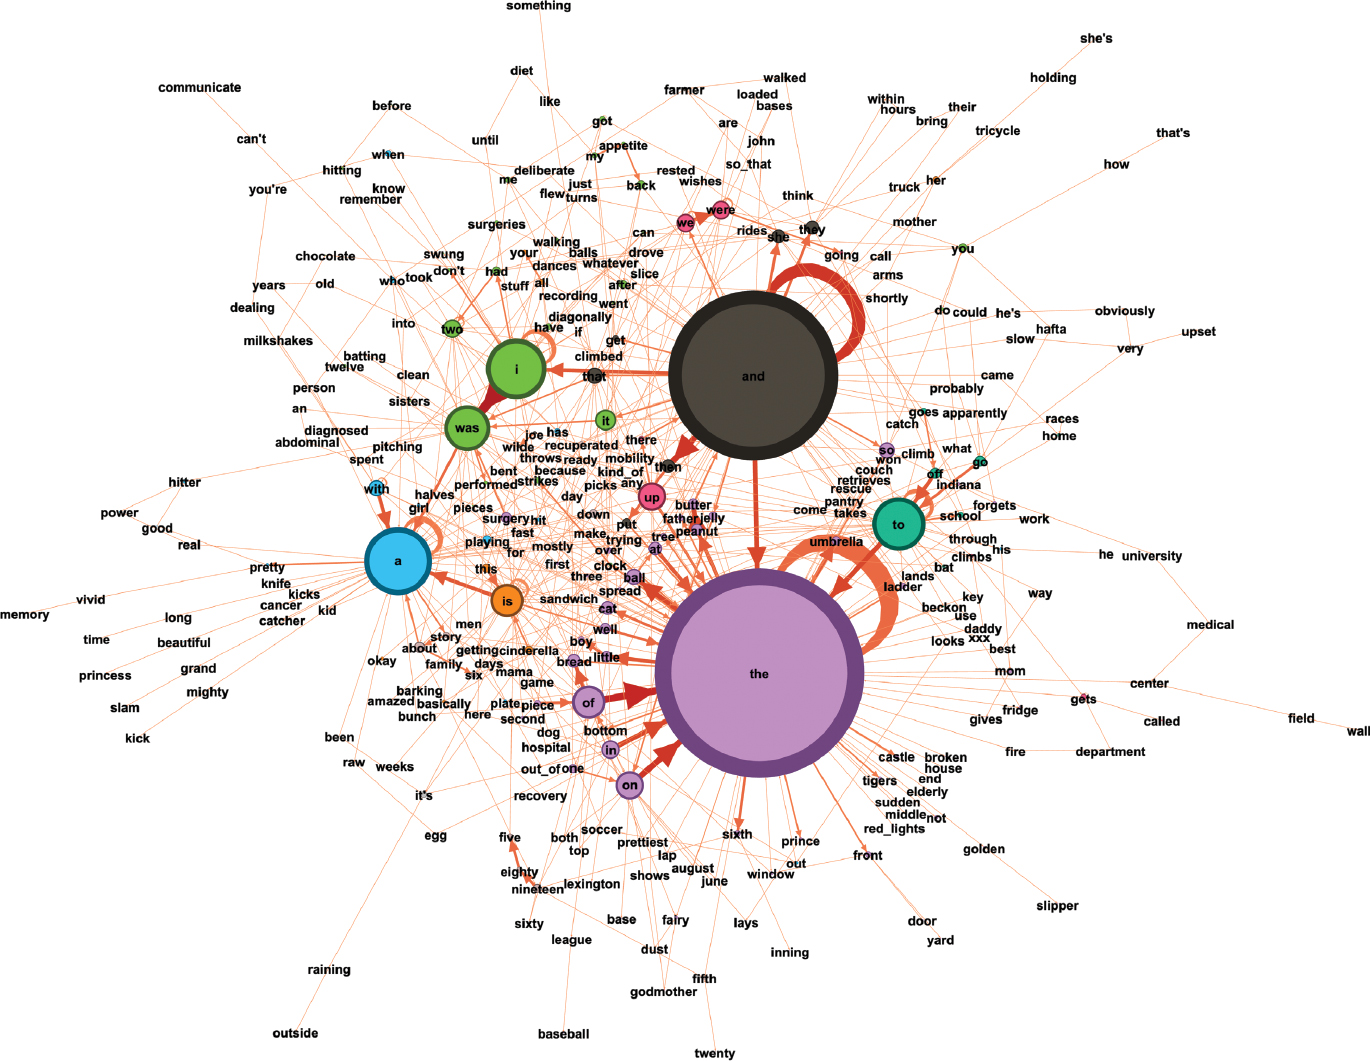
Capilouto11a’s second network, excluding non-verbal communication, is shown in Figure 5. This shows that the speaker uses very little non-verbal communication (11 instances); In addition, any such instances do not replace essential lexis but rather emphasize it. The size of the network does not change substantially, as can be seen by the number of nodes and edges (see Table 2).
Capilouto11a’s network without non-verbal communication.
3.1.2 Capilouto 19a
The network of Capilouto19a including non-verbal communication (Figure 6), is substantially smaller than that of the other control speaker, with only 315 unique nodes (M=348; SD=191.65) and a total node weight of 884 (M=1349; SD=758.76). Capilouto19a’s network also has fewer connections, with 620 unique edges (M=856.25; SD=566.37) and a total edge weight of 781 (M=1161.5; SD=705.73).
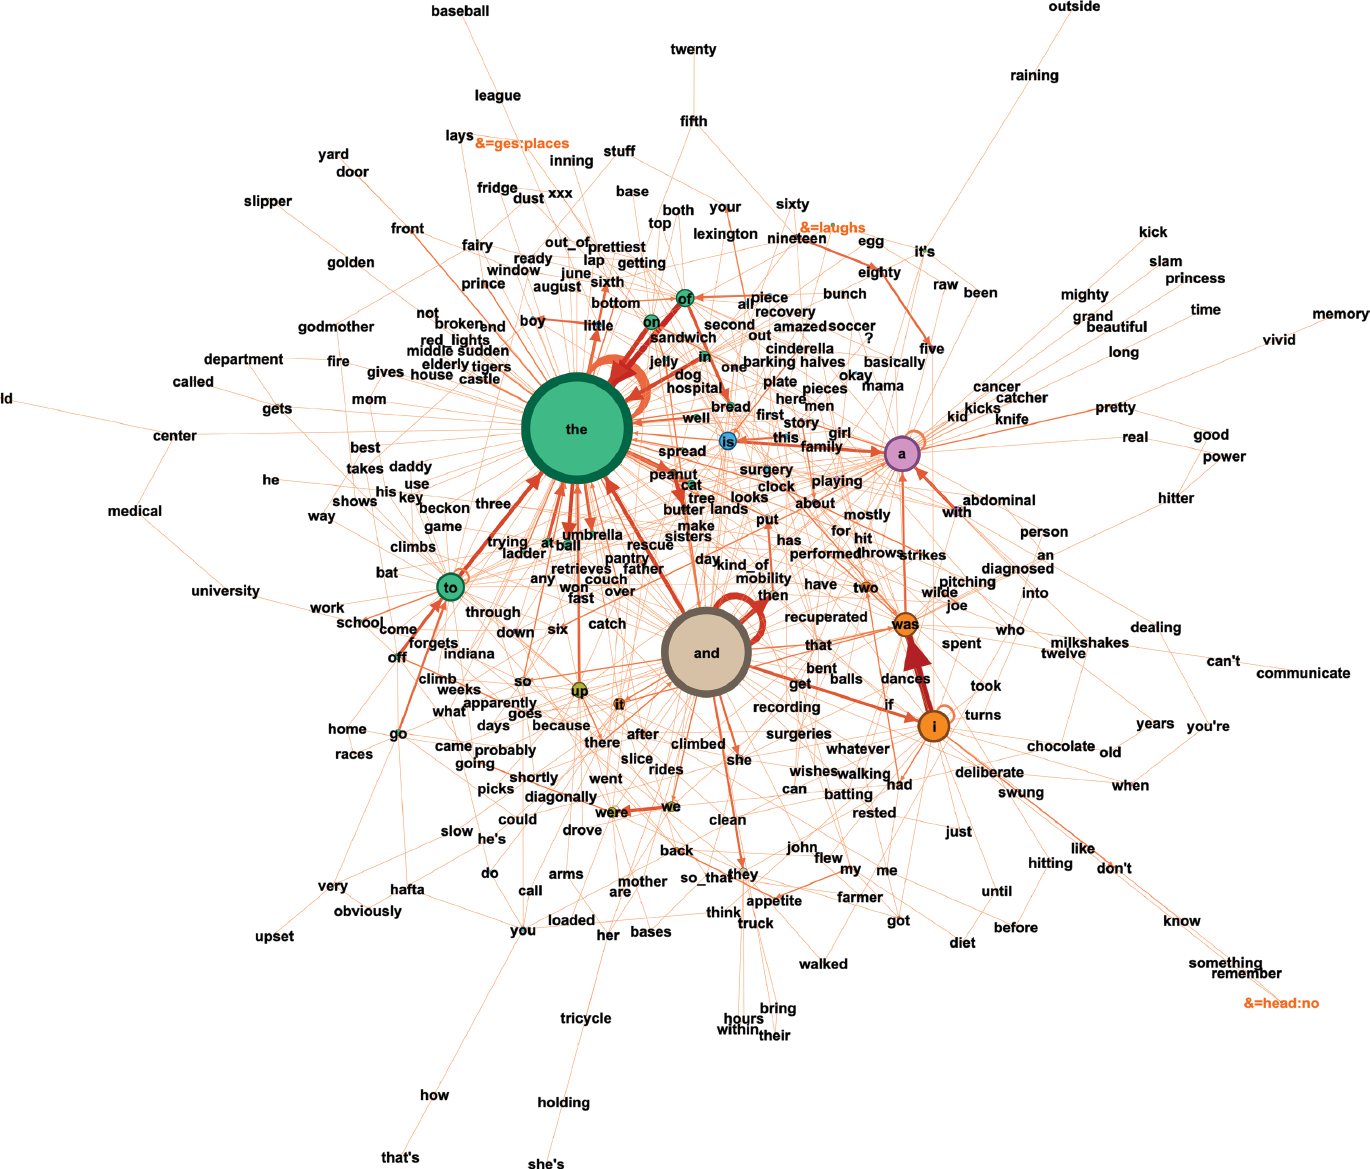
Capilouto19a’s network with non-verbal communication.
The most frequent nodes are: the, and, a, I, to, was, is, of, on, up. These are therefore again almost all items traditionally regarded as grammatical/function words: articles, a coordinating conjunction, prepositions, different forms of the verb BE, and a pronoun. The general structure of the network is concentric, therefore, the “lightest” elements, with the least frequency are found on the periphery of the network. Some words are only connected to the network on one end and radiate as strings outward, whereas others are arching out, held back by additional connections, indicating a wider range of use by the speaker. Further into the network, there is a ring of nodes with high frequencies and high-frequency connections that act as hubs as they often gather their own communities (indicated by the same-colored nodes). These include: the, is, a, I, was, and, we, and were. As also found in the case of the other control speaker, all nodes are connected to the network, indicating that there are no single words produced in isolation.
As can be seen in the second network (excluding non-verbal communication; see Figure 7), Capilouto19a has the fewest instances of non-verbal communication of any of the participants (7 instances; see Table 2). Like in Capilouto11a’s case, the non-verbal communications (indicated by a preceding &=ges gesture) have no semantic functions of their own and also do not direct any joint focus between the participant and interviewer. Instead, they add emphasis to a spoken item, as can be seen in the example bigram (&=ges:places, on), where the speaker accompanies the lexical item ‘on’ with a gesture that indicates placing something on a surface. Similar to that of the other control speaker, Capilouto 19a’s network does not change substantially with the addition of non-verbal communication, indicating that he does not rely on this type of communication very much.
Capilouto19a’s network without non-verbal communication.
3.2 Speakers with anomic aphasia
3.2.1 Adler01a
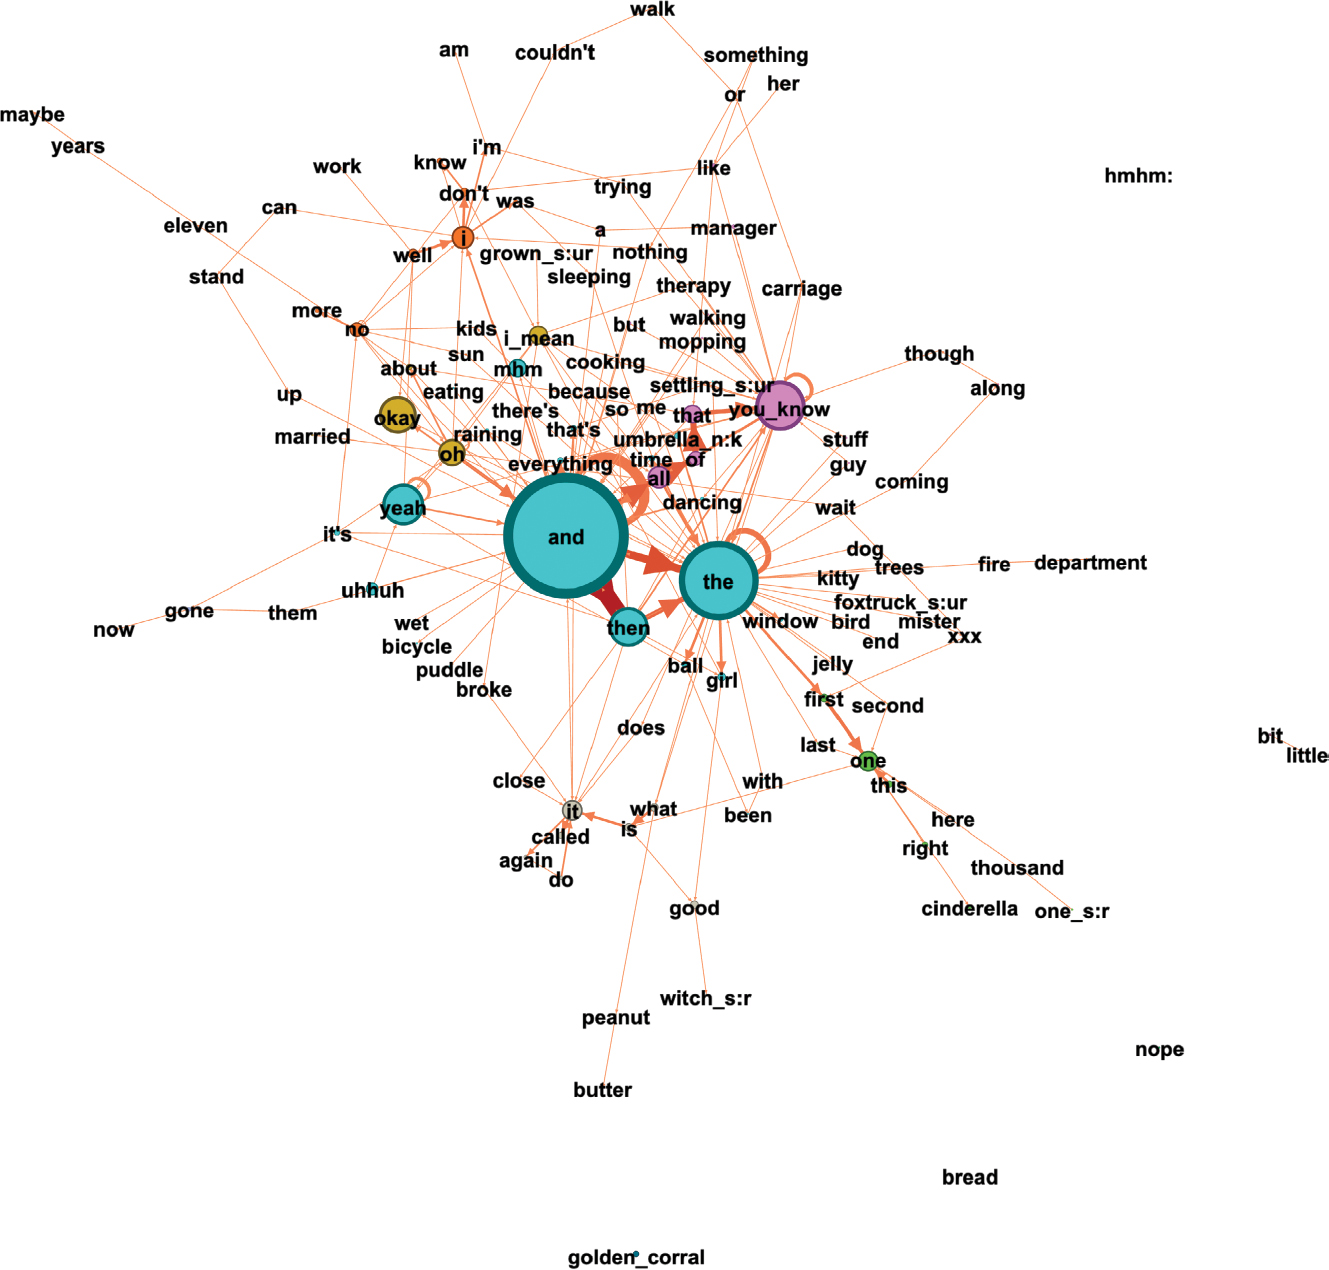
The network of the first speaker with anomic aphasia, Adler01a, including non-verbal communication (Figure 8), is the third largest of any of the participants (after that of one control participant and one speaker with Wernicke’s aphasia), containing 402 unique nodes (M=348; SD=191.65), with a total weight of 1737 (M=1349; SD=758.76). Furthermore, it has 1007 unique edges (M=856.25; SD=566.37), with a total weight of 1541 (M=1161.5; SD=705.73). The most common nodes of the network are: I, and, the, then, a, was, it, but, you_know, he; these are therefore again mostly words that would traditionally be categorized as grammatical/function words (pronouns, articles, conjunctions), although there is also an adverb (then), a form of the verb BE, and the multiword item you_know. Of these, by far the most frequent nodes are I, and, the, with their repetition indicated by their much larger size relative to other nodes in the network. Overall, the network shows a focus on very few nodes and edges. The biggest community, I, is mostly a combination of I and a lexical or auxiliary verb. As was the case in the control speakers’ networks, all spoken nodes are connected to the network (see Figure 8), therefore showing no single words produced in isolation.
Adler01a’s network with non-verbal communication.
There are considerably fewer instances of non-verbal communication (39 tokens; compare Figures 8 and 9) than in the networks of the speakers with both Wernicke’s and Boca’s aphasias (Table 2) but still more compared to the control speakers (11 and 6 tokens, respectively).
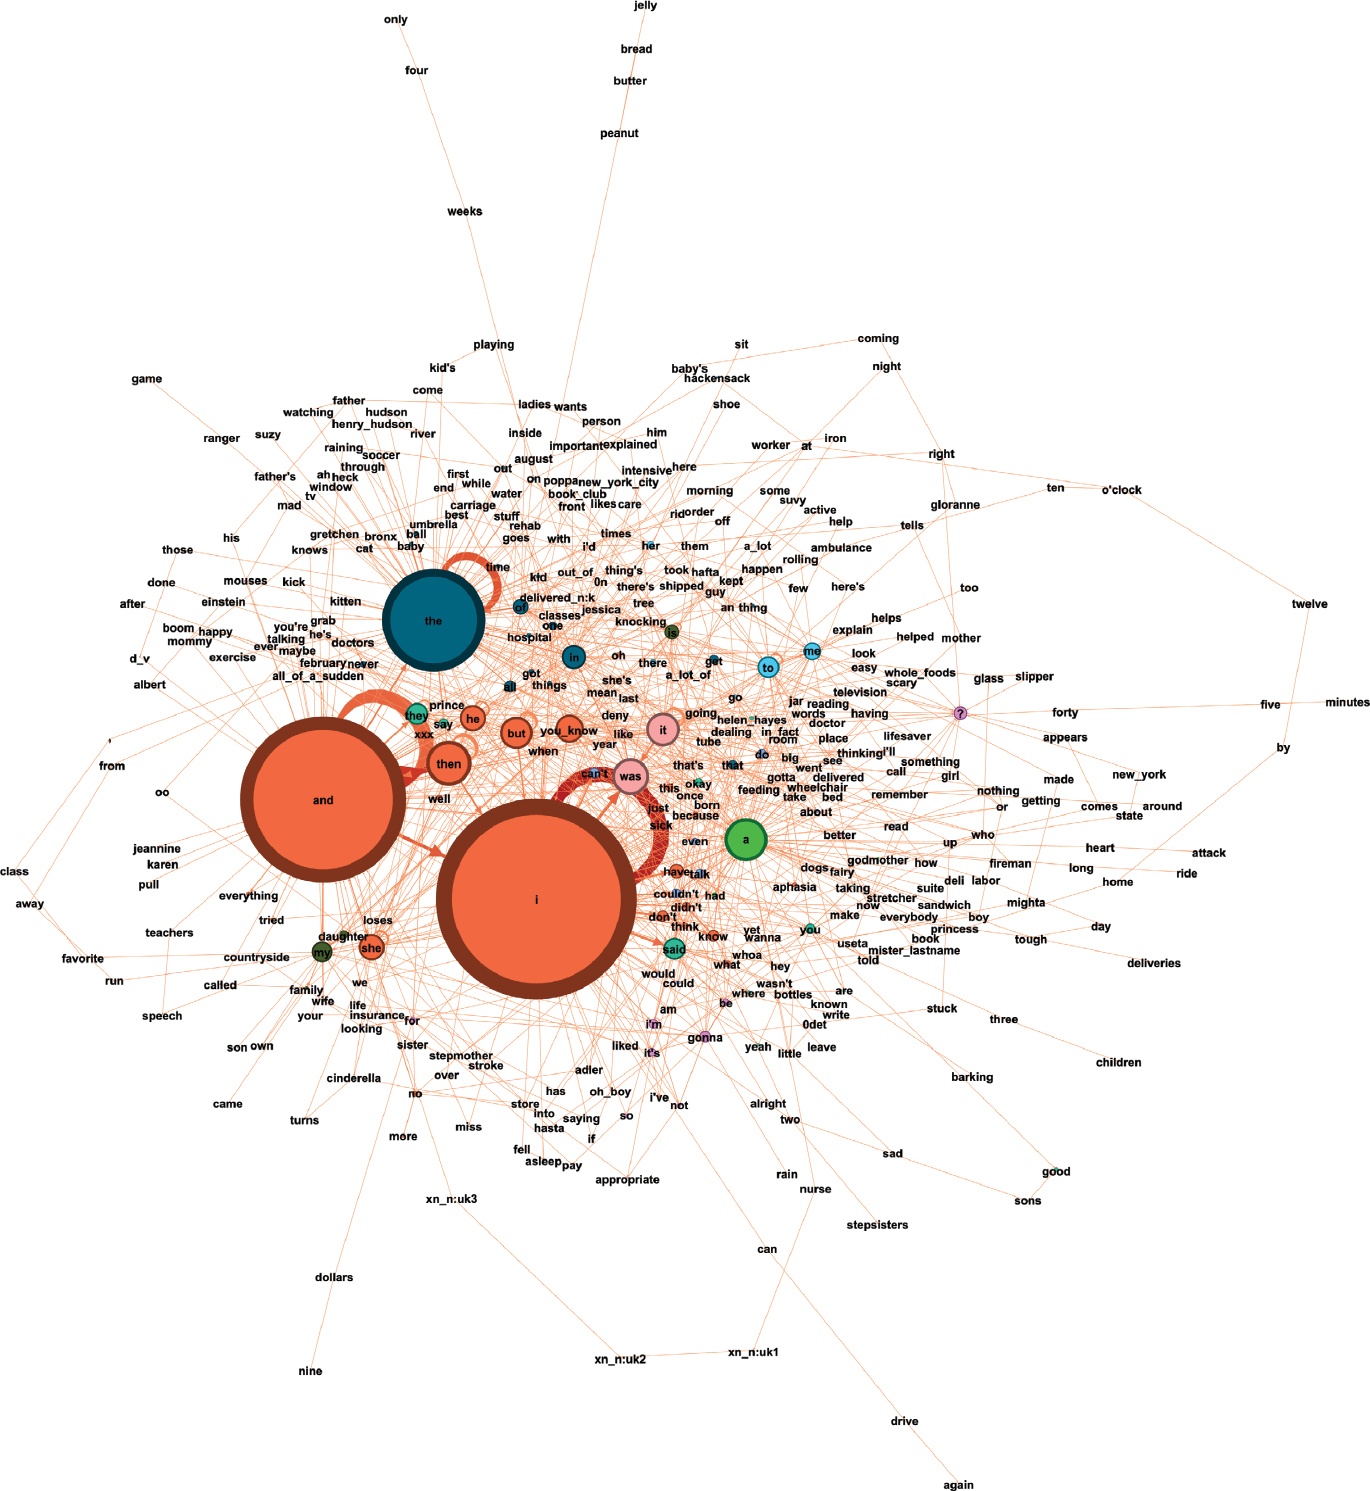
Adler01a’s network without non-verbal communication.
3.2.2 Adler08
The network of the other speaker with anomic aphasia, Adler08, including non-verbal communication (see Figure 10) is similar to that of Adler01a, the other speaker with anomic aphasia. Adler08’s network has 215 unique nodes (M=348; SD=191.65), with a total weight of 876 (M=1349; SD=758.76), and 528 unique edges (M=856.25; SD=566.37), with a total weight of 755 (M=1161.5; SD=705.73). Similarly to the previously described networks, the most frequent nodes are: I, and, the, it, that, okay, a, the non-verbal item &=points:picture, but, was. These are thus again mostly items that would traditionally be categorized as grammatical/function words (pronouns, determiners, conjunctions). It is notable, however, that the pointing gesture is so prevalent that it is amongst the most frequent nodes. The edges revolve mainly around the conjunctions, determiners, pronouns, and personal pronoun and verb pairings. Also visible is the repetition of I and the. In terms of the general structure, the center of the network is a cluster of high-frequency nodes connected with high-frequency edges. There are a few low-frequency nodes nestled between them. The communities of a and the together with a noun are towards the periphery of the network. There are some repeated multiword sequences, for example: that’s it (frequency of 6), that was pretty good (frequency of 4). Furthermore, the strong pronoun-verb pairings, which revolve around the I-node, are visible again, which resembles Adler01a’s I-node. Unlike in the networks of the control speakers and the other participant with anomic aphasia, there are some spoken nodes showing as not being connected to the network (see Figure 10); however, there are only two of these, and one is a general sound of, perhaps, agreement (mhm) and the other is in fact a multiword item (you_know) that the transcriber has noted as a single item. Therefore, as was the case with those other speakers’ networks, there is no indication of single words being produced in isolation.
Adler08’s network with non-verbal communication.
Adler08a’s uses a similar number of instances of non-verbal communication (55 tokens; compare Figures 10 and 11) to Adler01a, which is again substantially more than the control speakers, but less than the speakers with Wernicke’s and Broca’s aphasias.
Adler08’s network without non-verbal communication.
3.3 Speakers with Wernicke’s aphasia
3.3.1 ACWT10a
ACWT10a’s network including non-verbal communication (Figure 12), is the smallest of all the speakers, with only 181 unique nodes (M=348; SD=191.65) and a total weight of 568 (M=1349; SD=758.76). The network also has the fewest connections, with 318 unique edges (M=856.25; SD=566.37) and a total weight of edges at 432 (M=1161.5; SD=705.73).
ACWT10a’s network with non-verbal communication.
The most frequent nodes in ACWT10a’s network are: and, the, you_know, yeah, then, okay, the non-verbal item &=laughs, oh, all. Unlike in many of the previous speakers’ networks, there are some items showing as nodes that are not connected to any others in the network, and there are slightly more of these than in the case of the only other speaker described so far to have any such isolated nodes (Adler08a, with anomic aphasia). ACWT10a’s network has four such items, and while two (like Adler08a’s two) comprise a more general noise perhaps of agreement or disagreement (hmhm) and a multiword item transcribed as a single unit (golden_corral), the other two are single words (nope, bread; although nope could perhaps be expected to be a single word utterance). A fifth item (little bit), while showing some connection (being displayed as two single words connected to each other), is also not connected to the main network. The general structure of the network shows no ring of high-frequency grammatical items of the kind seen in the control speakers. Instead, many of these words are replaced by conversational fillers: oh, okay, yeah, you_know, &=laughs. The overall lack of multi-word patterns is quite apparent throughout the network; instead, the underlying transcript shows a large number of non-verbal tokens including pointing at different elements in the pictures presented while making an effort to name them (Figure 12 versus Figure 13). Overall, there is a considerable increase in non-verbal communication compared to the control speakers and the speakers with anomic aphasia (Table 2). The non-verbal tokens are found throughout the network. These are used by the speaker to replace missing lexis (the, &=points:firetruck), to name things (kitty, &=points:cat), or to double the lexis (bread, &=ges:bread). A substantial amount of non-verbal communication therefore takes on an elementary role by replacing verbal communication and thus being the sole means of communicating meaning, such as (I_mean, &=ges:carrying) or (kids, &=head:no).
ACWT10a’s network without non-verbal communication.
3.3.2 ACWT11a
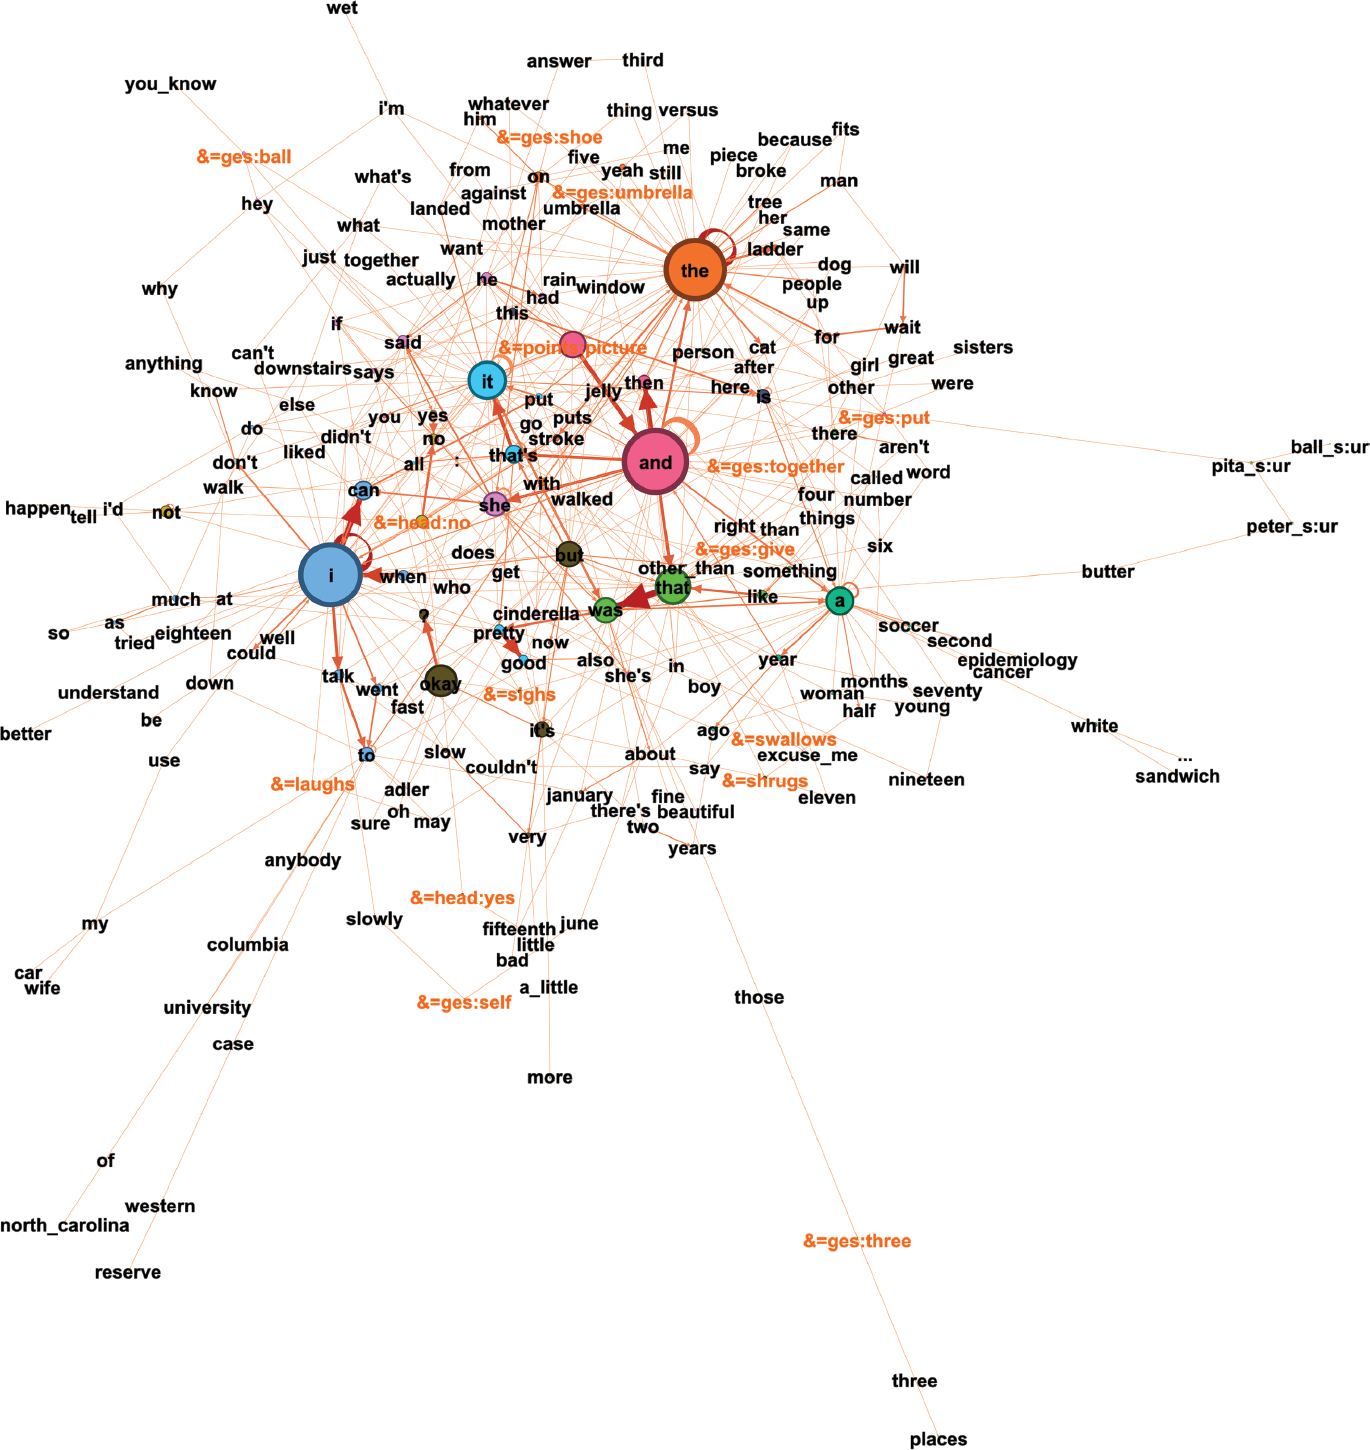
ACWT11a’s network (see Figure 14, including non-verbal communication) shows a very different language profile to that of the other speaker with Wernicke’s aphasia.
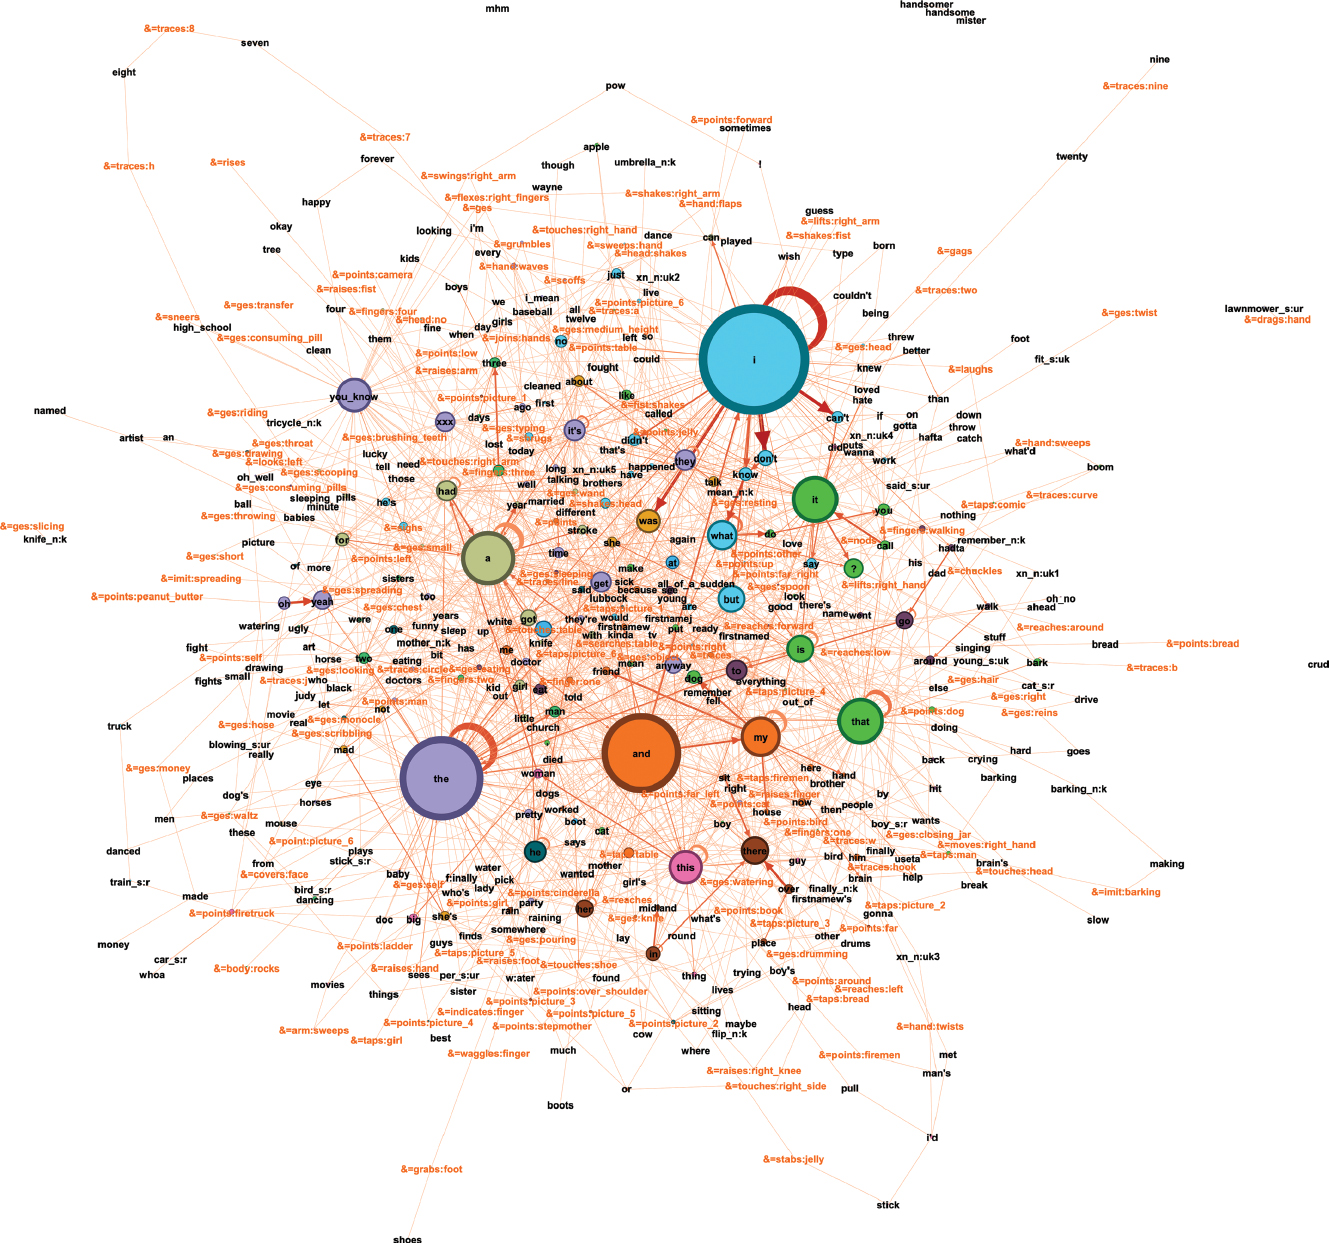
ACWT11a’s network with non-verbal communication.
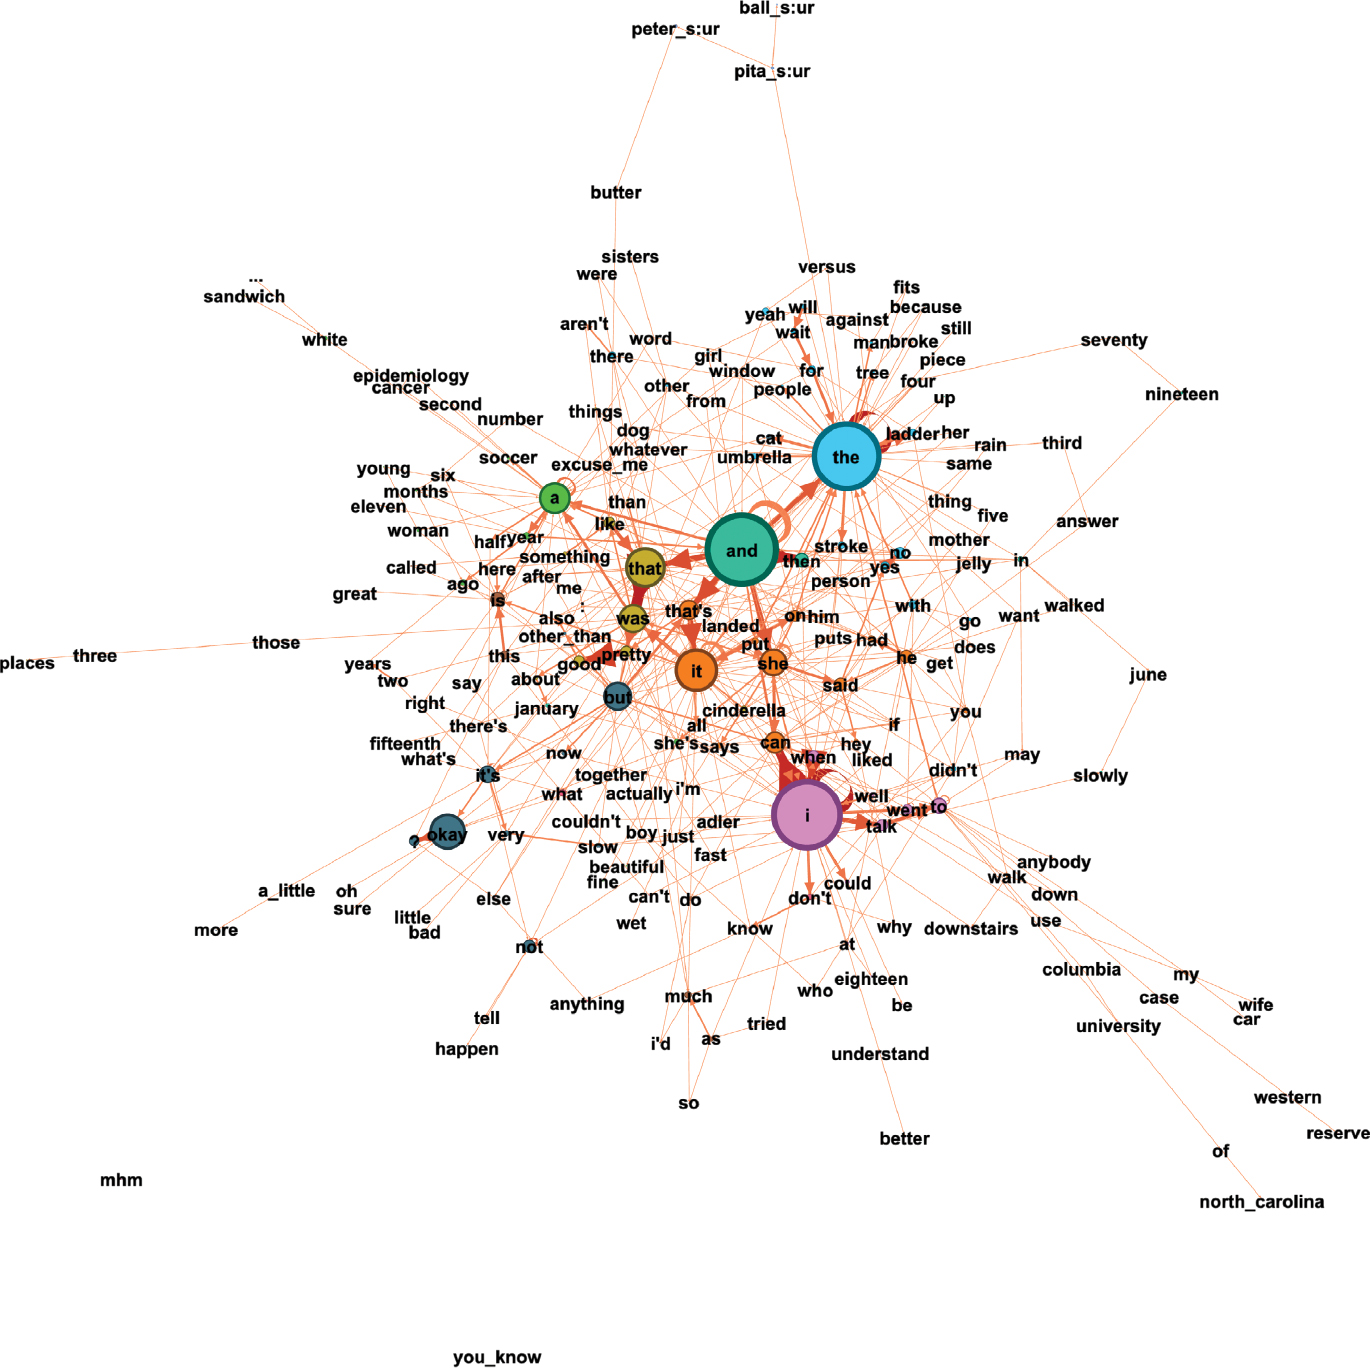
ACWT11a’s network is much larger, with 540 unique nodes (M=348; SD=191.65) and a total weight of 2291 (M=1349; SD=758.76). This network has the second highest number of connections, with 1579 unique edges (M=856.25; SD=566.37) and a total weight of 1958 (M=1161.5; SD=705.73). ACWT11a also has the highest edge type/weight ratio (0.80) and highest number of communities (19) of all speakers in the study. The most frequent nodes are I, the, and, a, it, that, my, you_know, this, what. As found for the control speakers and many of the speakers with aphasia described so far (but less so for ACWT10a), these are almost all items that would traditionally be classed as grammatical/function words (pronouns, determiners, conjunctions), although the multiword item you_know is also amongst these. The largest communities form around the nodes I, and, that, the. The edges also show a dominant role of the I node. In various combinations with verbs such as don’t, can’t, was, and know, I appears in five of the twenty most frequent bigrams. There are frequently co-occurring combinations in the network, such as I don’t know what, I didn’t know what. ACWT11a also uses the most non-verbal cues, which are found throughout the network (see again Table 2). In general, ACWT11a’s network features a larger number of high-frequency nodes and a higher number of communities than ACWT10a’s network, the other speaker with Wernicke’s aphasia (Figure 15). Similarly to that of ACWT10a, the spoken network also shows nodes that are not connected to the network, e.g., lawnmower. ACWT11a uses the most instances of non-verbal communication of any of the speakers (164 types, 356 tokens; compare Figures 14 and 15). These are gestures followed by words: (&=ges:drawing, artist), (&=ges:eating, eating), (&=ges:spoon, eat), (&=ges:waltz, dancing), (car_s:r, &=points:firetruck). In rare instances they are used exclusively with other non-verbal cues: (&=ges:scooping, &=ges:spreading). Mostly they are used to point (&=point:gestures) at the pictures and the individual elements depicted on them. Similarly to ACTW10a, he uses non-verbal cues to also replace missing lexis (&=point:picture, &=traces:circle, &=taps:fireman) and to double lexis for which he has production difficulties; for example, for the word knife, he used an iconic gesture (&=gesture:slicing). The network thus shows how ACTW11a attempts to compensate for the lack of lexis, which indicates that the concept is preserved; however, he has difficulties with producing the spoken form.
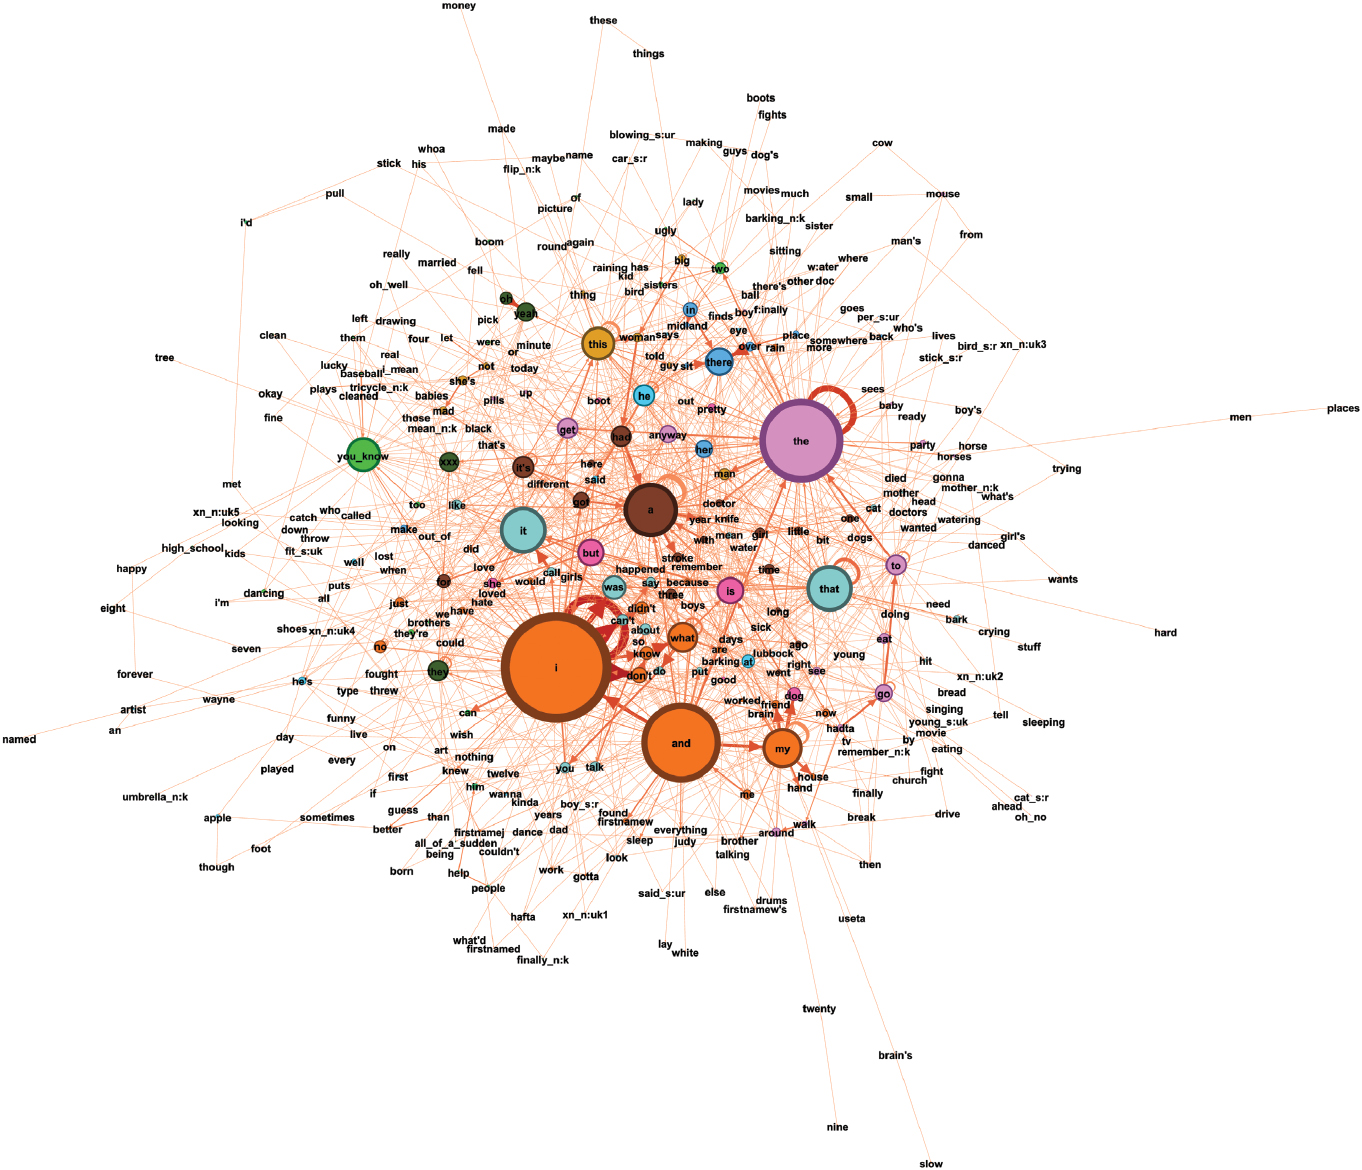
ACWT11a’s network without non-verbal communication.
3.4 Speakers with Broca’s aphasia
3.4.1 Adler16a
The network of the first speaker with Broca’s aphasia, Adler16a (Figure 16, including non-verbal communication, Figure 17 without non-verbal communication), is the second smallest in this study, with 202 individual nodes (M=348; SD=191.65) and a total weight of nodes of 745 (M=1349; SD=758.76). Regarding connections, this speaker has 489 unique edges (M=856.25; SD=566.37), with a total weight of edges of 647 (M=1161.5; SD=705.73). In terms of the general structure, this network appears very different from that of the other speaker with Broca’s aphasia (Adler13a) and even more so from the rest of the participants.
Adler16a’s network with non-verbal communication.
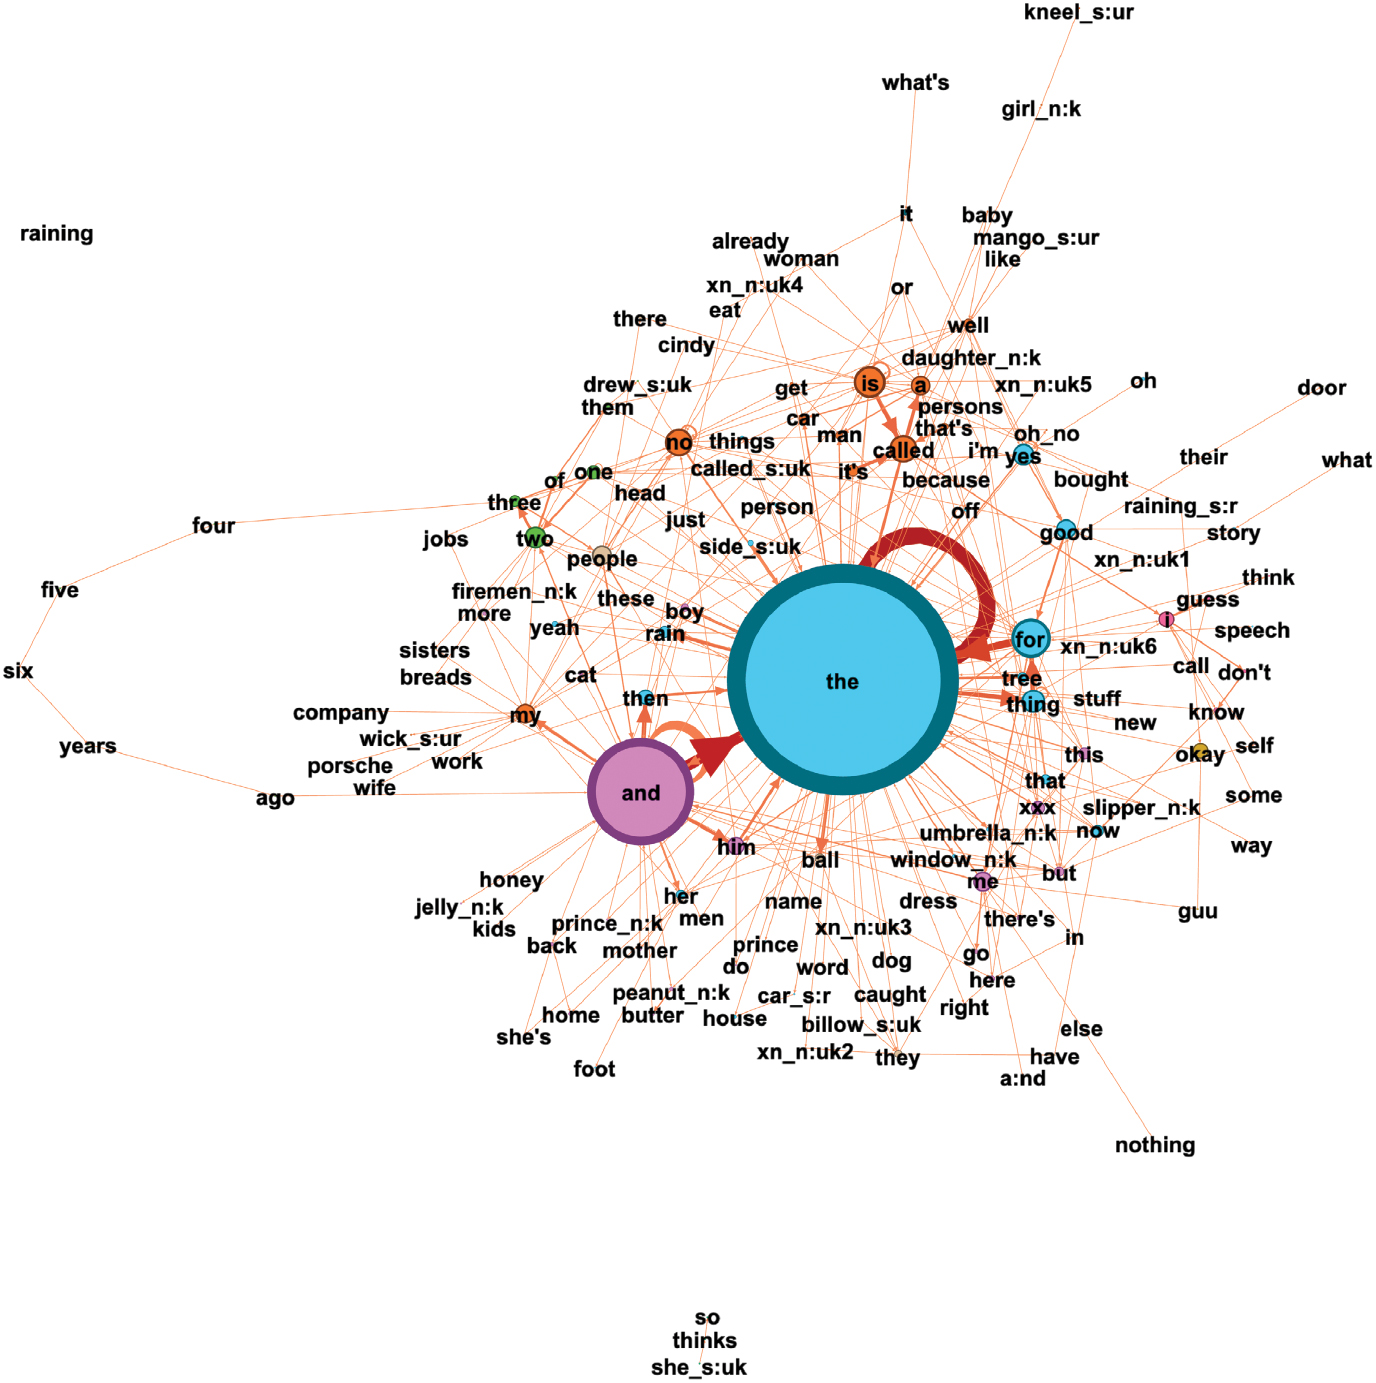
Adler16a’s network without non-verbal communication.
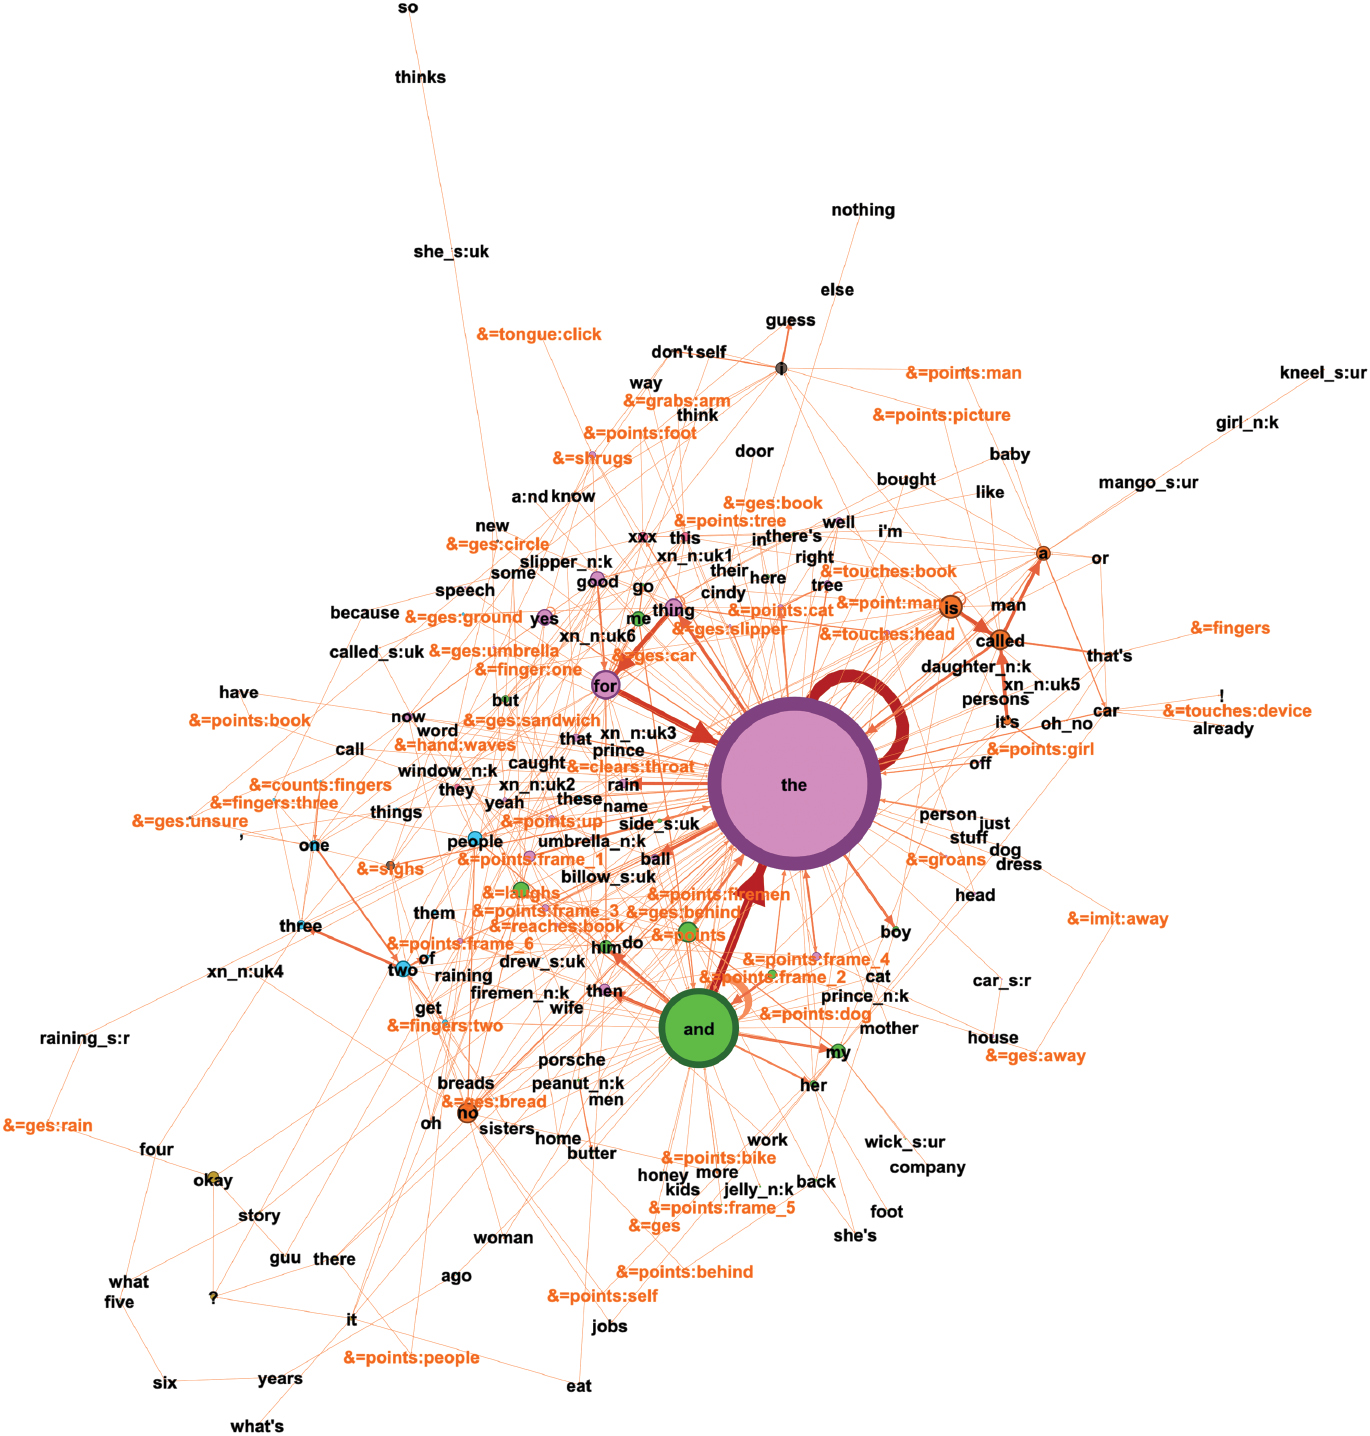
Instead of a ring of high frequency nodes, there are two larger nodes the and and, connected through a high frequency edge and small nodes: for, thing, good, and then a cloud of low frequency words surrounding the center (Figure 18 shows a part of the full network including non-verbal communication connected to the the-node).
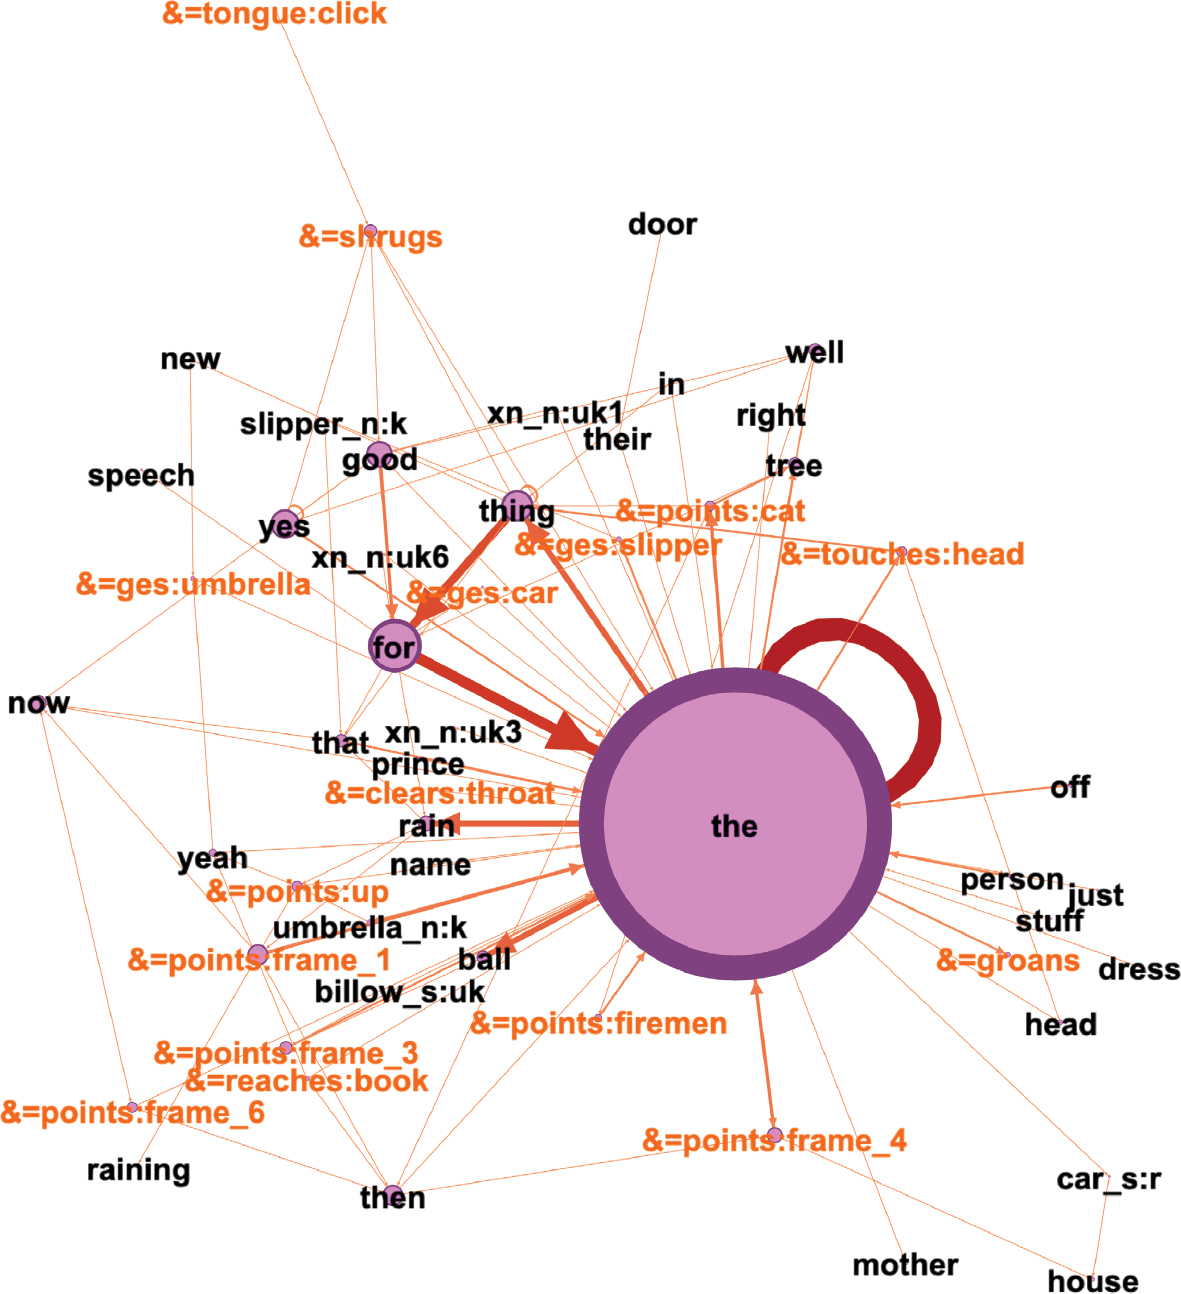
Adler 16a’s the community.
Concerning non-verbal communication (Figure 16 versus Figure 17), he uses 136 instances, which is more than the control speakers, the speakers with anomic aphasia and one speaker with Wernicke’s aphasia; however, it is only half as many instances as the other speaker with Broca’s aphasia (Adler13a). Although Adler16a has a variety of non-verbal cues, he uses them mostly in a referential manner while trying to name items, for example: (thing, &=ges:ground), (the, &=ges:slipper). This often occurs in combination with semantic error codes (indicated by s:r), which indicates word retrieval difficulties, as seen in (raining_s:r, &=ges:rain).
3.4.2 Adler13a
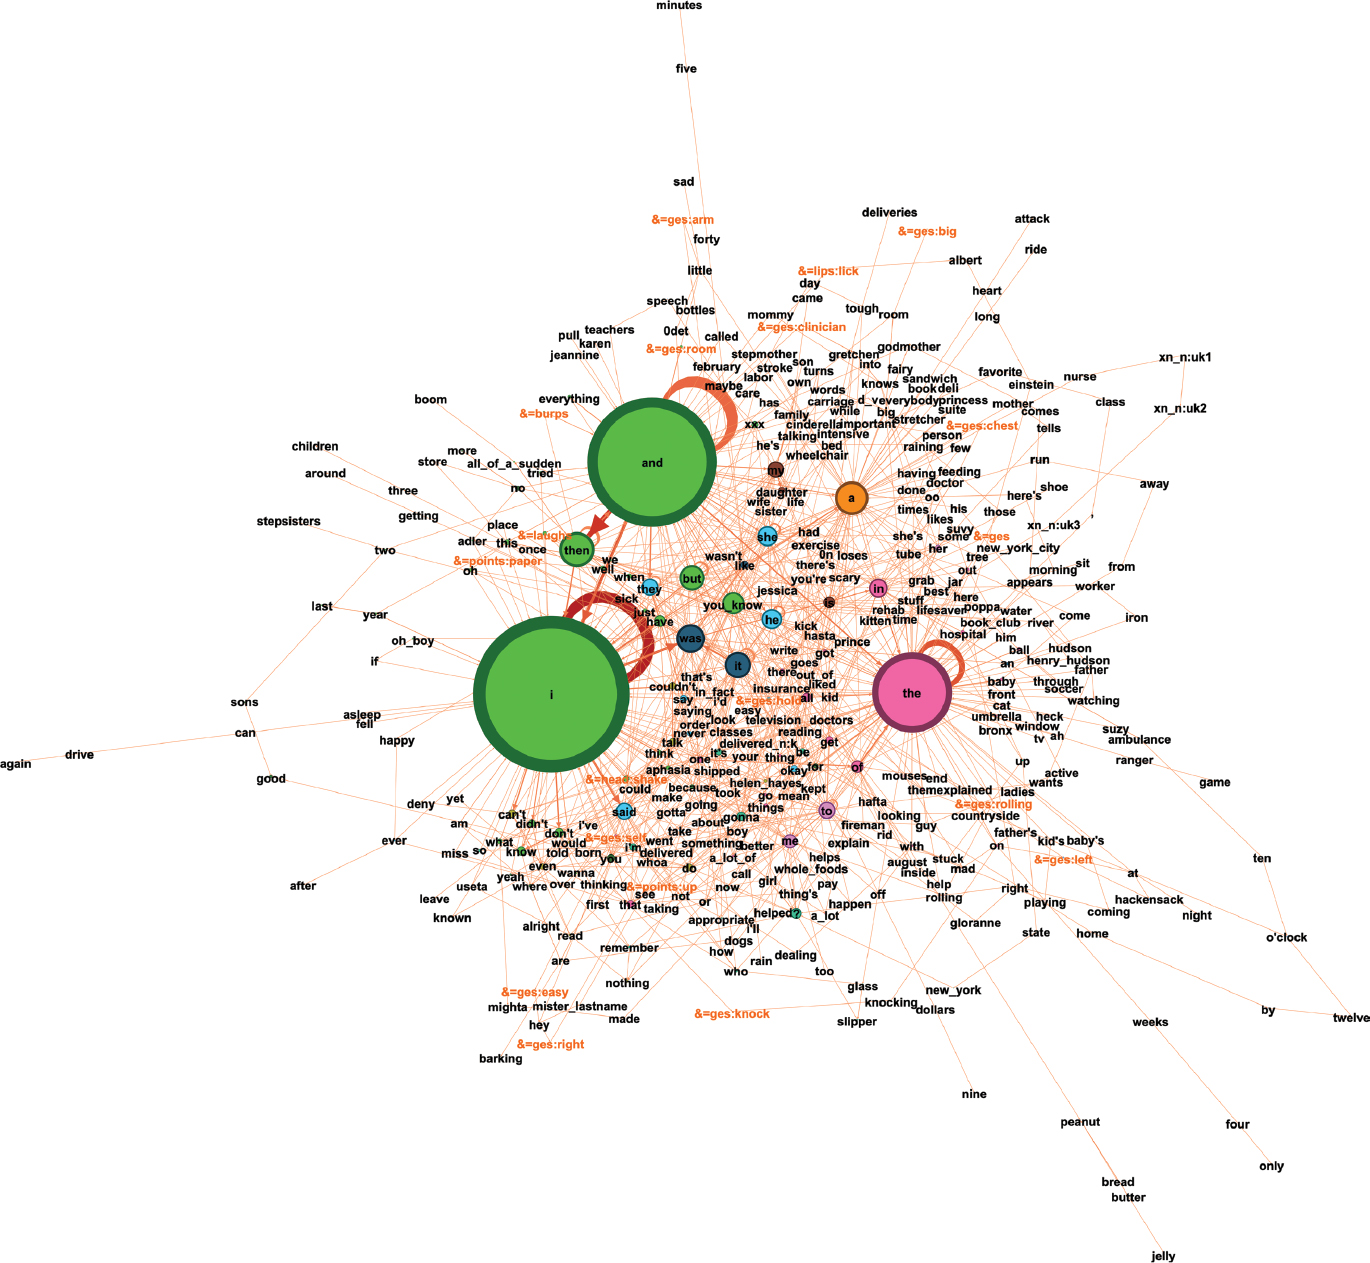
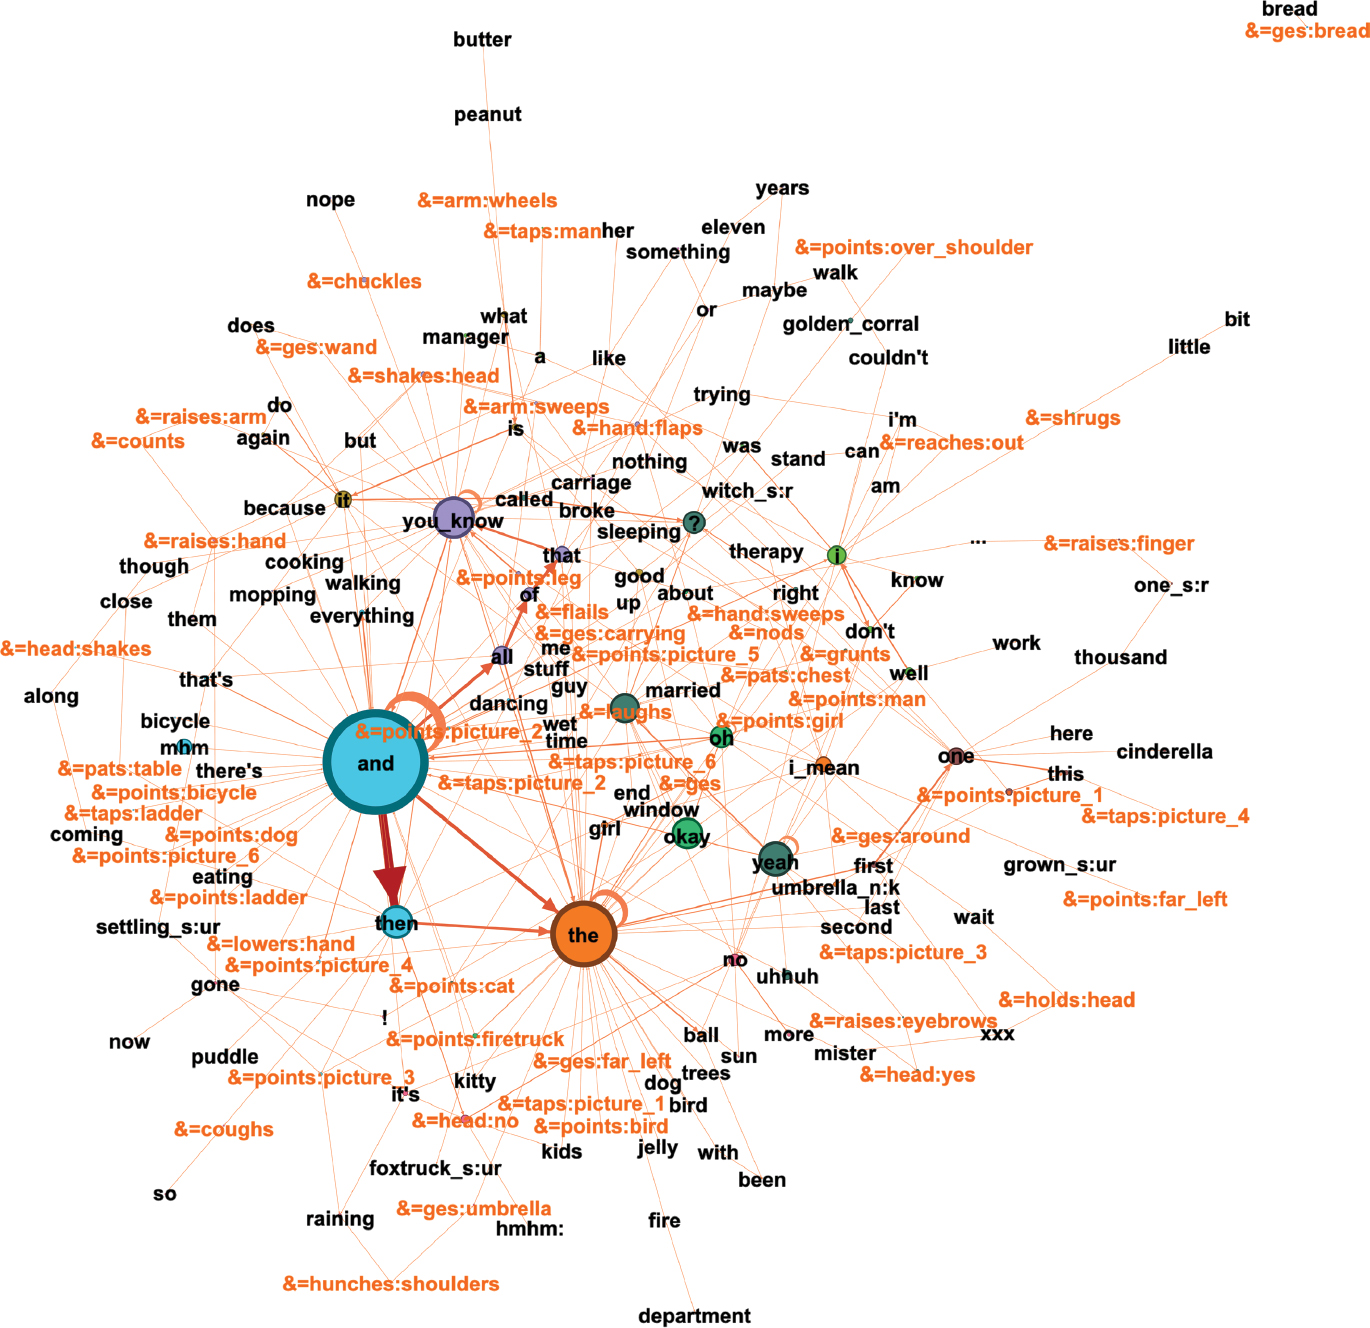
Adler13a’s network is smaller than those of the control speakers, one speaker with anomic aphasia and one with Wernicke’s aphasia. It is comparable in size to that of the other speaker with anomic aphasia and the other speaker with Broca’s aphasia, and slightly bigger than that of the other speaker with Wernicke’s aphasia (ACTW10a). It contains 221 individual nodes (M=348; SD=191.65), with a total weight of nodes of 1110 (M=1349; SD=758.76). In terms of connections, the network has 471 unique edges (M=856.25; SD=566.37), with a total weight of edges of 803 (M=1161.5; SD=705.73). The most common nodes are: I, know, yes, no, and, okay, don’t, oh, &=laughs (Figure 19, including non-verbal communication). These therefore comprise adverbs, a pronoun, a conjunction, a (negated) verb, interjections and an instance of non-verbal communication. This list thus differs somewhat from the most frequent nodes in many of the other participants, which mostly comprised grammatical/function words. What stands out is that most of these words work as singular expressions within the network and do not need to be within any collocations. The most frequent edges of the network are a combination of I, don’t, know and adverbs with a gesture such as (no, &=hand:no). As found in the networks of some of the other speakers with aphasia, there are some nodes that are not connected to the network, but in this case, there are more such instances than in those other speakers’ networks (13, excluding one consisting of the word ‘okay’ written as o:kay): ayayay, good, umbrella, bye, alright, speech, me, very, bread, castle, cathy, hey, nah. In addition, none are multiword items transcribed as a single unit, as found in some of the other speakers’ cases, and many are words that would not typically be expected as single-word utterances. The general structure of the network shows the same ring structure as with other participants in this study, but instead of words, there are gestures in between the different hubs. I and know are by far the biggest nodes, and based on the high frequency connections between these, I know occurs as a multiword unit, as well as I don’t know.
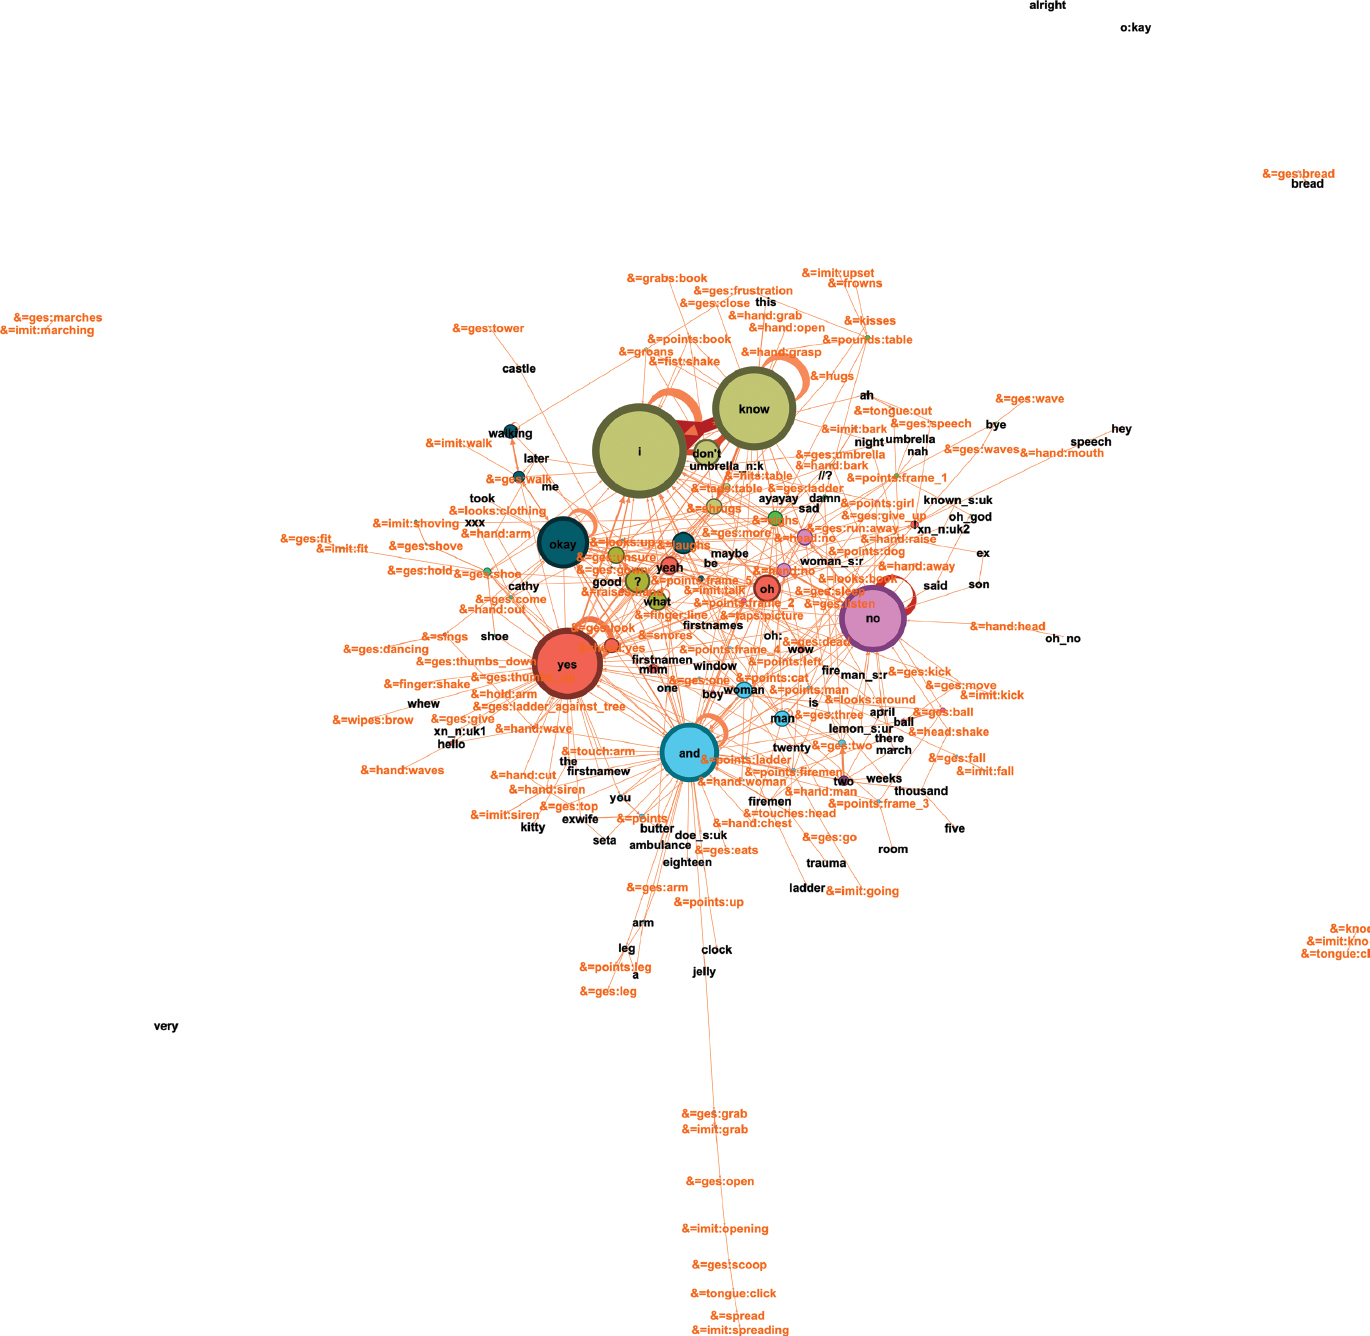
Adler13a’s network with non-verbal communication.
In contrast to his small spoken language network, Adler13a uses the most non-verbal communication of any participant in this study (360 instances; see again Table 2). The non-verbal instances appear to form an important component of his communication, as is noticeable when comparing the networks with and without non-verbal communication (Figures 19 and 20, respectively). The non-verbal cues are used for doubling lexis (shoe, &=ges:shoe), putting emphasis on verbal signs (&=head:shake, no), and mostly, support word finding strategies (&=points:firemen, firemen) and other referencing (&=points:frame_1, umbrella).
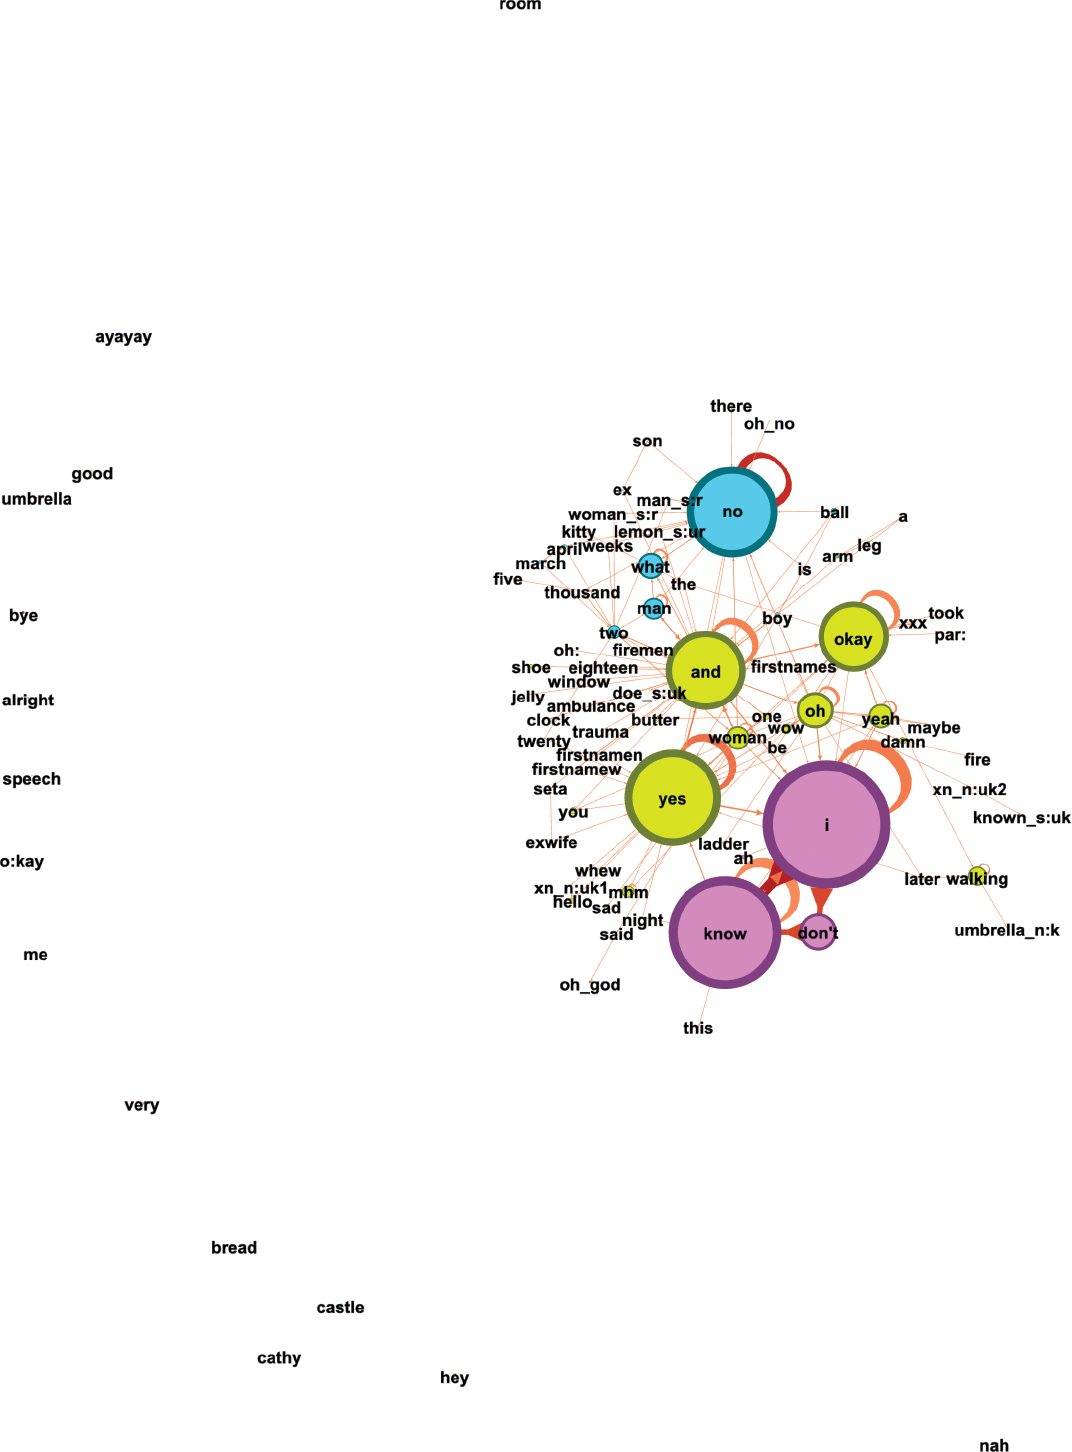
Adler13a’s network without non-verbal communication.
This indicates how severely impacted the spoken language of this speaker is and how much non-verbal communication may be being used as a form of compensation. Another example comes from the ‘peanut butter-jelly sandwich’ task, in which the participants have to describe how they would prepare a peanut butter and jelly sandwich, and Adler13a starts the description with the word jelly after which only non-verbal cues follow (gesture: grab, imitation: grab, gesture: open, gesture: scoop, tongue: click, &=spread, imitation: spreading) (Figure 21).
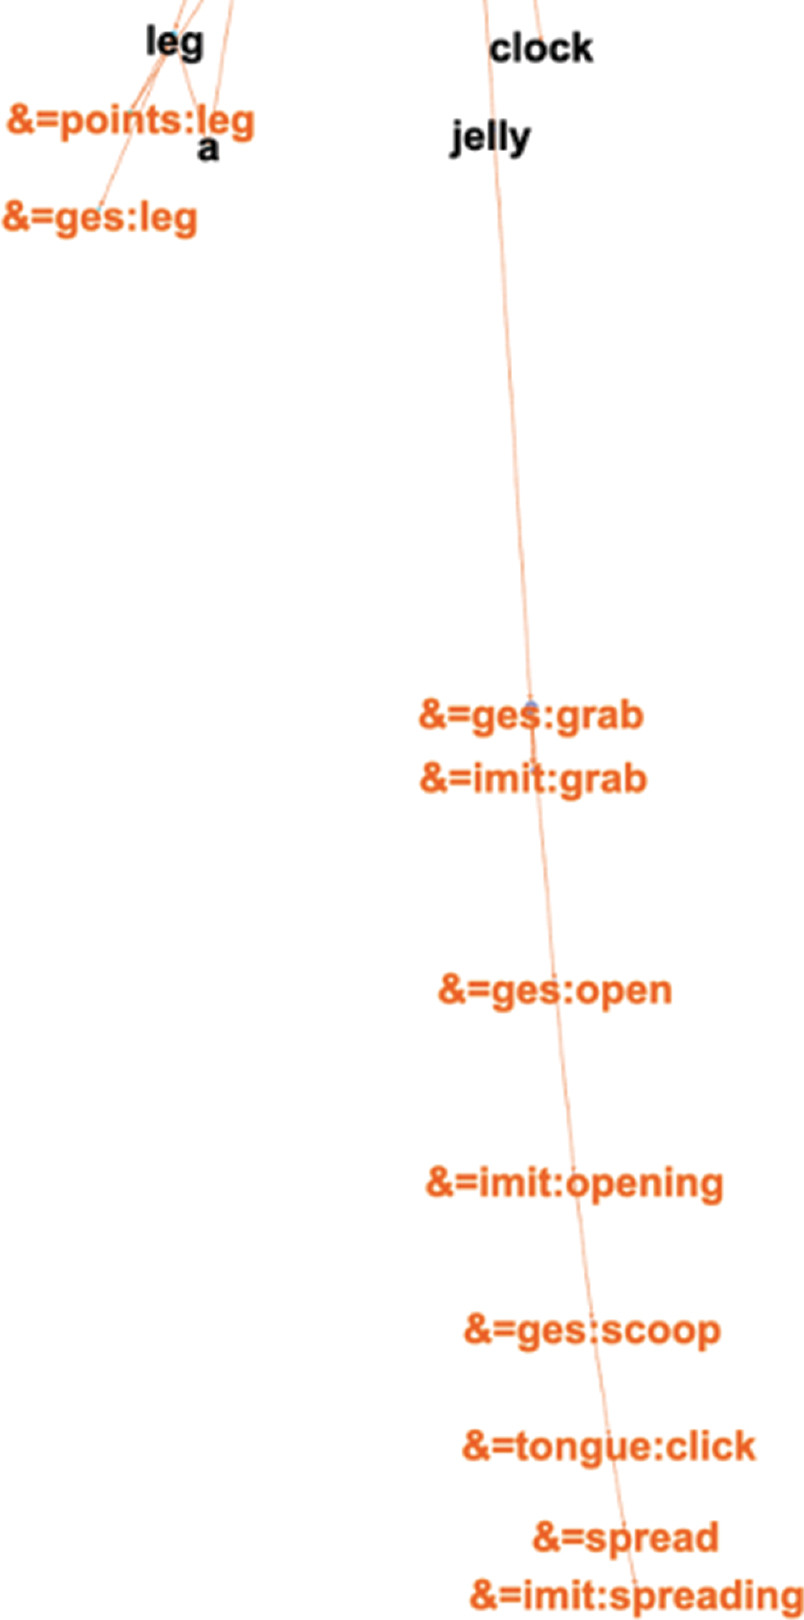
Adler13a’s response to the peanut butter jelly sandwich task.
All in all, the networks of the speakers with aphasia exhibit large individual differences in terms of fluency, word retrieval difficulties, and the use of non-verbal communication. There are no discreet profiles between the speakers with Broca’s, Wernicke’s or anomic aphasia. All of the speakers with aphasia use non-verbal cues (to differing degrees), seemingly to compensate for missing lexical items, thereby contrasting substantially with the control speakers, who only use non-verbal communication to emphasize a spoken item.
4 Discussion
This study extends Ibbotson et al.’s (2019) Dynamic Network Model approach to clinical data: spontaneous speech from speakers with three different aphasia types, as well as two control speakers without aphasia. In characterizing the networks for each speaker, it focuses on individual differences between and within the participant groups in terms of (1) language usage and (2) degree of non-verbal communication. Here we discuss the findings for these two areas, presented with their implications for psycholinguistics and aphasiology, before outlining the study’s limitations and avenues for future research.
4.1 Discussion of findings
Beginning with language usage, the networks help to build a visual representation of individual usage of words (nodes) and their interconnectedness within each speaker’s output. Here, while there were some similarities, the networks were also highly individualized, as would be predicted in a usage-based perspective, where the language available to a speaker is built up through individual linguistic experience (see again Dąbrowska 2012). To some degree, the networks indicated characteristics that might be predicted based on aphasia type/control status, in terms of both network size and nature.
Regarding size, there was some indication, from the number of nodes, of this decreasing from the control speakers to those with Wernicke’s aphasia, to those with anomic aphasia, and then to those with Broca’s aphasia. This finding can only be regarded tentatively, since not all speakers fitted this trend, and there were also noticeable differences in network size within each participant group; the trend would therefore need testing in further data from each aphasia subtype. However, it would be unsurprising if, overall, control speakers without aphasia produced more language than participants with aphasia, and if those with Wernicke’s and anomic aphasias produced more than the speakers with Broca’s aphasia. Wernicke’s and anomic aphasias are both fluent subtypes, associated with linguistic substitutions rather than omissions (Fromm et al. 2022), and there is generally comparatively less restriction on producing (fluent) speech. Indeed, spoken output in Wernicke’s aphasia, in particular, is sometimes described as “voluble” (e.g. Babiak et al. 2014, p. 837). Broca’s aphasia, in contrast, is traditionally characterized by sparseness of output (Turkstra 2011) and lexical omissions are much more common than substitutions (Dick et al. 2015).
In terms of the nature of the networks, and firstly of the nodes, it is notable that in the control speakers and three of those with fluent aphasias (two with anomic, one with Wernicke’s aphasia), the most frequent nodes were various items traditionally classed as grammatical/function words (e.g. articles, pronouns, etc.). Contrastingly, this was less the case in one speaker with Wernicke’s and the speakers with Broca’s aphasia, whose most frequent nodes included, for example, conversational fillers and interjections (e.g., oh, yeah). This too shows some alignment with traditional descriptions of fluent aphasias – in which grammatical/function words have often been noted as preserved – compared with non-fluent aphasias, in which they are commonly reported as lacking (e.g. Butterworth and Howard 1987).
Concerning the nature of the network structures overall, one control speaker’s network (Capilouto11a) was particularly extensive compared to that of all other participants, with many, and more evenly spread, nodes and these being densely interconnected. The networks for the speakers with anomic aphasia and one of those with Wernicke’s aphasia were also relatively interconnected, although some were dominated by a comparatively small number of large nodes, indicating reduced lexical richness (repeated use of some words). Differences were perhaps most noticeable in the speakers with Broca’s aphasia, however. In particular, Adler13a’s network was visibly sparse, and dominated by large nodes that were not so interconnected. In addition, while in the control speakers’ data and that of one speaker with anomic aphasia, all nodes were connected in at least some way to the rest of the network, this was not the case in the other speakers with aphasia, and this was again most striking in Adler13a’s network (with Broca’s aphasia). Specifically, in the networks of the other speakers with aphasia, any unconnected nodes at the periphery were relatively few (between 2–4 items) and included some that were in fact multi-word items transcribed as one unit (e.g. you_know; golden_corral). However, Adler13a’s data revealed 13 unconnected items and all were single words. Based on traditional descriptions of aphasia types, it is unsurprising that such differences in connectedness might be especially present in Broca’s aphasia. Speakers with the fluent aphasias – anomic and Wernicke’s – should be expected to be most similar to control participants in terms of node connectedness, due to their both being fluent subtypes, in which grammar has traditionally been described as preserved (or where grammar is impacted, it has usually been said to involve substituted grammatical elements, rather than omission of these; Fromm et al. 2022). While connected speech in anomic aphasia may be disrupted by the word-finding difficulties that are said to be the hallmark of this aphasia type, as mentioned, speakers with this subtype generally have fluent speech; they can often find other ways to express the meaning of the single word they are struggling to retrieve, for example through synonyms or ‘circumlocution’ (describing the concept instead of naming it). As explained above, (non-fluent) Broca’s aphasia would be expected to involve the most restricted connected speech capabilities of the subtypes investigated here, being traditionally characterized by halting speech, comprising short – often single-word – utterances, with limited grammatical capabilities (see, e.g. Hatchard 2021, p. 9). This would match the sparse network of Adler13a, with its reduced interconnections between nodes. Overall, the smaller number of nodes and reduced connectivity in this speaker would also fit with Hatchard’s (2021) usage-based predictions that with greater restriction of spoken language capability, speakers should have access to fewer constructions overall, and these should be more limited to lexically-specific constructions, with schematicity/productivity being comparatively stripped away.
Despite the above suggested trends, however, the data also reveals quite different networks between speakers diagnosed with the same aphasia type (for example, those of the two speakers with Wernicke’s aphasia, one of whose networks is much more densely connected overall), and also between the two control speakers. This could be influenced by the amount of data per speaker, which differed across the participants (despite them completing the same tasks). As explained, individual differences would be expected within a usage-based perspective, and the data thus adds support for that approach. However, such differences may also point towards the notorious difficulties associated with aphasia classification, and questions about the validity of such subtypes. As explained (see section 1), this issue has been raised many times in the aphasia literature, due (among other reasons) to the wide variation in aphasia presentations between individuals diagnosed with the same classification (e.g. Marshall 2010). Applying the dynamic network model approach to more data may help to investigate this issue further.
Turning to the degree of non-verbal communication, differences were also noticeable across the participant groups here. Overall, there were more non-verbal instances in the networks of the people with aphasia individually than those of each control speaker. This mirrors previous studies that have reported greater use of gesture in people with aphasia compared with control speakers without the disorder (e.g. Sekine and Rose 2013; de Beer et al. 2019), and points to non-verbal communication potentially being used to compensate for restricted spoken language. Greater use of non-verbal communication was especially seen in the speakers with Broca’s aphasia and Wernicke’s aphasia. Broca’s aphasia has previously been highlighted as a subtype in which speakers might use particularly high levels of gesture (Ozturk and Özçalışkan 2024). It would be useful to investigate non-verbal communication further in these two subtypes and others, also examining the qualitative nature of this, including its potential use as a compensatory strategy.
4.2 Limitations and methodological considerations
Several limitations or methodological considerations should be discussed with this study. Firstly, as acknowledged, this research is exploratory in nature and, as such, examined a relatively small sample of participants. It would be useful to expand this work with further data, in particular from a larger control group and from more participants diagnosed with each aphasia type. As well as examining individual network characteristics, in terms of quantitative analysis, if large numbers of participants were involved, it could be useful to explore any potential means of more automated comparison of the data across the participants, for example, based on the metrics reported in Table 2. Other aphasia types not represented in the study (conduction, transcortical sensory, transcortical motor, mixed transcortical and global aphasias) should also be examined. Moreover, while aphasia is not known to be influenced by gender, the participants in this study were all male, and future research could include data from a more diverse participant group, to better represent people with aphasia in general.
Secondly, although the tasks were almost identical across the control participants and speakers with aphasia, there was a small difference in that the data from seven speakers included language produced in an introduction stage to the Cinderella narrative, whereas this introduction was not present in the data available for the other (control) speaker. Due to the potential for tasks to influence the language used (Deng et al. 2024), it would be useful for future research to keep these consistent. In general, with spontaneous speech, or in some tasks at least (e.g. describing an important life event), it is not possible to control the topics that are discussed by the speaker and the language used to relay these. It should be acknowledged that this could impact the size and nature of a speaker’s network.
In the current study, the number of words and duration of recording also varied across the participants. There is an argument for keeping the amount of data consistent across participants, for example by taking an extract of a set number of words from each participant. However, since people with aphasia (and typical speakers) vary widely in their amount of language output, this may mean that only part of a task is included, and this itself is likely to influence the language included in the analysis, and thus the results.
In addition, the analysis will be influenced by the transcription, including which items transcribers have classed as one lexical item; sometimes, multiword items (e.g. “you_know”) had been transcribed as single items, thus forming single nodes. It is not clear how this judgement regarding what should count as ‘formulaic’ language is made in these particular transcriptions, but this can often be subjective, leading to inconsistencies (c.f. Hatchard 2021, p. 21). In future work, this may be resolved by adapting the transcripts so that all single words are written separately.
Lastly, it is possible that the language used by the interviewer could influence that used by participants (e.g. through priming effects). This was not taken into account in the current study, but could be considered in future research, for example by excluding any items produced by participants that had also been produced by the interviewer in (for instance) the preceding turn.
To conclude, this study shows that DNMs can be usefully extended to clinical data and provide valuable insights into individual language use in speakers with aphasia. Differences were indicated in both the size and nature of the networks between the participant groups. Several of the speakers with aphasia showed smaller networks, with reduced connectivity, and this was especially noticeable in one of the individuals with Broca’s aphasia. However, the size and nature of the networks also differed substantially between speakers of the same aphasia subtype, highlighting individual differences, as emphasized in a usage-based approach, and adding to questions about the validity of existing aphasia classifications. The speakers further differed substantially in their degree of usage of non-verbal communication: all those with aphasia each used more than either of the speakers without aphasia, and higher degrees of non-verbal communication were particularly seen in the speakers with Broca’s and Wernicke’s aphasias. This adds to literature that reports higher use of gesture in aphasia, potentially as a compensatory mechanism for restricted language capabilities. Overall, this exploratory study provides initial insight into the potential use of DNMs in presenting a holistic view of spoken language capabilities in speakers with aphasia.
References
Ambridge, B., & Lieven, E. V. M. 2011. Child language acquisition: Contrasting theoretical approaches (1st ed.). Cambridge: Cambridge University Press. doi: https://doi.org/10.1017/CBO9780511975073Search in Google Scholar
Babiak, M. C., Gorno-Tempini, M. L., & Henry, M. L. 2014. Language disorders, overview. In M. J. Aminoff & R. B. Daroff (Eds.), Encyclopedia of neurological sciences (2nd ed., pp. 837–839). Academic Press. doi: https://doi.org/10.1016/B978-0-12-385157-4.00471-1Search in Google Scholar
Bastian, M., Heymann, S., & Jacomy, M. 2009. Gephi: An open source software for exploring and manipulating networks. Retrieved from http://www.aaai.org/ocs/index.php/ICWSM/09/paper/view/15410.1609/icwsm.v3i1.13937Search in Google Scholar
Bates, E., & Goodman, J. C. 1997. On the inseparability of grammar and the lexicon: Evidence from acquisition, aphasia, and real-time processing. Language and Cognitive Processes, 12 (5–6), 507–584. doi: https://doi.org/10.1080/016909697386628Search in Google Scholar
Blondel, V. D., Guillaume, J.-L., Lambiotte, R., & Lefebvre, E. 2008. Fast unfolding of communities in large networks. Journal of Statistical Mechanics: Theory and Experiment, 2008 (10), P10008. doi: https://doi.org/10.1088/1742-5468/2008/10/P10008Search in Google Scholar
Butterworth, B., & Howard, D. 1987. Paragrammatisms. Cognition, 26 (1), 1–37. doi: https://doi.org/10.1016/0010-0277(87)90012-6Search in Google Scholar
Binek, K., & Shelley, K. 2012. AphasiaBank ACWT Corpus. Talkbank. https://doi.org/10.21415/X4RC-R061Search in Google Scholar
Cancho, F. R., & Solé, R. V. 2001. The small world of human language. Proceedings. Biological Sciences, 268 (1482), 2261–2265. doi: https://doi.org/10.1098/rspb.2001.1800Search in Google Scholar
Capilouto, G. 2008. AphasiaBank English controls Capilouto corpus. TalkBank. Retrieved from https://aphasia.talkbank.org/Search in Google Scholar
Chomsky, N. 1957. Syntactic structures. Mouton.10.1515/9783112316009Search in Google Scholar
Code, C. 2021. Aphasia. In J. S. Damico, N. Müller, & M. J. Ball (Eds.), The handbook of language and speech disorders (1st ed., pp. 286–309). Wiley. doi: https://doi.org/10.1002/9781119606987.ch14Search in Google Scholar
Croft, W. 2001. Radical construction grammar: Syntactic theory in typological perspective. Oxford: Oxford University Press. doi: https://doi.org/10.1093/acprof:oso/9780198299554.001.0001Search in Google Scholar
Croft, W., & Cruse, D. A. 2004. Cognitive linguistics. Cambridge: Cambridge University Press. doi: https://doi.org/10.1017/CBO9780511803864Search in Google Scholar
Dąbrowska, E. 2012. Different speakers, different grammars: Individual differences in native language attainment. Linguistic Approaches to Bilingualism, 2, 219–253. doi: https://doi.org/10.1075/lab.2.3.01dabSearch in Google Scholar
de Beer, C., de Ruiter, J. P., Hielscher-Fastabend, M., & Hogrefe, K. 2019. The production of gesture and speech by people with aphasia: Influence of communicative constraints. Journal of Speech, Language, and Hearing Research, 62 (12), 4417–4432. doi: https://doi.org/10.1044/2019_JSLHR-L-19-0020.Search in Google Scholar
Deng, B. M., Gao, J., Liang, L. S., Zhao, J. X., Lin, F., Yin, M. Y., Zheng, H. Q., & Hu, X. Q. 2024. Discourse task type-specific linguistic characteristics in anomic aphasia and healthy controls: Evidence from Mandarin-Chinese AphasiaBank. American Journal of Speech-Language Pathology, 33 (2), 937–951. doi: https://doi.org/10.1044/2023_AJSLP-23-00078Search in Google Scholar
Dick, F., Bates, E., Wulfeck, B., Utman, J. A., Dronkers, N., & Gernsbacher, M. A. 2015. Language deficits, localization, and grammar: Evidence for a distributive model of language breakdown in aphasic patients and neurologically intact individuals. Psychological Review, 108 (4), 759–788. doi: https://doi.org/10.1037/0033-295x.108.4.759Search in Google Scholar
Fromm, D., Greenhouse, J., Pudil, M., Shi, Y., & MacWhinney, B. 2022. Enhancing the classification of aphasia: A statistical analysis using connected speech. Aphasiology, 36 (12), 1492–1519. doi: https://doi.org/10.1080/02687038.2021.1975636Search in Google Scholar
Gahl, S., & Menn, L. 2016. Usage-based approaches to aphasia. Aphasiology, 30 (11), 1361–1377. doi: https://doi.org/10.1080/02687038.2016.1140120Search in Google Scholar
Goldberg, A. E. 1995. Constructions: A construction grammar approach to argument structure. Chicago, IL: University of Chicago Press.Search in Google Scholar
Hatchard, R. 2021. Cognitive aphasiology: A usage-based approach to language in aphasia. Amsterdam and London: John Benjamins.10.1075/cal.31Search in Google Scholar
Hatchard, R., & Lieven, E. 2019. Inflection of nouns for grammatical number in spoken narratives by people with aphasia: how glass slippers challenge the rule-based approach. Language and Cognition, 11 (3), 341–372. doi: https://doi.org/10.1017/langcog.2019.21Search in Google Scholar
Hatchard, R., Láznička, M., Boye, K., & Martínez Ferreiro, S. (submitted). Aphasia and Linguistics. To appear in Hatchard, R., Ryan, B., & Wallace, S. (in prep.) Routledge International Handbook of Aphasia. Routledge.Search in Google Scholar
Ibbotson, P., Salnikov, V., & Walker, R. 2019. A dynamic network analysis of emergent grammar. First Language, 39(6), 652–680. doi: https://doi.org/10.1177/0142723719869562Search in Google Scholar
Kaplan, E. H., Goodglass, H., & Weintraub, S. 1983. Boston naming test. Philadelphia, PA: Lea & Febiger.Search in Google Scholar
Kent, R. D. 2010. Communication disorders. In I. B. Weiner & W. E. Craighead (Eds.), The Corsini encyclopedia of psychology: Volume 1 (4th ed., pp. 358–360). NJ: John Wiley & Sons. doi: https://doi.org/10.1002/9780470479216.corpsy0203Search in Google Scholar
Kidd, E., Donnelly, S., & Christiansen, M. H. 2018. Individual differences in language acquisition and processing. Trends in Cognitive Sciences, 22 (2), 154–169. doi: https://doi.org/10.1016/j.tics.2017.11.006Search in Google Scholar
MacWhinney, B. 2000. The CHILDES project: Tools for analyzing talk: Transcription format and programs (3rd ed.). Mahwah, NJ: Lawrence Erlbaum Associates Publishers.Search in Google Scholar
MacWhinney, B., Fromm, D., Forbes, M. & Holland, A. 2011. AphasiaBank: Methods for studying discourse. Aphasiology, 25, 1286–1307. https://doi.org/10.1080/02687038.2011.589893Search in Google Scholar
Marshall, J. 2010. Classification of aphasia: Are there benefits for practice? Aphasiology, 24 (3), 408–412. doi: https://doi.org/10.1080/02687030802553688Search in Google Scholar
Martínez-Ferreiro, S., Bastiaanse, R., & Boye, K. 2020. Functional and usage-based approaches to aphasia: The grammatical-lexical distinction and the role of frequency. Aphasiology, 34 (8), 927–942. doi: https://doi.org/10.1080/02687038.2019.1615335Search in Google Scholar
Murdoch, B. E. 2010. Acquired speech and language disorders: A neuroanatomical and functional neurological approach (2nd ed.). Chichester, West Sussex, Hoboken: Wiley-Blackwell.Search in Google Scholar
National Aphasia Association. (n.d.). What is aphasia? Types of aphasia. Retrieved from https://aphasia.org/what-is-aphasia/Search in Google Scholar
Ozturk, S., & Özçalışkan, S. 2024. Gesture’s role in the communication of adults with different types of aphasia. American Journal of Speech-Language Pathology, 33 (4), 1811–1830. doi: https://doi.org/10.1044/2024_AJSLP-23-00046Search in Google Scholar
Papageorgiou, G., Kasselimis, D., Angelopoulou, G., Laskaris, N., Tsolakopoulos, D., Velonakis, G., Tountopoulou, A., Vassilopoulou, S., & Potagas, C. 2024. Investigating aphasia recovery: Demographic and clinical factors. Brain Sciences, 14 (1), 7. doi: https://doi.org/10.3390/brainsci14010007Search in Google Scholar
Perek, F. 2016. Using distributional semantics to study syntactic productivity in diachrony: A case study. Linguistics, 54 (1), 149–188. doi: https://doi.org/10.1515/ling-2015-0043Search in Google Scholar
Rotherham, A., Shrubsole, K., Croteau, C., Hilari, K., Wallace, H., & Wallace, S. J. 2024. Measuring successful conversations in couples with and without aphasia: A scoping review. International Journal of Language & Communication Disorders, 59 (6), 2554–2579. doi: https://doi.org/10.1111/1460-6984.13098Search in Google Scholar
Royal College of Speech and Language Therapists. 2014. RCSLT resource manual for commissioning and planning services for SLCN: Aphasia. Retrieved from https://rcslt.org/wp-content/uploads/media/Project/RCSLT/aphasia-resource-updated-feb-2014.pdfSearch in Google Scholar
Sekine K., & Rose, M. L. 2013. The relationship of aphasia type and gesture production in people with aphasia. American Journal of Speech-Language Pathology, 22 (4), 662–672. doi: https://doi.org/10.1044/1058-0360(2013/12-0030)Search in Google Scholar
Street, J., & Dąbrowska, E. 2014. Lexically specific knowledge and individual differences in adult native speakers’ processing of the English passive. Applied Psycholinguistics, 35 (1), 97–118. doi: https://doi.org/10.1017/S0142716412000367Search in Google Scholar
Szabo, G. 2008. AphasiaBank Adler corpus. TalkBank. https://doi.org/10.21415/PM0P-5E52Search in Google Scholar
Turkstra, L. 2011. Broca’s aphasia. In J. S. Kreutzer, J. DeLuca, & B. Caplan, (Eds.), Encyclopedia of clinical neuropsychology (pp. 457–459). New York, NY: Springer. doi: https://doi.org/10.1007/978-0-387-79948-3_870Search in Google Scholar
Worrall, L., Ryan, B., Hudson, K., Kneebone, I., Simmons-Mackie, N., Khan, A., Hoffmann, T., Power, E., Togher, L., & Rose, M. 2016. Reducing the psychosocial impact of aphasia on mood and quality of life in people with aphasia and the impact of caregiving in family members through the Aphasia Action Success Knowledge (Aphasia ASK) program: Study protocol for a randomized controlled trial. Trials, 17, 153. doi: https://doi.org/10.1186/s13063-016-1257-9Search in Google Scholar
©2025 Antje Endesfelder Quick, Marvin Zurek and Rachel Hatchard, published by De Gruyter, Berlin/Boston
This work is licensed under the Creative Commons Attribution-NonCommercial-NoDerivatives 4.0 International License.
Articles in the same Issue
- Frontmatter
- The role of phonemic and subphonemic cues in morphological learning
- Individual differences in the constructicon: German noun phrase agreement
- A dynamic network approach to language in aphasia: Individual differences in spoken and non-verbal communication
- The development of flexibility and abstraction in the acquisition of the German ditransitive construction
- The effect of cognitive load on linguistic fluency, lexical production, and emotional polarity: An exploratory study on self-directed French
- How literacy acquisition changes L1 grammatical knowledge
- From linguistic creativity to conformity: the case of [zur Nung kommen/bringen]1
- Light verb constructions and the Principle of No Synonymy – A case study on German stehen unter-LVCs
- Names, semantics, and cognition in native varieties of the potato tubercle in the peasant community of Pampacorral (Lares, Cuzco): Towards a cognitive approach to the naming process