Development and assessment of autoverification system for routine coagulation assays in inpatient and outpatient settings of tertiary care hospital: algorithm performance and impact on laboratory efficiency
-
Orakan Limpornpugdee
 ,
Surapat Tanticharoenkarn
,
Tapakorn Thepnarin
,
Surapat Tanticharoenkarn
,
Tapakorn Thepnarin


Abstract
Objectives
This study aimed to develop and implement autoverification (AV) system for routine coagulation assays, specifically prothrombin time (PT) and activated partial thromboplastin time (APTT), in tertiary care hospital. The efficiency, accuracy, and impact on turnaround time (TAT) were evaluated.
Methods
AV rules were developed using historical data from 70,865 coagulation test results. The rules included pre-analytical, analytical, and post-analytical checks. The system underwent validation through data simulations, pilot phase, go-live implementation. Performance metrics included sensitivity, specificity, predictive values, passing rates, error rates, TAT.
Results
The AV system achieved 63.3 % overall passing rate (analyzed from 159,183 data), with outpatient settings showing higher rate (69.2 %) than inpatient settings (56.3 %). Final performance evaluation showed sensitivity, specificity, PPV, and NPV of 93.0 , 65.0, 59.7, and 94.4 %, respectively. Manual verification was required for 36 % of cases, mainly due to defective sample volumes (21.5 %). False negatives, primarily from partial clots, occurred in 0.1 % of cases. Integrating CBC clot alerts into AV rules halved the errors. The system increased tests completed within guaranteed TAT of 90 min by 2.4 %, from 89.7 to 92.1 % and reduced median TAT by 5 min. Outpatient TAT improved significantly, with a reduction over 19 min.
Conclusions
The AV system for APTT and PT tests was successfully implemented, reducing manual verification, improving TAT, particularly in outpatient settings. This study highlights AV systems’ potential to enhance laboratory performance for routine coagulation panels, which rely only on APTT and PT assays. Ongoing rule refinement and monitoring remain crucial for enhancing system accuracy and effectiveness.
Introduction
Coagulation testing is crucial for accurately diagnosing and effectively managing a range of bleeding and thrombotic disorders. These tests guide clinical decisions regarding anticoagulant therapy, transfusion management, and surgical risk assessment [1], 2]. However, manually releasing coagulation test results is time-consuming and requires qualified laboratory professionals to review them, which causes delays in reporting results and potentially impacts patient care.
A possible solution for these issues is an autoverification (AV) system. AV systems employ software algorithms and pre-established criteria to validate acceptable results automatically. Multiple studies have highlighted the benefits of AV systems, including their effectiveness in reducing turnaround time (TAT) and enabling quicker reporting to clinicians. By streamlining laboratory processes, AV has the potential to enhance patient care and support more timely clinical decision-making. In addition, implementing AV enhances the efficiency of laboratory operations, reduces staff workload, and allows them to concentrate on complex cases. The standardization of releasing rules also can improve the consistency and accuracy of results [3], [4], [5], [6], [7].
The advancement in coagulation analyzer and middleware technology has made it easier to implement AV systems for medical laboratories. Modern analyzers now provide results in numerical format with alert flags through the laboratory information system (LIS). Consequently, AV systems can now be integrated to determine the validity of results by combining quality control data, critical results, delta checks, etc. into the setting criteria [8], 9].
Previous studies in coagulation AV systems have primarily focused on combining multiple parameters, such as prothrombin time (PT), international normalized ratio (INR), activated partial thromboplastin time (APTT), fibrinogen, antithrombin activity (AT), thrombin time (TT), and D-dimer to develop the criteria which were achieving percent passing rates ranging from 65 to 98.5 % [10], [11], [12], [13], [14], [15]. However, prior research lacks comprehensive studies on developing and evaluating AV systems that rely exclusively on APTT and PT results, the most ordered tests in routine coagulation testing. This approach is an important challenge for screening routine coagulation laboratories with limited tests available.
The King Chulalongkorn Memorial Hospital, Bangkok, Thailand, a tertiary care hospital affiliated with the Faculty of Medicine, Chulalongkorn University, has performed approximately 150,000 coagulation tests (APTT and PT) yearly, with a 10 % growth rate over the past 3 years. After preliminary results analysis, about 70 % of APTT and 40 % of PT are within the normal range. As the volume of tests continues to grow and the proportion of normal samples continues to grow, the implementation of AV can be a strategic choice to enhance overall laboratory efficiency.
In this study, we used historical laboratory coagulation data of APTT and PT, instrument principles, flags, and quality control data to develop AV rules. This research aimed to validate and implement an AV system in the laboratory’s LIS to reduce TAT. Additionally, the study aims to decrease the workload of staff involved in manual verification and improve the overall efficiency of laboratory operations. In contrast to prior reports, this study assessed the AV system using data exclusively on PT/INR and APTT tests, which could serve as an AV model for laboratories with limited routine test panels.
Materials and methods
Setting
The study was conducted in the central laboratory managed by the Department of Laboratory Medicine, located within a 1,500-bed tertiary referral hospital. Annually, the hospital serves over 1.5 million patients, and the laboratory performs more than 120,000 tests per month. The laboratory is responsible for analyzing routine blood biochemistry, hematology, coagulation, urinalysis, and microscopic examination. The requested tests are performed for inpatients, outpatients, and check-ups with a guaranteed turn-around time of 90 min (1:30 h) for all routine analyses, 90 % of tests needed to meet this criterion as a quality target.
The LIS operated in the facility is the HCLAB system (Sysmex Corporation, Kobe, Japan), which is used for the storage and management of laboratory results and transfer of the data to hospital information systems (HIS). All coagulation tests were measured in plasma collected in 3.2 % sodium citrate (Greiner Bio-One, Vacuette, Kremsmünster, Austria) using CS-2500 analyzer (Sysmex Corporation, Kobe, Japan), automated coagulation analyzer that uses the photo-optical reaction method equipped with five wavelengths of optical fiber (340, 405, 575, 550, and 800 nm) [8], 9]. The reagents were Thromborel S and Actin FS for PT for APTT assays, respectively.
This study has been approved by the Institutional Review Board, Faculty of Medicine, Chulalongkorn University, Thailand (IRB No. 0519/67).
AV algorithm development
We developed the AV model by adhering to the CLSI AUTO10-A:2006 [16] and CLSI AUTO15-ED1:2019 [17] guidelines. An interdisciplinary team of clinical pathologists, medical technologists, instrument specialists, and information technology (IT) specialists collaborated to design the AV rules. We created rules based on a combination of pre-analysis, analysis, and post-analysis evaluation to minimize potential errors. The descriptions of each rule are explained in Table 1.
Autoverification rules for coagulation test, rules related phase, description, and rule sources.
| Rules related phase | Rule no. | Evaluation rules | Description | Rule sources | Notes |
|---|---|---|---|---|---|
| Pre-analysis | 1 | HIL | Hemolysis, lipemic, icteric samples which can cause analysis interference | Analyzer | |
| Pre-analysis | 2 | Defective sample volume | To check to sample volume is appropriate that does not affect the 9:1 blood and sodium citrate ratio. The volume of blood sample should not be less than 90 % of specified volume | Analyzer | |
| Analysis | 3 | Quality control (QC) check | QC evaluation and approve before test released | Middleware | |
| Analysis | 4 | Repeat/Rerun | Repeat and rerun samples should not be autoverified | Middleware/LIS | |
| Analysis/Post-analysis | 5 | Results format | Non-numeric results or characters or text results | Middleware/LIS | |
| Analysis | 6 | Instrument flags: clotting curve errors | Instrument flags indicate the need for re-evaluating the test results | Analyzer | Added after adjusting the rules |
| 6.1 | Flat curve (only PT assay) | Slope of the coagulation curve around the 50 % detection point is too flat. Possibly caused by high dose warfarin, low fibrinogen concentration, low factor activity | Analyzer | ||
| 6.2 | Coagulation detection% change | Falsely decreased initial result. Initial reaction and true coagulation reaction are separated (bi-phasic reaction curve), possibly caused by poor sample collection & contamination, anti-coagulants such as heparin | Analyzer | ||
| 6.3 | Slight coagulation | Weak coagulation reaction possibly caused by low fibrinogen, factor deficiency, inhibitor or interference | Analyzer | ||
| 6.4 | Analysis time over | Sample does not develop stable clot within measurement time. Possibly caused by over anticoagulation or factor deficiency | Analyzer | ||
| 6.5 | Coagulation curve error: stepping curve | Unexpected curve fluctuation, false end point. Possibly caused by air bubble in the reaction cuvette (common) | Analyzer | ||
| 6.6 | Early reaction error (ERE) | Analyzer | |||
| Slow reaction | Slope of coagulation curve around detection point is too low. Possibly caused by low fibrinogen, anticoagulant or reagent issue | ||||
| Start angle | Angle of coagulation curve is too high at the beginning of the curve, may cause by artifacts | ||||
| Early % | Start of coagulation is detected too early. Possibly caused by possible pre-activation of sample such as poor sample collection and handling | ||||
| 6.7 | No coagulation | The coagulation reaction was not detectable or weak coagulation. Possibly caused by low fibrinogen concentration, presence of anticoagulant, or a reagent issue | Analyzer | ||
| Pre-analysis | 7 | Consistency check | Logic rules that help to identify additional common errors | LIS | |
| 7.1 | Hct >55 % | When hematocrit results of the same patients from hematology analyzer show>55 % Possibly caused by conditions or diseases associated with high RBCs and hematocrit (e.g. polycythemia vera, heart and lung disease) |
LIS (connect with automated hematology analyzer) | ||
| 7.2 | Possible heparin contamination | Notify laboratory staff to investigate potential pre-analytical errors related to heparin contamination or other related causes when an isolate APTT >90 s with a normal PT is found | LIS | ||
| Post-analysis | 8 | Verification decision limit | The value that determines the needed to verify the results other than analytical limit and critical values. We calculated using our patients’ population results at 2nd and 98th percentiles and combine with reference interval: PT 10.3–20.9 s, APTT 21.4–32.4 s By checking for historical data If patient has previous results - send for delta check If no previous data - hold for manual verification |
LIS | |
| Post-analysis | 9 | Critical value | APTT <21 s (previous use: <20 s) and >100 s PT <10 s and >37 s INR >3 in patients’ age <15-year-old INR >5 in patients’ age ≥15-years-old |
LIS | Change made after adjusting the rules |
| Post-analysis | 10 | Delta check | Consecutive results are compared to assess changes based on a defined acceptable threshold and the time interval: ±20 % APTT within 90 days ±40 % PT/INR within 90 days Previous result with APTT >200 s and/or PT >200 s |
LIS |
-
HIL, hemolysis, icterus, lipemic; PT, prothrombin time; APTT, activated partial thromboplastin time; s, second; LIS, laboratory information system.
The steps of the AV process include.
Quality control (QC) status: QC status of the instruments was first verified before proceeding with AV process.
Sample serum indices: the analyzer evaluated the hemolysis, lipemia, and icterus indices to ensure they were within our limit settings.
Instrument and result flags or alarms: the flags indicated the need for re-evaluating the sample or the test, e.g. defective volume, clotting curve errors, and results formats.
Rerun/repeat result: all rerun or repeat results indicated a problem that should be verified manually.
Critical values: the test results exceeded the critical limits, indicating an urgent need for management.
Delta check: two consecutive test results from the same patient were assessed based on the laboratory’s established criteria for acceptable changes over a specified timeframe.
Verification decision limits (VDL): the VDL was calculated using population-based percentiles and the Tukey method to exclude outliers [7]. Then, the widest range from the percentiles and the lab’s reference values were selected to establish VDL range. Evalution for proper VDL range based on the simulation analysis passing rate.
Consistency check: served as a logical rule to identify potential addition errors, including heparin contamination and hemoconcentration (Hct>55 %).
All these processes had been custom-built within our LIS. The AV process is illustrated in Figure 1.

The coagulation autoverification workflow. The flowchart shows the coagulation AV process. The process started with a quality control check, sample quality check, check for numerical results, analyzer error flags, critical values, delta checks, and consistency checks. If any issues were detected, results were blocked for manual review; otherwise, they were autoverified and reported. QC, quality control.
Validation of AV rules
The AV algorithms were evaluated sequentially during the preliminary phase, pilot phase, and go-live phase.
Preliminary phase
We performed a retrospective analysis using a data set of previous coagulation test results extracted from the LIS at approximately 27,000 and 35,000 data of APTT and PT, respectively. This dataset was utilized to simulate the AV process. We then compared our analysis with the results verified manually by experienced laboratory staff.
Pilot phase: implementation and validation
We used parallel testing to implement the AV algorithm. The AV was carried out alongside standard manual review procedures. Those that met the AV criteria were provisionally labeled as “autoverified” in the comment section of the LIS, without being released to users. Additionally, all discordant results were carefully reviewed.
Discordant result review
The clinical pathologists and medical technologists carefully reviewed any instances where a result passed autoverification but had been re-analyzed/reviewed/additional action required during the manual review, and vice-versa discordances. These discordances were used to refine AV rules further. Rules were adjusted based on the result analysis. We calculated the AV passing rate and evaluated true-negative, true-positive, false-negative, and false-positive (defined in Supplemental Table S1), sensitivity (identify results requiring manual review correctly), specificity (identify results suitable for autoverification correctly), positive predictive value (PPV), and negative predictive value (NPV).
Reference change value (RCV) and total allowable error (TEa)
We used the RCV to identify the clinically significant change. The RCV was calculated from analytical variation (CVA), within-subject biological variation (CVI), and Z-scores using the formula:
Go-live phase: efficiency and performance evaluation
After validation of the AV algorithm and no discrepancies or clinically significant errors were detected, we started full implementation to release and validate the results that met the criteria automatically.
The efficiency and performance of rules are continuously tracked and monitored after implementation. The indicators included TAT by collecting the time from sample receipt to validate the result. TAT was measured by time at median and 90th percentile, as well as overall TAT. The percentage of results released at a TAT of 90 min was measured as a laboratory quality indicator. These indicators were compared with pre-implementation data. AV passing rates and the number of manual reviews indicate the reduction in workload for laboratory staff.
The safety indicator identifies any near-miss events where potentially erroneous results were almost auto-released or incident reports that had occurred by auto-verified results.
Data collection
Coagulation data were collected from both outpatients and inpatients at our hospital using the LIS. A total of 70,865 historical coagulation results were analyzed from January 2021 to December 2021 to establish the verification decision range for PT and APTT and implement AV system. Between October and December 2023, a total of 21,364 results were obtained through autoverification in parallel with manual verification to determine the passing rate and assess the performance of the protocols. Following protocol adjustments, an additional 4,509 results were collected in March 2024 to further evaluate the AV algorithm.
Once the protocols were validated, formal implementation started on March 20, 2024. From that date until August 2024, a total of 159,183 tests were collected to monitor the performance and efficiency of the AV system. In October 2024, we collected an extra 12,971 data for re-evaluation following the implementation of error reduction strategies.
Statistical analysis
IBM SPSS Statistics Version 25.0 (IBM Corporation, Chicago, USA) was used for statistical analysis. APTT and PT descriptive statistics, including mean, standard deviation (SD), and 2nd and 98th percentiles, were used to characterize the dataset of coagulation tests. The outlier was calculated by the Tukey Method. The AV rules passing rate and blocking rate were calculated into percentages. The performance of AV rules was analyzed by sensitivity, specificity, PPV, and NPV. The TAT was calculated using mean and SD. A comparison of turnaround times before and after AV implementation was conducted using the Mann-Whitney U test and p-Values < 0.001 was considered indicative of statistical significance. All figures were generated using Microsoft Excel 2021 (Microsoft Corporation, USA)
Results
Define the VDL
From January 2021 to January 2022, a total of 42,149 PT and 28,716 APTT results from patient population were enrolled to calculate the 2nd, 5th, 95th, and 98th percentiles. Upon the preliminary study to set the VDL, we simulated a 4-month patient results (PT of 38,569 and APTT of 34,702). The results, as demonstrated in Table 2, revealed that selecting the 2nd and 98th percentiles combined with reference intervals yielded the highest passing rate with the same error rate.
Distribution, reference values, percentiles, verification decision limits, and passing rates.
| n | Mean | SD | Min | Max | Reference interval | 5th–95th percentile | 2nd–98th percentile | ||||
|---|---|---|---|---|---|---|---|---|---|---|---|
| Low | High | Low | High | Low | High | ||||||
| PT, s | 42,149 | 16.1 | 8.2 | 9.6 | 190.3 | 10.3 | 12.7 | 11.1 | 18.9 | 10.8 | 20.9 |
| APTT, s | 28,716 | 27.2 | 5.6 | 15.8 | 191.1 | 21.4 | 31.1 | 22.4 | 31.0 | 21.6 | 32.4 |
|
|
|||||||||||
| Verification decision range selection | Low | High | Passing rates, % | ||||||||
|
|
|||||||||||
| PT, s | Reference interval | 10.3 | 12.7 | 67.6 | |||||||
| Reference interval + 5th–95th percentile | 10.3 | 18.9 | 89.7 | ||||||||
| Reference interval + 2nd–98th percentile | 10.3 | 20.9 | 90.7a | ||||||||
| APTT, s | Reference interval | 21.4 | 31.1 | 89.5 | |||||||
| Reference interval + 5th–95th percentile | 21.4 | 31.1 | 89.5 | ||||||||
| Reference interval + 2nd–98th percentile | 21.4 | 32.4 | 92.0a | ||||||||
-
SD, standard deviation; PT, prothrombin time; APTT, activated partial thromboplastin time; s, second; Min, minimum; Max, maximum; n, number. aChosen verification decision range based on the highest passing rate.
Validation of AV system
A total of 21,364 tests from October to December 2023, using an AV algorithm were tested in parallel with manual verification. During October 2023, the overall AV passing rate was 62.4 % (6,111 out of 9,792), including 419 true positive cases (sensitivity 98.4 %), 6,104 true negative cases (specificity 65.2 %), 3,262 false positive cases, and seven cases (0.07 %) that were false negative. Similar outcomes were found during December 2023, the overall AV passing rate was 68.1 % (7,884 out of 11,572), including 455 true positive cases (sensitivity 98.1 %), 7,875 true negative cases (specificity 70.8 %), 3,254 false positive cases, and nine cases (0.08 %) that were false negative.
We thoroughly investigated all discordant results and identified that all false-negative cases, which should not have been auto-released, were released due to the instrument failing to detect partial clots. These clots were later identified by paired samples sent for complete blood count (CBC) analysis. However, these specimens exhibited only minimal reductions in the actual results, and most of them fell within the verification decision limit range. The changes in results ranged from −2.5 to 1.8 s for PT tests (mean −0.77 s±0.98) and −6.4 to 3.9 s for APTT tests (mean −3.34 s±2.5). The mean difference in partial clot cases was within the RCV, and TEa (Table 3).
Cases of false negatives in PT and APTT results, comparing changes in results between partial clot samples and re-collected specimens.
| Test name | PT, s | APTT, s | ||||
|---|---|---|---|---|---|---|
| Partial clot sample | Re-collected sample | Difference | Partial clot sample | Re-collected sample | Difference | |
| 14.2 | 12.4 | 1.8 | 28.9 | 25 | 3.9 | |
| 11.2 | 11.4 | −0.2 | 20.4 | 23.2 | −2.8 | |
| 10.4 | 11.5 | −1.1 | 20.6 | 25.6 | −5 | |
| 12.7 | 13 | −0.3 | 21.1 | 23 | −1.9 | |
| 13.2 | 14.1 | −0.9 | 21.5 | 22.8 | −1.3 | |
| 14.2 | 16 | −1.8 | 27.5 | 32.3 | −4.8 | |
| 11.9 | 13.9 | −2 | 20.1 | 25.2 | −5.1 | |
| 12.8 | 13.1 | −0.3 | 20.3 | 22.4 | −2.1 | |
| 11 | 12.5 | −1.5 | 28.3 | 29.6 | −1.3 | |
| 13.9 | 14.5 | −0.6 | 22.4 | 28.6 | −6.2 | |
| 13.3 | 14.4 | −1.1 | 20.1 | 23.4 | −3.3 | |
| 10.7 | 11.4 | −0.7 | 18.9 | 22.8 | −3.9 | |
| 12.3 | 14.8 | −2.5 | 24.6 | 29.8 | −5.2 | |
| 11.6 | 11.8 | −0.2 | 21 | 23.9 | −2.9 | |
| 17.2 | 17.9 | −0.7 | 24.9 | 30 | −5.1 | |
| 12.5 | 12.7 | −0.2 | 20.4 | 26.8 | −6.4 | |
|
|
||||||
| Mean difference, s (%) | −0.77 (−5.5 %) | −3.34 (−12.6 %) | ||||
|
|
||||||
| SD, s | 0.98 | 2.5 | ||||
| TEa, % | 15 | 15 | ||||
| CVI, % | 2.53 | 3.48 | ||||
| CVA, % | 2.83 | 1.95 | ||||
| RCV, % | 12.46 | 13.09 | ||||
-
SD, standard deviation; PT, prothrombin time; APTT, activated partial thromboplastin time; TEa, total allowable error; CVI, within-subject biological variation; CVA, analytical variation; RCV, reference change value.
Rules refinement and re-evaluation
After discovering 16 false-negative cases, we adjusted our protocol to minimize these errors by raising the low critical value of APTT from 20s to 21s and choosing specific instruments’ clotting curve error alarms to identify any abnormal clotting patterns (6.1–6.7 in Table 1). This adjustment was expected to prevent partial clots from going undetected by the instrument settings, and algorithm rules.
In March 2024, after rules adjustments, data was recollected before the go-live phase. The AV passing rate was 63.4 % (2,858 out of 4,509). The tests that were autoverified included APTT (2.3 %), PT (9.2 %), and APTT with PT (51.9 %). The true-positive were 88 cases, and the true-negative were 2,854 cases with 95.7 % sensitivity and 64.6 % specificity. However, three false negatives out of 4,509 cases (0.07 %) were caused by partial clots still occurring.
Post-implementation: assessment of coagulation AV performance
From May to June 2024 and Oct 2024, after full implementation, 7,588 out of 12,041 (63.0 %) results were autoverified, including APTT (3.5 %), PT (9.1 %), and APTT with PT (50.5 %). The sensitivity was 94.2 %, while the specificity was 64.1 %, resulting in an overall accuracy of 79.2 %. The NPV was 94.9 % and the PPV was 60.7 %. All 14 cases of false negatives (0.1 %) were identified due to the presence of partial clots, which are similar to patterns found in the earlier phases.
Due to the limitations of testing instruments that could not detect partial clots and the minimal, non-specific changes observed in APTT and PT results, strategies to reduce false negatives were further explored. We found that almost half of the APTT and PT tests had been submitted alongside CBC testing, which typically had a shorter processing time. When clots were detected during the CBC analysis, an alert message was triggered for the coagulation testing team to withhold the autoverification of the results.
After applying this strategy, an additional 12,971 data collected in October 2024 revealed false negative cases by partial clots could be reduced by 48 % (from 12 out of 23). Other instruments’ undetected partial clot specimens were promptly re-collected upon the identification of clots by the laboratory staff. Follow-up evaluations of the patients indicated no adverse effects on clinical outcomes or treatment changes. The AV rules demonstrated a sensitivity of 93.0 %, specificity of 65.0 %, NPV of 94.4 %, and PPV of 59.7 %. We found that most cases of AV failure resulted from defective sample volume at 21.5 %, icteric samples at 8.4 %, and APTT delta check issues at 7.7 %. The overall and individual rules’ blocking rate and false positive rate are shown in Table 4.
Performance of individual rules for autoverification, including block number, block rate, and false positive rate (October 2024).
| Autoverification review rules | Block, n | Block rate, % | False positive rate, % |
|---|---|---|---|
| Overall autoverification rules performance | 4,637 | 35.75 | 35.0 |
| Defective sample volume | 2,784 | 21.46 | 24.4 |
| Icterous sample | 1,088 | 8.39 | 11.2 |
| Delta check (APTT) | 1,000 | 7.71 | 10.0 |
| Verification decision limit (APTT) | 478 | 3.69 | 5.2 |
| Delta check (PT) | 414 | 3.19 | 4.4 |
| Verification decision limit (PT) | 413 | 3.18 | 4.6 |
| Critical value: APTT >100 s or APTT <20 s | 406 | 3.13 | 4.1 |
| Delta check (INR) | 368 | 2.84 | 4.0 |
| Critical value: PT >37 s or PT <10 s | 346 | 2.67 | 3.8 |
| Abnormal coagulation curve flag | 271 | 2.09 | 2.5 |
| Non-numerical results | 268 | 2.07 | 2.6 |
| Suspected heparin contamination | 119 | 0.92 | 1.3 |
| Critical value: INR >3 or INR >5 | 49 | 0.38 | 0.4 |
| Hemolytic sample | 48 | 0.37 | 0.5 |
| Hematocrit result >55 % | 20 | 0.15 | 0.2 |
| Lipemic sample | 20 | 0.15 | 0.2 |
-
PT, prothrombin time; APTT, activated partial thromboplastin time; INR, international normalized ratio; n, number.
Impact of AV system on laboratory process
After completing the implementation phase, a total of 159,183 tests were collected from the LIS (March 20, 2024, to August 2024). The AV passing rate was 100,688 out of 159,183 (63.3 %), indicating that 36.7 % required manual verification. Furthermore, 61.6 % of the overall results had abnormal coagulation values.
The TAT data revealed a significant trend toward decreasing overall average turnaround times (refer to Table 5 and Figure 2) from 56.2 (±24.6) to 53.35 (±25.2) minutes (p<0.001). The median of TAT was shortening from 51.5 to 46.4 min. This trend was accompanied by 2.4 % increase (from 89.7 to 92.1 %) in delivered results within the laboratory’s guaranteed turnaround time [1:30 h]. The overall analysis time was also shortened by 4.32 min (50.5±24.2 and 47.2±23.1, p<0.001) (Table 5).
Autoverification passing rate, manual review rate, abnormal results, and comparison of pre-and post-implementation turnaround times for OPD and IPD settings.
| OPD and IPD | IPD | OPD | ||||||||||
|---|---|---|---|---|---|---|---|---|---|---|---|---|
| Autoverification passing rate, % | 63.3 % | 56.3 % | 69.2 % | |||||||||
| Manual review rate, % | 36.7 % | 43.7 % | 30.8 % | |||||||||
| Abnormal results (low or high), % | 61.6 % | 77.5 % | 48.1 % | |||||||||
|
|
||||||||||||
| Pre-implement | Post-implement | Difference | p-Value | Pre-implement | Post-implement | Difference | p-Value | Pre-implement | Post-implement | Difference | p-Value | |
|
|
||||||||||||
| Total tests, n | 159,183 | 72,882 | 111,353 | 51,989 | 47,830 | 20,893 | ||||||
| Test validate within TAT 90 min, % | 89.7 % | 92.1 % | 2.4 % | 87.7 % | 90.3 % | 2.6 % | 90.4 % | 96.8 % | 6.4 % | |||
| Mean analysis time, h:min:s; SD | 00:50:53 | 00:47:17 | 00:03:36 | <0.001a | 00:57:08 | 00:52:37 | 00:04:31 | <0.001a | 00:36:20 | 00:34:01 | 00:02:19 | <0.001a |
| 00:24:20 | 00:23:07 | 00:25:37 | 00:24:23 | 00:11:49 | 00:11:50 | |||||||
| Mean TAT, h:min:s; SD | 00:56:20 | 00:53:35 | 00:57:41 | 00:56:34 | 00:53:12 | 00:46:10 | <0.001a | |||||
| 00:24:35 | 00:25:17 | 00:02:45 | <0.001a | 00:25:55 | 00:26:44 | 00:01:07 | <0.001a | 00:20:49 | 00:19:22 | 00:07:02 | ||
| Median TAT, h:min:s; IQR | 00:51:47 | 00:46:40 | 00:05:07 | 00:53:39 | 00:49:40 | 00:03:59 | 00:58:26 | 00:40:20 | 00:18:06 | |||
| 00:27:00 | 00:26:59 | 00:26:59 | 00:28:00 | 00:27:00 | 00:20:00 | |||||||
| P90 TAT, h:min:s; IQR | 01:31:13 | 01:24:40 | 01:36:21 | 01:30:00 | 01:30:04 | 01:10:20 | ||||||
| 00:27:00 | 00:26:59 | 00:06:33 | 00:26:59 | 00:28:00 | 00:06:21 | 00:27:00 | 00:20:00 | 00:19:44 | ||||
-
OPD, outpatient department; IPD, inpatient department; APTT, activated partial thromboplastin time; IQR, interquartile range; P90, 90th percentile; PT, prothrombin time; SD, standard deviation; TAT, turnaround time; n, number. aStatistically significant.
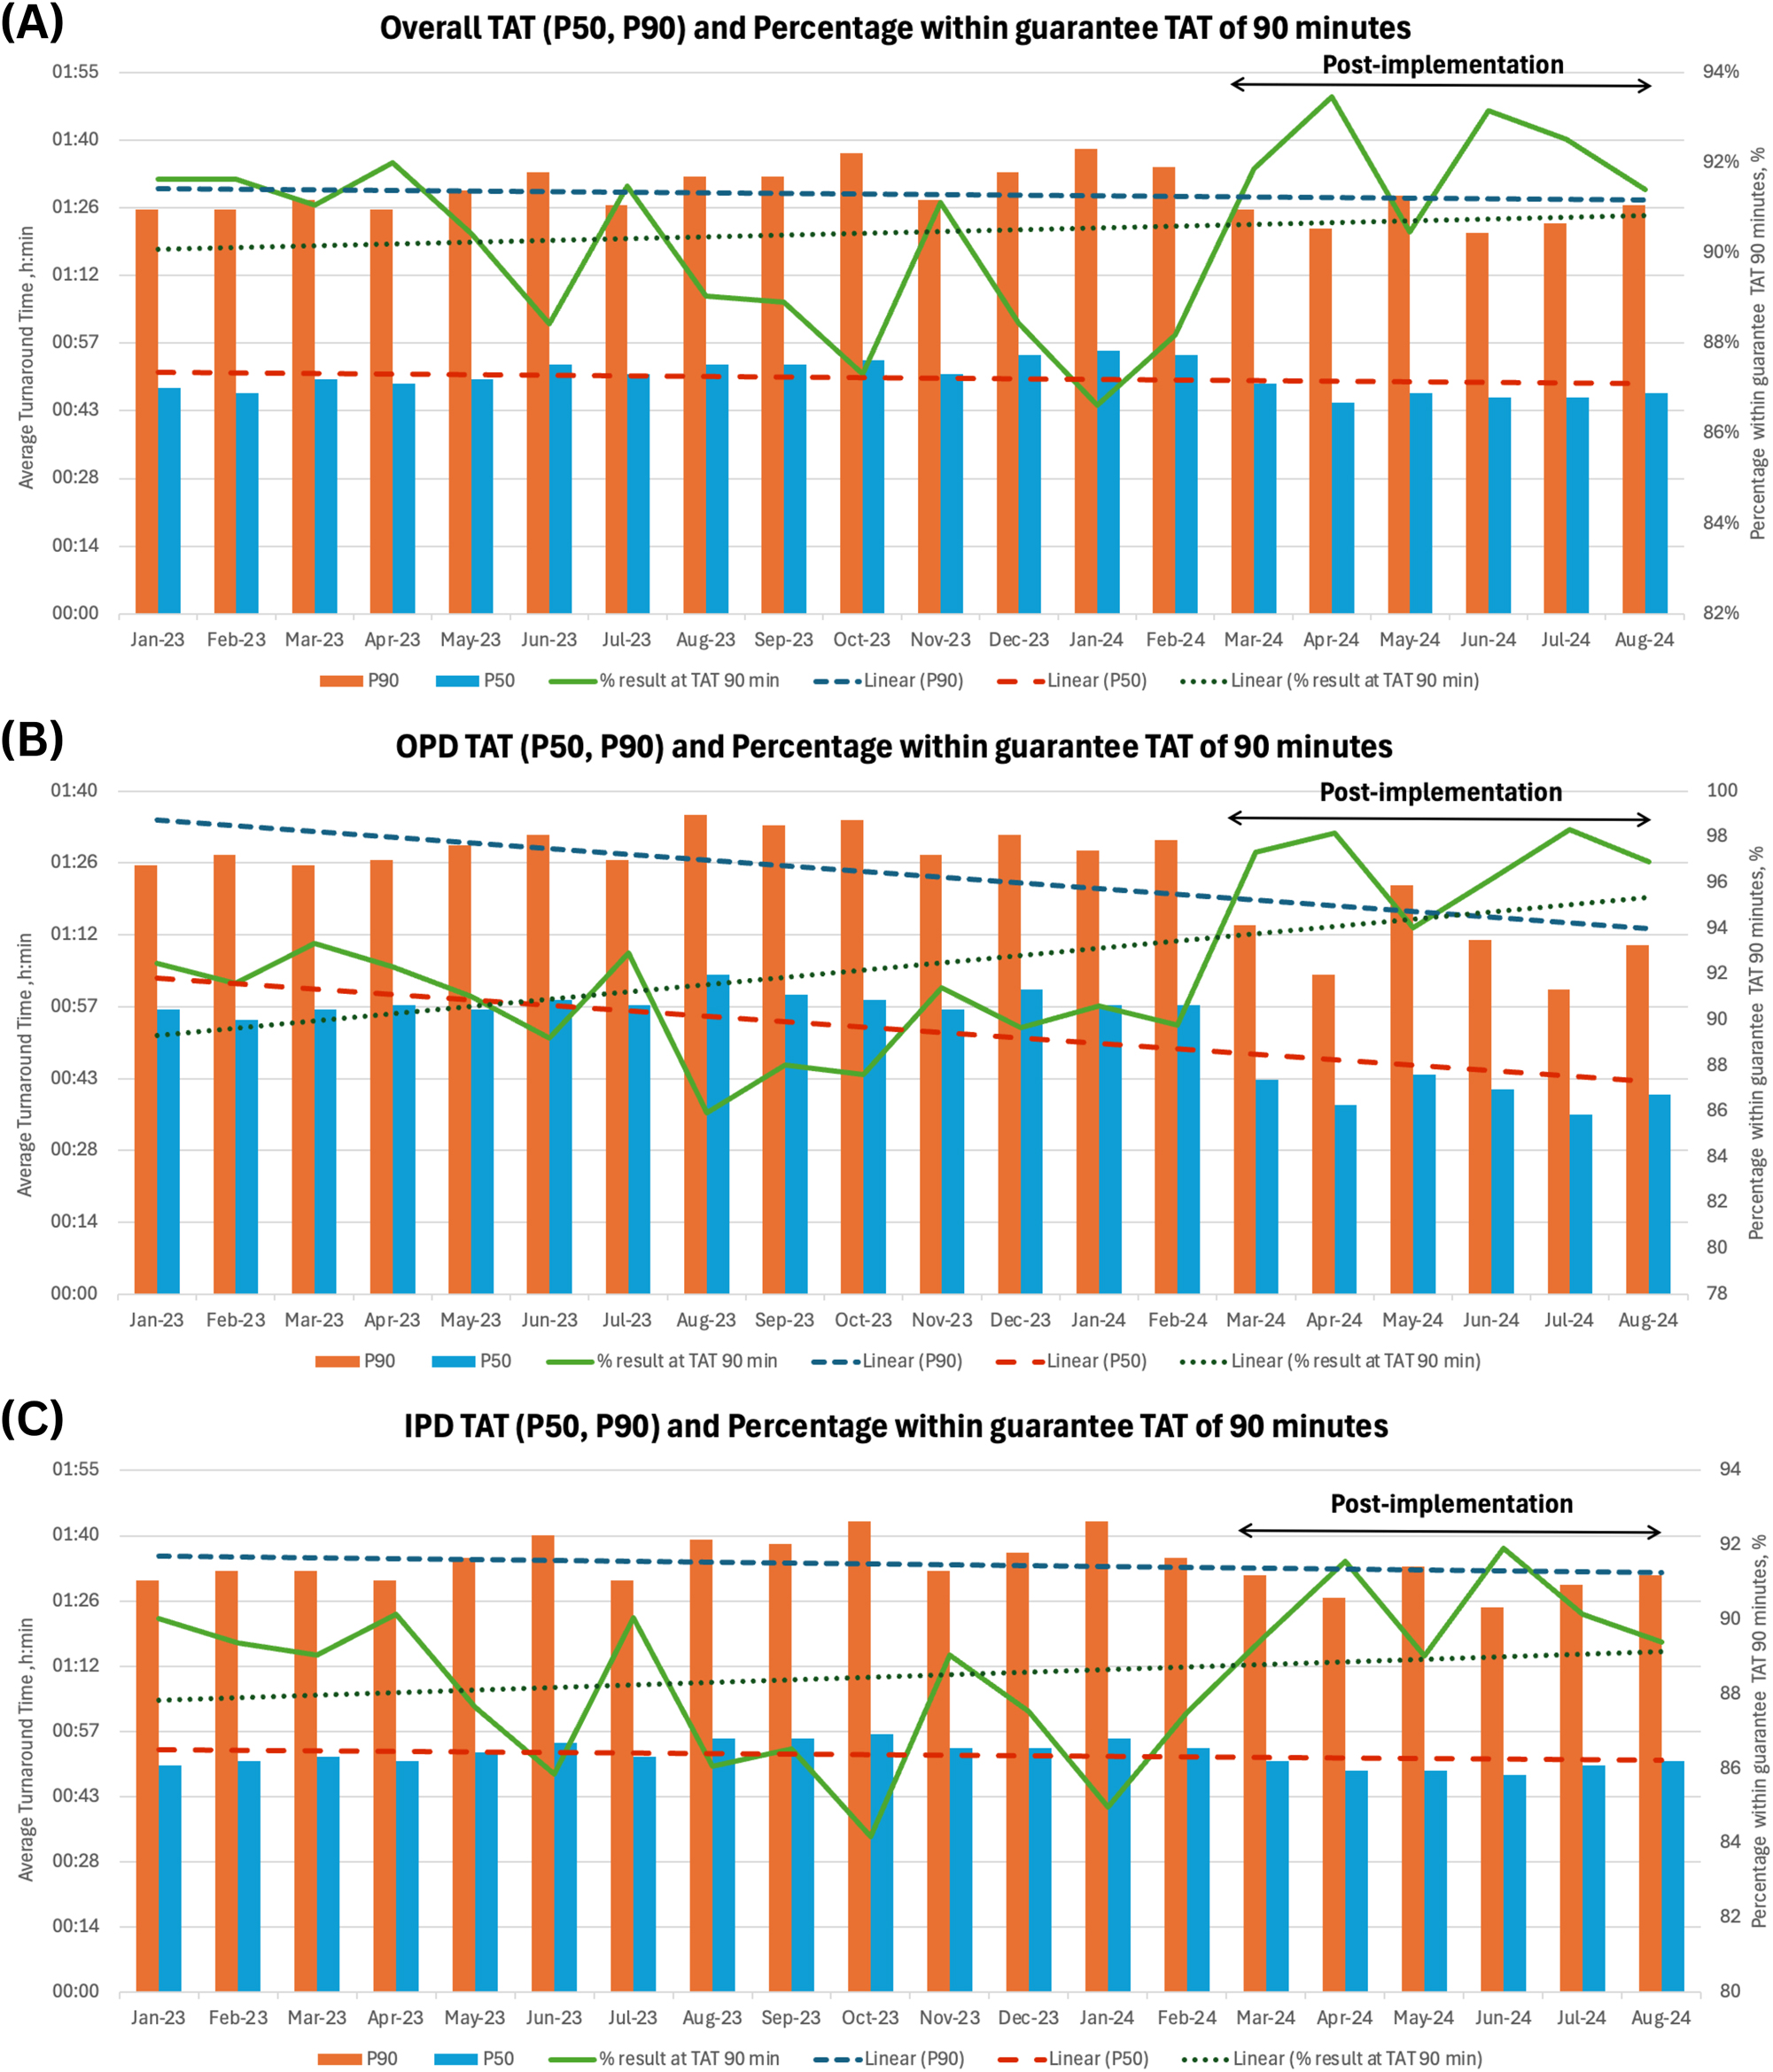
The impact of laboratory workflow on TAT and the percentage of results achieved within the guaranteed TAT of 90 minutes for Overall, OPD, and IPD settings. TAT and percentage of results within the guaranteed TAT of 90 minutes for overall, OPD, and IPD. This graph shows the monthly trends in turnaround times, represented by the median TAT (P50) and 90th percentile TAT (P90), along with the percentage of results reported within 90 minutes (green line). Linear trend lines are included for the median, P90, and the percentage within 90 minutes. The post-implementation period is indicated during Mar 2024. (A) Overall (OPD and IPD), (B) OPD, (C) IPD TAT and percentage of results within the guaranteed TAT of 90 minutes. TAT, turnaround time; P50, 50th percentile of TAT; P90, 90th percentile of TAT; OPD, outpatient department; IPD, inpatient department.
A comparison between outpatient and inpatient laboratories revealed the outpatient group TAT was significantly shortened by 7.0 min, decreasing from 53.1 (±20.5) to 46.1 (±19.2) minutes. In contrast, the TAT in inpatient settings showed only a minor reduction of 1.1 min, from 57.4 (±25.6) to 56.3 (±26.4) minutes. The AV passing rates were higher in the outpatient group compared to the inpatient group (69.2 vs. 56.3 %) (Table 5). The trend lines for outpatient samples in Figure 2B indicated a more substantial improvement in the laboratory process, in which 96.8 % of all tests can be released within our laboratory’s time criteria. When comparing the laboratory’s working hours in OPD by evaluating the TAT across different time intervals, marked improvements can be observed before and after the implementation during the same month in different years (August 2023 vs. August 2024) (Figure 3). The data show that post-implementation, the average TAT decreased across all time slots, with particularly noticeable reductions during peak hours (7–11 AM), where the volume of specimens processed was comparable.

Average turnaround time for OPD before and after AV implementation during August 2023 compared to August 2024. Average turnaround time for the OPD before and after AV implementation, compared over each working hour in one month, analyzing August 2023 (pre-implementation with a total of 3,362 samples) and August 2024 (post-implementation with a total of 3,472 samples).
In terms of patient safety, during the go-live implementation, no incident reports occurred by autoverified results.
Discussion
Implementing AV in clinical laboratories can improve workflow efficiency, as previous studies have shown its positive impact on TAT and staff workload [11], 14], 15]. There were variations in AV passing rates ranging from 65 to 98.5 % [10], [11], [12, 14], 19], 20]. Our findings revealed a significant reduction in TAT in both OPD and IPD settings, particularly during peak periods. This improvement enhanced laboratory quality and ensured consistent and timely results. However, we observed a lower passing rate and reduced specificity compared to other studies.
As observed in our studies, pre-analytical issues, especially defective sample volumes and icteric samples, were major contributors to AV failures with a high false-positive rate, likely due to the instrument’s high detection sensitivity. Although equipment modifications were an option, they were often difficult and time-consuming. Instead, optimizing pre-analytical processes offered a more practical solution for improving AV system performance. One key factor in the lower AV passing rate was the complexity of our patient population. As a tertiary care hospital, we managed critically ill patients in inpatient, ICU, and ER settings, leading to differing AV system performance between outpatient and inpatient cases. In OPD, where cases are generally routine, TAT improved significantly, with higher proportion of results released on time. While the inpatient department, which handles critical cases, showed less improvement.
Establishing rules based solely on PT and APTT was challenging due to the potential for undetected small or partial clots. In clotted samples, pre-activation of coagulation factors and platelets, which produced FVIIa and thrombin, may have led to falsely shortened clotting times [21]. Results from partial clots could fall within the reference range, showing no noticeable changes. While other parameters in our laboratory could not identify these clots, narrowing the limit check or using additional instrument flags did not improve detection. Manual interventions may have been necessary. Prior research suggested incorporating fibrinogen levels or TT assays into rule design to enhance clot detection accuracy in laboratories where these assays were available [14], 19]. Our findings showed that APTT was more affected by clots than PT, however, minor errors had no clinically significant change, as defined by the RCV [22]. RCVs varied between 6.76 and 14.6 % for APTT and 8.1–11.7 % for PT, depending on the study setting [23], [24], [25], [26]. We adopted the CVI reference of 3.48 % for APTT and 2.53 % for PT from a study using the same instruments and reagents [26].
As an alternative approach to AV algorithm development, incorporating demographic and clinical data such as age, diagnosis, and treatment might improve both the passing rate and the accuracy of results [14], 20]. According to findings from Linzi’s study, which reported a passing rate of 69.5 %, the true-positive rate was 100.0 %, with low false-positive rate of only 17.6 %. The study proposed specific critical values for different departments and expanded limit ranges for particular groups, including patients over 60 years old, postoperative patients, and those receiving anticoagulants. Additionally, specific limit ranges were calculated for samples from the obstetric department [19]. Due to our system limitations, we were unable to obtain the patient’s clinical information transfers to the LIS system. Delta check rules were used to manage persistent PT or APTT prolongations in patients on anticoagulant treatments, serving as an alternative when direct clinical data was unavailable.
Different strategies have been used to establish limit checks [27]. In some cases, reference intervals were used for patients not receiving anticoagulant therapy [20]. However, standard reference ranges might be overly stringent for practical application. While the 5th–95th percentile was commonly used [14], 19], this study extended the range to the 2nd–98th percentile, as no significant difference in error rates was observed, allowing for an improved passing rate.
In some studies, the delta check was performed after a limit range [11], 14], while in others, it was conducted before the limit range to prevent unnecessary rule re-evaluations [19].
In this study, results were processed through two pathways: a delta check for samples with historical data from the past 90 days and a limit check for those without. This approach aimed to increase the passing rate. Meanwhile, critical value thresholds remained in place to ensure that significant abnormalities were detected.
This study was structured into three phases: preliminary, pilot, and go-live. This approach allowed us to review patient data before establishing rules tailored to our population. During rule development, we withheld unreliable results until the system was stable and the rules refined. Although time-consuming, this method ensured greater safety, particularly given the high prevalence of abnormalities in our population. However, it may not be suitable for settings requiring urgent implementation. Our AV criteria settings could serve as a model for laboratories with limited test panels, especially those relying solely on PT and APTT tests, and for patients monitored only for PT and APTT levels. The limitations of this study included the lack of integration of patient clinical data into the system. The evaluation of the laboratory process impact was based on TAT. However, we could not account for other potential confounding factors that may affect TAT.
The effectiveness of the same AV algorithm can differ across laboratory sites due to factors such as patient population, characteristics assays, and test item panels. Therefore, AV rules should be tailored to the unique conditions of each laboratory. The most important thing is to continuously monitor system performance, and adjusting rules as needed is crucial to maintain and improve optimal accuracy.
Conclusions
AV systems were designed to reduce the workload for laboratory personnel and decrease turnaround time while also providing time for troubleshooting problematic tests. Our laboratory coagulation AV algorithm, which included solely APTT and PT parameters, yielded a passing rate of 63.3 % with high sensitivity and high NPV. Less complicated patients in the OPD had a higher passing rate and improvement in TAT compared with the IPD. However, using such systems requires careful attention, prior assessment of accuracy is essential to avoid any unintended consequences on patient care. In addition, AV systems have certain limitations in terms of operational procedures, IT systems, and test items in each clinical setting. Therefore, the skills of laboratory personnel remain crucial in ensuring effective operation.
Funding source: Grants for Development of New Faculty Staff, Ratchadaphiseksomphot Fund, Chulalongkorn University
Award Identifier / Grant number: 3300120707
Acknowledgments
We acknowledge the support provided by Sysmex, Thailand, especially Suwichak Hemchatchawan, Pitchanun Saengow, and Nuttawat Koorboon for their support in system implementation. This research project is supported by Grants for Development of New Faculty Staff, Ratchadaphiseksomphot Fund, Chulalongkorn University, Bangkok, Thailand.
-
Research ethics: Research involving human subjects complied with all relevant national regulations and institutional policies and complies with the tenets of the Helsinki Declaration (as revised in 2013). This study has been approved by the Institutional Review Board, Faculty of Medicine, Chulalongkorn University, Thailand (IRB No. 0519/67).
-
Informed consent: Not applicable.
-
Author contributions: The authors have accepted responsibility for the entire content of this manuscript and approved its submission.
-
Use of Large Language Models, AI and Machine Learning Tools: None declared.
-
Conflict of interest: The authors state no conflict of interest.
-
Research funding: Grants for Development of New Faculty Staff, Ratchadaphiseksomphot Fund, Chulalongkorn University.
-
Data availability: Not applicable.
References
1. Suchman, AL, Griner, PF. Diagnostic uses of the activated partial thromboplastin time and prothrombin time. Ann Intern Med 1986;104:810–6. https://doi.org/10.7326/0003-4819-104-6-810.Search in Google Scholar PubMed
2. Levy, JH, Szlam, F, Wolberg, AS, Winkler, A. Clinical use of the activated partial thromboplastin time and prothrombin time for screening: a review of the literature and current guidelines for testing. Clin Lab Med 2014;34:453–77. https://doi.org/10.1016/j.cll.2014.06.005.Search in Google Scholar PubMed
3. Riley, PW, Gallea, B, Valcour, A. Development and implementation of a coagulation factor testing method utilizing autoverification in a high-volume clinical reference laboratory environment. J Pathol Inf 2017;8:25. https://doi.org/10.4103/jpi.jpi_95_16.Search in Google Scholar PubMed PubMed Central
4. Brown, AS, Badrick, T. The next wave of innovation in laboratory automation: systems for auto-verification, quality control and specimen quality assurance. Clin Chem Lab Med 2023;61:37–43. https://doi.org/10.1515/cclm-2022-0409.Search in Google Scholar PubMed
5. Guidi, GC, Poli, G, Bassi, A, Giobelli, L, Benetollo, PP, Lippi, G. Development and implementation of an automatic system for verification, validation and delivery of laboratory test results. Clin Chem Lab Med 2009;47:1355–60. https://doi.org/10.1515/cclm.2009.316.Search in Google Scholar
6. Nuanin, S. Autoverification improved process efficiency, reduced staff workload, and enhanced staff satisfaction using a critical path for result validation. Siriraj Med J 2020;72:296–306. https://doi.org/10.33192/smj.2020.40.Search in Google Scholar
7. Topcu, DI, Gulbahar, O. A model to establish autoverification in the clinical laboratory. Clin Biochem 2021;93:90–8. https://doi.org/10.1016/j.clinbiochem.2021.03.018.Search in Google Scholar PubMed
8. Yis, OM, Bugdayci, G, Pehlivan, MB, Yildiz, RN, Alisik, M. Analytical performance evaluation of Sysmex CS-2500 and Stago STA compact. Blood Coagul Fibrinolysis 2020;31:324–9. https://doi.org/10.1097/mbc.0000000000000920.Search in Google Scholar
9. Pacific, SA. CS-2400/CS-2500 2022. Available from: https://www.sysmex-ap.com/product/cs-2400-cs-2500/ [cited Apr 2024].Search in Google Scholar
10. Froom, P, Saffuri-Elias, E, Barak, M. Autovalidation rates in an outpatient coagulation laboratory. Int J Lab Hematol 2015;37:680–5. https://doi.org/10.1111/ijlh.12386.Search in Google Scholar PubMed
11. Mlinaric, A, Milos, M, Coen Herak, D, Fucek, M, Rimac, V, Zadro, R, et al.. Autovalidation and automation of the postanalytical phase of routine hematology and coagulation analyses in a university hospital laboratory. Clin Chem Lab Med 2018;56:454–62. https://doi.org/10.1515/cclm-2017-0402.Search in Google Scholar PubMed
12. Onelöv, L, Gustafsson, E, Grönlund, E, Andersson, H, Hellberg, G, Järnberg, I, et al.. Autoverification of routine coagulation assays in a multi-center laboratory. Scand J Clin Lab Invest 2016;76:500–2. https://doi.org/10.1080/00365513.2016.1200135.Search in Google Scholar PubMed
13. Roland, K, Yakimec, J, Markin, T, Chan, G, Hudoba, M. Customized middleware experience in a tertiary care hospital hematology laboratory. J Pathol Inf 2022;13:100143. https://doi.org/10.1016/j.jpi.2022.100143.Search in Google Scholar PubMed PubMed Central
14. Wang, Z, Peng, C, Kang, H, Fan, X, Mu, R, Zhou, L, et al.. Design and evaluation of a LIS-based autoverification system for coagulation assays in a core clinical laboratory. BMC Med Inf Decis Making 2019;19:123. https://doi.org/10.1186/s12911-019-0848-2.Search in Google Scholar PubMed PubMed Central
15. Zhao, Y, Yang, L, Zheng, G, Cai, Y. Building and evaluating the autoverification of coagulation items in the laboratory information system. Clin Lab 2014;60:143–50. https://doi.org/10.7754/clin.lab.2013.130109.Search in Google Scholar PubMed
16. CLSI. Autoverification of clinical laboratory test results; approved guideline. CLSI document AUTO10-A. Wayne, PA: Clinical and Laboratory Standards Institute; 2006.Search in Google Scholar
17. CLSI. Autoverification of medical laboratory results for specific disciplines. CLSI guideline AUTO15, 1st ed. Wayne, PA: Clinical and Laboratory Standards Institute; 2019.Search in Google Scholar
18. Westgard, J. Consolidated comparison of hematology and coagulation performance specifications 2024. Available from: https://www.westgard.com/clia-a-quality/quality-requirements/802-hematology-goals.html [cited 2024 Apr].Search in Google Scholar
19. Miao, L, Li, C, Dai, J, Wang, R, Zhang, J, Ye, H, et al.. A multicenter study for establishment and evaluation of auto-verification rules for routine coagulation tests. Inform Med Unlocked 2022;32:101019. https://doi.org/10.1016/j.imu.2022.101019.Search in Google Scholar
20. Mohammed, S, Ule Priebbenow, V, Pasalic, L, Favaloro, EJ. Development and implementation of an expert rule set for automated reflex testing and validation of routine coagulation tests in a large pathology network. Int J Lab Hematol 2019;41:642–9. https://doi.org/10.1111/ijlh.13078.Search in Google Scholar PubMed
21. Hoppensteadt, DA, Molnar, JA. Hemostasis and coagulation instrumentation. In: Rodak’s hematology : clinical principles and applications [Internet], 6th ed. St. Louis, Missouri: Elsevier Health Sciences; 2019:800 p.Search in Google Scholar
22. Fraser, CG. Reference change values. Clin Chem Lab Med 2012;50:807–12. https://doi.org/10.1515/cclm.2011.733.Search in Google Scholar
23. Falay, M, Senes, M, Korkmaz, S, Turhan, T, Okay, M, Öztürk, BA, et al.. Biological variation estimates of prothrombin time, activated partial thromboplastin time, and fibrinogen in 28 healthy individuals. Int J Lab Hematol 2018;40:721–5. https://doi.org/10.1111/ijlh.12910.Search in Google Scholar PubMed
24. Novelli, C, Vidali, M, Brando, B, Morelli, B, Andreani, G, Arini, M, et al.. A collaborative study by the Working Group on Hemostasis and Thrombosis of the Italian Society of Clinical Biochemistry and Clinical Molecular Biology (SIBioC) on the interference of haemolysis on five routine blood coagulation tests by evaluation of 269 paired haemolysed/non-haemolysed samples. Biochem Med 2018;28:030711. https://doi.org/10.11613/bm.2018.030711.Search in Google Scholar
25. Zengi, O, Uçar, KT. Within- and between-subject biological variation of hemostasis parameters in a study of 26 healthy individuals. Türk Biyokim Derg 2023;48:499–506. https://doi.org/10.1515/tjb-2023-0155.Search in Google Scholar
26. Chen, Q, Shou, W, Wu, W, Guo, Y, Zhang, Y, Huang, C, et al.. Biological and analytical variations of 16 parameters related to coagulation screening tests and the activity of coagulation factors. Semin Thromb Hemost 2015;41:336–41. https://doi.org/10.1055/s-0034-1543994.Search in Google Scholar PubMed
27. Randell, EW, Yenice, S, Khine Wamono, AA, Orth, M. Autoverification of test results in the core clinical laboratory. Clin Biochem 2019;73:11–25. https://doi.org/10.1016/j.clinbiochem.2019.08.002.Search in Google Scholar PubMed
Supplementary Material
This article contains supplementary material (https://doi.org/10.1515/dx-2025-0004).
© 2025 the author(s), published by De Gruyter, Berlin/Boston
This work is licensed under the Creative Commons Attribution 4.0 International License.
Articles in the same Issue
- Frontmatter
- Reviews
- Accuracy of pulse wave velocity for screening coronary artery disease: a systematic review and meta-analysis
- Prenatal screening for genetic disorders: updated guidelines, proposed counseling, a holistic approach for primary health care providers in developing countries
- A scoping review of fever of unknown origin with normal serum C-reactive protein
- Mini Review
- Overview of dengue diagnostic limitations and potential strategies for improvement
- Opinion Papers
- Demystifying cognitive bias in the diagnostic process for frontline clinicians and educators; new words for old ideas
- Physicians’ prism: illuminating history with structured expertise
- Original Articles
- Implementation of a curriculum on communicating diagnostic uncertainty for clerkship-level medical students: a pseudorandomized and controlled study
- A synthesized differential diagnosis is associated with fewer diagnostic errors compared to an inventorial list
- Equity-Driven Diagnostic Excellence framework: An upstream approach to minimize risk of diagnostic inequity
- Two decades of autopsy-detected diagnostic errors in Japan
- Does management reasoning display context specificity? An exploration of sleep loss and other distracting situational (contextual) factors in clinical reasoning
- Cognitive biases in osteopathic diagnosis: a mixed study among French osteopaths
- Racial and ethnic disparities in pediatric emergency department patients with missed opportunities for diagnostic excellence
- Diagnostic accuracy of non-mydriatic fundus photography as a triage and telemedicine tool for patients with vision loss
- “Innumerable” lesion burden on brain MRI ‒ a diagnostic approach
- Factors associated with positive findings of deep infection on computed tomography among patients with extremity cellulitis
- Exploring emergency department providers’ uncertainty in neurological clinical reasoning
- Analytical performance and user-friendliness of four point-of-care measuring systems for monitoring prothrombin time international normalized ratio in the hands of the intended users
- Fetal hematological phenotypes of various hemoglobinopathies and demonstration of embryonic hemoglobins on capillary electrophoresis: a large cohort data from prenatal screening program
- Development and assessment of autoverification system for routine coagulation assays in inpatient and outpatient settings of tertiary care hospital: algorithm performance and impact on laboratory efficiency
- Validation of new, circulating biomarkers for gliomas
- Short Communications
- Using language to evaluate curricular impact: a novel approach in assessing clinical reasoning curricula
- Comparative evaluation of routine coagulation testing on Stago sthemO 301 and Werfen ACL TOP 750
- Letters to the Editor
- Reversible systemic vasoconstriction syndrome: a new diagnostic family of generalized vasospasm in multiple organs
- The value of designating symptoms as “vague” in diagnosis
- Immunoglobulin E in an inverted skin-prick test for rapid detection of cutaneous antigens