Influence of corrosion inhibitors on aging mechanism of epoxy resin coatings for copper 62 alloy in simulated marine environment
-
Jingkang Chen


Abstract
Aiming at the shortcoming that when applied to nonferrous copper 62 surfaces, epoxy coatings are prone to aging in marine environments. In order to extend the service life of copper 62 coatings in marine environments, methods of screening the corrosion inhibitor commonly used in copper 62 alloys and adding it to epoxy organic coatings have been investigated. Tafel polarization test and electrochemical impedance spectroscopy (EIS) were used to study the corrosion inhibition effect of different corrosion inhibitors on copper 62 alloy in simulated marine environment, and the influence of MBI on the damage process and water transport of epoxy coatings was studied by EIS. The results show that 2 mercaptobenzothiazole (MBT) has good corrosion inhibition on copper 62 alloy in marine environment. When the total mass fraction is 0.5 wt%, the corrosion suppression can reach 96.4 %. When MBT is added to the epoxy organic coating at 0.5 wt%, the diffusion coefficient of the coating is as low as 8.35 × 10⁻¹¹ cm2 s−1, and the failure time of the coating is extended to 1824 h. It has been shown that the addition of MBT can effectively improve the service life of copper 62 alloy/epoxy coatings in marine environments.
1 Introduction
The nonferrous metal alloy copper 62 is widely utilized in marine environment, such as offshore oil drilling platforms, marine energy devices, and marine development projects due to its exceptional mechanical properties and manufacturability (Karpov et al. 2021; Zhu et al. 2017). However, the harsh conditions of wind erosion, sun exposure, and marine organisms coupled with high salt content in seawater containing SO4 2−, Cl−, Mg2+, etc., severely corrode copper 62 in a marine environment (Altoe et al. 1996; Ashassi-Sorkhabi and Nabavi-Amri. 2002; Roberge and Sastri.1993; Roque et al. 2007). Currently available methods for corrosion protection of copper 62 include surface coating protection (Chen et al. 2022; Lu et al. 2023; Raj 2022), cathode and anode protection (De La Fuente et al. 2022), use of corrosion inhibitors (Akpoborie et al. 2022), among which corrosion inhibitor and coating protection are the most economical and effective. In the early days of the use of nonferrous metals, corrosion suppression for copper alloys was achieved primarily through the use of vegetable oils, and the application of corrosion inhibitors was relatively straightforward. However, with technological advances, a wide range of compounds have been developed and utilized as effective corrosion inhibitors. These can be broadly classified into organic and inorganic types. Organic corrosion inhibitors are more commonly used due to their superior performance and lower cost compared to their inorganic counterparts. Among these, benzotriazole (BTA) and its derivatives such as 2-mercaptobenzimidazole (MBI), 2-mercaptobenzothiazole (MBT), and 2-amino-5-mercapto-1.3.3.1-thiadiazole (ATM) have found widespread applications in inhibiting copper alloy corrosion (Zhao. 2021; Zhang and Hua 2011; Zhang et al. 2022; Zhou 2004). In recent years, the growing environmental awareness of international organizations has led experts and scholars to propose new requirements for corrosion inhibitors that are economical, versatile, efficient, and robust in their corrosion suppression. It is crucial to minimize any potential environmental damage caused by these inhibitors during their development and use; therefore, exploring new green corrosion inhibitors has become a leading area of research (Kohl et al. 2022; Lu and Jiang 2007). Among them, 2-mercaptobenzothiazole (MBT) stands out as an environmentally friendly organic inhibitor with excellent corrosion inhibition properties across a wide pH range. MBT has long been a popular choice for copper 62 alloy corrosion inhibitors. For instance, He et al. (2013) discussed the synergistic effect of MBT and 8-hydroxyquinoline (HQ) on copper in NaCl solution, while Liu et al. (2023) constructed host–guest assemblies using both MBT and ABT, respectively. XPS analysis confirmed the superior inhibitory effect of MBT-based cathode dominated corrosion suppression.
Epoxy resin coatings are capable of protecting metals in a variety of environments due to their excellent water resistance, strong resistance to salt spray corrosion, and UV radiation. The inclusion of different corrosion inhibitors has been extensively studied to improve its protective properties. Wang et al. (2022) added starch to epoxy resin for increased toughness, while Elsafi et al. (2023) incorporated bentonite and WO3 nanoparticles as a corrosion inhibitor that effectively enhanced the photoshielding ability of epoxy resin. Guo et al. (2021) doped h-BN into epoxy resin, which hindered the movement of EP molecular segments without affecting its own performance, thus improving the service life of epoxy resin. While modification studies of magnesium and iron have been developed by adding corrosion inhibitors to improve their service life and flame retardance, there is still a gap in modifying epoxy resins on alloys such as copper 62. Thus, this experiment aims to identify highly efficient corrosion inhibitors and incorporate them into an epoxy coating applied to copper 62 in a simulated marine environment for failure analysis.
2 Materials and methods
2.1 Sample
The experimental substrate is copper 62 alloy (Cu:62 %, Fe:0.15 %, Pb:0.08 %, Sb: 0.005 %, Bi: 0.002 %, Zn: others), and simulated seawater (Ju et al. 2020) (NaCl: 24.53 g/L,Na2SO4:4.09 g/L,MgCl2:5.20 g/L,CaCl2:1.160 g/L,SrCl2:0.025 g/L, H3BO3:0.022 g/L, KCl: 0.695 g/L, NaHCO3:0.201 g/L, NaF: 0.003 g/L, KBr: 0.101 g/L, pH = 8.2) as the experimental corrosion medium, 0.1 mol/L NaOH was used to adjust the pH.
A copper 62 cylinder with a diameter of 18 mm was covered with PVC pipe, molded into an electrode with the prepared epoxy resin (Figure 1), and the bottom surface was retained as the working electrode after curing.
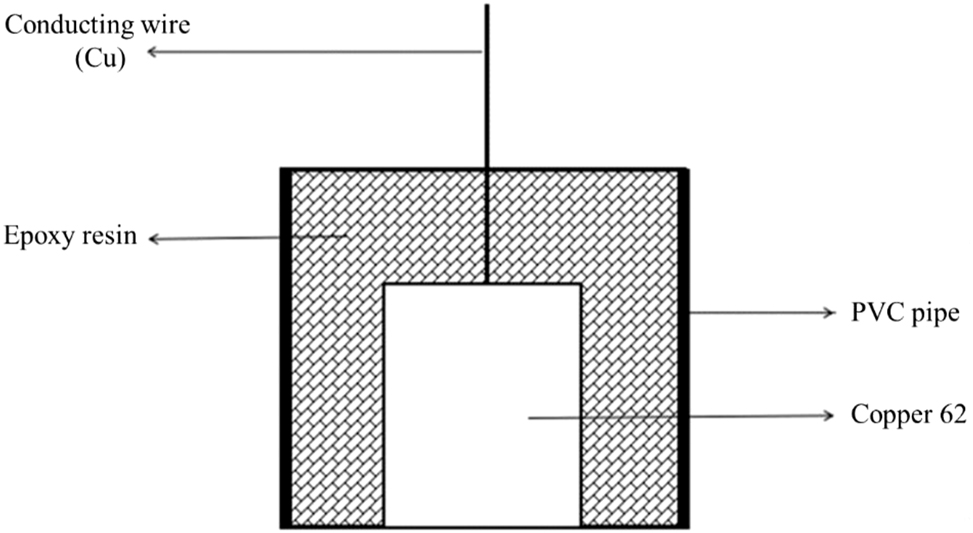
Working electrode package schematic.
It was put into a simulated seawater solution doped with different corrosion inhibitors (sodium tungstate, sodium molybdate, sodium nitrite, sodium tripoly-phosphate, zinc sulfate, benzimidazole, 2-mercaptobenzothiazole, and sodium dichromate), and electrochemical tests were carried out in a water bath at 40 °C. A corrosion inhibitor with excellent corrosion protection properties was selected and added to the K1-1 epoxy coating at a ratio of 0.5 wt%. After uniform stirring at room temperature, the working surfaces of the copper 62 electrodes were coated with epoxy with or without a corrosion inhibitor by RDS wire coaters (shown in Figure 2). Following room temperature curing, immersion corrosion tests were conducted in simulated seawater at 40 °C. The aging process of the coatings under these conditions was investigated by measuring the electrochemical properties of the coatings with different immersion times.
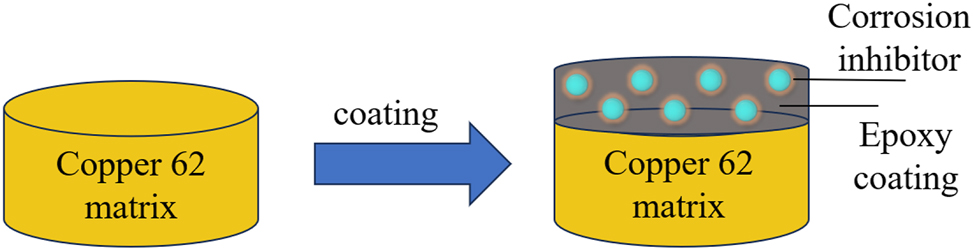
Schematic diagram of epoxy coating with corrosion inhibitor on the surface of the copper 62 electrode.
2.2 Characterization
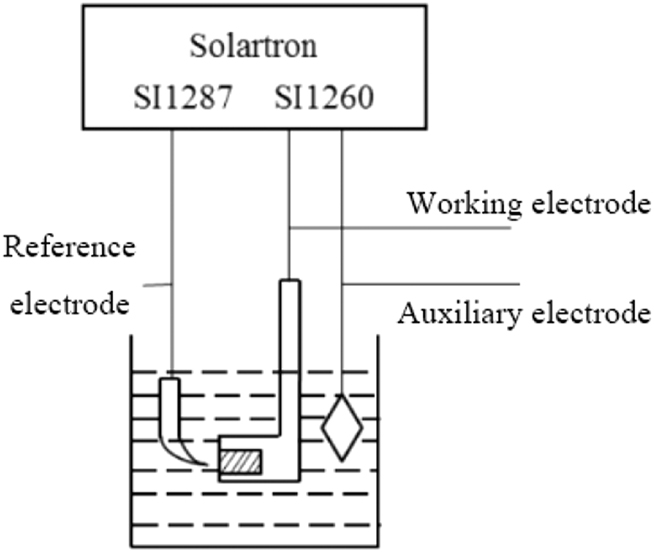
The electrochemical test was performed using the Solartron 1,287 + 1,260 electrochemical workstation at 40 °C, and the connection device is shown in Figure 3. The test system consists of three electrodes: saturated calomel electrode as the reference electrode and graphite electrode as the auxiliary electrode. The polarization curve was scanned within −0.3∼+0.3 V (vs. OCP) range at a scanning rate of 0.3 mV s−1 to determine corrosion inhibition efficiency η according to formula (1):
Where I corr 0 is the corrosion current density in simulated seawater without inhibitor and I corr is with inhibitor added. AC impedance testing was performed using a 5 mV sine-wave excitation signal with an amplitude ranging from 105 to 10−2 Hz. Before each measurement, the metal electrodes were immersed for 2,000 s until the potential was stabilized. The failure process of the epoxy coating was monitored using the EIS technique, while the moisture transport law and diffusion coefficient of the copper alloy moisture in the coating were analyzed using the capacitive method. Each set of electrochemical tests was tested three times.
Electrochemical test device.
3 Results and discussion
3.1 Screening of corrosion inhibitors
Figure 4a illustrates the polarization curves of copper 62 alloy in simulated seawater with various corrosion inhibitors, while Table 1 presented the corresponding data. There is a limiting diffusion current density in the cathodic process of the polarization curve in the absence of the corrosion inhibitor, which is controlled by oxygen diffusion (Dalhatu et al. 2023), indicating that the corrosion of copper 62 alloy in simulated seawater is characterized mainly by oxygen consuming corrosion. And the anode exhibits a copper corrosion process: this process takes place on the surface of the copper 62, and its main reaction is the oxidation of copper to copper ions. The corrosion potential of the polarization curve of copper 62 alloy in seawater was −292 mV, and the current density was 1.38 × 10⁻⁵ A cm−2. Upon adding corrosion inhibitors to the solution, the corrosion current density decreased, indicating that these additives have a protective effect. However, inorganic corrosion inhibitors dominated by sodium tungstate do not provide an ideal level of protection, as their inhibition efficiency ranges from 60 % to 80 %, generally lower than their organic counterparts, which exceed 90 %. The reason is that inorganic corrosion inhibitors such as sodium and zinc salts are mostly precipitate-type corrosion inhibitors, where the corrosion suppression mechanism is mostly to precipitate on the metal surface to form a protective film against additional corrosion. However, due to the presence of Cl− in the environment, the surface of the protective film is broken, which weakens the protective properties of the film. Its strong chemical activity can destroy the protective layer made up of most inorganic corrosion inhibitors, making them less effective at preventing corrosion. Benzimidazole and 2-mercaptobenzothiazole are adsorption corrosion inhibitors containing a five-membered heterocyclic (imidazole ring) and a benzene ring with multiple atoms providing lone pairs of electrons. Cu+ and Cu2+ on the surface of copper 62 can form complexes that can be adsorbed onto its surface for better corrosion inhibition. In simulated marine environments, 2-mercaptobenzothiazole exhibits superior performance due to its higher number of S-atoms compared to benzodiazepines, resulting in more stable bonds when complexed with Cu+ and Cu2+. In addition, due to the tendency of seawater pH toward neutrality, the excellent corrosion inhibition properties of benzodiazepines in strongly alkaline conditions are suppressed, while the effectiveness of 2-mercaptobenzodiazepines in acidic or neutral conditions is fully exploited. Therefore, adding 2-mercaptobenzothiazole results in the smallest corrosion current density (5.00 × 10⁻⁷ A cm−2) for copper 62 alloy in marine environments with a corresponding efficiency reaching up to 96.4 %.
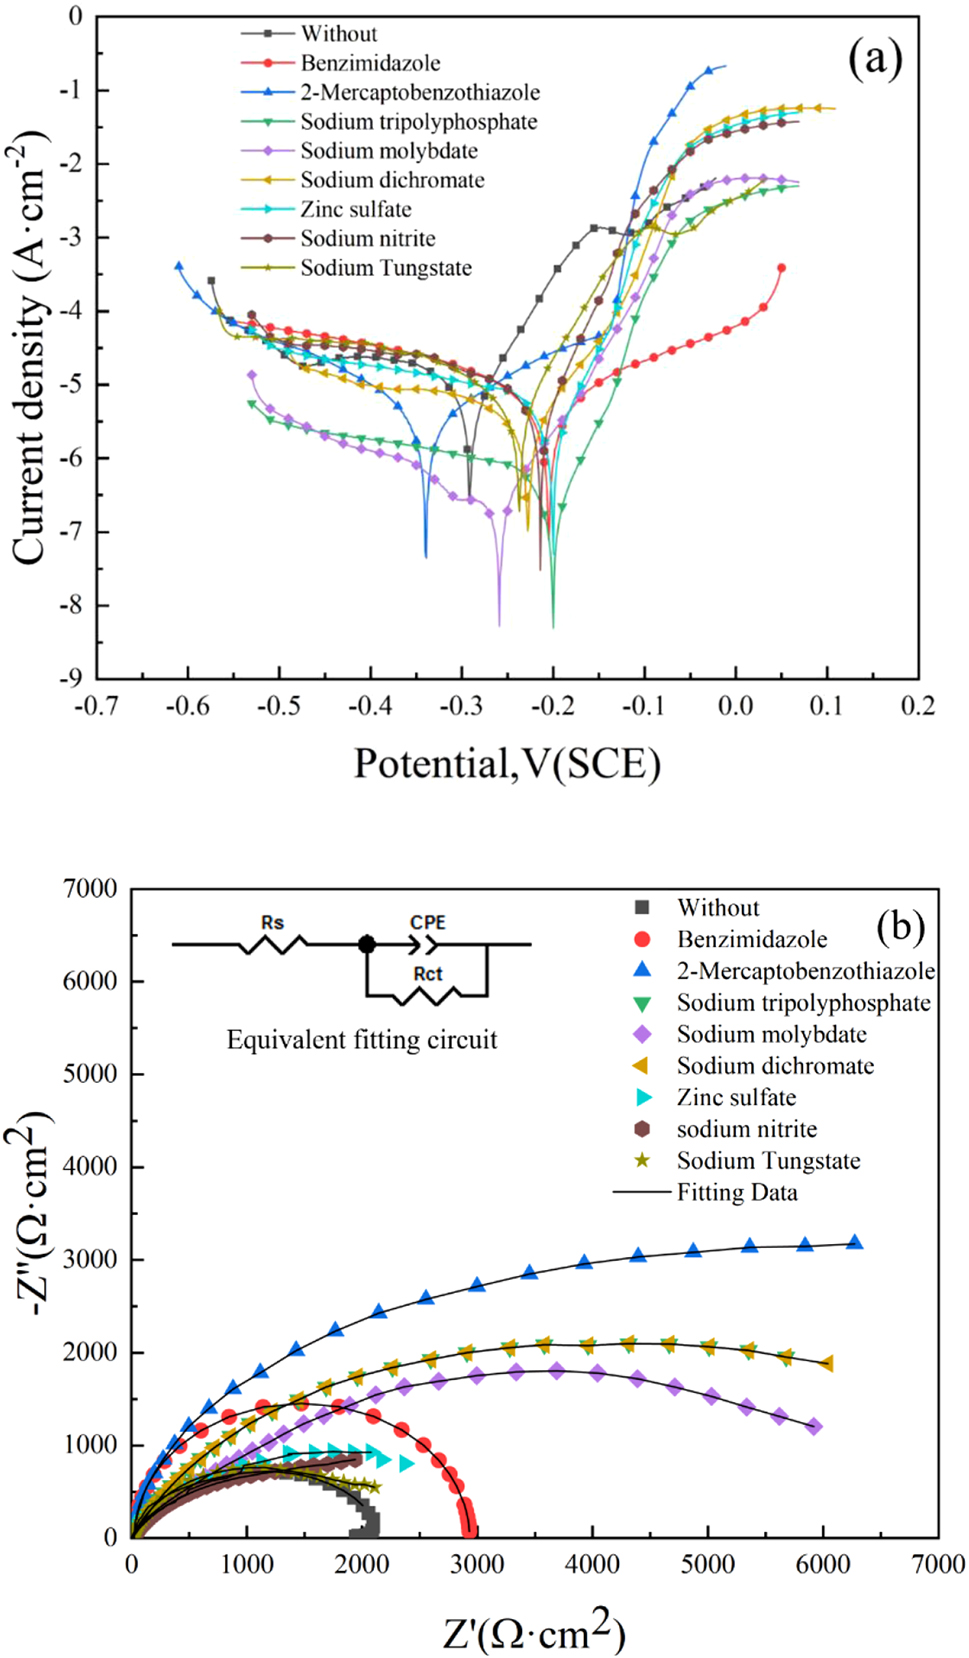
Electrochemical test results (Nyquist plot) for the different corrosion inhibitors in a simulated marine environment: (a) polarization curves and (b) AC impedance curves.
Electrochemical parameters of copper 62 alloy with different corrosion inhibitors.
| Corrosion inhibitor | E corr (mV versus SCE) | I corr (A cm−2) | Ƞ (%) | ση (%) | R ct (Ω·cm2) | CPE (10−5 Ω−1 cm−2 s-n) |
|---|---|---|---|---|---|---|
| Without | −292 | 1.38 × 10⁻⁵ | – | – | 2079 | 4.46 |
| Sodium tungstate | −238 | 5.65 × 10⁻⁶ | 59.1 | 0.49 | 2,224 | 8.18 |
| Sodium nitrite | −215 | 4.25 × 10⁻⁶ | 69.3 | 0.45 | 2,645 | 5.35 |
| Zinc sulfate | −200 | 3.12 × 10⁻⁶ | 77.4 | 0.48 | 3,545 | 11.09 |
| Sodium dichromate | −229 | 3.09 × 10⁻⁶ | 77.6 | 0.32 | 4,835 | 6.16 |
| Sodium molybdate | −259 | 2.72 × 10⁻⁶ | 80.0 | 0.28 | 5,913 | 8.69 |
| Sodium tripolyphosphate | −201 | 2.32 × 10⁻⁶ | 83.2 | 0.34 | 7,101 | 9.49 |
| Benzimidazole | −125 | 1.75 × 10⁻⁶ | 88.3 | 0.19 | 9,620 | 7.52 |
| 2-Mercaptobenzothiazole | −206 | 5.00 × 10⁻⁷ | 96.4 | 0.16 | 13,349 | 2.57 |
Figure 4b displays the electrochemical impedance spectroscopy (EIS) of copper 62 alloy treated with various corrosion inhibitors. The Nyquist plot exhibits a single capacitive arc and the corresponding fitted circuit is shown in Figure 3b top right corner. In this circuit, Rs represents solution resistance, CPE denotes constant phase angle element (instead of pure capacitor element), and R ct signifies charge transfer resistance (Pi et al. 2023). According to the fitting data in the table, compared with the sample without adding corrosion inhibitor, addition of corrosion inhibitors resulted in an increase in charge transfer resistance (R ct), indicating that these compounds effectively reduce the corrosion rate of copper 62 alloy. Consistent with polarization curve results, 2-mercaptobenzothiazole exhibited superior performance as a corrosion inhibitor with a R ct value of 1.335 × 10⁴ Ω cm2.
3.2 Characterization of epoxy resin coating
Figure 5 illustrates the Nyquist pattern of epoxy coating on copper alloy 62 in a seawater environment at 40 °C. At the onset of the experiment (Figure 5a), the Nyquist plot displayed a high-impedance single-capacitor arc, which was fitted to yield the (a) plot as shown in Figure 6. The coating capacitor (C c ) was connected in parallel with the coating resistance (R c ) in the equivalent circuit. Coated capacitors are represented as normal phase angle elements CPE to eliminate nonideal capacitive effects. After a half-hour experiment, the coating resistance R c measured at 3.781 × 10⁸ Ω cm2. When low-frequency impedance reaches between 108 and 5 × 10¹⁰ Ω cm2, it indicated that the coating is intact (Bentiss et al. 2005). At the early stage of immersion, epoxy coatings effectively isolate direct contact between oxygen, water, and other corrosive media and the substrate, while acting as an insulator with great resistance to protect the copper alloy from corrosion. By experimental time reaching up to 216 h as shown in Figure 5c, changes occur where coating resistance R c measures at only 6.128 × 10⁷ Ω cm2 due to prolonged exposure of corrosive media such as water and oxygen molecules along with chloride ions penetrated into micropores on surface or structural voids within coatings. As the immersion time increases, the Nyquist plot still exhibits a single capacitive arc until reaching 1,008 h of immersion; however, the radius of this arc continued to decrease, indicating that coating resistance gradually decreased with prolonged immersion time (as depicted in Figure 5b–d). Despite this trend, the coating maintained its protective properties and no corrosion was observed on the metal substrate. At 1,008 h of immersion, R c measured at 2.671 × 10⁶ Ω cm2. This phase corresponds to water percolation within the coating.
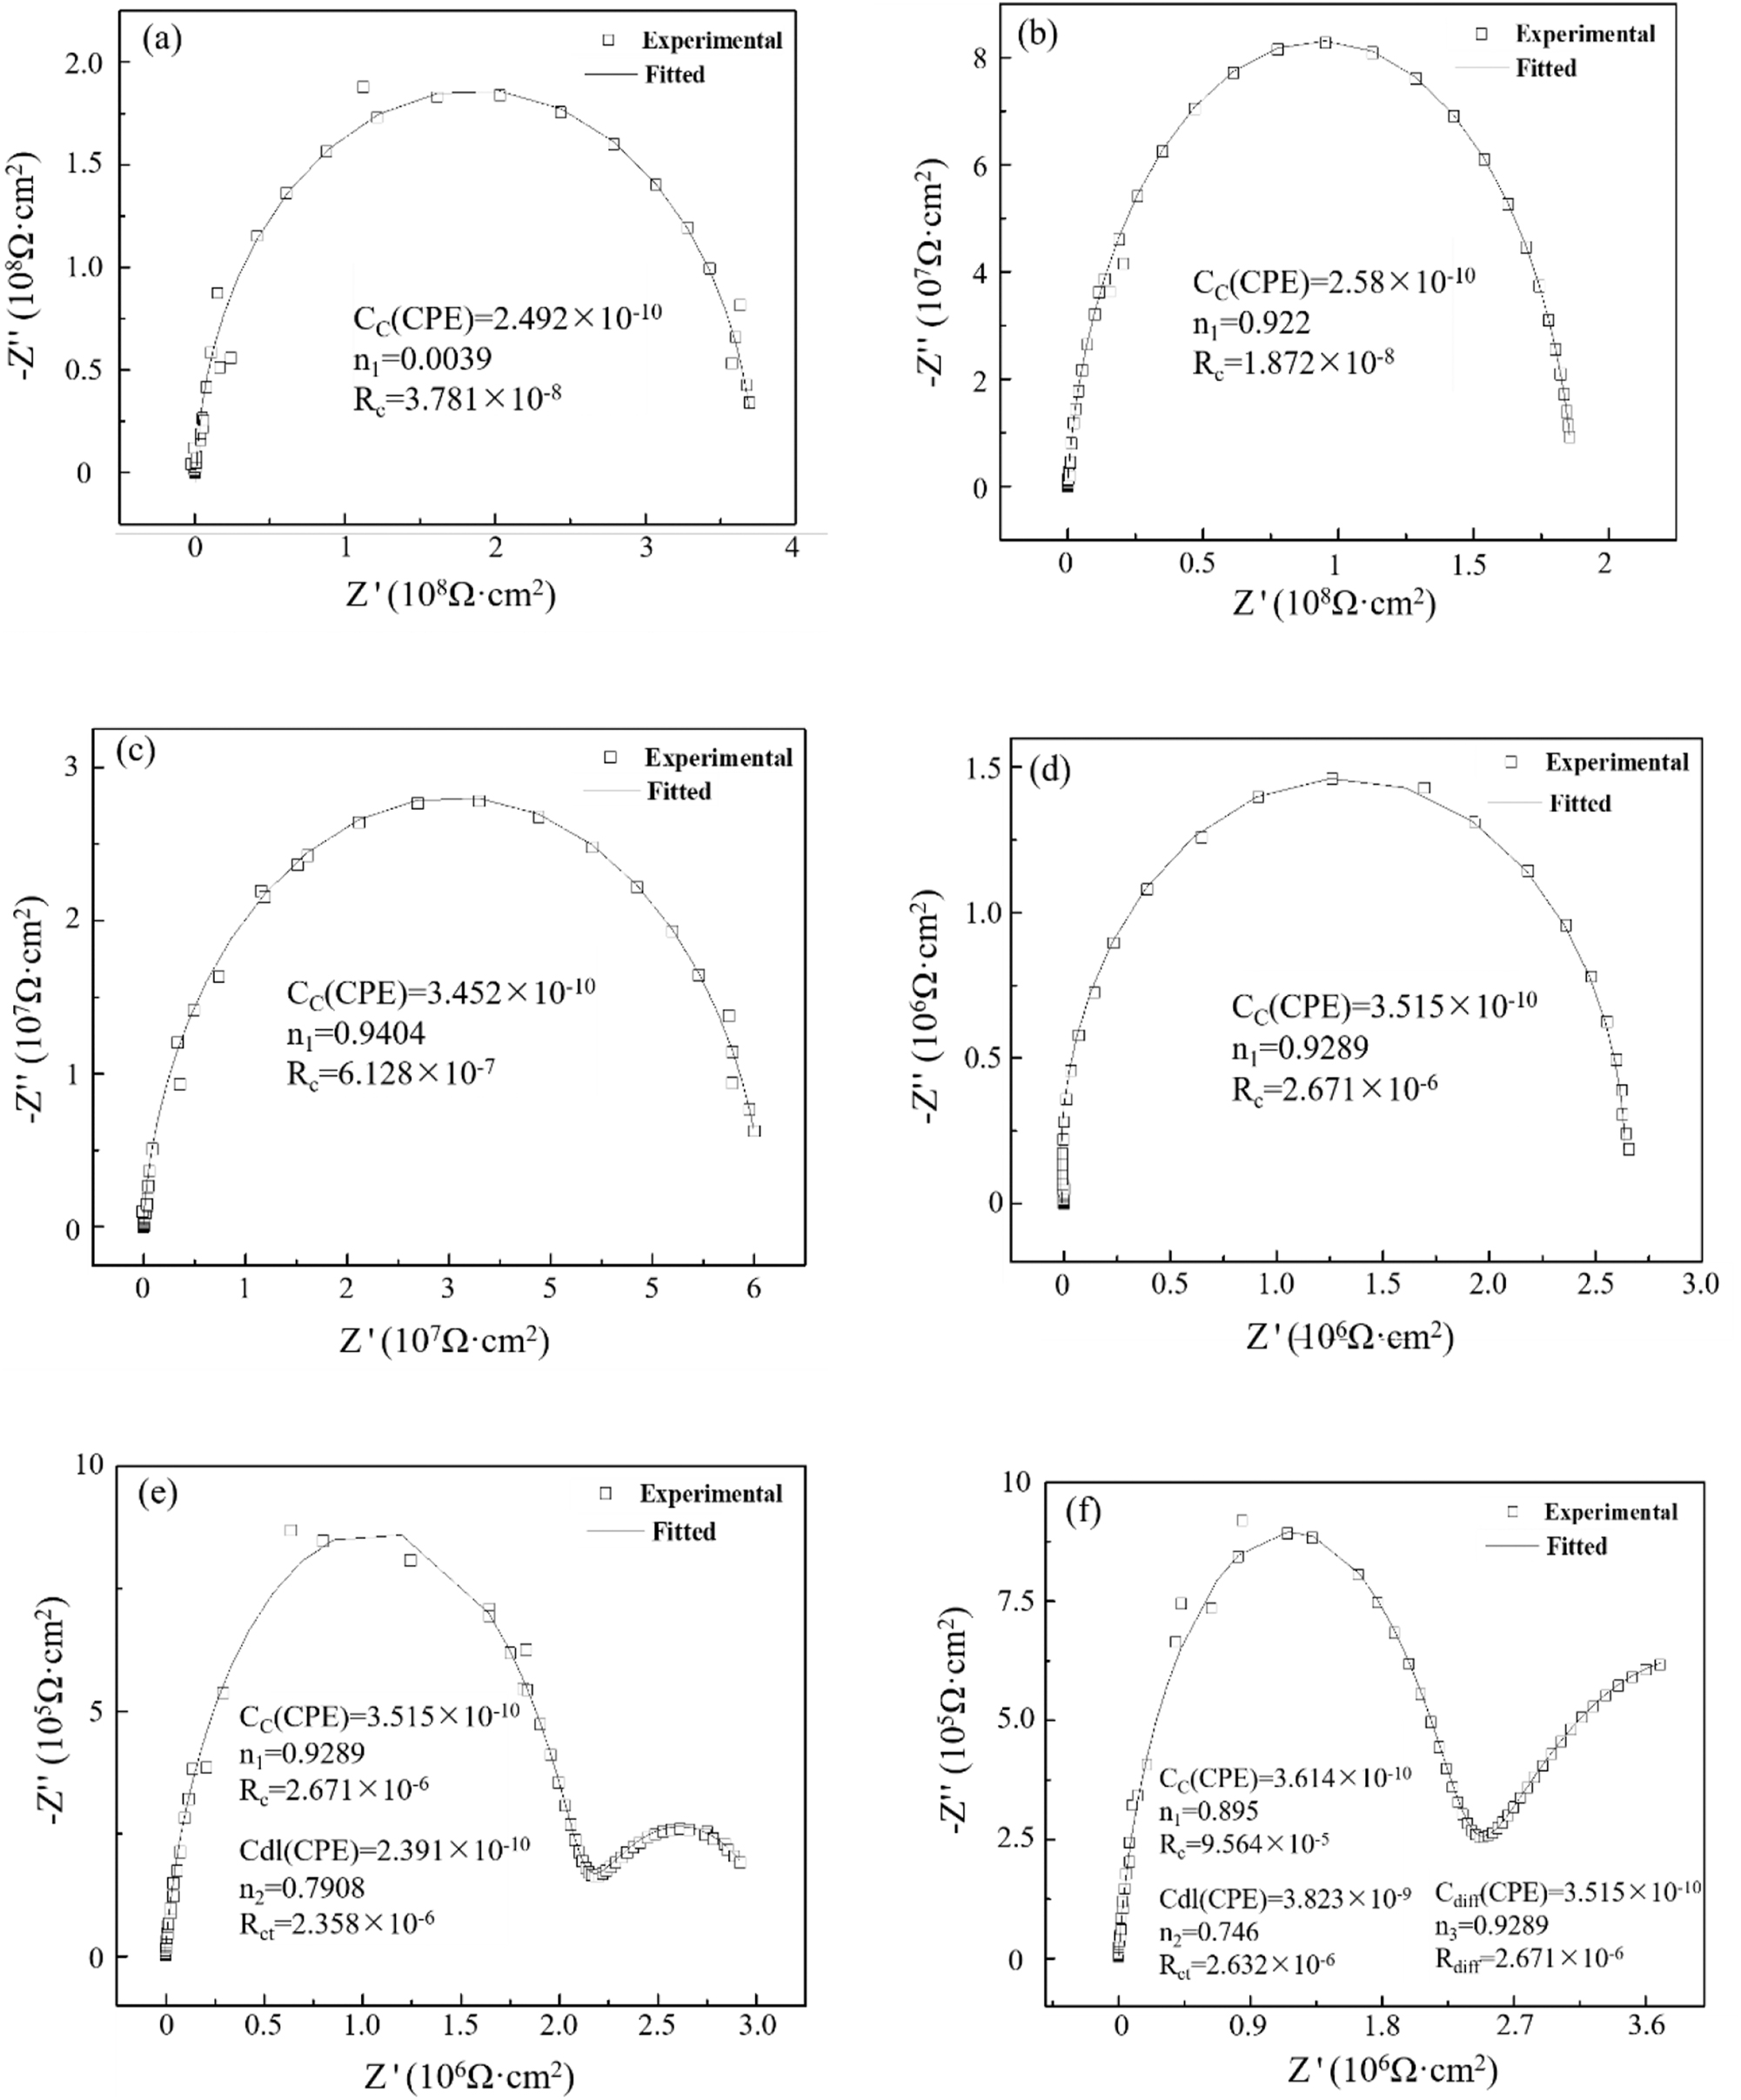
Nyquist spectrum and fitting data of epoxy coating/copper 62 alloy system in seawater at different experimental times. Scattered points: experimental values; (a) 30 min, (b) 24 h, (c) 216 h, (d) 1,008 h, (e) 1,056 h, and (f) 1,128 h (solid lines: fitted values).
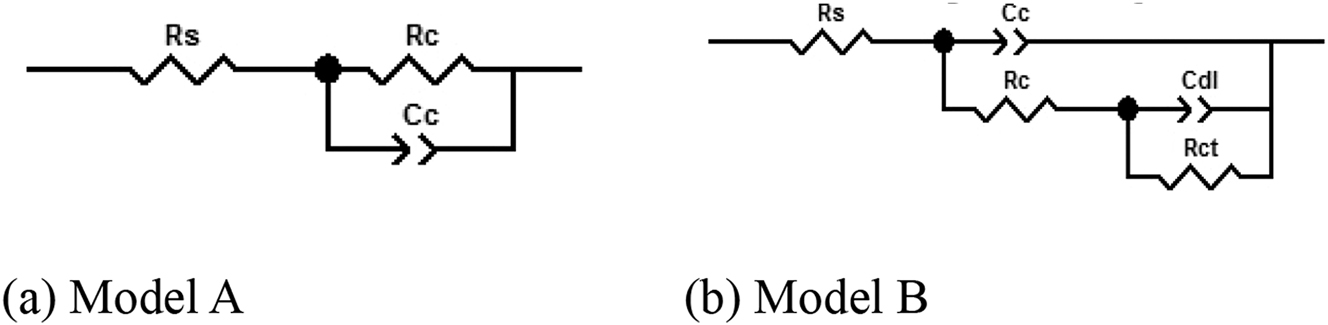
Equivalent circuits for fitting different Nyquist spectra. (a) Model A and (b) model B. R s – solution resistance, C c – coating capacitance, R c – coating resistance, R ct – charge transfer resistance, C dl – electric double layer capacitance.
As the immersion experiment progressed, at 1,056 h (Figure 5e), a significant shift was observed in the Nyquist plot with the appearance of a narrow circular arc in the low-frequency region of the impedance spectrum, indicating corrosion. This shift is attributed to the slower penetration of the electrolyte into the interior of the coating, eventually reaching the copper alloy surface and initiating a corrosion reaction with the substrate surface. The generated corrosion products accumulated and aggregated in large quantities at the coating/metal interface. At this point, model A is no longer suitable for fitting impedance spectra. Instead, model B (Figure 6b) is used for fitting, where C dl and R ct represent electric double-layer capacitance and charge transfer resistance, respectively. R c remains relatively constant compared to 1,008 h, since early copper metal corrosion has minimal protection from coatings. When volume expansion of corrosion products reaching 1,128 h, slight bubbles appeared on coating surface visible to the naked eye resulting in significantly reduced capacitive impedance arc radius in high-frequency region of impedance spectrum while R c reduced to 9.564 × 10⁵ Ω cm2. Generally speaking, when coating resistance falls below 106 Ω cm2, it indicated that water or other corrosive electrolytes have reached the metal surface causing a corrosive reaction leading to complete failure phase of coating.
During the application of organic coatings, molecular chains tend to broke over time, leading to an increase in surface roughness and changes in coating porosity. The alteration of coating morphology can be inferred from the variation in its porosity (microscopic defect area), which is inversely proportional to both the coating resistance R ct and electrolyte resistivity that permeates it. Therefore, coating porosity reflects the ability of a coating to withstand electrolyte penetration and its corresponding protective capacity. A higher coating resistance indicates fewer microscopic defects and stronger protection against electrolyte penetration.
The porosity (P) can be determined from the ratio of the theoretical resistance (R pt) to the measured pore resistance (R c ) of a coating with “infinite” porosity. Usually the calculation formula of coating porosity P is:
In the formula, R c represents the coating resistance measured in Ω cm2 and analyzed by Z-view software during the experiment. R pt is the theoretical resistance of the coating, also in Ω cm2, which is typically calculated using formula (3):
In the formula, d represents the thickness of the coating in micrometers; A represents the electrode area in square centimeters; k represents the conductivity of seawater at 40 °C, which is 3 × 10⁻² s cm−1. According to formula (4), R pt is a constant value and the theoretical resistance of a coating with “infinite” porosity can be determined.
The theoretical resistance of the coating in this experiment is 2.333 × 10³ Ω cm2, and it exhibits an inverse relationship with its porosity (P). Figure 7a illustrates the trend of epoxy coatings’ porosity during failure in a seawater environment at 40 °C. The logP-t curve can be divided into two stages: stage one represents the early phase of experimentation (0–24 h), which can be described by y = −5.338 + 0.011 × (R = 95.17 %), where y reflects logP and x reflects t; during this initial stage, there is a rapid increase in coating porosity with corrosion time. Stage two spans from 24 h to 1,128 h, where the rate slows down and can be described by y = −5.092 + 0.0016 × (R = 98.67 %).
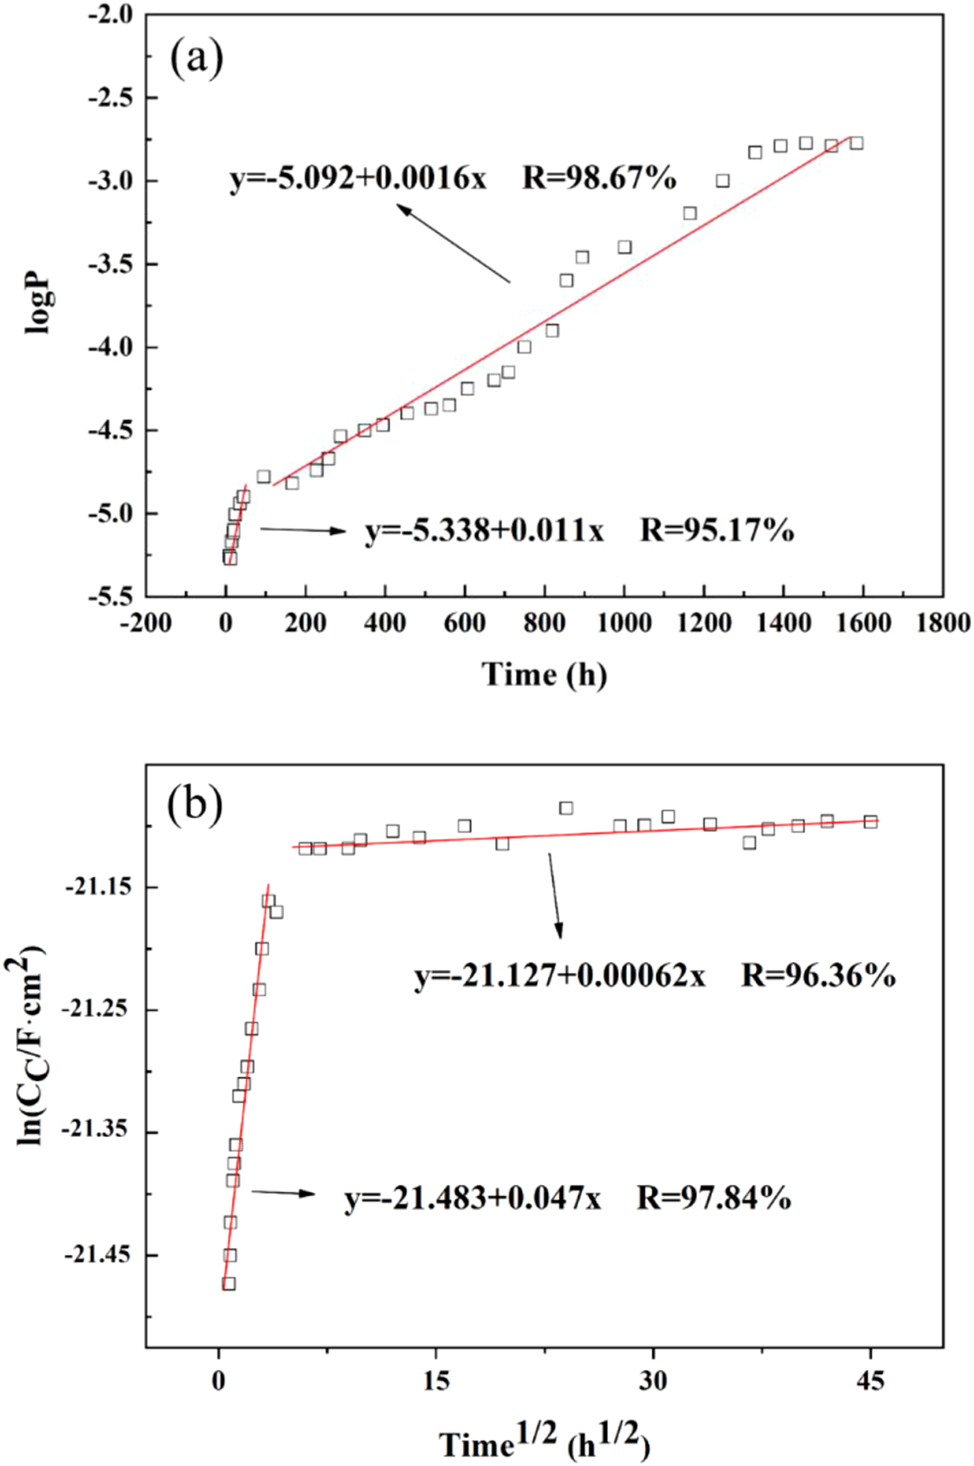
Electrochemical measurements and fitting data: (a) logP-t variation curve during failure of epoxy coating/copper 62 alloy l system. (b) lnC c -t 1/2 curve of the epoxy coating/copper 62 alloy system immersed in seawater at 40 °C. Scattered points: experimental values; solid lines: fitted values.
As the dielectric constant of water (80) is significantly higher than that of a typical organic coating’s dry film (4–5), the coating’s dielectric constant increases when it absorbs water, resulting in an increase in capacitance. Analyzing the moisture diffusion process within epoxy resin coatings can help understand their failure mechanisms, and the corresponding lnC c ∼ t 1/2 capacitance method effectively reflects changes in the coating system. Figure 7b shows the lnC c ∼ t 1/2 curve for epoxy resin coatings’ failure under seawater immersion at 40 °C. The water absorption process of this coating system in a seawater environment at 40 °C can be well described by a segmented function:
where y represents logarithmic coating capacitance, a denotes logarithmic initial capacitance, b indicates slope of increase, and x represents square root of time t.
During the initial immersion stage, the coating capacitance experiences a rapid increase and exhibits a large b value, indicating faster water penetration. The lnC c ∼ t 1/2 curve shows a linear increase, suggesting uniform moisture diffusion in accordance with Fick’s first law. In the second stage, the coating capacitance tends toward a steady state, resulting in gradual saturation of its water absorption rate.
For the Fick’s diffusion process with a constant diffusion coefficient D, the amount of water absorbed follows the relationship described by formula (6):
Subsequently, the diffusion coefficient of water will be computed:
Among them, C t and C 0 correspond to capacitance values at different time points, while the total water absorption when the coating is fully saturated with water is denoted as M ∞, which can be obtained from formula (8):
The total water absorption M of the coating can be determined using formula (9), where ρ w represents the density of water and ε w denotes the relative dielectric constant of pure water, which is valued at 80.
The relative permittivity of organic coatings (ε) is determined by Equation (10), where ε o represents the vacuum permittivity, L denotes the coating thickness, and S refers to the coating area.
The moisture diffusion coefficient D of the epoxy coating falls within the current range of water diffusion coefficients (10−8∼10−12 cm2 s−1) for coatings with good protective performance, as it measures 1.75 × 10⁻¹⁰ cm2 s−1. Formula (7) can be derived accordingly.
Among them,
The volume fraction φ at the point of water saturation in the coating is 9.42 %.
3.3 Characterization of epoxy resin coating with 2-mercaptobenzothiazole
Figure 8 shows Nyquist spectrum of epoxy resin coating with 2-mercaptophenylmethiazole/copper 62 alloy systems at each time point in a marine experiment at 40 °C. At the beginning of the experiment, it can be seen from Figure 8a that after the epoxy resin coating with 2-mercaptobenzothiazole was placed in the ocean for 0.5 h, the coating resistance was 2.982 × 10⁸ Ω cm2, which was consistent with the epoxy resin coating law at the beginning. As the experiment continued to extend to 1,632 h, all the Nyquist plot showed a high-impedance single-capacitor arc and the coating resistance had dropped to 2.039 × 10⁶ Ω cm2. When the experiment lasted for 1,728 h, the coating system reflected two capacitive reactance arcs, and the coating resistance was 8.938 × 10⁵ Ω cm2. By 1,824 h, the coating resistance has dropped to 5.086 × 10⁵ Ω cm2, and at this time, bubbles appear on the coating surface and the coating has failed.
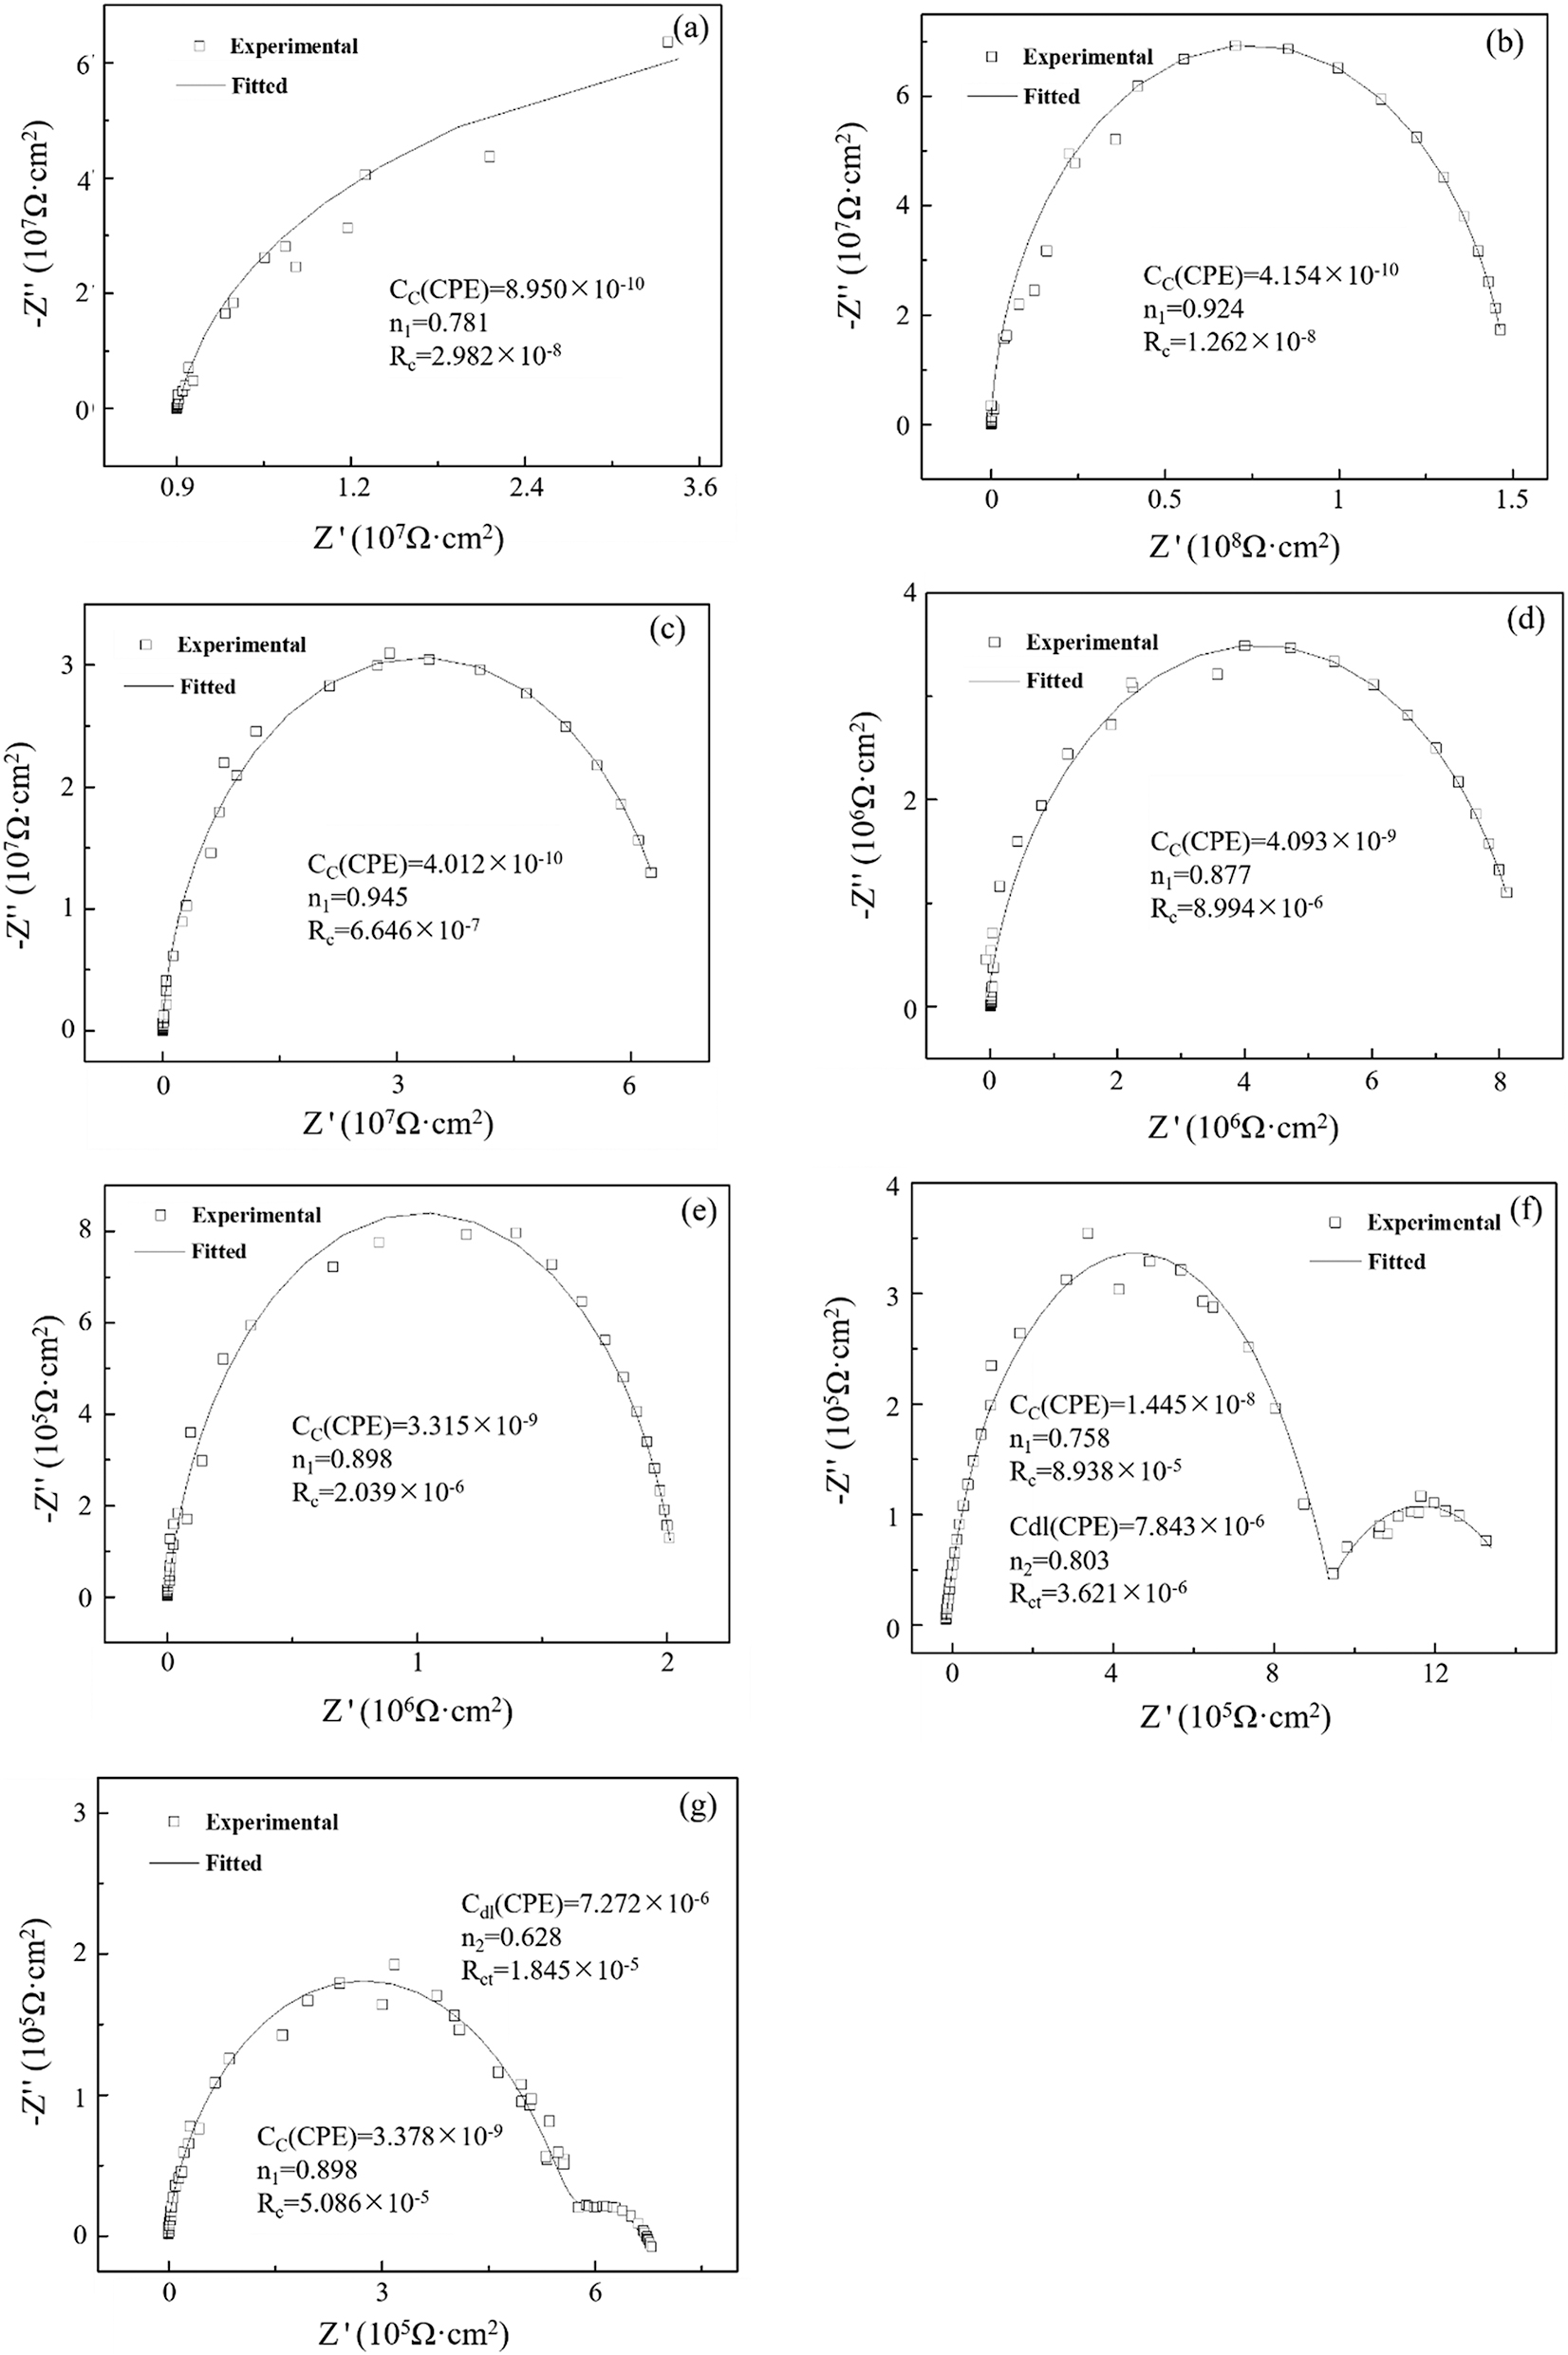
Nyquist spectrum and fitting data of epoxy resin coating with 2-mercaptophenylmethiazole/copper 62 alloy system. (a) 30 min, (b) 24 h, (c) 336 h, (d) 552 h, (e) 1,632 h, (f) 1,728 h, and (f) 1,824 h. Scattered points: experimental values; solid lines: fitted values.
This condition is caused by the following reason: The effect of blocking copper corrosion is mainly due to the strong chemical adsorption of 2-mercaptobenzothiazole. As a heterocyclic compound, 2-mercaptobenzothiazole contains N and S atoms containing lone pairs of electrons in the molecule, and Figure 9a is its molecular structure, which can form coordination bonds with copper matrix and adsorb on its surface. It can be seen from the principle of soft and tough acid base that as a soft base heterocyclic compound containing S, N elements, 2-mercaptobenzothiazole has strong surface adsorption capacity, and it is easy to combine with Cu0 and Cu+ (in the form of Cu2O) in the copper matrix to form stable coordination bonds through the lone electron pair on S, N atoms, so that it can be firmly adsorbed at the copper 62 alloy/coating interface, and the adsorption is rapid and easy to establish equilibrium. The chemisorption layer formed is an excellent barrier to copper corrosion (Kuang et al. 1995). At the same time, in this configuration, each Cu+ ion is coordinated with the N and extra-ring S of two 2-mercaptobenzothiazole molecules, and the N and S in each molecule are coordinated with two Cu+, respectively, at this time, the molar ratio of Cu to 2-mercaptobenzothiazole is 1:1, and the membrane structure model formed (Huo et al. 2013) is shown in Figure 9b. This protective film also effectively blocks the penetration of corrosive media such as water into the copper 62 matrix for a certain period of time, thus protecting the copper 62 alloy from corrosion.
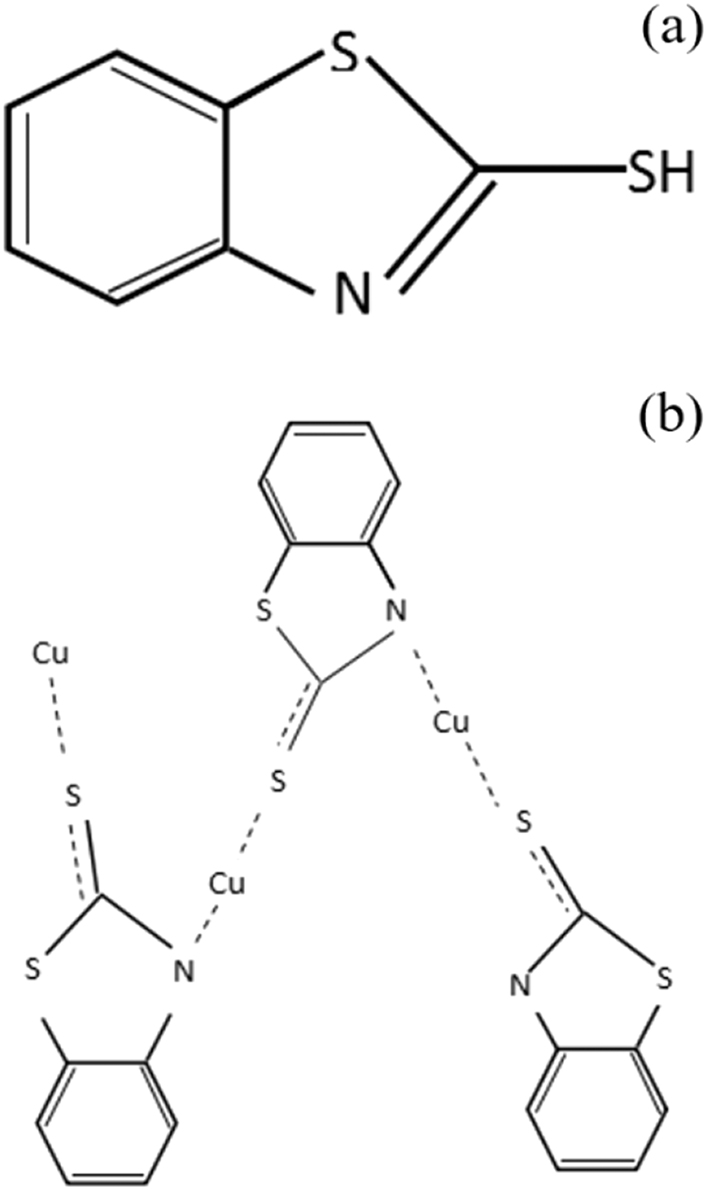
Molecular structure and adsorption configuration. (a) Molecular structure of 2-mercaptobenzothiazole. (b) Adsorption configuration of 2-mercaptobenzothiazole on copper.
The porosity logP-t curve of epoxy coating failure process with 2-mercaptobenzothiazole, simulated in a marine environment at 40 °C, is depicted in Figure 10a. The logP-t curve can be divided into two stages: the first-order (0–24 h) segment is described by y = −5.513 + 0.012 × (R = 98.47 %); the second stage (24–1824 h) is described by y = −5.012 + 0.00058 × (R = 95.77 %). During the first stage, the rate of porosity increase was similar for epoxy coatings with and without 2-mercaptobenzothiazole. However, during the second phase, the coatings containing this additive showed a significant reduction in porosity compared to those without it. In addition, the addition of 2-mercaptobenzothiazole had no adverse effect on the overall coating resistance decrease.
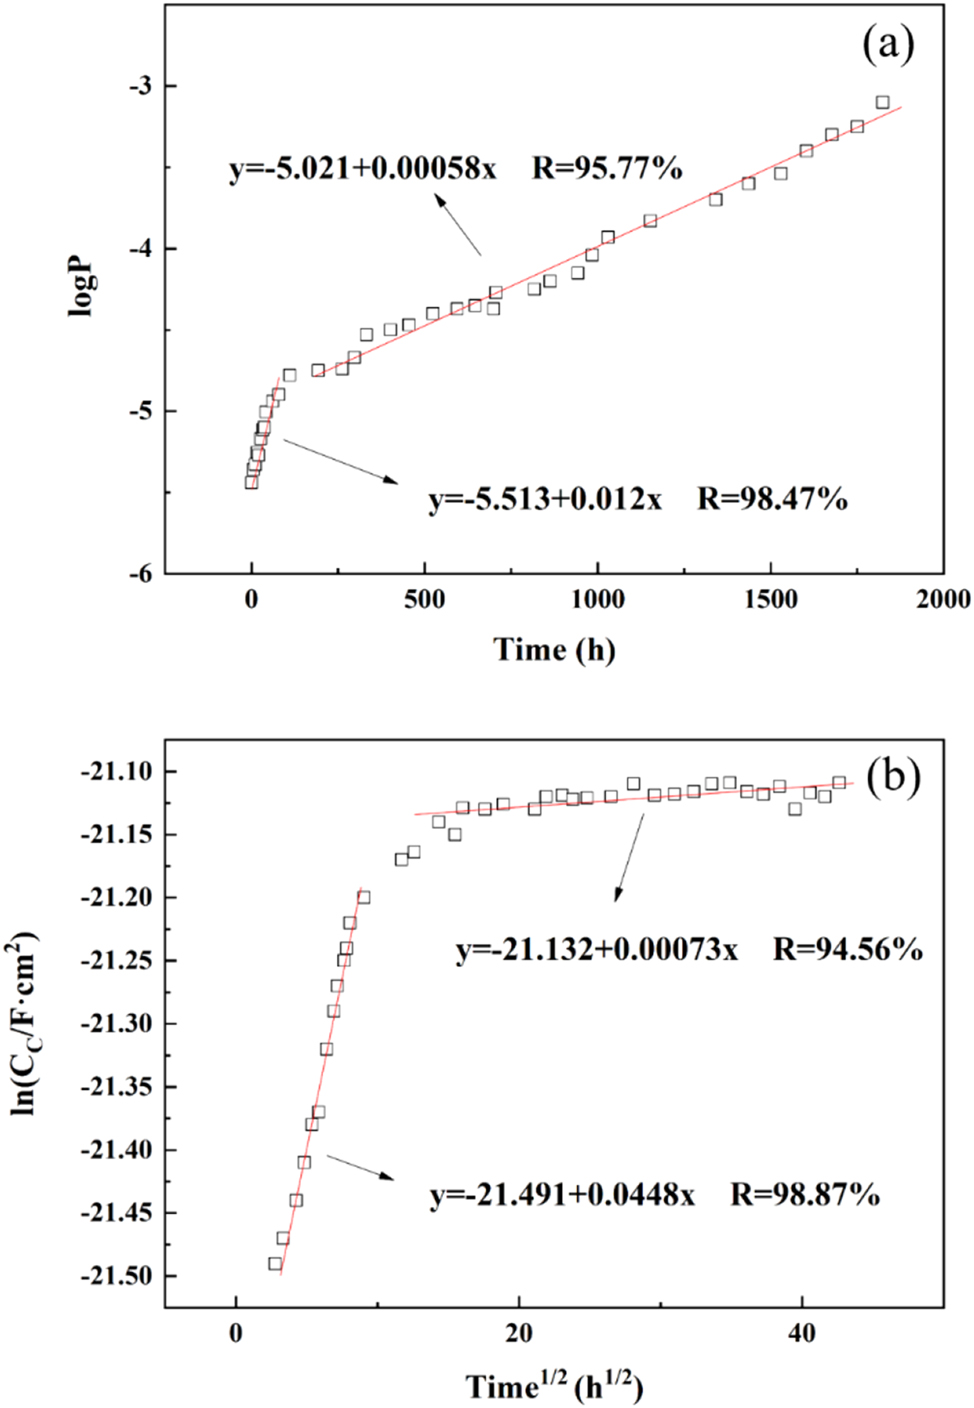
Electrochemical measurements and fitting data. (a) The change curve of logP-t during the failure process of epoxy coating/copper 62 alloy system adding 2-mercaptobenzothiazole. (b) lnC c -t 1/2 curve of epoxy coating/copper 62 alloy system adding 2-mercaptobenzothiazole in the failure process. Scattered points: experimental values; solid lines: fitted values.
Figure 10b illustrates the lnC c ∼ t 1/2 curve for the failure process of the epoxy coating with the addition of 2-mercaptobenzothiazole. During the initial stage (0–24 h), there was a significant increase in capacitance value, while during the second stage (24–1,824 h), moisture diffusion within the coating tended to stabilize. The water diffusion coefficient D for the epoxy resin coating/copper 62 alloy system with added 2-mercaptobenzothiazole was calculated to be 8.35 × 10⁻¹¹ cm2 s−1 under simulated marine conditions. Formula (12) indicated that when saturated with water absorption, the water absorption volume fraction of the coating containing 2-mercaptobenzothiazole is 7.12 %. In contrast to an epoxy coating without this additive, the inclusion of 2-mercaptobenzothiazole enhances the coating compactness and reduces the diffusion coefficient.
4 Conclusions
The effects of corrosion inhibitors on the corrosion behavior of copper 62 alloy in simulated marine environment at 40 °C and the modification of epoxy coating were studied. It has been shown that 2-mercaptobenzothiazole (MBT) has an excellent corrosion suppression effect on copper 62 alloys in marine environments, as the sulfur and nitrogen atoms in the heterocyclic and benzene rings can be adsorbed onto the copper surface to form a strong passivation film. The film can effectively prevent corrosive ions in seawater (such as hydrogen ions, chloride ions) from directly touching the copper surface, thus delaying corrosion. When doped with 0.5 wt% MBT, the corrosion current density is as low as 6.01 × 10⁻⁷ A cm−2, the corrosion inhibition effect can reach 96.4 %, and the charge transfer resistance is 13,349 Ω cm2, which is considerably better than other corrosion inhibitors. The addition of 0.5 wt% MBT to the epoxy coating also significantly improved the performance of the epoxy coating in simulated marine environments: even when the coating began to fail due to the entry of corrosive ions, the doped MBT in the coating was still able to adsorb between the coating and the copper 62, preventing further entry of corrosive ions. In the simulated seawater environment, the aging resistance of epoxy coatings with corrosion inhibitor has been significantly improved. Compared with the epoxy coating without corrosion inhibitor, the water diffusion coefficient of the epoxy coating with MBT added is as low as 9.72 × 10⁻¹¹ cm2 s−1 (1.75 × 10⁻¹⁰ cm2 s−1 without corrosion inhibitor added). Moreover, the failure time was increased to 1,656 h (1,128 h without adding corrosion inhibitor).
-
Research ethics: Not applicable.
-
Author contributions: The authors have accepted responsibility for the entire content of this manuscript and approved its submission.
-
Use of Large Language Models, AI and Machine Learning Tools: None declared.
-
Conflict of interest: The authors state no conflict of interest.
-
Research funding: The Key Research and Development Program of Jiangsu Provincial Department of Science and Technology of China (Grant no. BE2021733).
-
Data availability: The data that support the findings of this study are available from the corresponding author upon reasonable request.
References
Akpoborie, J., Fayomi, O.S.I., Oluwasegun, K.M., Sanni, O., Ren, J., Wan, N., Wan, B., and Daramola, D.O. (2022). Synergistic protection of mild steel in sodium chloride solutions using mixtures of sustainable corrosion inhibitors. Key Eng. Mater. 917: 73–82, https://doi.org/10.4028/p-neuo7f.Search in Google Scholar
Altoe, P., Pimenta, G., Moulin, C.F., Díaz, S.L., and Mattos, O. (1996). Evaluation of oilfied corrosion inhibion in CO2 containing media: a kinetic study. Electrochim. Acta 41: 1165–1172, https://doi.org/10.1016/0013-4686(95)00467-X.Search in Google Scholar
Ashassi-Sorkhabi, H. and Nabavi-Amri, S.A. (2002). Polarization and impedance methods in corrosion inhibition study of carbon steel by amines in petroleum–water mixtures. Electrochim. Acta 47: 2239–2244, https://doi.org/10.1016/S0013-4686(02)00062-2.Search in Google Scholar
Bentiss, F., Lebrini, M., and Lagrenée, M. (2005). Thermodynamic characterization of metal dissolution and inhibitor adsorption processes in mild steel/2,5-bis(-thienyl)-1,3,4-thiadiazoles/hydrochloric acid system. Corros. Sci. 47: 2915–2931, https://doi.org/10.1016/j.corsci.2005.05.034.Search in Google Scholar
Chen, J.N., Jiang, Y.S., Xiao, F., Xu, Y., Zhang, W.W., and Wang, W. (2022). Research progress on corrosion protection of polyurea coatings in marine environment. J. Mater. Prot. 55: 129–136, https://doi.org/10.16577/j.issn.1001-1560.2022.0106.Search in Google Scholar
Dalhatu, S.N., Modu, K.A., Mahmoud, A.A., Zango, Z.U., Umar, A.B., Usman, F., Dennis, J.O., Alsadig, A., Ibnaouf, K.H., and Aldaghri, O.A. (2023). L-Arginine grafted chitosan as corrosion inhibitor for mild steel protection. Polymers 15: 398, https://doi.org/10.3390/polym15020398.Search in Google Scholar PubMed PubMed Central
De La Fuente, M.L., De la Iglesia, R., Farias, L., Glasner, B., Torres-Rojas, F., Muñoz, D., Daims, H., Lukumbuzya, M., and Vargas, I.T. (2022). Enhanced nitrogen and carbon removal innatural seawater by electrochemical enrichment in a bioelectrochemical reactor. J. Environ. Manage. 323: 116294, https://doi.org/10.1016/j.jenvman.2022.116294.Search in Google Scholar PubMed
Elsafi, M., Almuqrin, A.H., Yasmin, S., and Sayyed, M.I. (2023). The affinity of bentonite and WO3 nanoparticles toward epoxy resin polymer for radiation shielding. e-Polym 23: 20230011, https://doi.org/10.1515/epoly-2023-0011.Search in Google Scholar
Guo, L., Ding, S.N., Yuan, S., Gou, X.F., Cai, F.L., Wang, D.Y., and Zhao, H.Q. (2021). Study on the thermal properties and insulation resistance of epoxy resin modified by hexagonal boron nitride. e-Polym 21: 681–690, https://doi.org/10.1515/epoly-2021-0069.Search in Google Scholar
He, T., Tan, C.Y., Tang, J., and Zheng, Y. (2013). Electrochemical behavior of copperpassivated by MBT and HQ in 3.5 %NaCl solution. J. Trans. Nonferrous Met. Soc. China 23: 1388–1395, https://doi.org/10.19476/j.ysxb.1004.0609.2013.05.031.Search in Google Scholar
Huo, S.J., Chen, L.H., Zhu, Q., and Fang, J.H. (2013). Surface enhanced infrared spectroscopy study on the corrosion inhibition of copper by 2-mercaptobenzothiazole. J. Acta Phys.-Chim. Sin. 29: 2565–2572, https://doi.org/10.3866/PKU.WHXB201310294.Search in Google Scholar
Ju, H., Xu, W., Chen, J., Zhang, D., Liu, G., and Duan, J. (2020). Electrochemical investigation of under-deposit corrosion behavior for aluminum brass in artificial seawater. Corrosion 76: 1050–1063, https://doi.org/10.5006/3428.Search in Google Scholar
Karpov, V.A., Kalinina, E.V., and Koval’chuk, Y. (2021). Simulation marine corrosion in tropical Vietnamese waters. Prot. Met. Phys. Chem. Surf. 57: 1296–1301, https://doi.org/10.1134/S2070205121070066.Search in Google Scholar
Kohl, M., Alafid, F., Bouška, M., Krejčová, A., Raycha, Y., Kalendová, A., Hrdina, R., and Burgert, L. (2022). New corrosion inhibitors based on perylene units in epoxy ester resin coatings. Coatings 12: 923, https://doi.org/10.3390/coatings12070923.Search in Google Scholar
Kuang, Y.F., Chen, S., and Lin, Z.C. (1995). Corrosion inhibition behavior of 2-mercaptobenzothiazole on copper in NaCl solution. J. Chin. Soc. Corros. Prot. 15: 129–133.Search in Google Scholar
Liu, Z.N., Fan, B.M., Zhao, J.M., Yang, B., and Zheng, X.W. (2023). Benzothiazole derivatives-based supramolecular assemblies as efficient corrosion inhibitors for copper in artificial seawater: formation, interfacial release and protective mechanisms. Corros. Sci. 212: 110957, https://doi.org/10.1016/j.corsci.2022.110957.Search in Google Scholar
Lu, S. and Jiang, M. (2007). Study on corrosion inhibition of copper by environment-friendly corrosion inhibitors. J. Contemp. Chem. Ind. 01: 11–12.Search in Google Scholar
Lu, D.Z., Jiang, Q.T., Li, J.W., Ma, X.M., Fan, L., Huang, Y.L., and Hou, B.R. (2023). Preparation and properties of thermal diffusion metal protective layer on the surface of magnesium alloys. J. Mater. Prot. 56: 134–145+162, https://doi.org/10.16577/j.issn.1001-1560.2023.0021.Search in Google Scholar
Pi, J.Y., Chen, M.J., Chen, T.Q., Wang, Q., Cheng, S.J., and Fu, C.Y. (2023). Corrosion inhibition effect of 1-phenyl-5-mercaptotetrazole on nickel-aluminum bronze in seawater: a combined experimental and theoretical study. Colloids Surf. A 666: 131354, https://doi.org/10.1016/j.colsurfa.2023.131354.Search in Google Scholar
Raj, X.J. (2022). Effects of triazole functionalized SiO2/TiO2 nanoparticles in polyurethane coating: a study on structural, thermal, dynamic mechanical, morphological and electrochemical properties in marine environment. ChemistrySelect 7: e202200345, https://doi.org/10.1002/slct.202200345.Search in Google Scholar
Roberge, P.R. and Sastri, V.S. (1993). Laboratory and field evaluation of organic corrosion inhibitors in sour media. Corros. Sci. 35: 1503–1513, https://doi.org/10.1016/0010-938X(93)90378-T.Search in Google Scholar
Roque, J.M., Pandiyan, T., Cruz, J., and García-Ochoa, E. (2007). DFT and electrochemical studies of tris(benzimidazole-2-ylmethyl)amine as an efficient corrosion inhibitor for carbon steel surface. Corros. Sci. 50: 614–624, https://doi.org/10.1016/j.corsci.2007.11.012.Search in Google Scholar
Wang, Z., Lv, H.P., and Yang, Y.X. (2022). Mechanical properties of epoxy resin toughened with cornstarch. e-Polym 22: 851–857, https://doi.org/10.1515/epoly-2022-0075.Search in Google Scholar
Zhang, Q.B. and Hua, Y.X. (2011). Effect of alkylimidazolium ionic liquids on the corrosion inhibition of copper in sulfuric acid solution. J. Acta Phys. Chim. Sin. 27: 655–663, https://doi.org/10.3866/PKU.WHXB20110339.Search in Google Scholar
Zhang, Z.Y., Zhou, X., Sun, J., and Sun, H.J. (2022). Research progress in corrosion inhibition of imidazole ionic liquids for copper and copper alloys. J. Liaoning Chem. Ind. 51: 46–49, https://doi.org/10.3969/j.issn.1004-0935.2022.01.014.Search in Google Scholar
Zhao, X. (2021). Development status and prospect of organic copper and its alloy corrosion inhibitors. J. Contemp. Chem. Ind. 01: 8–10, https://doi.org/10.3969/j.issn.1672-8114.2021.01.003.Search in Google Scholar
Zhou, Z.H. (2004). Research on corrosion rule of copper in pure water and application of inhibitors. J. North China Electr. Power 04: 22–25, https://doi.org/10.3969/j.issn.1003-9171.2004.04.008.Search in Google Scholar
Zhu, Z., Zuo, X., and Ying, Z. (2017). Corrosion analysis of copper T2 exposed to polluted atmospheres and study on prediction model. Corros. Rev. 35: 35–46, https://doi.org/10.1515/corrrev-2016-0068.Search in Google Scholar
© 2024 the author(s), published by De Gruyter, Berlin/Boston
This work is licensed under the Creative Commons Attribution 4.0 International License.
Articles in the same Issue
- Frontmatter
- Reviews
- Biomacromolecules as green corrosion inhibitors: a review based on mild steel corrosion in acidic media
- Copper corrosion mechanisms, influencing factors, and mitigation strategies for water circuits of heat exchangers: critical review and current advances
- Original Articles
- Influence of corrosion inhibitors on aging mechanism of epoxy resin coatings for copper 62 alloy in simulated marine environment
- High tribo-corrosion resistance of Ni-Cr-5Al2O3 thermal spray coating: a comparison of post processing techniques
- Understanding the role of S and Cl degrading the corrosion resistance of 12Cr1MoVG steel in a waste incineration boiler: on-site and laboratory testing