A multiscale and dual-loss network for pulmonary nodule classification
-
Ping Zhang


Abstract
Detecting malignancy in pulmonary nodules holds significant clinical importance, yet existing image classification methods often struggle with inadequate feature integration and ineffective loss functions. This study proposes two innovative strategies to address these limitations: first, we introduce a multiscale feature weighted fusion technique that enhances the integration of features across different scales, allowing the model to prioritize critical pixel locations essential for accurate diagnosis. Second, we combine contrastive loss with binary cross-entropy within our training framework to improve learning from both similarities and differences among paired samples, which fosters better discrimination between similar nodules while maintaining sensitivity to variations across classes. Besides, our proposed methodologies demonstrate promising performance improvements in detecting pulmonary nodule malignancy, leading to enhanced performance and reliability compared to conventional approaches.
1 Introduction
Lung cancer, with its high incidence and mortality rates, necessitates early diagnosis to improve survival outcomes. The classification of pulmonary nodules (as shown in Figure 1) as benign or malignant is essential for identifying potential malignancies and guiding treatment plans [1,2]. Traditionally, physicians evaluate these nodules using computed tomography (CT) images; however, this process can be time consuming and relies heavily on individual experience, which may affect both efficiency and accuracy. To address these challenges, computer-aided diagnosis (CAD) systems [3,4] have emerged as valuable tools that utilize advanced image processing and machine learning algorithms to automatically analyze CT images. By learning from extensive datasets to detect subtle imaging features, CAD systems leverage artificial intelligence to aid physicians in making faster and more accurate decisions, thereby significantly advancing the assessment of pulmonary nodules and enhancing modern medical imaging. Previously, many studies have indicated that machine learning methodologies play a crucial role in advancing the diagnostic accuracy of pulmonary nodules. For instance, Liu et al. developed a systematic approach that quantifies radiological traits and emphasizes semantic imaging features for predicting malignancy, resulting in enhanced predictive accuracy [5]. In another study, Ferreira et al.’s random forest algorithm demonstrated superior performance compared to other classifiers; notably, a decision tree using only two features achieved comparable sensitivity and specificity [6]. Meanwhile, Tu et al. effectively combined localized thin-section CT with radiomics feature extraction and machine learning to accurately classify early-detected pulmonary nodules, thereby reducing false positives while improving malignancy differentiation [7]. Yang et al. highlighted essential nodular features through a review focused on ground-glass opacity nodules, which were vital for developing effective prediction models [8]. Uthoff et al. contributed by standardizing perinodular features, while Yamada et al. improved classification accuracy with positron emission tomographic/CT images [9,10]. Furthermore, Chen et al.’s method had outperformed existing approaches in malignancy prediction; similarly, Liu et al.’s integration of CT findings with CEA levels yielded superior predictions [11,12]. Recently, many investigations have highlighted the effectiveness of deep learning techniques, particularly convolutional neural networks (CNNs), in detecting and classifying pulmonary nodules from CT scans. Wang et al. introduced a hybrid CNN model that enhanced malignancy risk assessment accuracy by integrating global and local features, surpassing traditional texture and shape-based methods [13]. Dou et al. developed a three-dimensional CNN that significantly reduced false positives by incorporating multilevel information, thereby improving detection efficiency [14]. Jin et al.’s deep 3D residual CNN further advanced lung cancer diagnosis by effectively targeting false positives [15]. Additionally, Feng et al. created a weaklysupervised CNN for automated nodule segmentation using image-level labels, successfully localizing nodules in CT images [16]. The integration of transfer learning has also played a crucial role; Zhao et al.’s approach outperformed other CNN strategies in distinguishing malignant from benign nodules [17]. Recent innovations such as the multiscale gradual integration CNN had shown significant improvements on datasets like LUNA16 [18]. Moreover, the growing body of literature indicated that hybrid models, attention mechanisms, and ensemble learning strategies – such as those developed by Yuans et al. and Xu et al. – were essential for achieving high sensitivity and accuracy in lung cancer risk assessment [19,20]. These advancements underscore the continuous evolution of deep learning methodologies within medical imaging, highlighting their potential to transform clinical practices and improve patient outcomes in lung cancer detection and management.
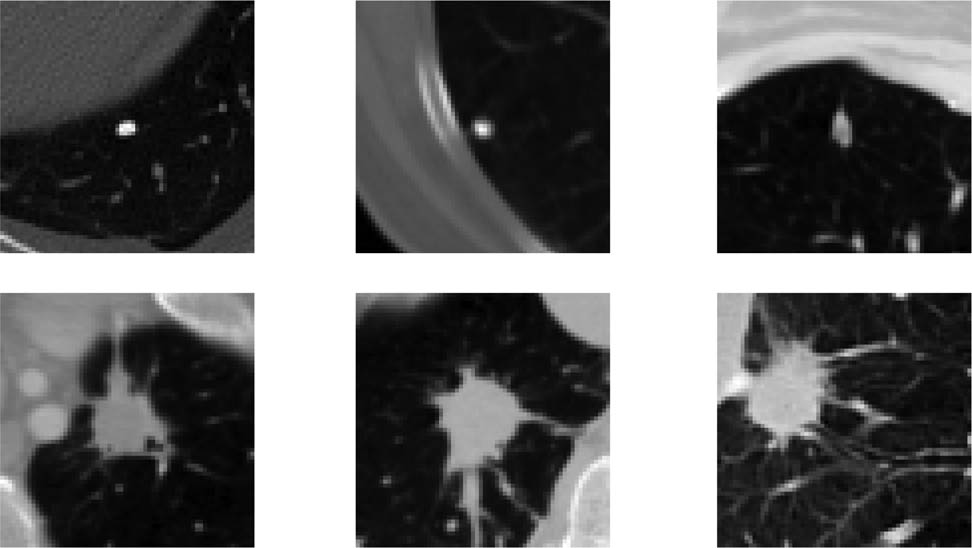
The samples of different pulmonary nodules.
Previous methods in image classification for detecting pulmonary nodule malignancy have made significant strides, but they still face limitations that impact their effectiveness. A major issue is the inadequate integration of features from various scales, which leads to a lack of focus on the discriminative traits necessary for accurate diagnosis. Traditional approaches often rely on single-scale feature extraction and can overlook critical contextual information, affecting performance when distinguishing between benign and malignant nodules. In addition, conventional loss functions like binary cross-entropy (BCE) do not fully leverage the relationships among paired samples, impairing generalization across classes. To address these challenges, we propose two innovative strategies: first, we implement multiscale feature weighted fusion (MFWF) to enhance information integration across different scales through spatial resizing and the computation of a weight matrix that emphasizes crucial pixel positions. This pixel-wise weight matrix guides the weighted fusion of multiscale features, prioritizing the most salient information. By effectively combining hierarchical details with semantic information, this approach enhances the model’s ability to capture complex patterns and improves its discriminability. Second, the contrastive loss excels at pulling similar pairs closer together in the embedding space and pushing dissimilar pairs farther apart, effectively emphasizing relative relationships. Simultaneously, the BCE loss ensures the model remains sensitive to variations across differing classes by providing a consistent supervisory signal focused on classification accuracy for each sample individually. Therefore, to leverage these strengths, we combine contrastive loss with BCE loss in a dual-loss training framework. This approach not only enhances discrimination among similar samples by fine-tuning the embedding space for closely related examples, but also maintains robust sensitivity to interclass variance, preventing the model from collapsing distinguishable categories into indistinguishable clusters. Overall, these integrated methodologies improve classification performance and bolster the model’s ability to generalize across diverse patient datasets encountered in clinical settings. The main contributions of this article can be summarized as follows:
We introduce the MFWF that enhances the integration of features across different scales, allowing the model to focus on critical pixel positions and improving its sensitivity to discriminative characteristics essential for accurate diagnosis.
By employing dual loss, we enable the model to better learn from similarities and differences among paired samples, which enhances discrimination among similar nodules while maintaining sensitivity to class variations.
Our proposed methods exhibit promising performance in detecting pulmonary nodule malignancy, highlighting improvements in accuracy and reliability when compared to existing approaches.
The rest of this article is organized as follows: In Section 2, it outlines our proposed MFWF approach and the dual-loss training strategy, detailing the technical implementation and theoretical foundations underpinning these methods. Subsequently, in Section 3, we present the experimental setup, including the datasets utilized for evaluation and the metrics employed to assess performance. Finally, we conclude with a summary of key findings and future directions for research in this domain in Section 4.
2 Methodology
The main structure of this article is illustrated in Figure 2, featuring a primary architecture based on the ResNet network. To effectively extract multiscale features of pulmonary nodules, we propose the MFWF module. Furthermore, to enhance discrimination among paired samples while preserving sensitivity to class variations, we have designed a dual-loss strategy that complements this approach.
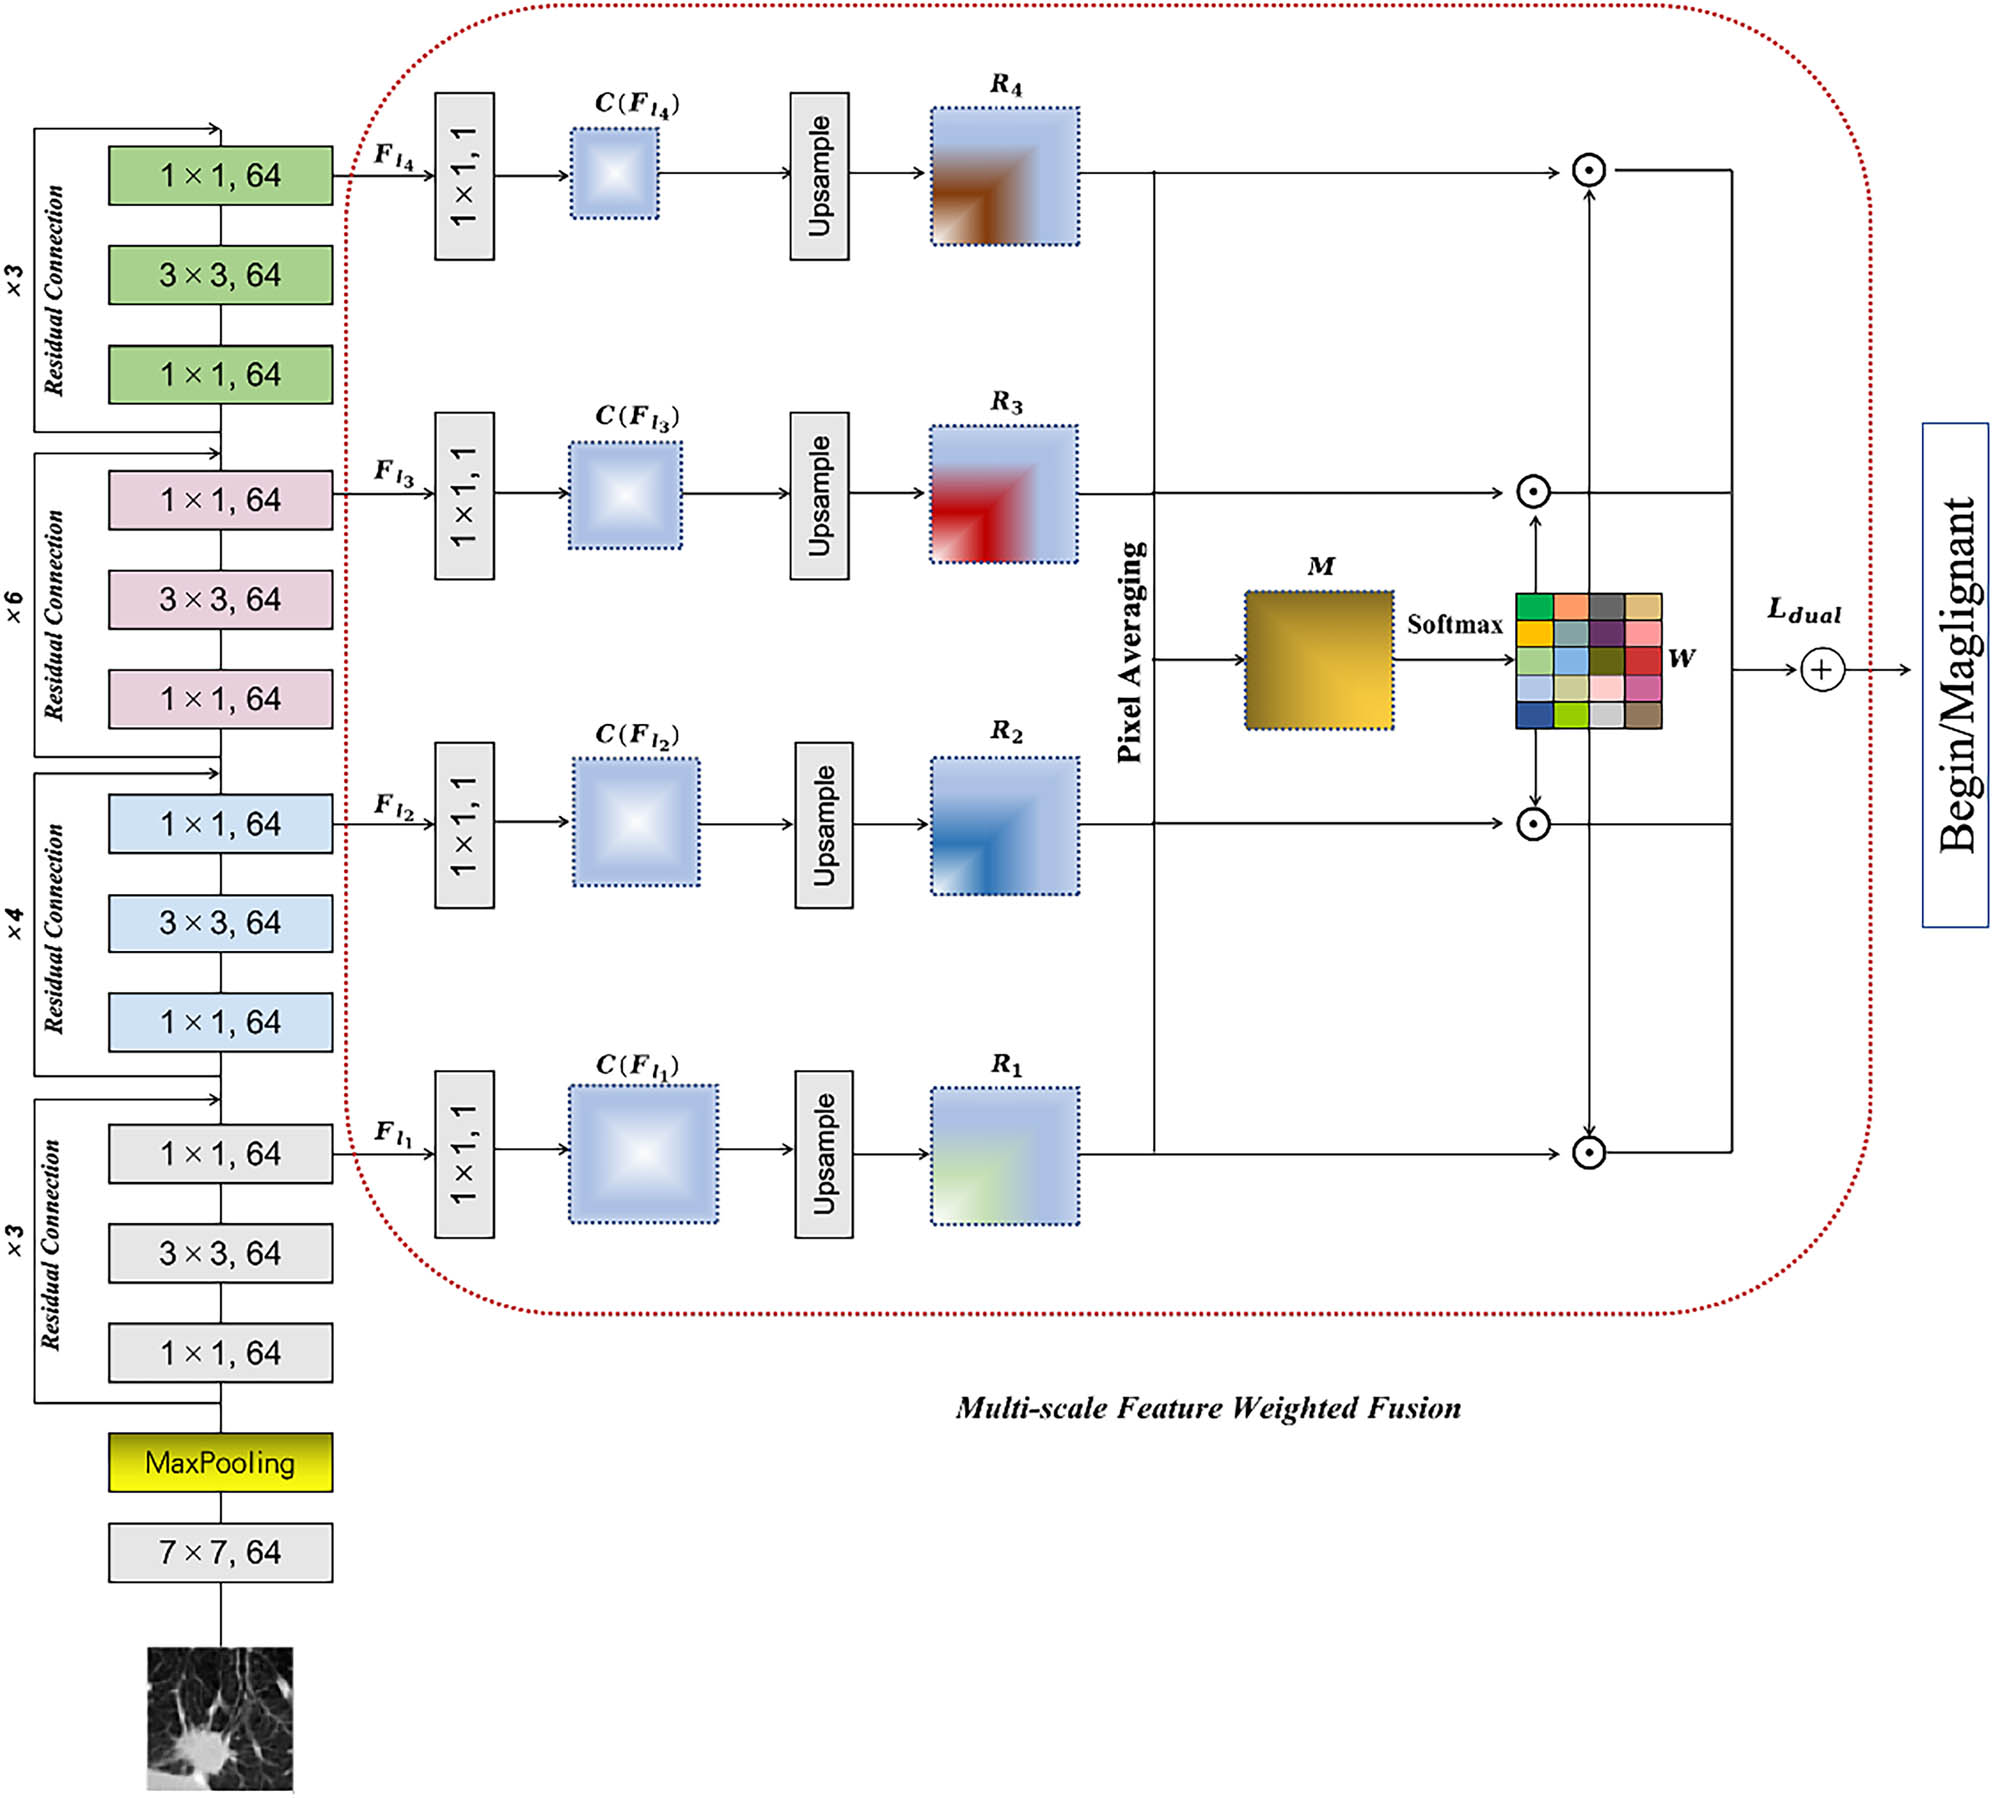
The proposed model is structured based on the ResNet architecture. A multiscale feature fusion module is introduced to effectively extract multiscale features from pulmonary nodules. Furthermore, a dual-loss strategy is designed to enhance discrimination among paired samples while preserving sensitivity to class variations, complementing this approach.
2.1 Revisit of residual block
In this section, we first revisit the residual block, which serves as the fundamental building block of our architectures. The key innovation that the residual block introduces is the concept of skip connections, which facilitate gradient flow through the network and mitigate issues related to vanishing gradients. The mathematical formulation of a basic residual block can be expressed as follows:
where
This structure provides not only depth but also enhances representational capacity while ensuring that valuable features are retained throughout multiple layers.
2.2 Multiscale feature weighted fusion
The process begins with inputting an image
To reduce dimensionality while enhancing the expressive power of features, we apply a
where
After resizing, we obtain a set of new feature maps expressed as follows:
Subsequently, at each pixel position
Following this calculation, we build a weight matrix reflecting the importance of each scale through normalization:
Once these steps are completed, we acquire a weight matrix for every pixel that emphasizes important features. Next, these weighted feature maps are summation combined to derive a final fused representation defined by the following equation:
Finally, to achieve classification objectives, we employ a linear layer yielding class predictions according to:
where
2.3 Dual-loss strategy
In the binary classification task of pulmonary nodule malignancy, we first prepare a dataset consisting of pairs of pulmonary nodule images along with their corresponding labels. For each input image pair
where
Then we compute the overall contrastive loss
In this context,
where
Finally, these two losses are combined into an overall loss function:
where
3 Experiment
In this section, we outline a series of experiments aimed at validating the effectiveness of our proposed methodologies for detecting pulmonary nodule malignancy. We begin by describing the dataset utilized, along with the implementation details and evaluation metrics. Following this, we conduct a systematic set of experiments to assess and confirm the efficacy of our proposed model.
3.1 Datasets
The LIDC-IDRI (Lung Image Database Consortium and Image Database Resource Initiative, https://www.cancerimagingarchive.net/collection/lidc-idri/) is a public database dedicated to the detection and classification of pulmonary nodules. It consists of CT scan images from 1,018 patients, with slice thicknesses varying from 0.6 to 5 mm. To ensure accuracy, each nodule’s diagnostic information – including location, diameter, malignancy classified on a scale of 1 to 5, calcification level, and spiculation – has been independently annotated by four radiologists. This research aims to develop a network that classifies nodules as benign or malignant based on a voting strategy; specifically, if at least half of the experts rate a nodule above 3, it will be classified as malignant; otherwise, it will be deemed benign. To simplify model complexity, only the center cross-section image of each nodule is used as input.
3.2 Implementation details
The classification network was developed in an experimental environment using Keras, leveraging the power of an Nvidia GTX 3090 GPU. In addition, we implemented a learning rate adaptation strategy known as ReduceLROnPlateau, which adjusts the learning rate based on validation performance metrics. To further enhance model generalization, we applied various data augmentation techniques such as random rotations, vertical and horizontal flips, and brightness adjustments. The experimental results are validated by cross-validation to ensure generalizability, where performance metrics are averaged over all folds.
3.3 Evaluation metrics
Accuracy measures the overall model performance in correctly classifying instances. It is calculated as the ratio of true positives (TP), which are correctly identified positive cases, and true negatives (TN), which are correctly identified negative cases, to the total number of instances assessed (including false positives (FP) and false negatives (FN)):
Sensitivity indicates the model’s ability to identify actual positive instances. It is defined as the proportion of true positives relative to all actual positives (TP plus FN):
Specificity assesses the model’s effectiveness in identifying negative instances. It expresses the proportion of TN out of all actual negatives (TN plus FP):
The area under receiver operating characteristic (ROC) curve (AUC) summarizes the model’s capability to discriminate between classes; higher values indicate better performance. AUC is evaluated by plotting the true positive rate against the false positive rate across various thresholds.
3.4 Evaluation of multiscale feature weighted fusion
This experiment evaluates the impact of MFWF on model performance. A comparison is made between the classification different evaluation metrics of the model employing the proposed MFWF and that without (w/o) MFWF as shown in Table 1. The results indicate an effective enhancement in the recognition of critical features across varying scales, suggesting that the integration of information from multiple scales allows for improved attention to essential characteristics relevant to accurate classification. This improvement highlights the effectiveness of our approach in addressing the limitations associated with single-scale methods, ultimately leading to better diagnostic capabilities in classifying pulmonary nodules.
Evaluation of multiscale feature weighted fusion
| Accuracy (%) | Sensitivity (%) | Specificity (%) | AUC | |
|---|---|---|---|---|
| w/o MFWF | 90.12 | 90.00 | 90.23 | 0.902 |
| w/ MFWF | 91.34 | 92.44 | 90.26 | 0.924 |
3.5 Different fusion modes of MFWF
In the MFWF process, we examine various fusion techniques such as averaging, concatenation, and linear fusion alongside simple summation for integrating features from different layers. As shown in Figure 3, our experimental results demonstrate that summation consistently outperforms the other methods due to its ability to emphasize significant features captured in deeper layers while avoiding dimensionality issues present in concatenation. Unlike averaging, which dilutes key information by giving equal weight to all inputs, summation effectively enhances classification performance by retaining critical details. While linear blending shows promise in specific contexts through its adaptability, it does not achieve the robust performance exhibited by the summation method.
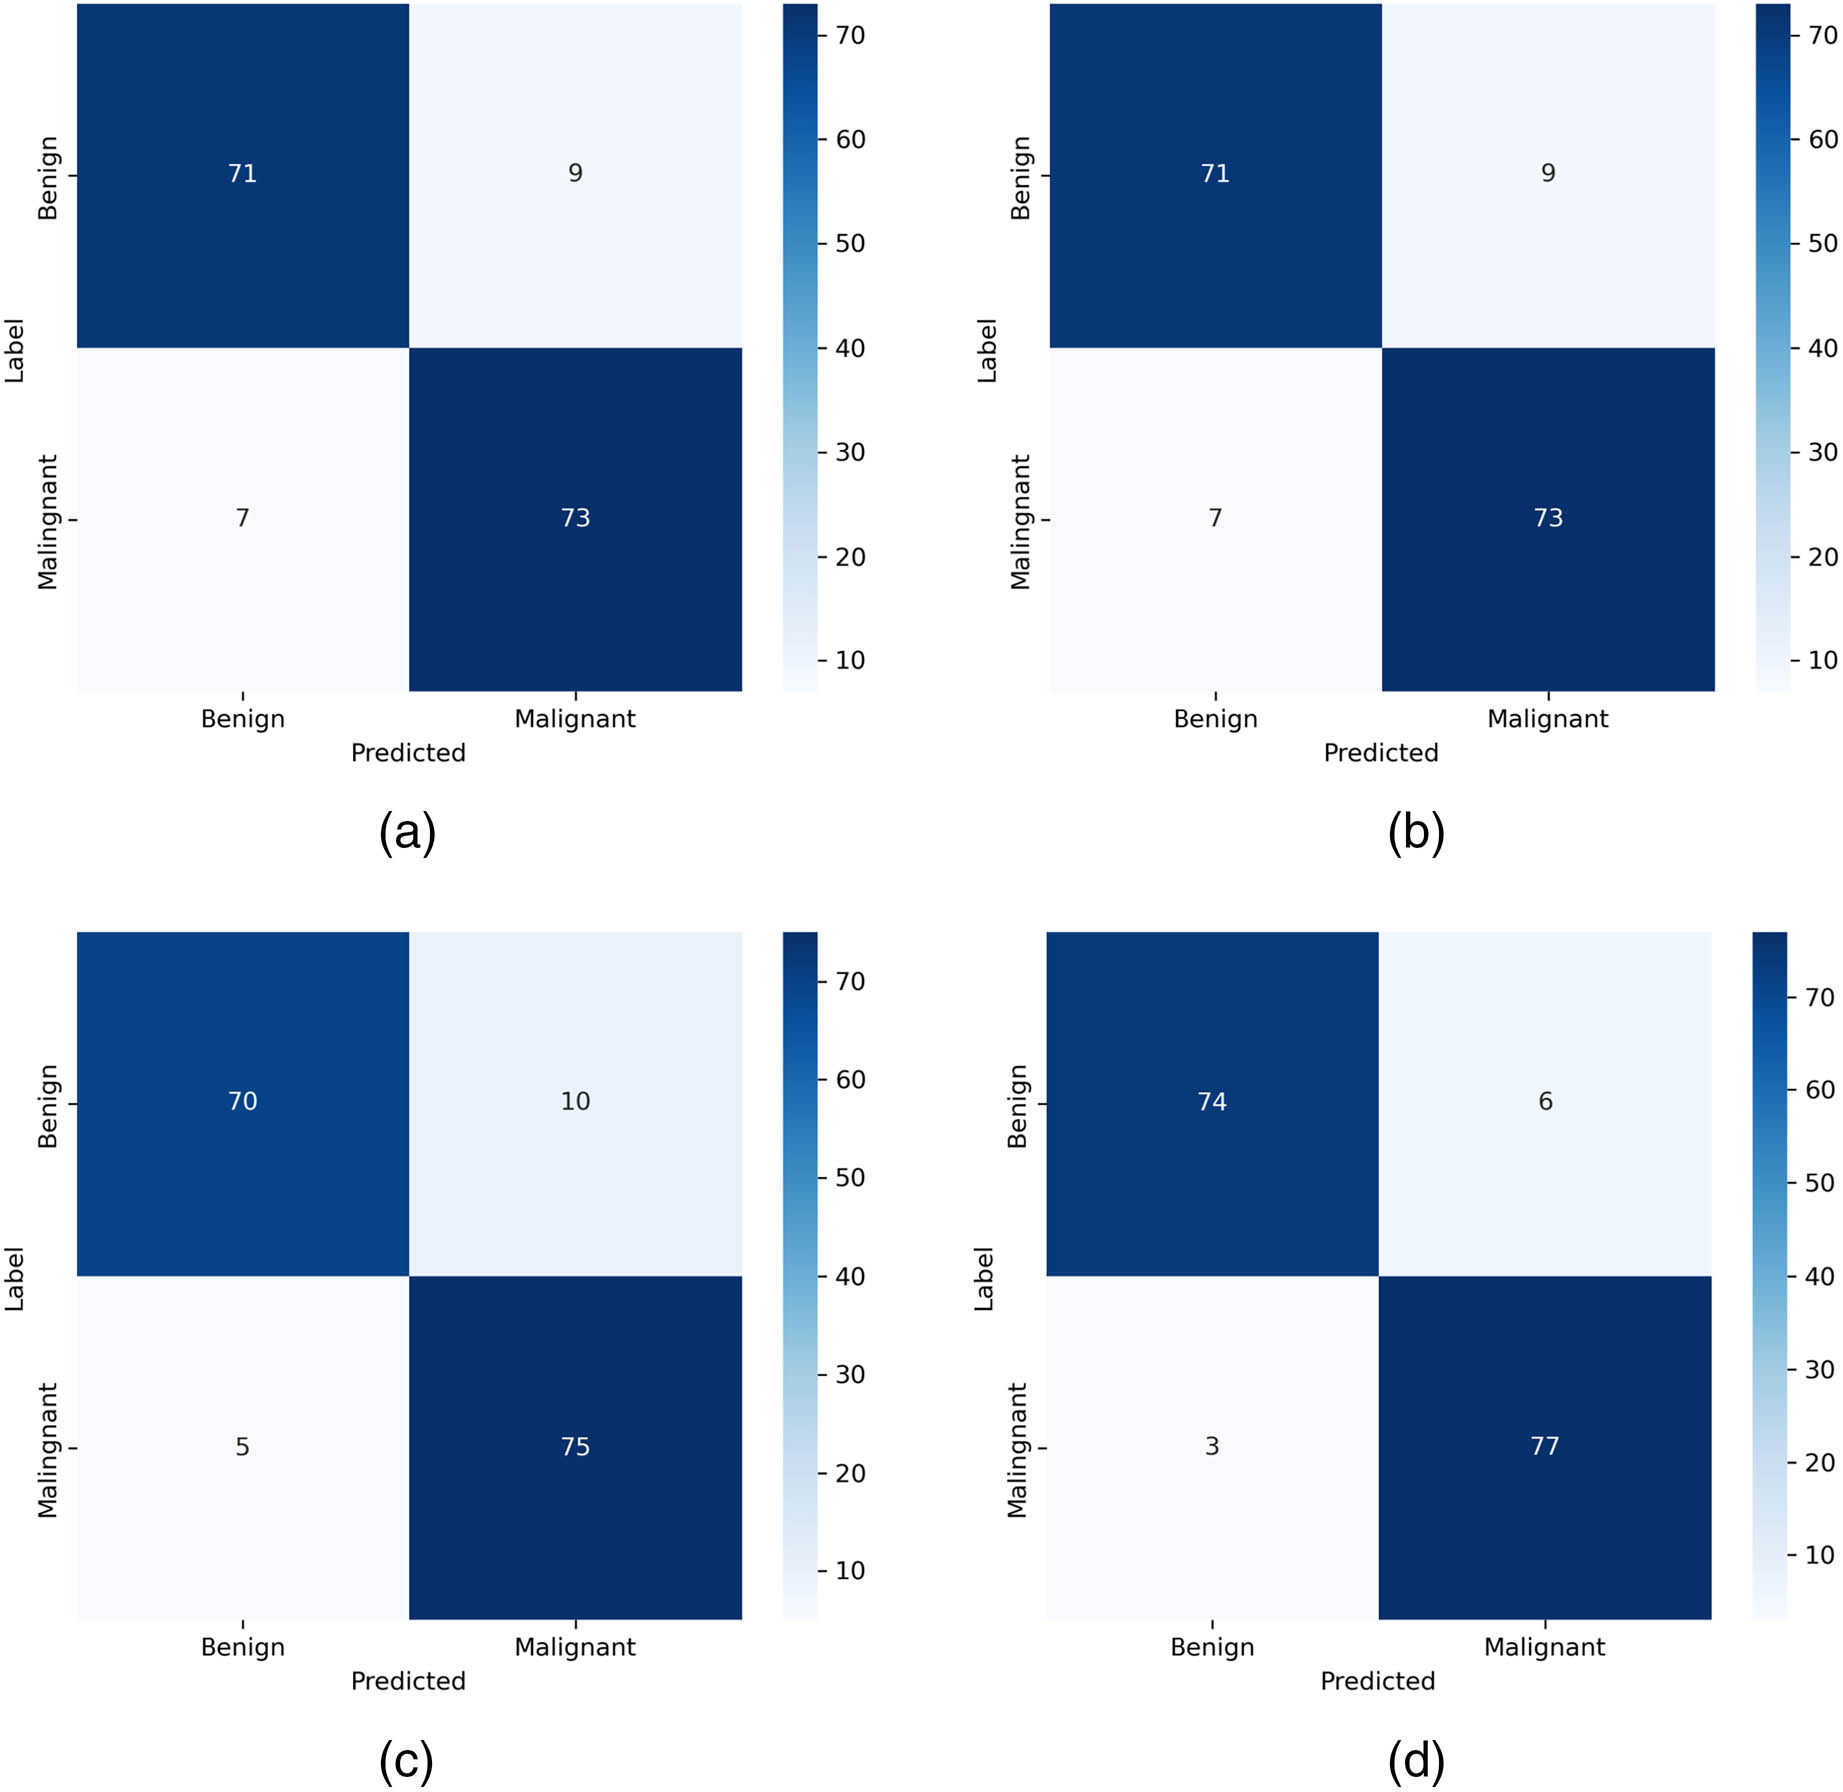
Different fusion modes of MFWF. a, b, c, d represents the averaging, concatenation, linear, and summation, respectively.
3.6 Impact of dual-loss training strategy
The experiments conducted to evaluate the benefits of combining
Impact of dual-loss training strategy
| Accuracy (%) | Sensitivity (%) | Specificity (%) | AUC | |
|---|---|---|---|---|
|
|
90.72 | 91.53 | 90.01 | 0.905 |
|
|
89.16 | 90.02 | 88.37 | 0.868 |
|
|
91.34 | 92.44 | 90.26 | 0.924 |
3.7 The integration of various input sizes
In the experiment, image sizes of
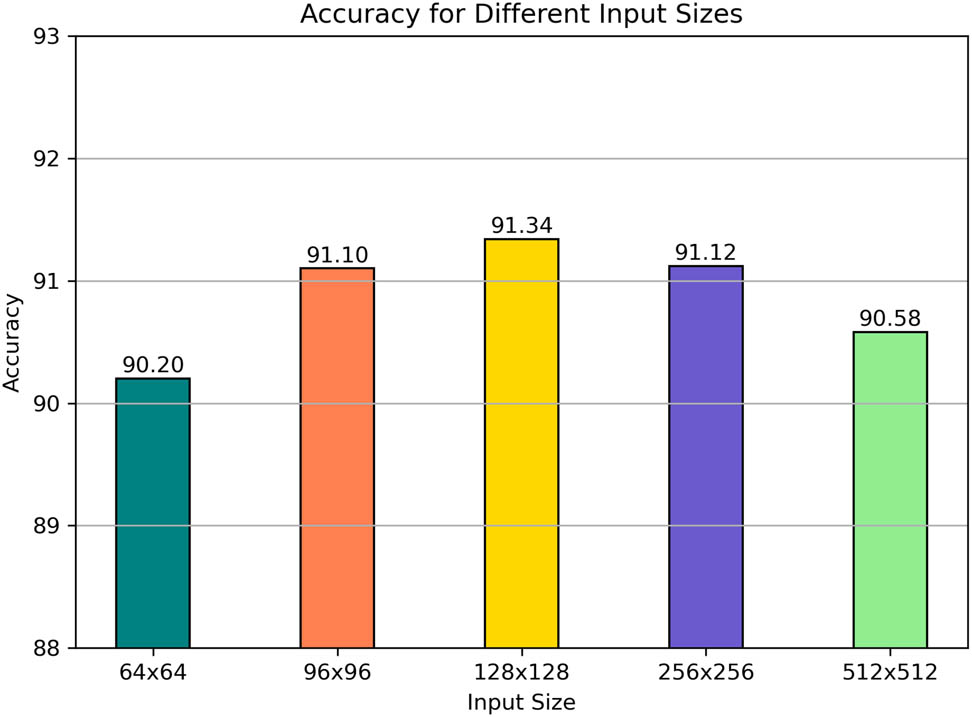
The integration of various input sizes.
3.8 Comparison with state-of-the-art models
To validate the proposed methods further, a comparative analysis is implemented against several state-of-the-art image classification models currently employed for malignancy detection in pulmonary nodules. Notably, since the sizes of each method in the original research is not the same, for a fair comparison, we reemploy those methods on the same data to validate the effectiveness of our proposed method. All the hyperparameters are obeyed the original settings. Here, we compare those methods as follow: Nibali et al. [21], Shen et al. [22], Zhang et al. [23], Wang et al. [24], Zhang et al. [25], Huo et al. [26], Ding et al. [27] (only using the single stream and modality), and Manzari et al. [28]. As shown in Table 3 and Figure 5, the results indicate that the proposed approach consistently outperforms existing methodologies across all evaluation metrics. Notably, we conduct paired t-tests to compare our proposed method with other existing approaches, and the
Compared with state-of-the-art methods
| Accuracy (%) | Sensitivity (%) | Specificity (%) | AUC | |
|---|---|---|---|---|
| Nibali et al. [21] | 87.85 | 84.88 | 90.74 | 0.875 |
| Shen et al. [22] | 86.16 | 83.42 | 88.84 | 0.862 |
| Zhang et al. [23] | 85.92 | 85.12 | 86.72 | 0.859 |
| Wang et al. [24] | 85.92 | 91.46 | 80.52 | 0.852 |
| Zhang et al. [25] | 90.61 | 91.22 | 90.02 | 0.908 |
| Huo et al. [26] | 85.08 | 91.71 | 78.62 | 0.841 |
| Ding et al. [27] | 84.96 | 84.39 | 85.51 | 0.847 |
| Manzari et al. [28] | 84.72 | 87.56 | 81.95 | 0.853 |
| Ours | 91.34 | 92.44 | 90.26 | 0.924 |
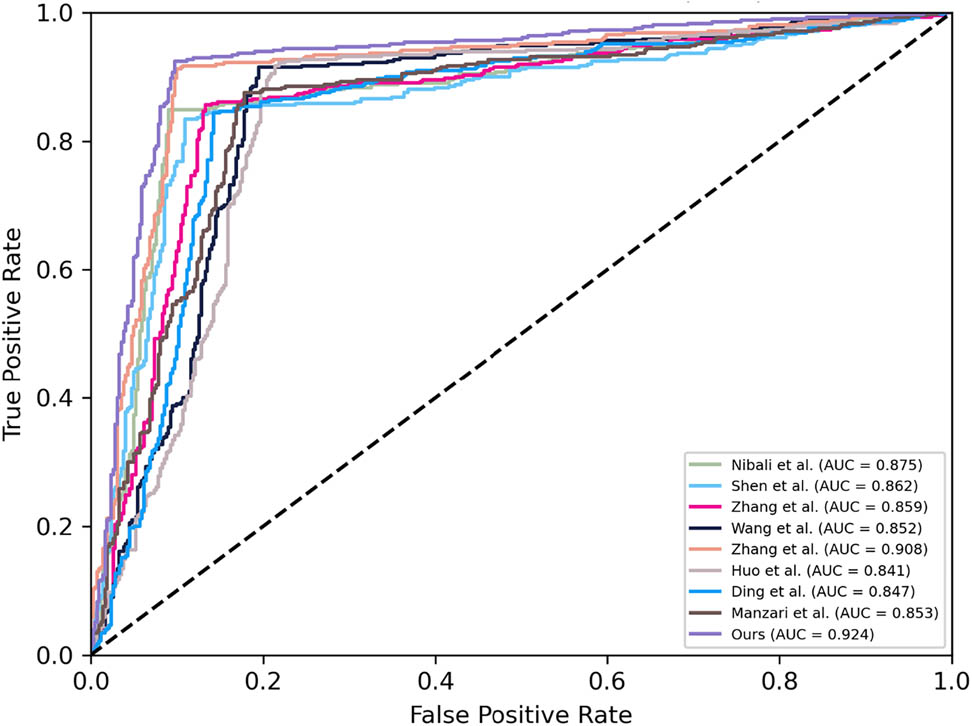
The ROC comparisons with state-of-the-art methods.
3.9 Different depths of ResNet
The influence of different depths of ResNet on performance is investigated through experiments examining various architectures. As shown in Figure 6, results indicate that as the depth of ResNet increases, performance initially improves due to enhanced capabilities in capturing complex features and learning intricate hierarchical representations. This improvement arises because deeper networks can learn more abstract representations, allowing them to model complex patterns in the data effectively. However, after reaching a certain depth, this performance stabilizes, suggesting diminishing returns regarding further depth. The saturation occurs because very deep networks may struggle with issues like overfitting and increased difficulty during training. Overall, while increasing depth enhances classification performance up to a point by leveraging these advanced capabilities, careful consideration is necessary regarding training dynamics and computational resources in deeper configurations.
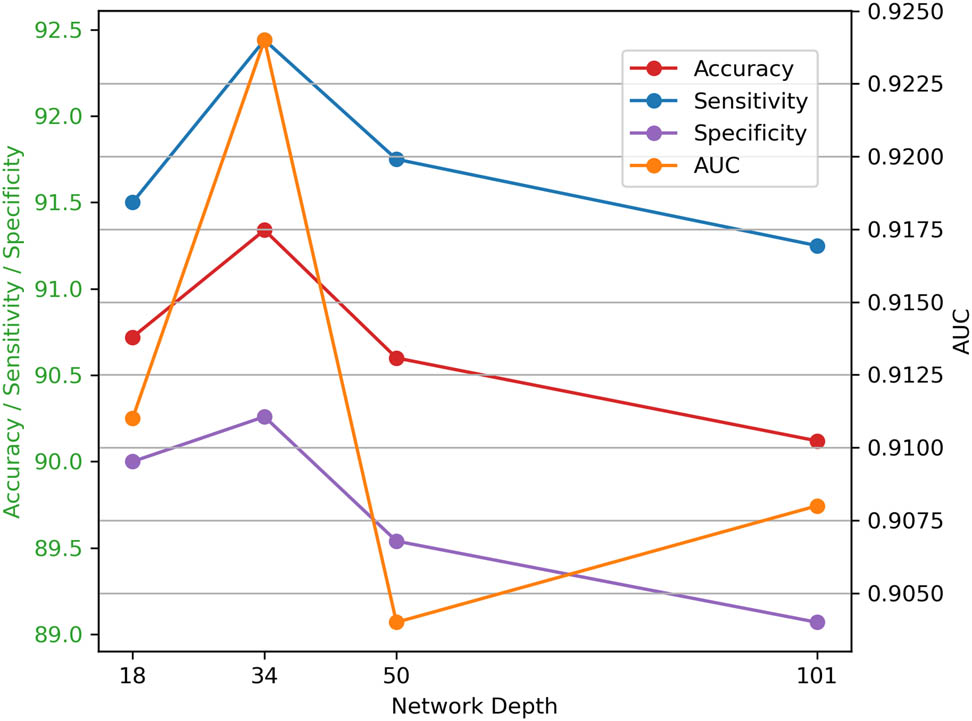
Comparisons with different depths.
4 Conclusion
In this article, we present innovative strategies to enhance the effectiveness of image classification for classifying pulmonary nodule malignancy. Our approach addresses limitations in previous methods, notably the inadequate integration of multiscale features and the suboptimal use of conventional loss functions. By implementing multiscale feature weighted fusion, we improve information integration across various scales, allowing our model to focus on key pixel positions essential for accurate diagnosis. Furthermore, the combination of contrastive loss with binary cross entropy facilitates superior learning from similarities and differences among paired samples, enhancing discrimination between similar nodules while maintaining sensitivity to class variations. The results demonstrate that our methodologies yield improvements in classification performance and reliability compared to existing approaches. Looking ahead, future research could explore further optimization of feature integration techniques and investigate additional hybrid loss functions that leverage more complex relationships within datasets, aiming to refine diagnostic accuracy even further and expand applications to other medical imaging scenarios.
-
Funding information: This research received no external funding.
-
Author contributions: Ping Zhang and Li Cheng developed the conceptual framework. Li Cheng handled data collection and analysis, while Jian Mao oversaw the project and ensured result integrity. All authors contributed to drafting and revising the manuscript.
-
Conflict of interest: The authors declare that there is no conflict of interest regarding the publication of this article.
-
Ethical approval: This research was based on publicly available data and did not involve any direct interaction with human subjects or use of animal subjects. Therefore, ethical approval was not applicable.
-
Data availability statement: The data used to support the findings of are available on: https://www.cancerimagingarchive.net/collection/lidc-idri/.
References
[1] A. McWilliams, M. C. Tammemagi, J. R. Mayo, H. Roberts, G. Liu, K. Soghrati, et al., “Probability of cancer in pulmonary nodules detected on first screening CT,” New Engl. J. Med., vol. 369, no. 10, pp. 910–919, 2013. 10.1056/NEJMoa1214726Search in Google Scholar PubMed PubMed Central
[2] A. E. Prosper, M. N. Kammer, F. Maldonado, D. R. Aberle, and W. Hsu, “Expanding role of advanced image analysis in ct-detected indeterminate pulmonary nodules and early lung cancer characterization,” Radiology, vol. 309, no. 1, p. e222904, 2023. 10.1148/radiol.222904Search in Google Scholar PubMed PubMed Central
[3] M. Javaid, M. Javid, M. Z. U. Rehman, and S. I. A. Shah, “A novel approach to CAD system for the detection of lung nodules in CT images,” Comput. Methods Programs Biomed., vol. 135, pp. 125–139, 2016. 10.1016/j.cmpb.2016.07.031Search in Google Scholar PubMed
[4] R. Yuan, P. M. Vos, and P. L. Cooperberg, “Computer-aided detection in screening CT for pulmonary nodules,” Am. J. Roentgenol., vol. 186, no. 5, pp. 1280–1287, 2006. 10.2214/AJR.04.1969Search in Google Scholar PubMed
[5] Y. Liu, Y. Balagurunathan, T. Atwater, S. Antic, Q. Li, R. C. Walker, et al., “Radiological image traits predictive of cancer status in pulmonary nodules,” Clin. Cancer Res., vol. 23, no. 6, pp. 1442–1449, 2016. http://dx.doi.org/10.1158/1078-0432.ccr-15-3102. Search in Google Scholar
[6] J. R. Ferreira, M. C. Oliveira, and P. M. de Azevedo-Marques, “Characterization of pulmonary nodules based on features of margin sharpness and texture,” J. Digit. Imag., vol. 31, no. 4, 451–463, 2017. http://dx.doi.org/10.1007/s10278-017-0029-8. Search in Google Scholar PubMed PubMed Central
[7] S.-J. Tu, C.-W. Wang, K.-T. Pan, Y.-C. Wu, and C.-T. Wu, “Localized thin-section ct with radiomics feature extraction and machine learning to classify early-detected pulmonary nodules from lung cancer screening,” Phys. Med. Biol., vol. 63, 065005, 2018, http://dx.doi.org/10.1088/1361-6560/aaafab. Search in Google Scholar PubMed
[8] J. Yang, H. Wang, C. Geng, Y. Dai, and J. Ji, “Advances in intelligent diagnosis methods for pulmonary ground-glass opacity nodules,” BioMed. Eng. OnLine, vol. 17, no. 1, 20, 2018, http://dx.doi.org/10.1186/s12938-018-0435-2. Search in Google Scholar PubMed PubMed Central
[9] J. Uthoff, M. J. Stephens, J. D. Newell, E. A. Hoffman, J. Larson, N. Koehn, et al., “Machine learning approach for distinguishing malignant and benign lung nodules utilizing standardized perinodular parenchymal features from CT,” Med. Phys., vol. 46, no. 7, pp. 3207–3216, 2019, http://dx.doi.org/10.1002/mp.13592. Search in Google Scholar PubMed PubMed Central
[10] A. Yamada, A. Teramoto, M. Hoshi, H. Toyama, K. Imaizumi, K. Saito, and H. Fujita, “Hybrid scheme for automated classification of pulmonary nodules using pet/CT images and patient information,” Appl. Sci., vol. 10, no. 2, 4225, 2020, http://dx.doi.org/10.3390/app10124225. Search in Google Scholar
[11] K. Chen, Y. Nie, S. Park, K. Zhang, Y. Zhang, Y. Liu, et al., “Development and validation of machine learning-based model for the prediction of malignancy in multiple pulmonary nodules: Analysis from multicentric cohorts,” Clin. Cancer Res., vol. 27, no. 8, pp. 2255–2265, 2021, http://dx.doi.org/10.1158/1078-0432.ccr-20-4007. Search in Google Scholar
[12] M. Liu, Z. Zhou, F. Liu, M. Wang, Y. Wang, M. Gao, et al., “Ct and CEA-based machine learning model for predicting malignant pulmonary nodules,” Cancer Sci., vol. 113, no. 12, pp. 4363–4373, 2022. http://dx.doi.org/10.1111/cas.15561. Search in Google Scholar PubMed PubMed Central
[13] H. Wang, T. Zhao, L. C. Li, H. Pan, W. Liu, H. Gao, et al., “A hybrid CNN feature model for pulmonary nodule malignancy risk differentiation,” J. X-Ray Sci. Tech., vol. 26, no. 2, pp. 171–187, 2017. http://dx.doi.org/10.3233/xst-17302. Search in Google Scholar PubMed
[14] Q. Dou, H. Chen, L. Yu, J. Qin, and P.-A. Heng, “Multilevel contextual 3-D CNNs for false positive reduction in pulmonary nodule detection,” IEEE Trans. Biomed. Eng., vol. 64, no. 7, 2017, pp. 1558–1567, http://dx.doi.org/10.1109/tbme.2016.2613502. Search in Google Scholar PubMed
[15] H. Jin, Z. Li, R. Tong, and L. Lin, “A deep 3D residual CNN for false-positive reduction in pulmonary nodule detection,” Med. Phys., vol. 45, no. 5, pp. 2097–2107, 2018. http://dx.doi.org/10.1002/mp.12846. Search in Google Scholar PubMed
[16] X. Feng, J. Yang, A. F. Laine, and E. D. Angelini, “Discriminative localization in cnns for weakly-supervised segmentation of pulmonary nodules,” Multimodal Brain Image Anal., vol. 10435, pp. 568–576, 2017. http://dx.doi.org/10.1007/978-3-319-66179-7_65. Search in Google Scholar PubMed PubMed Central
[17] X. Zhao, S. Qi, B. Zhang, H. Ma, W. Qian, Y. Yao, and J. Sun, “Deep CNN models for pulmonary nodule classification: Model modification, model integration, and transfer learning,” J. X-Ray Sci. Tech., vol. 27, no. 4, pp. 615–629, 2019, http://dx.doi.org/10.3233/xst-180490. Search in Google Scholar
[18] B.-C. Kim, J. S. Yoon, J.-S. Choi, and H.-I. Suk, “Multi-scale gradual integration cnn for false positive reduction in pulmonary nodule detection,” Neural Netw., vol. 115, no., pp. 1–10, 2019, http://dx.doi.org/10.1016/j.neunet.2019.03.003. Search in Google Scholar PubMed
[19] Y. Xu, S. Wang, X. Sun, Y. Yang, J. Fan, W. Jin, et al., “Identification of benign and malignant lung nodules in CT images based on ensemble learning method,” Interdiscipl. Sci. Comput. Life Sci., vol. 14, no. 1, pp. 130–140, 2022, http://dx.doi.org/10.1007/s12539-021-00472-1. Search in Google Scholar PubMed
[20] H. Yuan, Z. Fan, Y. Wu, and J. Cheng, “An efficient multi-path 3D convolutional neural network for false-positive reduction of pulmonary nodule detection,” Int. J. Comput. Assisted Radiol. Surgery, vol. 16, pp. 2269–2277, 2021, http://dx.doi.org/10.1007/s11548-021-02478-y. Search in Google Scholar PubMed
[21] A. Nibali, Z. He, and D. Wollersheim, “Pulmonary nodule classification with deep residual networks,” Int. J. Comput. Assist. Radiol. Surgery, vol. 12, pp. 1799–1808, 2017. 10.1007/s11548-017-1605-6Search in Google Scholar PubMed
[22] W. Shen, M. Zhou, F. Yang, C. Yang, and J. Tian, “Multi-scale convolutional neural networks for lung nodule classification,” in Information Processing in Medical Imaging: 24th International Conference, IPMI 2015, Sabhal Mor Ostaig, Isle of Skye, UK, June 28–July 3, 2015, Proceedings 24. Springer, 2015, pp. 588–599. 10.1007/978-3-319-19992-4_46Search in Google Scholar PubMed
[23] G. Zhang, D. Zhu, X. Liu, M. Chen, L. Itti, Y. Luo, and J. Lu, “Multi-scale pulmonary nodule classification with deep feature fusion via residual network,”, J. Ambient Intel. Humanized Comput., vol. 14, pp. 1–12, 2023. Search in Google Scholar
[24] Y. Wang, H. Zhang, K. J. Chae, Y. Choi, G. Y. Jin, and S.-B. Ko, “Novel convolutional neural network architecture for improved pulmonary nodule classification on computed tomography,” Multidimen. Syst. Signal Proces., vol. 31, pp. 1163–1183, 2020. 10.1007/s11045-020-00703-6Search in Google Scholar
[25] Y. Zhang, J. Zhang, L. Zhao, X. Wei, and Q. Zhang, “Classification of benign and malignant pulmonary nodules based on deep learning,” in 2018 5th International Conference on Information Science and Control Engineering (ICISCE). IEEE, 2018, pp. 156–160. 10.1109/ICISCE.2018.00042Search in Google Scholar
[26] X. Huo, G. Sun, S. Tian, Y. Wang, L. Yu, J. Long, et al., “Hifuse: Hierarchical multiscale feature fusion network for medical image classification,” Biomed. Signal Proces. Control, vol. 87, p. 105534, 2024. 10.1016/j.bspc.2023.105534Search in Google Scholar
[27] Z. Ding, H. Li, Y. Guo, D. Zhou, Y. Liu, and S. Xie, “M4fnet: Multimodal medical image fusion network via multi-receptive-field and multiscale feature integration,” Comput. Biol. Med., vol. 159, p. 106923, 2023. 10.1016/j.compbiomed.2023.106923Search in Google Scholar PubMed
[28] O. N. Manzari, H. Ahmadabadi, H. Kashiani, S. B. Shokouhi, and A. Ayatollahi, “Medvit: a robust vision transformer for generalized medical image classification,” Comput. Biol. Med., vol. 157, p. 106791, 2023. 10.1016/j.compbiomed.2023.106791Search in Google Scholar PubMed
© 2025 the author(s), published by De Gruyter
This work is licensed under the Creative Commons Attribution 4.0 International License.
Articles in the same Issue
- Review Article
- Enhancing IoT network security: a literature review of intrusion detection systems and their adaptability to emerging threats
- Research Articles
- Intelligent data collection algorithm research for WSNs
- A novel behavioral health care dataset creation from multiple drug review datasets and drugs prescription using EDA
- Speech emotion recognition using long-term average spectrum
- PLASMA-Privacy-Preserved Lightweight and Secure Multi-level Authentication scheme for IoMT-based smart healthcare
- Basketball action recognition by fusing video recognition techniques with an SSD target detection algorithm
- Evaluating impact of different factors on electric vehicle charging demand
- An in-depth exploration of supervised and semi-supervised learning on face recognition
- The reform of the teaching mode of aesthetic education for university students based on digital media technology
- QCI-WSC: Estimation and prediction of QoS confidence interval for web service composition based on Bootstrap
- Line segment using displacement prior
- 3D reconstruction study of motion blur non-coded targets based on the iterative relaxation method
- Overcoming the cold-start challenge in recommender systems: A novel two-stage framework
- Optimization of multi-objective recognition based on video tracking technology
- An ADMM-based heuristic algorithm for optimization problems over nonconvex second-order cone
- A multiscale and dual-loss network for pulmonary nodule classification
- Artificial intelligence enabled microgrid power generation prediction
- Special Issue on AI based Techniques in Wireless Sensor Networks
- Blended teaching design of UMU interactive learning platform for cultivating students’ cultural literacy
- Special Issue on Informatics 2024
- Analysis of different IDS-based machine learning models for secure data transmission in IoT networks
- Using artificial intelligence tools for level of service classifications within the smart city concept
- Applying metaheuristic methods for staffing in railway depots
- Interacting with vector databases by means of domain-specific language
- Data analysis for efficient dynamic IoT task scheduling in a simulated edge cloud environment
- Analysis of the resilience of open source smart home platforms to DDoS attacks
- Comparison of various in-order iterator implementations in C++