Verification of the T50 Calciprotein Crystallization test: bias estimation and interferences
-
Joyce Y. Xu

 ,
Didier Falconnet
,
Didier Falconnet

Abstract
Objectives
The T50 Calciprotein Crystallization test (T50 test) is a novel blood-based in vitro diagnostic assay that determines the calciprotein crystallization time in patients. It is based on the one-half maximum transition time of calciprotein particle 1 (CPP1) to calciprotein particle 2 (CPP2) in serum, as detected by nephelometry. To date, the T50 test has only been performed at Calciscon AG, where the assay has been developed and is manufactured. The aim of this study was to compare the agreement and precision of the T50 test in a routine clinical laboratory. Additionally, the interference of free hemoglobin, bilirubin, lipid and low molecular weight heparin (LMWH) was analyzed in the T50 test.
Methods
Serum samples were measured at both laboratory sites to determine the agreement. The CLSI EP15-A3 protocol was used to evaluate the precision. Interference was analyzed by spiking pooled serum samples with interfering analytes.
Results
Both laboratories showed excellent agreement in the T50 values (y=1.002x-4). Furthermore, high precision was observed for the clinically relevant lower range of T50 with a total variation coefficient of 6.4 %. Serum samples with mid and higher ranges of T50 failed the CLSI precision criteria with a total variance of 10.1 % and 6.2 %, respectively. Lastly, no interferences were observed within the normally observed clinical serum concentrations of free hemoglobin, bilirubin, lipid, and LMWH.
Conclusions
The T50 test was successfully implemented in a routine laboratory setting. Additionally, the precision and interference observed in this study largely agreed with the manufacturer’s claims.
Introduction
Vascular calcification is a common complication in patients with chronic kidney disease (CKD), specifically in dialysis patients, and is a known strong predictor of cardiovascular risk. Calcification can manifest in the intimal layer of the blood vessels within the plaques of the arterial wall and in the medial layer where it contributes to vascular stiffness. The prevalence of vascular calcification is higher in patients with more advanced stages of CKD [1]. Furthermore, approximately 50 % of mortality in CKD stage 4 and 5 has a cardiovascular cause, partly driven by the high propensity for vascular calcification [2]. Currently, no tool is available in the clinic to treat vascular calcification, or to predict its development or risk of progression in patients.
The pathogenesis of medial vascular calcification is multifactorial. Disturbed homeostasis of minerals plays a prominent role. Phosphate is a known driver of vascular calcification in which hyperphosphatemia induces a phenotypic switch of vascular smooth muscle cells into bone-forming cells and may also initiate inflammation and endothelial dysfunction [3], 4].
To prevent mineral precipitation of calcium and phosphate, these minerals are chaperoned by circulating proteins, e.g. fetuin-A, leading to the formation of calciprotein particles (CPP) [5]. Initially, calciprotein monomers (CPM) are formed which consist of a single fetuin-A protein bound to clusters of calcium and phosphate. These CPMs merge with each other and form primary CPP (CPP1) which is an amorphous spherical particle in which the calcium and phosphate clusters are contained within the sphere [6], 7].
Under pathological conditions, the balance between pro-calcifying and anti-calcifying factors is disrupted. In CKD patients, elevated levels of calcium and phosphate remain constant and can overwhelm the mineral buffering capacity of anti-calcifying factors. In this setting, a transition from CPP1 to secondary CPP (CPP2) occurs. This secondary form has a needle-shaped, crystalline appearance and contains hydroxyapatite [6]. Recent studies have investigated the role of CPP2 in endothelial dysfunction, vascular inflammation, and calcification [8], [9], [10], [11].
In 2012, a novel in vitro diagnostic assay was introduced in which the calciprotein crystallization time was determined based on the one-half maximal transition time (T50) of CPP1 to CPP2 [12]. In this in vitro assay, also known as the T50 Calciprotein Crystallization test (T50 test), serum is exposed to high concentrations of phosphate and calcium and monitored over time under controlled assay conditions. A high T50, reflecting a long time before CPP2 is formed, indicates a lower calcification propensity score and presumably reflects protection against vascular calcification. In contrast, a low T50, reflecting a shorter time before CPP2 is formed, indicates a higher calcification propensity score and reflects higher risk of cardiovascular disease and mortality, as shown in several cohort studies with CKD patients and the general population [12], [13], [14], [15], [16]. These risk predictive properties have also been shown in other patient populations, including those diagnosed with ischemic heart failure with reduced ejection fraction [17], peripheral artery disease [18], type 2 diabetes mellitus [19], and systemic sclerosis [20].
The T50 test is a CE-marked IVD product which can be used in accredited medical laboratories. Currently, the official T50 test is available only at the laboratory of Calciscon AG (Bienne, Switzerland), the manufacturer of the assay. Extensive external validation or verification of the T50 test has not been reported in the literature, which hampers its widespread application.
Common interfering analytes in laboratory tests are free hemoglobin, bilirubin and lipids [21], [22]. The manufacturer claims that some degree of interference exists because of the high levels of free hemoglobin and lipids. Furthermore, patients treated with dialysis, a population in which the T50 test may find the earliest clinical application, are frequently administered heparin and low-molecular-weight heparin (LMWH) [23]. It is known that heparin and LMWH can lower plasma ionized calcium levels [24]. Since calcium is also involved in the formation of CPP, this may delay the transition from CPP1 to CPP2, thus falsely increasing the T50.
The aim of this study was to validate the T50 test in a routine clinical laboratory by assessing the agreement, precision, and interference from hemolysis, hyperbilirubinemia, lipemia, and heparin-based anticoagulants.
Materials and methods
Patient samples
Approval from the local Ethical Research Committee was obtained to collect random and anonymized leftover serum samples from routine diagnostics at the Amsterdam University Medical Centre, the Netherlands. Left-over serum samples from a broad range of patients within Amsterdam UMC were stored at 4 °C for three days before collection from the routine laboratory. Blinded serum samples were either pooled or used as single samples depending on the analysis, and stored at 4 °C before measurement of the T50 test.
T50 test setup and measurement
The T50 test setup at the laboratory site of the manufacturer (Calciscon AG) was used as the benchmark (laboratory site 1). Based on the methodology developed by the manufacturer (Figure 1), the T50 test was set up at the laboratory of the Amsterdam UMC (laboratory site 2). The T50 values were measured using the T50 testing kit provided by Calciscon AG. Measurements were performed according to the manufacturer’s instructions. The test protocol has been described in detail by Pasch, et al. [12] The T50 test setup consisted of an automated pipetting machine (Freedom EVOware LiHa, TECAN, Männedorf, Switzerland), an orbital shaker (BioShake 3,000 elm, QINSTRUMENTS, Jena, Germany), and a nephelometer (NEPHELOstar plus, BMG Labtech, Ortenberg, Germany). The T50 value was determined with the T50 Analysis Software using a four-parameter logistic regression according to the manufacturer’s instructions.
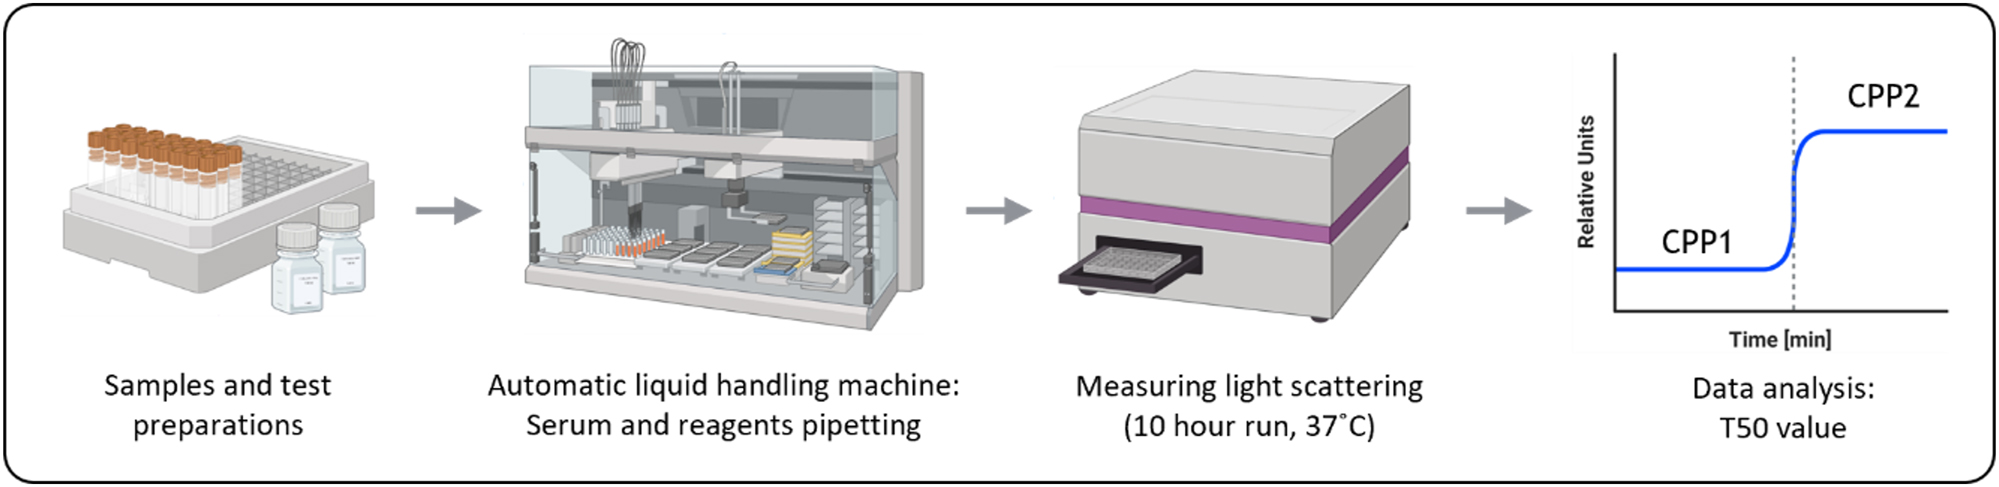
Testing principle for the T50 Calciprotein Crystallization test. Samples and reagents are prepared before pipetting them using an automatic liquid handling machine. Afterwards, the light scattering of the samples is measured. This measuring step has a duration of at least 600 min. Once the data is collected, it will be analyzed to determine the T50. Created with BioRender.com.
Laboratory site comparison (agreement)
The T50 test setup at the clinical laboratory of the Amsterdam UMC was compared to that of the manufacturer to estimate the bias between both sites. The T50 measurements were compared using 21 samples which were split into two vials – one vial for each laboratory site. The samples were shipped to Calciscon AG with ice packs. Measurements at both sites were conducted on the same day in triplicate by different operators. All samples were processed according to the manufacturer’s instructions.
Precision analysis
The precision of the T50 test was determined at the Amsterdam UMC according to the CLSI EP15-A3 protocol. The protocol specifies the use of two samples at different levels which are measured over five days, measuring once or twice a day based on the test duration. Due to the 10-h duration of the T50 test, the measurement was only performed once per day.
In this study, a third sample was measured in addition to the two samples instructed by the CLSI protocol. Pooled serum samples were used with three different ranges: low T50 (<270 min), mid T50 (∼350 min), and high T50 (>470 min). These ranges were determined based on the reference range for the T50 test (270–470 min). To obtain sufficient material for multiple testing days, the T50 values from individual serum samples were measured and pooled accordingly to form pooled samples at the three ranges. Pooled serum samples were aliquoted (500 µL), stored at 4 °C, and used within 7 days.
The three pooled serum samples were measured in four-fold over five consecutive days, alternating between two operators. The first day measurement was immediately on the same day when the serum samples were pooled. The coefficient of variation (CV%) and standard deviation (SD) were determined for each pooled sample for each day, and tested for the 95 % verification value based on the precision claims by the manufacturer for samples with similar T50 ranges (Table 1). The manufacturer provided their validated precision for within-run (Swithin) and between-run (Sbetween) measurements. The Swihtin and total precision (Stotal) were used for verification of precision. The reason for using the total error is based on the assumption within the CLSI protocol in which it states that if the bias and estimated precision are acceptable, then the total error will also be acceptable [25]. The Sbetween was converted to Stotal using the following formula:
Analytical deviation and errors of the T50 test compared to the verification value.
| Level | Precision analysis results | Manufacturer claims | Verification value | ||||
|---|---|---|---|---|---|---|---|
| Swithin | Stotal | Swithin | Stotal | Swithin | Stotal | ||
| Low <270 min |
SD | 8.6 | 11.0 | 8 | 16.1 | 10.8 | 25.7 |
| CV% | 5.0 | 6.4 | 3.2 | 6.3 | |||
| Mid ∼350 min |
SD | 32.5 | 38.3 | 11 | 16.3 | 14.9 | 25.9 |
| CV% | 8.6 | 10.1 | 3.1 | 4.6 | |||
| High >470 min |
SD | 30.2 | 29.1 | 8 | 12.0 | 10.8 | 19.2 |
| CV% | 6.4 | 6.2 | 1.9 | 2.8 | |||
-
SD, standard deviation; CV%, coefficient of variation percentage; Swithin, within run standard error; Stotal, total standard error; Sbetween, between run standard error.
Interference analysis
Possible interferences with the T50 test were studied at the Amsterdam UMC by spiking pooled serum samples with serial dilutions of bilirubin, free hemoglobin, triglycerides, and LMWH. The T50 value was then determined for each spiked sample. The interference was studied using three different serum pools. For the T50 test, a deviation of ±10 % is accepted, similar to the manufacturer’s report. Therefore, interference was established for each analyte when the measurement deviated by>10 % from the control sample.
Bilirubin solution was prepared by dissolving bilirubin, 98+% (Thermo Fisher Scientific, Waltham, MA, USA) in 0.1 M NaOH. The solution was added to the serum pool to prepare a highly icteric serum sample with a concentration of approximately 1,000 μmol/L which was further diluted to obtain other concentrations, with the lowest concentration being approximately 20 μmol/L. In total, six bilirubin concentrations were analyzed. The icterus index and total bilirubin concentration were measured using the Roche Cobas Pro (Roche Diagnostics, Basel, Switzerland).
The effect of hemolysis on the T50 measurement was determined by spiking the serum sample with hemolysate and serially diluting (1:1) the sample to obtain eight samples ranging from approximately 0.005 mmol/L to 0.5 mmol/L hemoglobin. Hemolysate was prepared from EDTA plasma samples with a hemoglobin concentration equal to or higher than 10 mmol/L. Plasma was centrifuged and washed with ddH2O. The washed cells were resuspended in ddH2O and frozen overnight at −20 °C to lyse the cells. The hemolysate was separated from the cell debris and stored at −80 °C until use. After spiking the serum samples, the hemoglobin concentration of the hemolysate and the highest hemolyzed serum sample were measured using Sysmex XN-9000 (Sysmex Corporation, Kobe, Japan). The hemoglobin concentrations of the other spiked samples were calculated based on the highest hemolyzed sample. Additionally, the hemolysis index of all spiked samples was measured using the Roche Cobas Pro.
Lipemia interference was studied using Intralipid® 10 % (Fresenius Kabi, Bad Homburg, Germany) creating eight lipemic serum samples ranging from approximately 2 to 20 mmol/L triglycerides. Lipemia index and triglyceride concentration were measured using the Roche Cobas Pro.
Interference of heparin was assessed with a focus on LMWH as this anticoagulant is often used in dialysis care. Fraxiparine (Viatris Inc., Canonsburg, PA, USA) was serially diluted with the pooled serum to obtain eight different concentrations ranging from 0.06 IU/mL to approximately 2.0 IU/mL LMWH. The concentration was determined by measuring the anti-Xa on the Sysmex CS-2500 (Sysmex Corporation, Kobe, Japan).
Statistical analyses
All T50 measurements in this study were performed in triplicate unless otherwise described. The mean, SD, and CV% of the T50 measurements were calculated. The method comparison data were evaluated by determining the slope and y-intercept of the Passing Bablok regression analysis with a two-sided 95 % confidence interval (CI). Additionally, a Bland-Altman plot was used to determine the absolute (minutes) and percentage bias between the two laboratory sites. For interference analysis, the percentage deviation of the T50 value was determined using the non-spiked sample as the control. For each analyte, the data points were plotted in an XY graph based on the specific analyte concentration and the percentage deviation. A simple linear regression analysis was performed to determine the upper concentration limit before interference. All analyses were performed using EP Evaluator (Version 12.3.0.2, Data Innovations LLC), GraphPad Prism (Version 10.2.0), and R (Version 4.3.2).
Results
Setting up T50 test
Initially, during the setup phase, a large difference in the T50 test results was noted between the two laboratory sites. In addition, large and multiple air bubbles were present in the wells after pipetting, which interfered with the nephelometric measurement. This led to a detailed search for differences in hardware and sample handling. Differences in the automated pipettors were noted. While the Freedom EVOware automatic pipetting machine was used at both sites, the liquid handling system within the machine was different: laboratory site one was air-based (Air LiHa), and laboratory site two was liquid-based (LiHa). In addition, different pipetting tips were used with wider pipette-tip orifices at site two.
Adjustments in liquid handling variables proved to be important for obtaining highly comparable outcomes at both sites. First, for handling serums samples with the LiHa system, the dispensing speed was increased by 20 % compared to the manufacturer’s protocol. Reagents were handled slower with a decrease of 40 % and 70 % for the aspirating and dispensing speed, respectively. The break-off speed was decreased by 62.5 %. Lastly, a system trailing air gap (STAG) was included with the LiHa system to prevent contamination with the system liquid.
The second hardware device required for the T50 test is a nephelometer. At both locations the NEPHELOstar was used, but at laboratory site 2, a newer version was used (NEPHLOstar plus) which has a more powerful laser. An increase in relative nephelometric unit (RNU) was observed at site 2 (Figure 2C and D); however, this increase in RNU did not influence the T50 values.
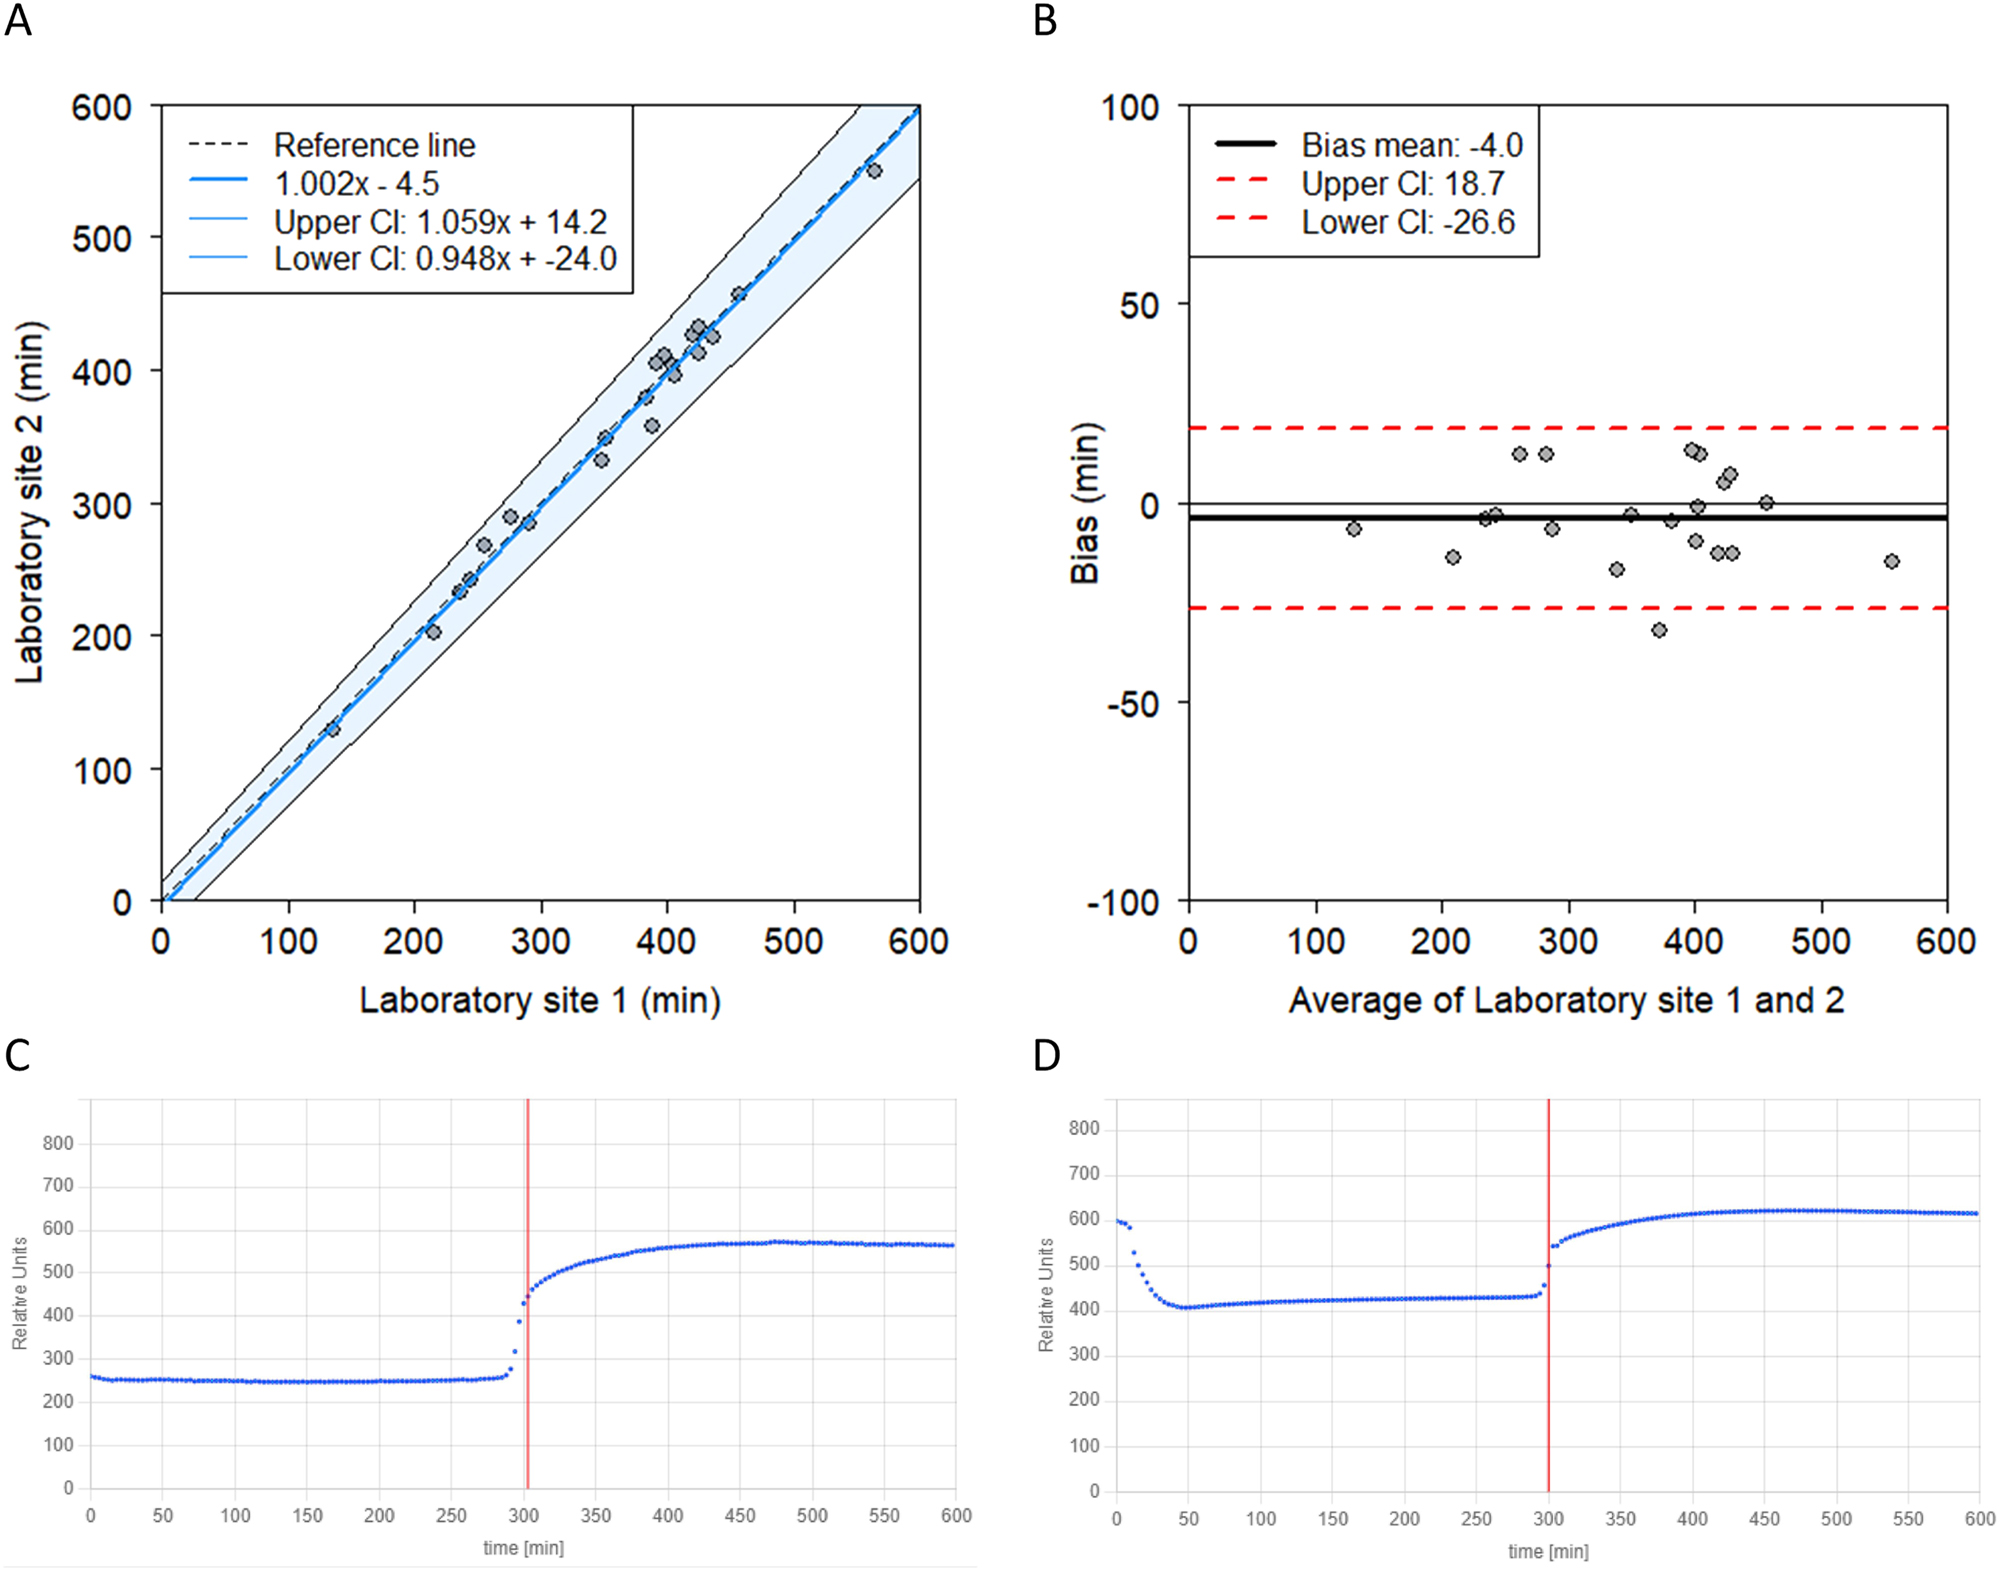
Laboratory sites comparison. (A) Passing-Bablok regression demonstrating a strong agreement between two laboratory sites including the identity line and 95 % confidence interval for the regression line. (B) Bland-Altman plot between the two laboratory sited demonstrating a small mean bias of −4.0 min (−1.3 %). (C) The T50 curve of laboratory site 1 (manufacturer) in which a sigmoid curve can be observed. (D) In the T50 curve of laboratory site 2 a drop at the beginning of the graph can be seen. Additionally, higher RNU (y-axis) is measured compared to site one despite using the same sample. This initial drop and higher RNU did not affect the T50.
Laboratory comparison
After aligning the methodology as described above, a close agreement was observed between the laboratory sites (Figure 2). Passing-Bablok regression showed a high correlation coefficient of 0.993. The y-intercept indicated a non-significant bias (−4.5; 95 % CI = −24.0 – 14.2). The slope of the regression was not significantly different from 1 (1.002; 95 % CI=0.948–1.059), indicating no difference between the laboratory sites (Figure 2A). Similarly, the Bland-Altman plot also showed no significant bias between the laboratories (Figure 2B).
A difference in the T50 curves was observed between the laboratories. A higher RNU was measured at site two compared to site one when measuring the same sample, but this did not affect the T50 (Figure 2C and D). Furthermore, a drop at the beginning of the curve was observed in the majority of the T50 curves obtained at site 2. This curve deviates from the expected S-shaped curves as observed at site 1. Adjustments in the setting for liquid handling did not resolve this drop. Nonetheless, when comparing the results between the laboratory sites, the drop did not appear to affect the T50 result, as the outcomes at both sites were comparable.
Precision of T50
The performance of the T50 test was analyzed based on the Swithin for each day and Stotal. The CV% and errors for the three T50 levels are listed in Table 1. The results of the measurements at laboratory site two showed that the Swithin and Stotal for the low T50 sample were within the acceptance criteria. In contrast, the standard errors for the mid and high T50 samples did not meet the acceptance criteria.
Interference analysis
The concentrations until interference for free hemoglobin, triglycerides, and LMWH established in this study were similar to or higher than the concentrations claimed by the manufacturer (Table 2).
Overview of specific analytes and the normal ranges found in the general population and patients, together with the interference ranges found in this study and claimed by the manufacturer.
| Normal ranges | Interference ranges | ||
|---|---|---|---|
| Manufacturer | This study | ||
| Bilirubin icteric, µmol/L | 3–24 | – | >2085 |
| Free hemoglobin hemolysis, mmol/L | <0.2 | >0.19 | >0.18 |
| Triglyceride lipidemia, mmol/L | <2 | >11.3 | >19.56 |
| LMWH, IU/mL | 0.3–0.7 | >3.0 | >4.35 |
No clinically meaningful changes were found for potential interference by bilirubin, free hemoglobin, triglyceride, and LMWH within the normal ranges (Figure 3). For bilirubin and LMWH no critical changes were detected at the highest tested concentrations. Based on linear regression analysis, the calculated hypothetical interference concentrations were 2085 μmol/L for bilirubin and 4.35 IU/mL for LMWH. Bilirubin showed a trend with a negative coefficient which indicates that samples with extremely, unphysiologically high bilirubin concentrations will have a lower T50 compared to the true T50. As for LMWH, a positive coefficient was detected indicating that samples with extremely high LMWH concentrations will have a higher T50 compared to the true T50. Hemoglobin and triglyceride did demonstrate some interference starting from 0.18 mmol/L and 19.56 mmol/L, respectively. For both, a negative coefficient was observed.
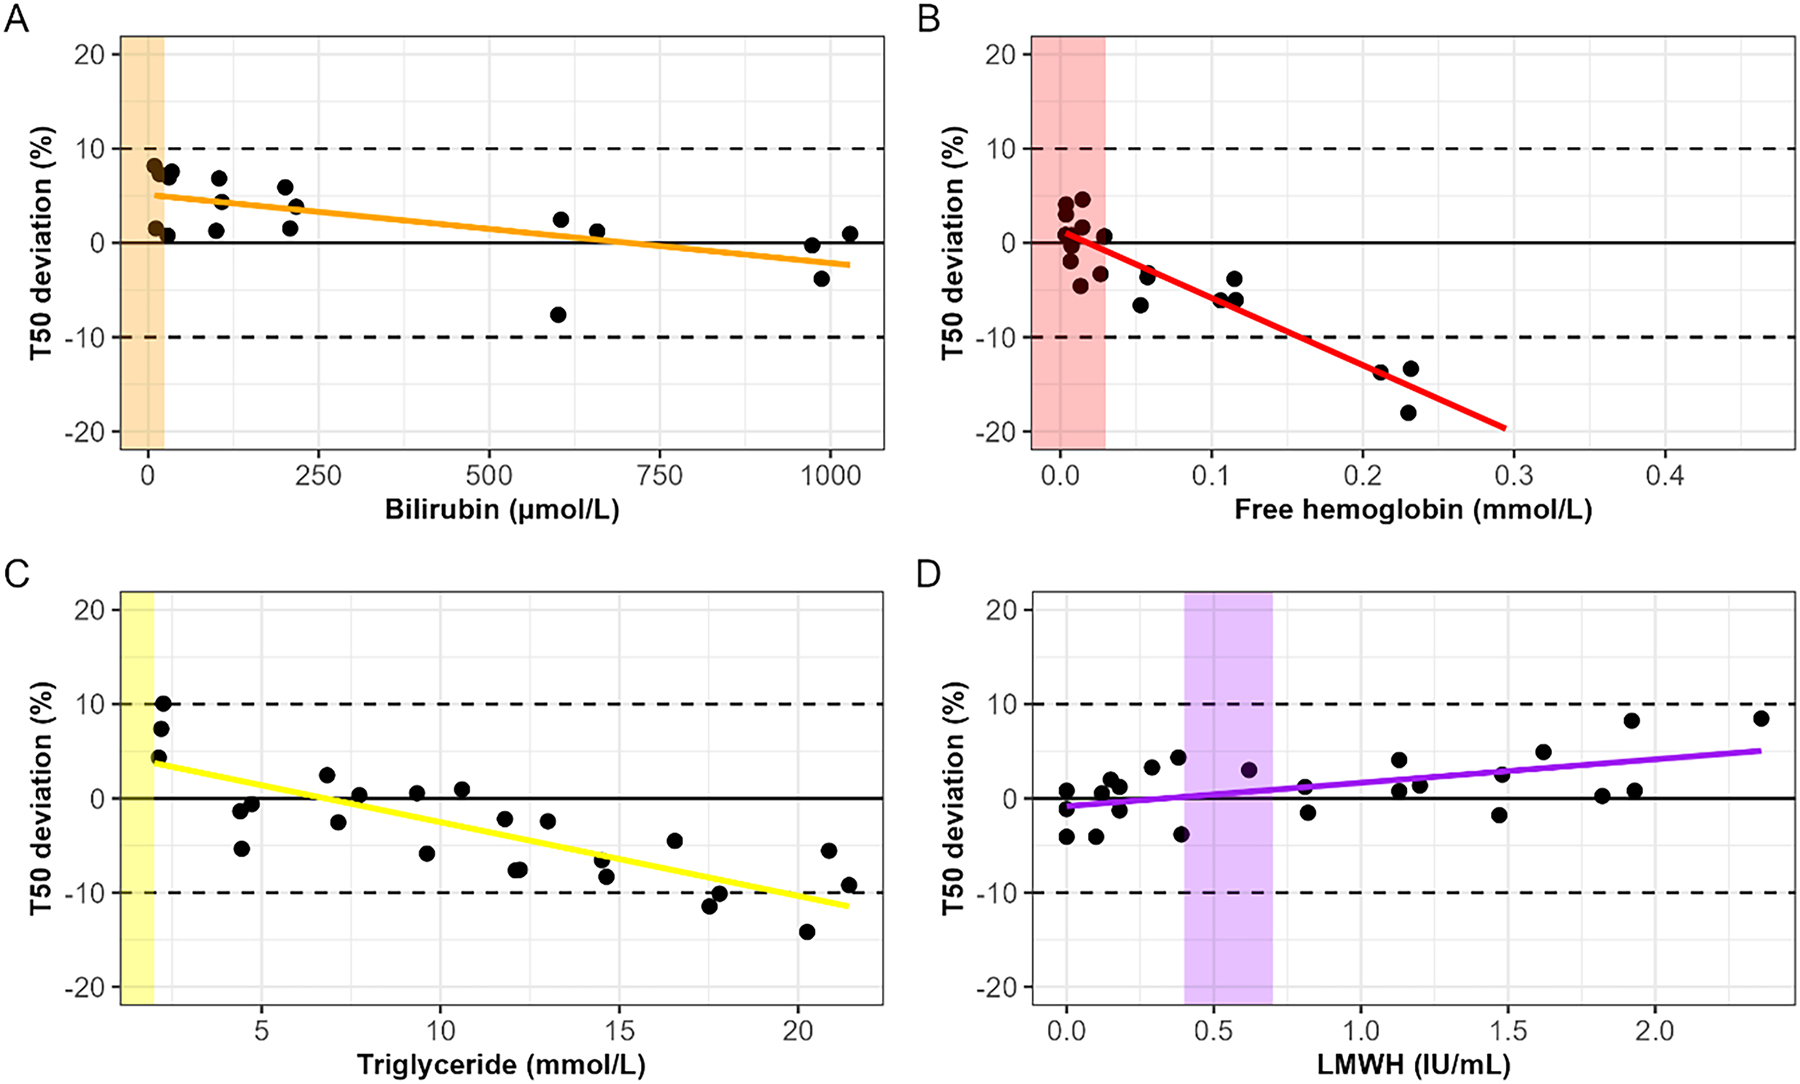
Interference of (A) bilirubin, (B) free hemoglobin, (C) triglyceride, and (D) LMWH on the T50 test presented as percentage difference from baseline (non-spiked sample). Dotted lines are showing the 10 % deviation. The colored areas show the normal expected values in clinical practice. A linear regression shows the trend of deviation of the T50 for each analyte.
Discussion
Our study demonstrated a high level of agreement in T50 measurements between the two laboratory sites with a non-significant bias. This indicates a successful implementation of the T50 test in an external laboratory besides the manufacturer’s laboratory site. With regard to precision, the T50 test demonstrated comparable precision to that claimed by the manufacturer for samples with a low T50. Furthermore, no interference was observed in the clinically relevant ranges of free hemoglobin, bilirubin, and triglycerides. Moreover, for LMWH, no interference was observed in the clinically relevant ranges frequently used during dialysis treatment.
While the criterion for precision was met for the lower range of T50, samples with a mid or high T50 value failed the verification values. The within-run variance and total variance for both levels were approximately two to three times higher than the verification value. It can be speculated that a longer reaction time can lead to more analytical variation, because external factors have more time to influence the reaction. However, the exact cause remains elusive. The T50 test is suggested to be applied to tailor treatment, especially when the T50 is below 270 min. Thus, high precision at the lower range of T50 is likely to have more clinical relevance when compared to the higher range of T50. The lower range reflects higher cardiovascular risk and might be an incentive to change clinical management.
The setup of the T50 test in our laboratory required technical refinements. The methodology of liquid handling during pipetting has emerged as a major factor influencing the T50 test. Adjustments were required due to differences in the liquid handling systems, and the pipetting needles between the two sites. Furthermore, the increase in RNU at laboratory site two was likely related to the increased intensity of the laser in the nephelometer. However, this increase did not influence the T50 value, because the unit of T50 is solely based on the transition time (x-axis values) visualized by the change of the scatter pattern, and not on the intensity of the measured light scattering (y-axis values). As for the drop at the beginning of the curve, no definite explanation was found. Nevertheless, this drop did not affect the T50 values, as demonstrated by the comparative analysis between the two laboratory sites.
Based on the literature, the T50 test was set up at three other external laboratories besides the one described in this study [26], [27], [28], [29], [30]. At all these locations, the T50 test was conducted based on the report by Pasch, et al. describing the T50 test [12]. Two locations reported the precision of the test in the laboratory. Nakatani et al. reported an inter- and intra-assay CV% for healthy individuals of 4.4 % and 4.5 %, respectively. For samples from hemodialysis patients, the study reported inter- and intra-assay CV% of 3.2 % and 4.5 %, respectively [26]. Kim et al. reported a CV% of 9.8 %, 8.7 %, and 8.4 % for samples with T50 values of 120, 240, and 360 min, respectively [27]. In another report, it was stated that the T50 test has also been validated against the gold standard measurement at Calciscon AG [28]. However, no data have been reported on the validation of the T50 test.
Currently, samples are sent to Calciscon AG for T50 measurements for research purposes and are often shipped frozen [15], [20], [31], [32], [33]. For clinical practice, non-frozen samples are required according to the protocol and must be measured within 10 days when stored at 2–8 °C. To increase the availability of this novel diagnostic tool, the test can be set up in locally accredited laboratories. This study demonstrated the successful implementation of the T50 test outside of the manufacturer’s setting. This is a condition for potential future widespread application in clinical practice of the T50 test as either a risk predictor or a treatment goal.
Another method to determine calcification propensity is the quantification of CPP in serum. Different techniques have been reported for CPP quantification including flow cytometry-based [34], [35] and a fluorescence-based method [36]. CPP quantification and the T50 test can be utilized for different purposes. The T50 reflects the mineral buffering capacity, whereas quantifying CPP gives more information about the actual CPP count. Currently, only the T50 test has been validated in contrast to CPP quantification techniques.
This study has several strengths. This is the first study to describe the setup and verification of the T50 test in close collaboration with Calciscon AG. Additionally, verification was performed with non-frozen samples measured at the external laboratory site and the manufacturer site which is the gold standard for T50. Finally, with the expertise of clinical chemists at the Amsterdam UMC, an extensive evaluation of interfering factors that emerged as relevant to measure T50 was conducted. A limitation of this study is the mechanical differences between the pipetting robots at the two laboratory sites. However, similar results can be obtained with the correct fine-tuning of the settings.
With this, the next steps are to further analyze the features of the T50, such as the effect of serum storage conditions and freeze-thawing, followed by clinical application and treatment options targeting T50 to decrease cardiovascular risk in patients. Furthermore, other factors that potentially modify T50 measurements should be investigated such as circadian rhythm and food consumption. Additionally, the T50 test might be applicable to other patient populations with a high risk for vessel stiffening and medial vascular calcifications, in addition to patients with CKD.
Funding source: Eurostars
Award Identifier / Grant number: E!1738
-
Research ethics: Not applicable.
-
Informed consent: Not applicable.
-
Author contributions: All authors have accepted responsibility for the entire content of this manuscript and approved its submission.
-
Use of Large Language Models, AI and Machine Learning Tools: None declared.
-
Conflict of interest: Calciscon AG holds patent rights in the T50 Calciprotein Crystallization test and is marketing the T50 test. During the execution of the study, DF and SR are employes of Calciscon AG. VL is a stockholder and an employee of Calciscon AG. AP is the inventor of the T50 test, and founder, stockholder and employee of Calciscon AG. All other authors state no conflict of interest.
-
Research funding: This study is supported by the CalProtect consortium funded by Eurostars (E!1738). CalProtect consortium members are Amsterdam UMC, Calciscon AG, and Admesy BV.
-
Data availability: Not applicable.
References
1. Palit, S, Kendrick, J. Vascular calcification in chronic kidney disease: role of disordered mineral metabolism. Curr Pharm Des 2014;20:5829–33. https://doi.org/10.2174/1381612820666140212194926.Suche in Google Scholar PubMed PubMed Central
2. Gansevoort, RT, Correa-Rotter, R, Hemmelgarn, BR, Jafar, TH, Heerspink, HJ, Mann, JF, et al.. Chronic kidney disease and cardiovascular risk: epidemiology, mechanisms, and prevention. Lancet 2013;382:339–52. https://doi.org/10.1016/s0140-6736-13-60595-4.Suche in Google Scholar
3. Sprague, SM, Martin, KJ, Coyne, DW. Phosphate balance and CKD-mineral bone disease. Kidney Int Rep 2021;6:2049–58. https://doi.org/10.1016/j.ekir.2021.05.012.Suche in Google Scholar PubMed PubMed Central
4. Yoshida, T, Yamashita, M, Hayashi, M. Kruppel-like factor 4 contributes to high phosphate-induced phenotypic switching of vascular smooth muscle cells into osteogenic cells. J Biol Chem 2012;287:25706–14. https://doi.org/10.1074/jbc.m112.361360.Suche in Google Scholar PubMed PubMed Central
5. Koppert, S, Buscher, A, Babler, A, Ghallab, A, Buhl, EM, Latz, E, et al.. Cellular clearance and biological activity of calciprotein particles depend on their maturation state and crystallinity. Front Immunol 2018;9:1991. https://doi.org/10.3389/fimmu.2018.01991.Suche in Google Scholar PubMed PubMed Central
6. Kutikhin, AG, Feenstra, L, Kostyunin, AE, Yuzhalin, AE, Hillebrands, JL, Krenning, G. Calciprotein particles: balancing mineral homeostasis and vascular pathology. Arterioscler Thromb Vasc Biol 2021;41:1607–24. https://doi.org/10.1161/atvbaha.120.315697.Suche in Google Scholar PubMed PubMed Central
7. Westenfeld, R, Schafer, C, Kruger, T, Haarmann, C, Schurgers, LJ, Reutelingsperger, C, et al.. Fetuin-A protects against atherosclerotic calcification in CKD. J Am Soc Nephrol 2009;20:1264–74. https://doi.org/10.1681/ASN.2008060572.Suche in Google Scholar PubMed PubMed Central
8. Feenstra, L, Kutikhin, AG, Shishkova, DK, Buikema, H, Zeper, LW, Bourgonje, AR, et al.. Calciprotein particles induce endothelial dysfunction by impairing endothelial nitric oxide metabolism. Arterioscler Thromb Vasc Biol 2023;43:443–55. https://doi.org/10.1161/atvbaha.122.318420.Suche in Google Scholar PubMed PubMed Central
9. Shishkova, DK, Velikanova, EA, Bogdanov, LA, Sinitsky, MY, Kostyunin, AE, Tsepokina, AV, et al.. Calciprotein particles link disturbed mineral homeostasis with cardiovascular disease by causing endothelial dysfunction and vascular inflammation. Int J Mol Sci 2021;22. https://doi.org/10.3390/ijms222212458.Suche in Google Scholar PubMed PubMed Central
10. Aghagolzadeh, P, Bachtler, M, Bijarnia, R, Jackson, C, Smith, ER, Odermatt, A, et al.. Calcification of vascular smooth muscle cells is induced by secondary calciprotein particles and enhanced by tumor necrosis factor-alpha. Atherosclerosis 2016;251:404–14. https://doi.org/10.1016/j.atherosclerosis.2016.05.044.Suche in Google Scholar PubMed
11. Viegas, CSB, Santos, L, Macedo, AL, Matos, AA, Silva, AP, Neves, PL, et al.. Chronic kidney disease circulating calciprotein particles and extracellular vesicles promote vascular calcification: a role for grp (Gla-Rich protein). Arterioscler Thromb Vasc Biol 2018;38:575–87. https://doi.org/10.1161/atvbaha.117.310578.Suche in Google Scholar
12. Pasch, A, Farese, S, Graber, S, Wald, J, Richtering, W, Floege, J, et al.. Nanoparticle-based test measures overall propensity for calcification in serum. J Am Soc Nephrol 2012;23:1744–52. https://doi.org/10.1681/asn.2012030240.Suche in Google Scholar
13. Lorenz, G, Steubl, D, Kemmner, S, Pasch, A, Koch-Sembdner, W, Pham, D, et al.. Worsening calcification propensity precedes all-cause and cardiovascular mortality in haemodialyzed patients. Sci Rep 2017;7:13368. https://doi.org/10.1038/s41598-017-12859-6.Suche in Google Scholar PubMed PubMed Central
14. Pasch, A, Block, GA, Bachtler, M, Smith, ER, Jahnen-Dechent, W, Arampatzis, S, et al.. Blood calcification propensity, cardiovascular events, and survival in patients receiving hemodialysis in the EVOLVE trial. Clin J Am Soc Nephrol 2017;12:315–22. https://doi.org/10.2215/cjn.04720416.Suche in Google Scholar
15. Zawada, AM, Wolf, M, Rincon Bello, A, Ramos-Sanchez, R, Hurtado Munoz, S, Ribera Tello, L, et al.. Assessment of a serum calcification propensity test for the prediction of all-cause mortality among hemodialysis patients. BMC Nephrol 2023;24:35. https://doi.org/10.1186/s12882-023-03069-6.Suche in Google Scholar PubMed PubMed Central
16. Eelderink, C, Te Velde-Keyzer, CA, Frenay, AS, Vermeulen, EA, Bachtler, M, Aghagolzadeh, P, et al.. Serum calcification propensity and the risk of cardiovascular and all-cause mortality in the general population: the PREVEND study. Arterioscler Thromb Vasc Biol 2020;40:1942–51. https://doi.org/10.1161/ATVBAHA.120.314187.Suche in Google Scholar PubMed
17. Bojic, M, Koller, L, Cejka, D, Niessner, A, Bielesz, B. Propensity for calcification in serum associates with 2-year cardiovascular mortality in ischemic heart failure with reduced ejection fraction. Front Med 2021;8:672348. https://doi.org/10.3389/fmed.2021.672348.Suche in Google Scholar PubMed PubMed Central
18. Bojic, M, Bielesz, B, Cejka, D, Schernthaner, GH, Hobaus, C. Calcification propensity in serum and cardiovascular outcome in peripheral artery disease. Thromb Haemost 2022;122:1040–6. https://doi.org/10.1055/s-0041-1736444.Suche in Google Scholar PubMed
19. Mencke, R, van der Vaart, A, Pasch, A, Harms, G, Waanders, F, Bilo, HJG, et al.. Serum calcification propensity is associated with HbA1c in type 2 diabetes mellitus. BMJ Open Diabetes Res Care 2021;9. https://doi.org/10.1136/bmjdrc-2020-002016.Suche in Google Scholar PubMed PubMed Central
20. Geroldinger-Simic, M, Sohail, A, Razazian, M, Krennmayr, B, Pernsteiner, V, Putz, T, et al.. Accelerated calciprotein crystallization time (T50) is correlated with impaired lung diffusion capacity in systemic sclerosis. Front Immunol 2024;15:1425885. https://doi.org/10.3389/fimmu.2024.1425885.Suche in Google Scholar PubMed PubMed Central
21. Kazmierczak, SC. Chapter 5 - Interferences of hemolysis, lipemia and high bilirubin on laboratory tests. In Amitava D, Jorge LS, editors. Accurate results in the clinical laboratory, 2nd ed. Amsterdam: Elsevier; 2019:57–67 pp.10.1016/B978-0-12-813776-5.00005-4Suche in Google Scholar
22. Steen, G, Klerk, A, Laan, K, Eppens, EF. Evaluation of the interference due to haemoglobin, bilirubin and lipids on Immulite 2500 assays: a practical approach. Ann Clin Biochem 2011;48:170–5. https://doi.org/10.1258/acb.2010.010187.Suche in Google Scholar PubMed
23. Aursulesei, V, Costache, II. Anticoagulation in chronic kidney disease: from guidelines to clinical practice. Clin Cardiol 2019;42:774–82. https://doi.org/10.1002/clc.23196.Suche in Google Scholar PubMed PubMed Central
24. Urban, P, Scheidegger, D, Buchmann, B, Skarvan, K. The hemodynamic effects of heparin and their relation to ionized calcium levels. J Thorac Cardiovasc Surg 1986;91:303–6. https://doi.org/10.1016/s0022-5223-19-36096-9.Suche in Google Scholar
25. CLSI. User verification of precision and estimation of bias, 3rd ed. CLSI guideline EP15-A3: Clinical and Laboratory Standards Institute; 2014.Suche in Google Scholar
26. Nakatani, S, Mori, K, Sonoda, M, Nishide, K, Uedono, H, Tsuda, A, et al.. Association between serum zinc and calcification propensity (T(50)) in patients with type 2 diabetes mellitus and in vitro effect of exogenous zinc on T(50). Biomedicines 2020;8. https://doi.org/10.3390/biomedicines8090337.Suche in Google Scholar PubMed PubMed Central
27. Kim, H, Kim, AJ, Ro, H, Chang, JH, Lee, HH, Chung, W, et al.. Serum calcification propensity and its association with biochemical parameters and bone mineral density in hemodialysis patients. Kidney Res Clin Pract 2023;42:262–71. https://doi.org/10.23876/j.krcp.22.059.Suche in Google Scholar PubMed PubMed Central
28. Nagakura, Y, Shoji, T, Fukumoto, S, Uedono, H, Nakatani, S, Mori, K, et al.. T50 calciprotein crystallization and the decreased role of fetuin-A in type 2 diabetes. J Atherosclerosis Thromb 2024. https://doi.org/10.5551/jat.65351.Suche in Google Scholar PubMed PubMed Central
29. Mori, K, Shoji, T, Nakatani, S, Uedono, H, Ochi, A, Yoshida, H, et al.. Differential associations of fetuin-A and calcification propensity with cardiovascular events and subsequent mortality in patients undergoing hemodialysis. Clin Kidney J 2024;17:sfae042. https://doi.org/10.1093/ckj/sfae042.Suche in Google Scholar PubMed PubMed Central
30. Tadokoro, T, Kato, A, Ohmori, H, Matsumoto, T, Kuro, OM, Kobayashi, T, et al.. Serum calcification propensity T50 is associated with soluble thrombomodulin in patients on hemodialysis. J Clin Med 2024;13. https://doi.org/10.3390/jcm13123491.Suche in Google Scholar PubMed PubMed Central
31. Cejka, D, Thiem, U, Blinzler, E, Machacek, J, Voelkl, J, Smith, ER, et al.. Citrate-buffered, magnesium-enriched dialysate on calcification propensity in hemodialysis patients - the CitMag study. Kidney Int Rep 2024;9:1765–73. https://doi.org/10.1016/j.ekir.2024.03.023.Suche in Google Scholar PubMed PubMed Central
32. Meer, R, Romero Prats, ML, Vervloet, MG, van der Schouw, YT, de Jong, PA, Beulens, JWJ. The effect of six-month oral vitamin K supplementation on calcification propensity time in individuals with type 2 diabetes mellitus: a post hoc analysis of a randomized, double-blind, placebo-controlled trial. Atherosclerosis 2024;394:117307. https://doi.org/10.1016/j.atherosclerosis.2023.117307.Suche in Google Scholar PubMed
33. Sohail, A, Obereigner, J, Mitter, G, Schmid, T, Hofer, AS, Schuster, G, et al.. Association of serum zinc with mineral stress in chronic kidney disease. Clin Kidney J 2024;17:sfae258. https://doi.org/10.1093/ckj/sfae258.Suche in Google Scholar PubMed PubMed Central
34. Smith, ER, Hewitson, TD, Cai, MMX, Aghagolzadeh, P, Bachtler, M, Pasch, A, et al.. A novel fluorescent probe-based flow cytometric assay for mineral-containing nanoparticles in serum. Sci Rep 2017;7:5686. https://doi.org/10.1038/s41598-017-05474-y.Suche in Google Scholar PubMed PubMed Central
35. Feenstra, L, Reijrink, M, Pasch, A, Smith, ER, Visser, LM, Bulthuis, M, et al.. Calciprotein particle counts associate with vascular remodelling in chronic kidney disease. Cardiovasc Res 2024;120:1953–66. https://doi.org/10.1093/cvr/cvae164.Suche in Google Scholar PubMed PubMed Central
36. Miura, Y, Iwazu, Y, Shiizaki, K, Akimoto, T, Kotani, K, Kurabayashi, M, et al.. Identification and quantification of plasma calciprotein particles with distinct physical properties in patients with chronic kidney disease. Sci Rep 2018;8:1256. https://doi.org/10.1038/s41598-018-19677-4.Suche in Google Scholar PubMed PubMed Central
© 2025 the author(s), published by De Gruyter, Berlin/Boston
This work is licensed under the Creative Commons Attribution 4.0 International License.
Artikel in diesem Heft
- Frontmatter
- Editorials
- Challenging the dogma: why reviewers should be allowed to use AI tools
- Multivariate approaches to improve the interpretation of laboratory data
- Review
- Interference of therapeutic monoclonal antibodies with electrophoresis and immunofixation of serum proteins: state of knowledge and systematic review
- Opinion Papers
- Urgent call to the European Commission to simplify and contextualize IVDR Article 5.5 for tailored and precision diagnostics
- The importance of laboratory medicine in the management of CKD-MBD: insights from the KDIGO 2023 controversies conference
- Supplementation of pyridoxal-5′-phosphate in aminotransferase reagents: a matter of patient safety
- HCV serology: an unfinished agenda
- From metabolic profiles to clinical interpretation: multivariate approaches to population-based and personalized reference intervals and reference change values
- Genetics and Molecular Diagnostics
- A multiplex allele specific PCR capillary electrophoresis (mASPCR-CE) assay for simultaneously analysis of SMN1/SMN2/NAIP copy number and SMN1 loss-of-function variants
- General Clinical Chemistry and Laboratory Medicine
- From assessment to action: experience from a quality improvement initiative integrating indicator evaluation and adverse event analysis in a clinical laboratory
- Evaluation of measurement uncertainty of 11 serum proteins measured by immunoturbidimetric methods according to ISO/TS 20914: a 1-year laboratory data analysis
- Assessing the harmonization of current total vitamin B12 measurement methods: relevance and implications
- The current status of serum insulin measurements and the need for standardization
- Method comparison of plasma and CSF GFAP immunoassays across multiple platforms
- Cerebrospinal fluid leptin in Alzheimer’s disease: relationship to plasma levels and to cerebrospinal amyloid
- Verification of the T50 Calciprotein Crystallization test: bias estimation and interferences
- An innovative immunoassay for accurate aldosterone quantification: overcoming low-level inaccuracy and renal dysfunction-associated interference
- Oral salt loading combined with postural stimulation tests for confirming and subtyping primary aldosteronism
- Evaluating the performance of a multiparametric IgA assay for celiac disease diagnosis
- Clinical significance of anti-mitochondrial antibodies and PBC-specific anti-nuclear antibodies in evaluating atypical primary biliary cholangitis with normal alkaline phosphatase levels
- Reference Values and Biological Variations
- Establishment of region-, age- and sex-specific reference intervals for aldosterone and renin with sandwich chemiluminescence immunoassays
- Validation of a plasma GFAP immunoassay and establishment of age-related reference values: bridging analytical performance and routine implementation
- Comparative analysis of population-based and personalized reference intervals for biochemical markers in peri-menopausal women: population from the PALM cohort study
- Hematology and Coagulation
- Evaluation of stability and potential interference on the α-thalassaemia early eluting peak and immunochromatographic strip test for α-thalassaemia --SEA carrier screening
- Cardiovascular Diseases
- Analytical and clinical evaluation of an automated high-sensitivity cardiac troponin I assay for whole blood
- Diabetes
- Method comparison of diabetes mellitus associated autoantibodies in serum specimens
- Letters to the Editor
- Permitting disclosed AI assistance in peer review: parity, confidentiality, and recognition
- Response to the editorial by Karl Lackner
- Hemolysis detection using the GEM 7000 at the point of care in a pediatric hospital setting: does it affect outcomes?
- Estimation of measurement uncertainty for free drug concentrations using ultrafiltration
- Cryoglobulin pre-analysis over the weekend
- Accelerating time from result to clinical action: impact of an automated critical results reporting system
- Recent decline in patient serum folate test levels using Roche Diagnostics Folate III assay
- Kidney stones consisting of 1-methyluric acid
- Congress Abstracts
- 7th EFLM Conference on Preanalytical Phase
- Association of Clinical Biochemists in Ireland Annual Conference
- Association of Clinical Biochemists in Ireland Annual Conference
- 17th Congress of the Portuguese Society of Clinical Chemistry, Genetics and Laboratory Medicine