Method comparison of plasma and CSF GFAP immunoassays across multiple platforms
-
Burak Arslan
 ,
Elzbieta Rembeza
,
Elzbieta Rembeza

Abstract
Objectives
Glial fibrillary acidic protein (GFAP) is a biomarker of astrocytic activation associated with neurodegenerative diseases, neuroinflammatory disorders, and traumatic brain injury. However, the lack of standardized methods for quantifying GFAP across different immunoassay platforms poses challenges for its clinical implementation. This study aimed to compare the analytical performance of multiple commercially available and in-house immunoassays for GFAP quantification in plasma and cerebrospinal fluid (CSF) to assess their agreement and potential interchangeability.
Methods
We conducted a method comparison using four plasma GFAP immunoassays (Simoa, Ella, Alinity, and MSD) and four CSF GFAP assays (ELISA, Ella, Alinity and MSD). Anonymized leftover plasma and CSF samples were analyzed across platforms. Sample sizes for the pairwise comparisons ranged from 23 to 52 for plasma and 34 to 51 for CSF. Pairwise comparisons were performed using Spearman correlation, Bland–Altman analysis, and Passing–Bablok regression to assess systematic and proportional biases. Outliers were identified and excluded to ensure robust statistical evaluation.
Results
Strong correlations were observed across all platforms (Spearman’s r=0.827–0.927 for plasma; r=0.937–0.958 for CSF). However, significant systematic and proportional biases were present in several comparisons, preventing direct interchangeability of results. In plasma, Simoa consistently reported higher GFAP concentrations compared with Ella and Alinity, while Alinity overestimated levels relative to Ella. Similarly, in CSF, ELISA tended to underestimate GFAP concentrations compared with Alinity, MSD, and Ella, with the largest discrepancy observed between ELISA and MSD.
Conclusions
Despite strong correlations, substantial method-dependent biases indicate that GFAP measurements across different immunoassay platforms need to be standardized to ensure harmonization and reliable clinical application of GFAP as a biomarker.
Introduction
Glial fibrillary acidic protein (GFAP) is a type-III intermediate filament protein predominantly expressed by astrocytes in the central nervous system (CNS) [1]. Beyond its physiological roles, such as providing structural support to astrocytes and contributing to the maintenance of the blood-brain barrier, GFAP expression is upregulated in response to neuronal injury, serving as a marker of astrocytic activation following CNS damage [2]. Due to the close proximity of CSF to the brain parenchyma, GFAP concentrations in CSF are significantly higher than in blood, with levels approximately 100 times greater in CSF. Consequently, fluctuations in GFAP levels might be more readily detected in CSF than in blood, although large changes can also be observed in plasma despite its lower absolute concentrations [3], [4]. Moreover, the correlation between plasma and CSF GFAP levels has been reported to be only moderate [5], [6]. This has been partly attributed to the limited long-term stability of GFAP in CSF [7], particularly in scenarios involving multiple freeze–thaw cycles. Another proposed explanation is the hypothesis that GFAP released through astrocytic end-feet in direct contact with the vascular structures may contribute more directly to blood GFAP levels, bypassing the CSF compartment altogether [5], 8].
Given the concentration differences between CSF and plasma, measuring GFAP in blood was historically challenging. However, recent advancements in detection technologies over the past decade have enabled the measurement of low-abundance, brain-derived proteins in blood that were previously undetectable using conventional enzyme-linked immunosorbent assays (ELISA) [9], [10]. These innovations have facilitated the detection of low abundant proteins in blood, such as GFAP, using highly sensitive immunoassay platforms, including single-molecule array (Simoa) [11], Ella Simple Plex [12], Meso Scale Discovery (MSD) (e.g., MESO QuickPlex® SQ) [13]. Furthermore, as laboratories worldwide strive to implement blood GFAP assays in routine clinical practice, the need for high-throughput, fully automated immunoassays that can be seamlessly integrated into clinical chemistry laboratories has become increasingly important. In line with this, Abbott has developed a GFAP assay compatible with the Alinity platform [14], offering a potential solution for large-scale clinical chemistry laboratories, and many more assays, including those from Fujirebio [15], are on the way. These assays have the potential to aid clinicians in biomarker-supported diagnostic algorithms and assist in the differential diagnosis of complex neurological disorders.
With the availability of sensitive assays, many studies have demonstrated elevated GFAP levels in both CSF and blood across a variety of neurological conditions, including neurodegenerative diseases (e.g., Alzheimer’s disease (AD) [5]), neuroinflammatory disorders (e.g., multiple sclerosis [16]), and traumatic brain injury (TBI) [17]. Overall, GFAP serves as a valuable biomarker for supporting clinical diagnosis across a broad spectrum of neurological disease contexts.
Given its growing clinical relevance and the increasing availability of assays for quantifying GFAP in biological fluids, the need for standardization and comparative data to evaluate immunoassay platforms and assess their agreement has become increasingly important. While Simoa is widely utilized and integrated into routine laboratory practice, the assessment and adoption of alternative methods and platforms are crucial for ensuring result harmonization. Although commercially available immunoassay instruments are based on the fundamental principles of sandwich immunoassays, the absence of certified reference materials, variations in antibody pair selection, assay design, the use of different calibrators, and instrument-specific characteristics pose challenges for standardizing result interpretation across laboratories using different methodologies. To address these limitations, this study presents a method comparison across multiple currently available immunoassay platforms for both plasma (Simoa, Ella, Alinity, MSD) and CSF (ELISA, Ella, Alinity, MSD), providing a comprehensive evaluation of their agreement.
Materials and methods
Study design
Anonymized leftover plasma and CSF samples, originally obtained for routine analyses at the Neurochemistry and Clinical Chemistry Laboratories at Sahlgrenska University Hospital, were used for method comparison experiments. Due to differences in assay availability and sample volume constraints at the time of analysis, a unified pooled sample set could not be used across all pairwise comparisons. Instead, we collected separate sets of leftover samples for each comparison. These sets were selected to cover a comparable range and distribution of GFAP concentrations. The variation in sample numbers reflects practical limitations, including assay scheduling requirements and differences in leftover sample availability over time. Before conducting the method comparison analyses, we visually assessed the range and distribution of GFAP concentrations for the same assays used in multiple pairwise comparisons (plasma and CSF) to provide an overview of absolute GFAP concentrations across datasets prior to outlier exclusion (Supplementary Figures 1–3).
Ethics approval and consent to participate
The collection of anonymized samples at the Clinical Chemistry Laboratory, Sahlgrenska University Hospital, was carried out in compliance with the ethical guidelines approved by the Ethics Committee at the University of Gothenburg (EPN140811).
Study participants and sample collection
In this study, only anonymized leftover and randomly collected samples were used, with no access to clinical or demographic data. The detailed number of samples used in each specific experiment can be found in the corresponding section of this manuscript. To separate plasma from whole blood, samples underwent an initial centrifugation at 2,000×g for 10 min. Prior to analysis, an additional centrifugation step was performed for Ella, MSD, and Simoa assays, while the centrifugation protocol for Alinity was verified against the kit insert. CSF samples were collected in polypropylene tubes, centrifuged at 1,800×g for 10 min at 14 °C, and the supernatant was stored at −20 °C for a maximum of one week until biomarker analysis. At the time of analysis, samples were vortexed before measurement.
Immunoassays and the number of samples included in each pairwise comparison
Different platforms were utilized to compare plasma and CSF GFAP levels using various numbers of paired samples for pairwise comparisons. For both matrices, the following assays were utilized: the Simple Plex Human GFAP (2nd Gen) Assay Cartridge on the Ella platform (Bio-Techne), the GFAP assay included in Abbott’s mild traumatic brain injury (mTBI) panel alongside UCH-L1 on the Alinity platform (Abbott), and the S-PLEX Human GFAP Kit on the MESO QuickPlex SQ® platform (MSD). Additionally, plasma GFAP was measured using the Simoa® GFAP Discovery Kit on the HD-X platform (Quanterix), while CSF GFAP levels were also assessed using an in-house developed ELISA [18] on the Sunrise microplate reader (Tecan Trading AG). For plasma GFAP, method comparisons were performed across four immunoassays, with the following pairwise comparisons: Ella vs. Simoa (n=104), Alinity vs. Ella (n=40), Simoa vs. MSD (n=35), and Simoa vs. Alinity (n=39). For CSF GFAP, comparisons included ELISA vs. Alinity (n=54), ELISA vs. MSD (n=36), and ELISA vs. Ella (n=53). After excluding outliers, the statistical analysis included: Alinity vs. Ella (n=38), Simoa vs. Alinity (n=39), Simoa vs. MSD (n=34), and Ella vs. Simoa (n=102) for plasma GFAP, while for CSF GFAP, the comparisons were ELISA vs. Alinity (n=48), ELISA vs. MSD (n=34), and ELISA vs. Ella (n=51). Additionally, following the identification of results below the lower limit of quantification (LLoQ) for Ella and their potential impact on the pairwise comparisons, values below the LLoQ were excluded from the final statistical analysis. Consequently, the updated analysis included 23 samples for the Alinity vs. Ella comparison and 52 samples for the Ella vs. Simoa comparison.
The technical specifications of immunoassays used for GFAP quantification
For both plasma and CSF method comparison, we evaluated multiple immunoassay platforms to assess analytical performance and agreement. The immunoassays used in this study are summarized in Table 1, including key assay specifications such as assay technology, measurement range, lower limit of quantification (LLoQ), and lot numbers.
The technical specifications of immunoassays used for GFAP quantification.
| Assay platform | Sample type | Technology | Instrumentation | Measurement range, ng/L | LLoQa, ng/L | Dilution factor | CV% | Lot number | Additional notes |
|---|---|---|---|---|---|---|---|---|---|
| Simoa | Plasma | Single molecule array | Quanterix HD-X | 0–4,000 | 0.686 | Plasma 4× CSF 40× |
Low: %CVr: 6.2 %CVRw:6.2 High: %CVr: 3.3 %CVRw:3.3 |
REF 102336 | E.g., Automated, plate-based platform, multiplexing capacity |
| Ella | Plasma/CSF | Microfluidic cartridge containing three glass nano reactors, fluorescence readout | Ella™ Automated ELISA | 2.52–9,600 | 5.1 | CSF 2× | Plasma Low: %CVr: 14.3 %CVRw: N/A High: %CVr: 2.5 %CVRw:N/A CSF Low: %CVr: 1.3 %CVRw: 6.3 High: %CVr: 4.8 %CVRw:9.6 |
41,689 and 41,690 | E.g., automated, cartridge-based, multiplexing capacity |
| Alinity | Plasma/CSF | Chemiluminescent microparticle immunoassay | The Alinity i-system | 6.1–42,000 | 6.1 | No dilution | N/Ab | REF 04W1720 | E.g., fully-automated, high-throughput |
| MSD | Plasma/CSF | Electrochemiluminescence | MESO QuickPlex SQ® | 0.309–683a (0.62–1,360 when including 2× plasma sample dilution) | 0.309 | Plasma 2× CSF 20× |
Plasma Low: %CVr: 12.0 %CVRw: N/A High: %CVr: 12.0 %CVRw:N/A CSF %CVr: 6.9 %CVRw: N/A High: %CVr: 3.9 %CVRw: N/A |
K00S0157 | E.g., multiplexing capability |
| ELISA | CSF | Enzyme-linked immunoassay, colorimetric readout | Sunrise microplate reader (Tecan Trading AG) | 70–8,000 | 70 | No dilution | %CVr:N/A %CVRw: 18.0 |
None (in-house method) | E.g., in-house developed assay |
-
CSF, cerebrospinal fluid; ELISA, enzyme-linked immunosorbent assay; LLoQ, lower limit of quantification; MSD, meso scale discovery; Simoa, single molecule array; REF, reference; %CVr, repeatability; %CVRw:, intermediate precision; N/A, not available. aSimoa, reported LLoQ obtained from manufacturer documentation; Ella, LLoQ determined in-house; Alinity, LLoQ obtained from manufacturer documentation; MSD, LLoQ determined in-house; ELISA, LLoQ determined in-house. bFor the Alinity assay, routine quality control samples were measured before and after each run, with %CVs, consistently below 10 %, in accordance with our standard operating procedure for fully automated immunoassays. If the %CVs, exceeded this threshold, the run was stopped.
Statistical analysis
Statistical analysis was performed using GraphPad Prism software version 9.5.1 (San Diego, USA) and MedCalc statistical software version 23.1.3 (MedCalc Software Ltd, Belgium). For each immunoassay platform, data distribution was assessed, and outliers were identified separately for plasma and CSF measurements, using Tukey’s fences [19] – a method based on the interquartile range (IQR) – prior to statistical analysis. Following assessment of data normality using the D’Agostino–Pearson test, non-parametric tests were used for further analyses. Bland-Altman [20] plots (% difference vs. average, where % difference=100*(assay 1 − assay 2)/average of the two assays), Passing–Bablok [21] regression analysis, and Spearman correlation were employed for method comparison. Fixed bias was defined to be present if the 95 % confidence interval (CI) of the intercept did not include 0, while proportional bias was defined to be present if the 95 % CI of the slope did not include 1 [22].
Results
Spearman correlation analysis across the entire cohort demonstrated strong, positive correlations between all plasma and CSF GFAP assays, while pairwise comparisons revealed the presence of proportional bias, fixed bias, or both (Table 2).
Summary of method comparison for plasma and CSF GFAP assays: correlation, Bland–Altman analysis, and Passing–Bablok regression.
| Bland–Altman | Passing–Bablok regression | ||||||
|---|---|---|---|---|---|---|---|
| Comparison | Spearman (r, p-Value) | Mean difference (95 % CI), pg/mL | Limits of agreement (95 % CI) | % mean difference (95 % CI) | Limits of agreement (95 % CI) | (Slope, intercept) | Observed bias |
| Plasma | |||||||
|
|
|||||||
| Alinity vs. Ella | 0.839, p<0.0001 | 25.6 (21.5–29.6) | 7.1 (0.02–14.2) to 44.1 (37.0–51.1) | 113.8 % (107.6–119.9 %) | 85.8 % (75.1–96.5 %) to 141.7 % (131.0–152.4 %) | 3.778 (2.693–5.515), 0.696 (−13.466–8.651) | Proportional |
| Simoa vs. Alinity | 0.927, p<0.0001 | 164.9 (129.7–200.1) | −47.9 (−108.5–12.8) to 377.7 (317.1–438.4) | 149.6 % (146.7–152.6 %) | 131.7 % (126.6–136.8 %) to 167.5 % (162.4–172.6 %) | 0.1268 (0.1039–0.1479), 2.2134 (−0.2616–5.7071) | Proportional |
| Simoa vs. MSD | 0.914, p<0.0001 | −452.0 (−536.4–−367.5) | −926.2 (−1071.9–−780.5) to 22.3 (−123.5–168.0) | −107.5 % (−111.9 %–−103.0 %) | −132.5 % (−140.2 %–−123.8 %) to −82.4 % (−90.1 %–−74.7 %) | 3.5509 (3.1935–3.9167), −36.8 (−87.9–19.2) | Proportional |
| Simoa vs. Ella | 0.827, p<0.0001 | 271.4 (233.9–308.8) | 7.7 (−56.8–72.1) to 535.1 (470.7–599.5) | 185.7 % (184.6–186.7 %) | 178.3 % (176.5–180.1 %) to 193.0 % (191.2–194.8 %) | 36.031 (30.923–43.615), −64.712 (−126.731 to −20.284) | Proportional and systematic |
|
|
|||||||
| CSF | |||||||
|
|
|||||||
| ELISA vs. Alinity | 0.937, p<0.0001 | −1762.9 (−2158.0–−1367.8) | −4429.6 (−5109.5–−3749.7) to 903.8 (223.9–1583.7) | −117.0 % (−122.4 %–−111.7 %) | −153.2 % (−162.4 %–−144.0 %) to −80.9 % (−90.1 %–−71.6 %) | 4.0732 (3.7084–4.4810), −100.47 (−220.81–−4.67) | Proportional and systematic |
| ELISA vs. MSD | 0.949, p<0.0001 | −33894.2 (−43398.7–−24389.7) | −87284.6(−103689.1–−70880.0) | −195.5 % (−195.8 % to −195.1 %) | −197.5 % (−198.1 % to −196.9 %) to −193.4 % (−194.0 % to −192.8 %) | 91.85 (80.65–106.10), −820.19 (−3,421.94 to 1486.04) | Proportional |
| ELISA vs. Ella | 0.958, p<0.0001 | −55.0 (−89.4–−20.6) | −294.6 (−353.7–−235.4) to 184.6 (125.4–243.7) | −21.3 % (−30.9 %–−11.6 %) | −88.6 % (−105.2 %–−72.0 %) to 46.0 % (29.4–62.6 %) | 0.9698 (0.9351–1.0158), 45.18 (26.65–58.51) | Systematic |
-
CI, confidence interval; CSF, cerebrospinal fluid; ELISA, enzyme-linked immunosorbent assay; MSD, meso scale discovery; Simoa, single molecule array; r, spearman correlation coefficient. Absolute concentration differences are presented as mean difference (95 % CI) in ng/L, and relative differences are presented as % mean difference (95 % CI). The corresponding lower and upper limits of agreement are shown alongside each mean difference.
Method comparison of plasma assays
A strong correlation was observed between the Alinity and Ella assays (rs=0.839, p<0.0001). Bland-Altman analysis indicated a mean difference of 113.8 % (95 % CI: 107.6–119.9 %), with limits of agreement ranging from 85.8 % (95 % CI: 75.1–96.5 %) to 141.7 % (95 % CI: 131.0–152.4 %). These results indicate that Alinity consistently reported higher GFAP concentrations compared with Ella. Passing–Bablok regression revealed proportional bias only, with a slope of 3.778 (95 % CI: 2.693–5.515) and an intercept of 0.696 (95 % CI: −13.466 to 8.651), indicating that the difference between methods increased with higher GFAP concentrations (Table 2, Figure 1A).

Method comparison of plasma assays: Alinity vs. Ella and Alinity vs. Simoa each row shows the correlation plot (left), Bland–Altman plot (middle), and Passing–Bablok regression (right) for each pairwise comparison. (A) Left: Correlation plot of plasma GFAP concentrations measured by Ella (x-axis) and Abbott Alinity (y-axis) assays, with values expressed in ng/L. The plot demonstrates a strong correlation (r=0.839, p<0.0001). A locally estimated scatterplot smoothing (LOESS) curve with an 80 % span is applied to the trend line to enhance the visualization of the data distribution. (A) Middle: Bland–Altman plot showing the percentage differences (y-axis) between Abbott Alinity and Ella assays against their mean concentrations (x-axis). The solid blue line represents the mean bias, and the dashed brown lines indicate the limits of agreement (±1.96SD). The blue error bars represent the 95 % confidence intervals (CIs) for the limits of agreement, while the green error bar shows the 95 % CI for the mean bias. The mean difference of 113.8 % (95 % CI: 107.6–119.9 %) is shown, with limits of agreement ranging from 85.8 % (95 % CI: 75.1–96.5 %) to 141.7 % (95 % CI:131.0–152.4 %). (A) Right: Passing–Bablok regression plot with GFAP concentrations from Ella on the x-axis and Abbott Alinity on the y-axis, demonstrating proportional bias with a slope of 3.778 (95 % CI: 2.693–5.515) and an intercept of 0.696 (95 % CI: −13.466–8.651). The solid blue line represents the fitted regression line, while the shaded blue area indicates the confidence interval and the dashed brown line represents the identity line (y=x). (B) Left: Correlation plot of GFAP concentrations measured by Simoa (x-axis) and Abbott Alinity (y-axis) assays, with values expressed in ng/L. The plot demonstrates a robust correlation (r=0.927, p<0.0001). A locally estimated scatterplot smoothing (LOESS) curve with an 80 % span is applied to the trend line to better visualize the data distribution. (B) Middle: Bland–Altman plot showing the percentage differences (y-axis) between Simoa and Abbott Alinity assays against their mean concentrations (x-axis). The solid blue line represents the mean bias, and the dashed brown lines indicate the limits of agreement (±1.96SD). The blue error bars represent the 95 % confidence intervals (CIs) for the limits of agreement, while the green error bar shows the 95 % CI for the mean bias. The mean difference of 149.6 % (95 % CI: 146.7–152.6 %) is highlighted, with limits of agreement from 131.7 % (95 % CI: 126.6–136.8 %) to 167.5 % (95 % CI: 162.4–172.6 %). (B) Right: Passing–Bablok regression plot with GFAP concentrations from Simoa on the x-axis and Alinity on the y-axis, highlighting proportional bias with a slope of 0.1268 (95 % CI: 0.1039–0.1479) and an intercept of 2.2134 (95 % CI: −0.2616–5.7071). The solid blue line represents the fitted regression line, while the shaded blue area indicates the confidence interval and the dashed brown line represents the identity line (y=x).
Similarly, a robust correlation was observed between the Simoa and Alinity assays (rs=0.927, p<0.0001). Bland-Altman analysis showed a mean difference of 149.6 % (95 % CI: 146.7–152.6 %), with limits of agreement from 131.7 % (95 % CI: 126.6–136.8 %) to 167.5 % (95 % CI: 162.4–172.6 %), reflecting that Simoa consistently reported higher GFAP concentrations than Alinity. Passing–Bablok regression revealed proportional bias only, with a slope of 0.1268 (95 % CI: 0.1039–0.1479) and an intercept of 2.2134 (95 % CI: −0.2616–5.7071), indicating that the discrepancy between the assays increased at higher GFAP concentrations (Table 2, Figure 1B).
The comparison between Simoa and MSD assays demonstrated a strong correlation (rs=0.914, p<0.0001). Bland–Altman analysis indicated a mean difference of −107.5 % (95 % CI: −111.9 %–−103.0 %), with limits of agreement ranging from −132.5 % (95 % CI: −140.2 %–−123.8 %) to −82.4 % (95 % CI: −90.1 %–−74.7 %), demonstrating that Simoa systematically reported lower GFAP concentrations compared with MSD. Passing–Bablok regression identified a significant proportional bias but no systematic bias, with a slope of 3.5509 (95 % CI: 3.1935–3.9167) and an intercept of −36.8 (95 % CI: −87.9–19.2), as the difference between assays became more pronounced at higher GFAP concentrations (Table 2, Figure 2A).
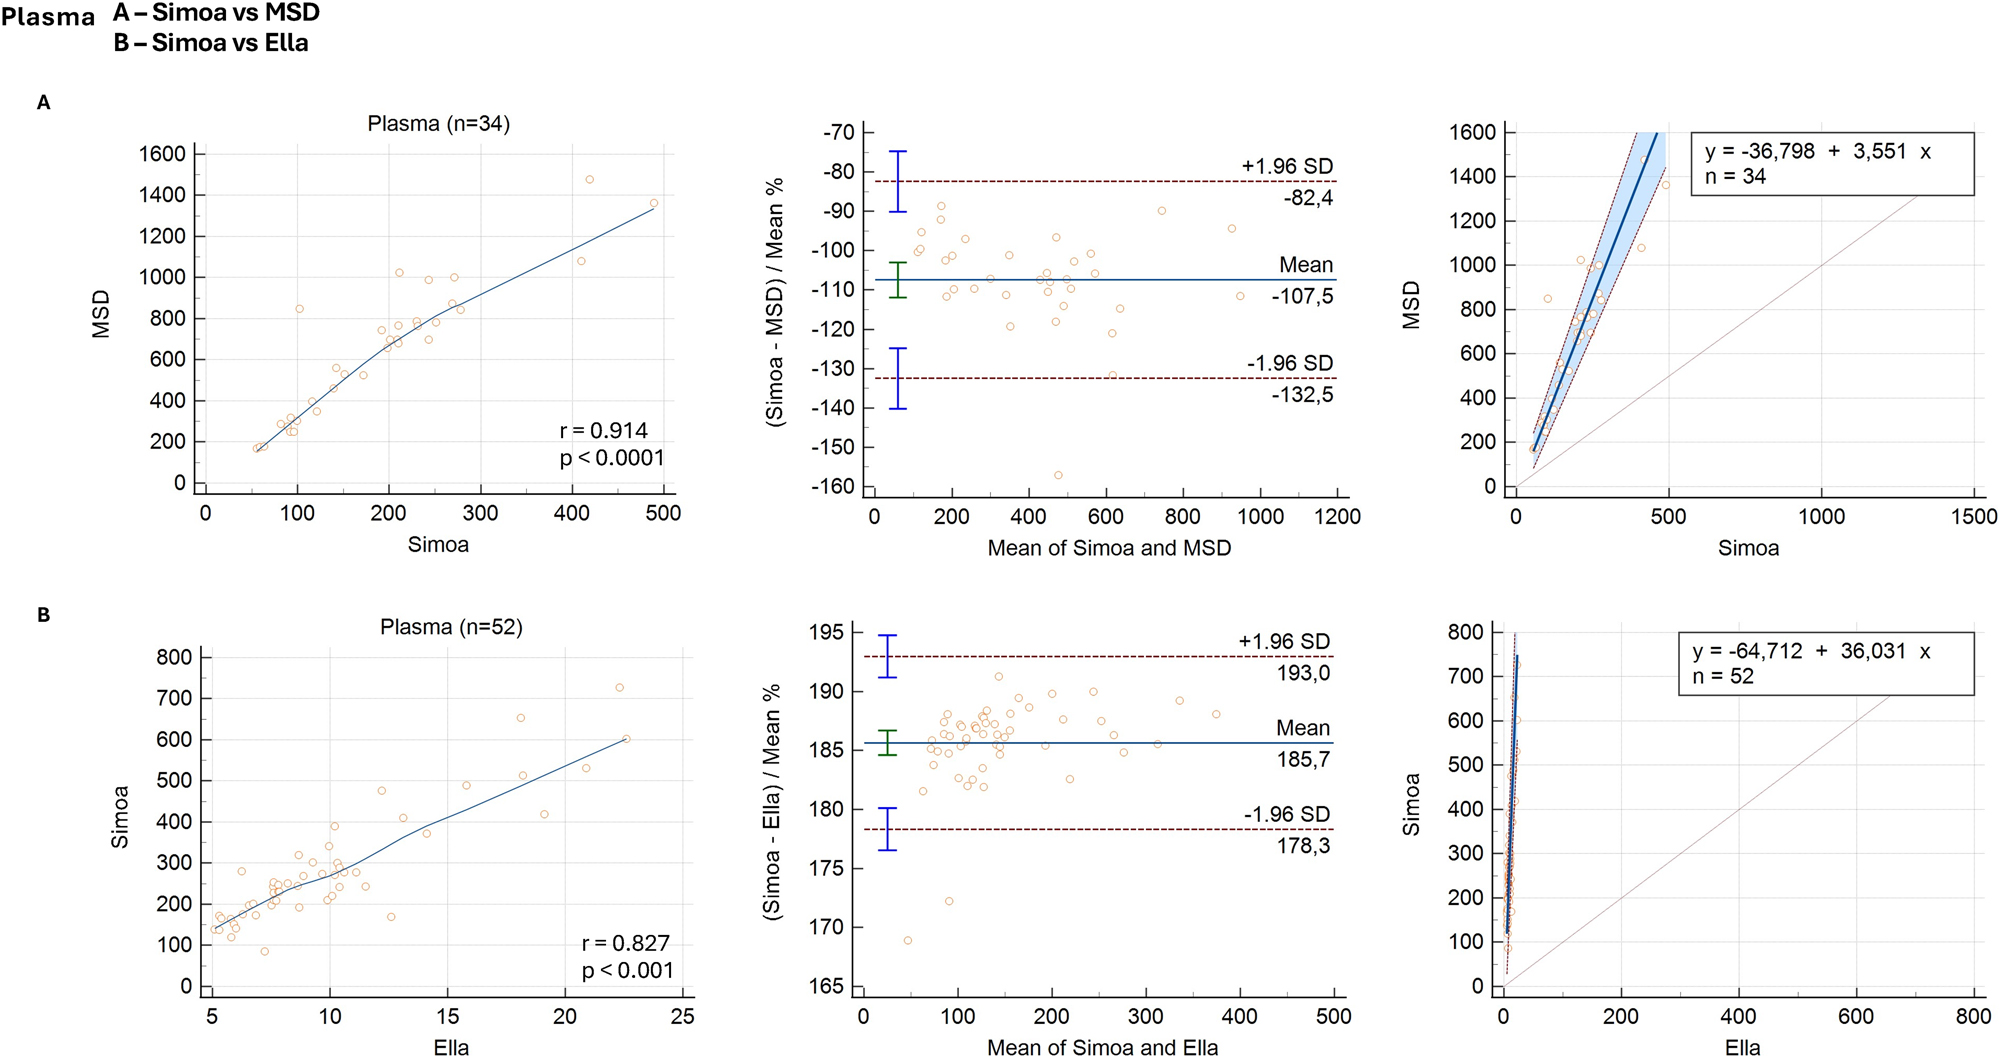
Method comparison of plasma assays: Simoa vs. MSD and Simoa vs. Ella. Each row shows the correlation plot (left), Bland–Altman plot (middle), and Passing–Bablok regression (right) for each pairwise comparison. (A) Left: Correlation plot of GFAP concentrations measured by Simoa (x-axis) and MSD (y-axis) assays, with values expressed in ng/L. The plot demonstrates a strong correlation (r=0.914, p<0.0001). A locally estimated scatterplot smoothing (LOESS) curve with an 80 % span is applied to the trend line to enhance visualization of the data distribution. (A) Middle: Bland–Altman plot showing the percentage differences (y-axis) between simoa and MSD assays against their mean concentrations (x-axis). The solid blue line represents the mean bias, and the dashed brown lines indicate the limits of agreement (±1.96SD). The blue error bars represent the 95 % confidence intervals (CIs) for the limits of agreement, while the green error bar shows the 95 % CI for the mean bias. The mean difference of −107.5 % (95 % CI: −111.9 %–−103.0 %) is presented, with limits of agreement from −132.5 % (95 % CI: −140.2 %–−123.8 %) to −82.4 % (95 % CI: −90.1 %–−74.7 %). (A) Right: Passing–Bablok regression plot with GFAP concentrations from Simoa on the x-axis and MSD on the y-axis, indicating proportional bias with a slope of 3.5509 (95 % CI: 3.1935–3.9167) and an intercept of −36.8 (95 % CI: −87.9–19.2). The solid blue line represents the fitted regression line, while the shaded blue area indicates the confidence interval and the dashed brown line represents the identity line (y=x). (B) Left: Correlation plot of GFAP concentrations measured by Ella (x-axis) and Simoa (y-axis) assays, with values expressed in ng/L. The plot demonstrates a strong correlation (r=0.827, p<0.0001). A locally estimated scatterplot smoothing (LOESS) curve with an 80 % span is applied to the trend line to enhance visualization of the data distribution. (B) Middle: Bland–Altman plot showing the percentage differences (y-axis) between Simoa and Ella assays against their mean concentrations (x-axis). The solid blue line represents the mean bias, and the dashed brown lines indicate the limits of agreement (±1.96SD). The blue error bars represent the 95 % confidence intervals (CIs) for the limits of agreement, while the green error bar shows the 95 % CI for the mean bias. The mean difference of 185.7 % (95 % CI: 184.6–186.7 %) is shown, with limits of agreement from 178.3 % (95 % CI: 176.5–180.1 %) to 193.0 % (95 % CI: 191.2–194.8 %). (B) Right: Passing–Bablok regression plot with GFAP concentrations from Ella on the x-axis and Simoa on the y-axis, highlighting proportional bias with a slope of 36.031(95 % CI: 30.923–43.615) and an intercept of −64.712 (95 % CI: −126.731–−20.284). The solid blue line represents the fitted regression line, while the shaded blue area indicates the confidence interval and the dashed brown line represents the identity line (y=x).
Lastly, the comparison between the Simoa and Ella assays revealed a strong correlation (rs=0.827, p<0.0001). Bland–Altman analysis reported a mean difference of 185.7 % (95 % CI: 184.6–186.7 %), with limits of agreement ranging from 178.3 % (95 % CI: 176.5–180.1 %) to 193.0 % (95 % CI: 191.2–194.8 %), indicating that Simoa consistently overestimated GFAP concentrations compared with Ella. Passing–Bablok regression identified proportional and systematic differences, with a slope of 36.031 (95 % CI: 30.923–43.615) and an intercept of −64.712 (95 % CI: −126.731 to −20.284), suggesting that the discrepancy between assays increased with concentration and was present across the entire range (Table 2, Figure 2B).
Method comparison of CSF assays
A strong correlation was observed between the ELISA and Alinity assays in CSF samples (rs=0.937, p<0.0001). Bland–Altman analysis indicated a mean difference of −117.0 % (95 % CI: −122.4 %–−111.7 %), with limits of agreement ranging from −153.2 % (95 % CI: −162.4 %–−144.0 %) to −80.9 % (95 % CI: −90.1 %–−71.6 %), showing that ELISA reported lower GFAP concentrations than Alinity. Passing–Bablok regression revealed both systematic and proportional biases, with a slope of 4.0732 (95 % CI: 3.7084–4.4810) and an intercept of −100.47 (95 % CI: −220.81–−4.67), indicating that Alinity measurements were consistently higher than ELISA, with the difference becoming more pronounced at higher GFAP concentrations (Table 2, Figure 3A).

Method comparison of CSF assays: ELISA vs. Alinity, ELISA vs. MSD, and ELISA vs. Ella each row shows the correlation plot (left), Bland–Altman plot (middle), and Passing–Bablok regression (right) for each pairwise comparison. (A) Left: In the correlation plot, GFAP concentrations measured by ELISA (x-axis) and alinity (y-axis) are expressed in ng/L, demonstrating a strong correlation (r=0.937, p<0.0001). A locally estimated scatterplot smoothing (LOESS) curve with an 80 % span is applied to the trend line to improve visualization of the data distribution. (A) Middle: Bland–Altman plot showing the percentage differences (y-axis) between ELISA and Alinity assays against their mean concentrations (x-axis). The solid blue line represents the mean bias, and the dashed brown lines indicate the limits of agreement (±1.96SD). The blue error bars represent the 95 % confidence intervals (CIs) for the limits of agreement, while the green error bar shows the 95 % CI for the mean bias. The mean difference of −117.0 % (95 % CI: −122.4 %–−111.7 %) is shown, with limits of agreement from −153.2 % (95 % CI: −162.4 %–−144.0 %) to −80.9 % (95 % CI: −90.1 %–−71.6 %). (A) Right: Passing–Bablok regression plot with GFAP concentrations from ELISA on the x-axis and Alinity on the y-axis, highlighting proportional bias with a slope of 4.0732 (95 % CI: 3.7084–4.4810) and an intercept of −100.47 (95 % CI: −220.81–−4.67). The solid blue line represents the fitted regression line, while the shaded blue area indicates the confidence interval and the dashed brown line represents the identity line (y=x). (B) Left: In the correlation plot, GFAP concentrations measured by ELISA (x-axis) and MSD (y-axis) are expressed in ng/L, demonstrating a strong correlation (r=0.949, p<0.0001). A locally estimated scatterplot smoothing (LOESS) curve with an 80 % span is applied to the trend line to better visualize the data distribution. (B) Middle: Bland–Altman plot showing the percentage differences (y-axis) between ELISA and MSD assays against their mean concentrations (x-axis). The solid blue line represents the mean bias, and the dashed brown lines indicate the limits of agreement (±1.96SD). The blue error bars represent the 95 % confidence intervals (CIs) for the limits of agreement, while the green error bar shows the 95 % CI for the mean bias. The mean difference of −195.5 % (95 % CI: −195.8 %–−195.1 %), is shown, with limits of agreement from −197.5 % (95 % CI: −198.1 %–−196.9 %) to −193.4 % (95 % CI: −194.0 %–−192.8 %). (B) Right: Passing–Bablok regression plot with GFAP concentrations from ELISA on the x-axis and MSD on the y-axis, highlighting proportional bias with a slope of 91.85 (95 % CI: 80.65–106.10) and an intercept of −820.19 (95 % CI: −3421.94–1486.04). The solid blue line represents the fitted regression line, while the shaded blue area indicates the confidence interval and the dashed brown line represents the identity line (y=x). (C) Left: In the correlation plot, GFAP concentrations measured by ELISA (x-axis) and Ella (y-axis) are expressed in ng/L, demonstrating a strong positive correlation (r=0.958, p<0.0001). A locally estimated scatterplot smoothing (LOESS) curve with an 80 % span is applied to the trend line to better visualize the data distribution. (C) Middle: Bland–Altman plot showing the percentage differences (y-axis) between ELISA and Ella assays against their mean concentrations (x-axis). The solid blue line represents the mean bias, and the dashed brown lines indicate the limits of agreement (±1.96SD). The blue error bars represent the 95 % confidence intervals (CIs) for the limits of agreement, while the green error bar shows the 95 % CI for the mean bias. The mean difference of −21.3 % (95 % CI: −30.9 %–−11.6 %) is shown, with limits of agreement from −88.6 % (−105.2 %–−72.0 %) to 46.0 % (29.4–62.6 %). (C) Right: Passing–Bablok regression plot with GFAP concentrations from ELISA on the x-axis and Ella on the y-axis, highlighting proportional bias with a slope of 0.9698 (95 % CI: 0.9351–1.0158) and an intercept of 45.18 (95 % CI: 26.65–58.51). The solid blue line represents the fitted regression line, while the shaded blue area indicates the confidence interval and the dashed brown line represents the identity line (y=x).
Similarly, a strong correlation was observed between the ELISA and MSD assays in CSF samples (rs=0.949, p<0.0001). Bland–Altman analysis showed a mean difference of −195.5 % (95 % CI: −195.8 %–−195.1 %), with limits of agreement ranging from −197.5 % (95 % CI: −198.1 %–−196.9 %) to −193.4 % (95 % CI: −194.0 %–−192.8 %), with ELISA underestimating GFAP levels relative to MSD. Passing-Bablok regression analysis further confirmed a substantial proportional bias, with a slope of 91.85 (95 % CI: 80.65–106.10) and an intercept of −820.19 (95 % CI: −3421.94–1486.04), indicating that MSD measurements were disproportionately higher than ELISA as GFAP concentrations increased (Table 2, Figure 3B).
Lastly, a strong correlation was observed between the ELISA and Ella assays in CSF samples (rs=0.958, p<0.0001). Bland–Altman analysis indicated a mean difference of −21.3 % (95 % CI: −30.9 %–−11.6 %), with limits of agreement ranging from −88.6 % (95 % CI: −105.2 %–−72.0 %) to 46.0 % (95 % CI: 29.4–62.6 %). Passing–Bablok regression analysis showed only systematic bias, with a slope of 0.9698 (95 % CI: 0.9351–1.0158) and an intercept of 45.18 (95 % CI: 26.65–58.51) (Table 2, Figure 3C).
The regression equations obtained from the Passing–Bablok regression analysis are presented in Table 3.
Passing–Bablok regression equations for each pairwise comparison of plasma and CSF GFAP assays.
| Pairwise comparison | Regression equation |
|---|---|
| Plasma | |
|
|
|
| Alinity vs. Ella | Alinity=0.696+3.778*Ella |
| Simoa vs. Alinity | Alinity=2.213+0.127*Simoa |
| Simoa vs. MSD | MSD=−36.798+3.551*Simoa |
| Simoa vs. Ella | Simoa=−64.712+36.031*Ella |
|
|
|
| CSF | |
|
|
|
| ELISA vs. Alinity | Alinity=−100.469+4.073*ELISA |
| ELISA vs. MSD | MSD=−820.195+91.848*ELISA |
| ELISA vs. Ella | Ella=45.181+0.970*ELISA |
-
CSF, cerebrospinal fluid; ELISA, enzyme-linked immunosorbent assay; MSD, meso scale discovery; Simoa, single molecule array.
Discussion
In this study, we compared four different GFAP immunoassays for plasma and four for CSF, conducting pairwise comparisons using distinct sample sets. Although Spearman’s r ranged from 0.827 to 0.958 across assays, our analysis revealed substantial method-dependent biases in several comparisons. Some assays exhibited a systematic bias, characterized by a consistent offset across all concentrations, whereas others demonstrated a proportional bias, where discrepancies increased with higher GFAP levels. Additionally, several comparisons revealed the presence of both systematic and proportional biases, indicating assay-specific differences in GFAP quantification.
To better understand the practical implications of these findings, we examined the extent and nature of these biases in both plasma and CSF assay comparisons. Among the plasma GFAP assay comparisons, both systematic and proportional biases were observed only between Simoa and Ella, while the remaining comparisons showed proportional bias alone. These discrepancies have important implications for biomarker standardization and clinical implementation. In particular, the lack of agreement in absolute concentrations – most evident in comparisons such as Simoa vs. Alinity and Simoa vs. MSD – suggests that differences in antibody specificity, epitope recognition, assay design (e.g., two-step vs. three-step protocols), detection technologies, and calibration strategies likely contribute to the observed variability. For instance, proportional biases that became more pronounced at higher GFAP concentrations highlight disparities in analytical sensitivity and dynamic range, complicating the direct interchangeability of results across assays. Simoa generally reported higher absolute concentrations than other assays – except in the comparison with MSD, where MSD reported higher values – highlighting variability even among high-sensitivity platforms. In CSF, assay comparisons demonstrated that ELISA consistently underestimated GFAP levels relative to Alinity, MSD, and Ella, with the greatest discrepancy observed in ELISA vs. MSD and the smallest in ELISA vs. Ella. Both systematic and proportional biases were present, reinforcing that assay-specific differences persist across matrices. These findings collectively emphasize that GFAP measurements are not directly interchangeable between platforms without appropriate bias correction, which is essential for consistent interpretation in clinical and research contexts.
Given these observed discrepancies, regression-based harmonization might serve as a practical interim solution. The regression equations derived from our method comparison using Passing–Bablok analysis may serve as provisional tools to translate values between assays in the absence of standardized calibration for GFAP. In this study, the analysis revealed both proportional and fixed biases, and the resulting equations could facilitate approximate cross-assay comparisons under controlled conditions. However, the applicability of these equations must be approached with caution. Their validity is inherently dependent on the distribution and range of GFAP concentrations within the study population; for instance, age-related elevations in GFAP, particularly in older individuals, may introduce variability that limits the generalizability of such transformations. Additionally, our analyses were conducted exclusively using plasma samples, meaning these equations are not directly transferable to other matrices such as serum or lithium heparin plasma without further validation. Importantly, due to differences in antibody specificities and detection technologies among platforms, assay results may not be directly interchangeable. This lack of commutability increases the risk of misclassification, especially near clinically significant thresholds where even minor discrepancies can affect diagnostic or prognostic decisions. Therefore, we advise that these regression models be used judiciously and primarily in research settings. Until certified reference material (CRM) and traceable calibrators are established for GFAP, regression-based harmonization should be considered a temporary and context-dependent solution. For clinical applications, particularly where established cutoffs exist (e.g., in mild TBI), we recommend using assay- and matrix-specific reference values.
These considerations further underscore the complexities involved in achieving cross-platform consistency and highlight the influence of both technical and biological factors. As noted in the Introduction, several factors – such as differences in antibody selection, assay design, and calibrators – pose challenges for cross-platform standardization of GFAP measurements. Notably, in our study, the strongest correlation in plasma pairwise comparisons was observed between the Simoa and Alinity platforms (Spearman’s r=0.927), both of which reportedly use antibodies derived from Banyan Biomarkers. This finding supports the idea that using antibodies from the same source may contribute to improved analytical concordance. However, the correlation was not perfect, and lower correlations were observed for other pairwise comparisons, such as Alinity vs. Ella (r=0.839) and Simoa vs. Ella (r=0.827). These discrepancies suggest that, beyond antibody origin, other technical differences – such as assay configuration (e.g., two-step vs. three-step), calibrator materials, and assay platforms (e.g., Simoa vs. chemiluminescent microparticle immunoassay) – may influence the overall agreement. In contrast, GFAP concentrations measured in CSF showed strong correlations across all assays, which may be attributed to the simpler and more homogeneous nature of the CSF matrix. One plausible explanation is that GFAP in CSF exists in a more uniform form, allowing different antibody pairs to recognize the target epitope with similar efficiency. Additionally, the lower total protein content and fewer interfering substances in CSF likely contribute to the improved assay concordance observed in this matrix. Altogether, these findings suggest that the biological matrix itself plays a significant role in determining inter-assay comparability. They also highlight the need for a multifaceted approach to assay harmonization, including the use of standardized calibrators and potentially matrix-specific validation strategies.
Our findings build on prior developments in GFAP quantification, which have evolved from initial ELISA-based measurements in CSF [10], [18] to the emergence of various immunoassay platforms applicable to both CSF and blood [9], [10], [12], [16]. These advances have enabled detection across a range of neurological conditions, including TBI [23], neuroimmunological disorders [24], AD [25], and glioblastoma multiforme [26], [27]. More recently, fully automated platforms [15], [29] and point-of-care technologies [30] have expanded the clinical potential of GFAP testing. However, despite this progress, direct comparisons between assays remain limited, and cross-platform differences in absolute GFAP concentrations are increasingly recognized. In a recent study [28], Fazeli et al. compared a newly developed second-generation microfluidic immunoassay (Ella) with Simoa and a homebrew Ella assay for serum samples, reporting a substantial difference in absolute GFAP concentrations, with markedly higher levels detected by the Simoa assay. Consistent with their findings, we also observed a significant difference in absolute GFAP concentrations between Simoa and Ella, despite the two assays showing a strong correlation in plasma samples.
Despite overall assay concordance, the presence of notable systematic and proportional biases indicates that these methods are not directly interchangeable. This lack of interchangeability highlights the urgent need for standardization across GFAP assays. Establishing standardized reference materials and aligning calibration strategies across assays will be essential to improve comparability and support the clinical implementation of GFAP as a biomarker. A notable example of successful biomarker standardization is the effort to harmonize CSF amyloid-beta 1–42 (Aβ42) measurements [31]. To minimize variability between different assays, the European Commission’s Joint Research Centre (JRC), in collaboration with the International Federation of Clinical Chemistry and Laboratory Medicine (IFCC), established CRMs specifically for CSF Aβ42 [31]. Applying a comparable strategy to GFAP, including the creation of CRMs and assay recalibration, could be instrumental in mitigating systematic and proportional biases across measurement platforms.
This study has several strengths and limitations. One limitation is that, due to the availability of the assays included in this comprehensive method comparison and constraints related to sample volume, we were unable to use the same samples for all pairwise comparisons. However, we addressed this by selecting similar samples with comparable concentration ranges, and this approach was statistically evaluated. While the CLSI EP09C guidelines recommend a minimum of 40 samples for method comparison studies, some pairwise comparisons in our study included fewer samples. The lowest sample size used was 23, which we believe remains acceptable, as our dataset adequately covered the measurement range of the assays tested. Another limitation is the absence of a direct comparison between the Alinity I TBI and Vidas® TBI assays [32], both of which have received FDA approval and CE marking for the evaluation of mTBI. While these assays are increasingly used in clinical practice, logistical and technical constraints prevented their inclusion in the present analysis. Future studies directly comparing these two commercially available platforms would be valuable for assessing their analytical agreement and clinical applicability. Lastly, we were unable to compare paired CSF and plasma samples from the same individuals. As CSF GFAP is highly sensitive to freeze–thaw cycles, such a comparison ideally requires freshly collected samples, which were not available in sufficient quantity for this study. On the other hand, a major strength of this study is that, for the first time, multiple commercially available plasma and CSF GFAP assays were directly compared, revealing substantial biases in absolute GFAP concentrations between different platforms. These findings may contribute to future efforts in developing standardized reference materials, given the observed discrepancies among assays. Although we were unable to use identical sample sets across all comparisons, the distinct sets we analyzed reflect the types of clinical samples commonly received in routine laboratory practice for the measurement of other neurobiomarkers, such as neurofilament light (NfL).
In conclusion, our findings demonstrate that commercially available plasma and CSF GFAP assays correlate strongly but exhibit both systematic and proportional biases, emphasizing the need for standardization efforts. Harmonization across different assays is essential to ensure reliable longitudinal tracking of GFAP concentrations in clinical and research settings, particularly when transitioning between different platforms. The choice of platform depends on multiple factors, including analytical performance, sensitivity, sample volume requirements, and laboratory infrastructure – areas that warrant further investigation. Until cross-platform harmonization is achieved, assay-specific reference ranges or transformation models would be necessary. Future studies should focus on developing CRMs and standardized calibration approaches to improve the comparability of GFAP assays.
-
Research ethics: The collection of anonymized samples at the Clinical Chemistry Laboratory, Sahlgrenska University Hospital, was carried out in compliance with the ethical guidelines approved by the Ethics Committee at the University of Gothenburg (EPN140811).
-
Informed consent: Not applicable.
-
Author contributions: All authors have accepted responsibility for the entire content of this manuscript and approved its submission.
-
Use of Large Language Models, AI and Machine Learning Tools: None declared.
-
Conflict of interest: KB has served as a consultant and at advisory boards for Abbvie, AC Immune, ALZPath, AriBio, BioArctic, Biogen, Eisai, Lilly, Moleac Pte. Ltd, Neurimmune, Novartis, Ono Pharma, Prothena, Roche Diagnostics, Sanofi and Siemens Healthineers; has served at data monitoring committees for Julius Clinical and Novartis; has given lectures, produced educational materials and participated in educational programs for AC Immune, Biogen, Celdara Medical, Eisai and Roche Diagnostics; and is a co-founder of Brain Biomarker Solutions in Gothenburg AB (BBS), which is a part of the GU Ventures Incubator Program, outside the work presented in this paper. HZ has served at scientific advisory boards and/or as a consultant for Abbvie, Acumen, Alector, Alzinova, ALZPath, Annexon, Apellis, Artery Therapeutics, AZTherapies, CogRx, Denali, Eisai, Nervgen, Novo Nordisk, Optoceutics, Passage Bio, Pinteon Therapeutics, Prothena, Red Abbey Labs, reMYND, Roche, Samumed, Siemens Healthineers, Triplet Therapeutics, and Wave, has given lectures in symposia sponsored by Cellectricon, Fujirebio, Alzecure, Biogen, and Roche, and is a co-founder of Brain Biomarker Solutions in Gothenburg AB (BBS), which is a part of the GU Ventures Incubator Program (outside submitted work).
-
Research funding: HZ is a Wallenberg Scholar and a Distinguished Professor at the Swedish Research Council supported by grants from the Swedish Research Council (#2023–00356, #2022–01018 and #2019–02397), the European Union’s Horizon Europe research and innovation programme under grant agreement No 101053962, Swedish State Support for Clinical Research (#ALFGBG-71320), the Alzheimer Drug Discovery Foundation (ADDF), USA (#201809–2016862), the AD Strategic Fund and the Alzheimer’s Association (#ADSF-21–831376-C, #ADSF-21–831381-C, #ADSF-21–831377-C, and #ADSF-24–1284328-C), the European Partnership on Metrology, co-financed from the European Union’s Horizon Europe Research and Innovation Programme and by the Participating States (NEuroBioStand, #22HLT07), the Bluefield Project, Cure Alzheimer’s Fund, the Olav Thon Foundation, the Erling-Persson Family Foundation, Familjen Rönströms Stiftelse, Stiftelsen för Gamla Tjänarinnor, Hjärnfonden, Sweden (#FO2022-0270), the European Union’s Horizon 2020 research and innovation programme under the Marie Skłodowska-Curie grant agreement No 860197 (MIRIADE), the European Union Joint Programme – Neurodegenerative Disease Research (JPND2021-00694), the National Institute for Health and Care Research University College London Hospitals Biomedical Research Centre, and the UK Dementia Research Institute at UCL (UKDRI-1003). KB is supported by the Swedish Research Council (#2017-00915 and #2022-00732), the Swedish Alzheimer Foundation (#AF-930351, #AF-939721 and #AF-968270), Hjärnfonden, Sweden (#FO2017-0243 and #ALZ2022-0006), the Swedish state under the agreement between the Swedish government and the County Councils, the ALF-agreement (#ALFGBG-715986 and #ALFGBG-965240), the European Union Joint Program for Neurodegenerative Disorders (JPND2019-466-236), the Alzheimer’s Association 2021 Zenith Award (ZEN-21-848495), and the Alzheimer’s Association 2022–2025 Grant (SG-23-1038904 QC).
-
Data availability: The data supporting the findings of this study may be shared with qualified academic investigators for the purpose of result replication, upon reasonable request to the corresponding author and under a material transfer agreement.
References
1. Hol, EM, Pekny, M. Glial fibrillary acidic protein (GFAP) and the astrocyte intermediate filament system in diseases of the central nervous system. Curr Opin Cell Biol 2015;32:121–30. https://doi.org/10.1016/j.ceb.2015.02.004.Search in Google Scholar PubMed
2. Middeldorp, J, Hol, E. GFAP in health and disease. Prog Neurobiol 2011;93:421–43. https://doi.org/10.1016/j.pneurobio.2011.01.005.Search in Google Scholar PubMed
3. Zetterberg, H, Smith, DH, Blennow, K. Biomarkers of mild traumatic brain injury in cerebrospinal fluid and blood. Nat Rev Neurol 2013;9:201–10. https://doi.org/10.1038/nrneurol.2013.9.Search in Google Scholar PubMed PubMed Central
4. Petzold, A. Glial fibrillary acidic protein is a body fluid biomarker for glial pathology in human disease. Brain Res 2015;1600:17–31. https://doi.org/10.1016/j.brainres.2014.12.027.Search in Google Scholar PubMed
5. Benedet, AL, Milà-Alomà, M, Vrillon, A, Ashton, NJ, Pascoal, TA, Lussier, F, et al.. Differences between plasma and cerebrospinal fluid glial fibrillary acidic protein levels across the Alzheimer disease continuum. JAMA Neurol 2021;78:1471–83. https://doi.org/10.1001/jamaneurol.2021.3671.Search in Google Scholar PubMed PubMed Central
6. Pereira, JB, Janelidze, S, Smith, R, Mattsson-Carlgren, N, Palmqvist, S, Teunissen, CE, et al.. Plasma GFAP is an early marker of amyloid-β but not tau pathology in Alzheimer’s disease. Brain 2021;144:3505–16. https://doi.org/10.1093/brain/awab223.Search in Google Scholar PubMed PubMed Central
7. Simrén, J, Weninger, H, Brum, WS, Khalil, S, Benedet, AL, Blennow, K, et al.. Differences between blood and cerebrospinal fluid glial fibrillary acidic protein levels: the effect of sample stability. Alzheimer’s Dement 2022;18:1988–92. https://doi.org/10.1002/alz.12806.Search in Google Scholar PubMed PubMed Central
8. Chatterjee, P, Doré, V, Pedrini, S, Krishnadas, N, Thota, R, Bourgeat, P, et al.. Plasma glial fibrillary acidic protein is associated with 18F-SMBT-1 PET: two putative astrocyte reactivity biomarkers for Alzheimer’s disease. J Alzheimers Dis 2023;92:615–28. https://doi.org/10.3233/JAD-220908.Search in Google Scholar PubMed PubMed Central
9. Arslan, B, Zetterberg, H, Ashton, NJ. Blood-based biomarkers in Alzheimer’s disease–moving towards a new era of diagnostics. Clin Chem Lab Med 2024;62:1063–9. https://doi.org/10.1515/cclm-2023-1434.Search in Google Scholar PubMed
10. Petzold, A, Keir, G, Green, A, Giovannoni, G, Thompson, E. An ELISA for glial fibrillary acidic protein. J Immunol Methods 2004;287:169–77. https://doi.org/10.1016/j.jim.2004.01.015.Search in Google Scholar PubMed
11. Bogoslovsky, T, Wilson, D, Chen, Y, Hanlon, D, Gill, J, Jeromin, A, et al.. Increases of plasma levels of glial fibrillary acidic protein, tau, and amyloid β up to 90 days after traumatic brain injury. J Neurotrauma 2017;34:66–73. https://doi.org/10.1089/neu.2015.4333.Search in Google Scholar PubMed PubMed Central
12. Fazeli, B, Huss, A, Gómez de San José, N, Otto, M, Tumani, H, Halbgebauer, S. Development of an ultrasensitive microfluidic assay for the analysis of Glial fibrillary acidic protein (GFAP) in blood. Front Mol Biosci 2023;10:1175230. https://doi.org/10.3389/fmolb.2023.1175230.Search in Google Scholar PubMed PubMed Central
13. Button, EB, Cheng, WH, Barron, C, Cheung, H, Bashir, A, Cooper, J, et al.. Development of a novel, sensitive translational immunoassay to detect plasma glial fibrillary acidic protein (GFAP) after murine traumatic brain injury. Alzheimers Res Ther 2021;13:1–27. https://doi.org/10.1186/s13195-021-00793-9.Search in Google Scholar PubMed PubMed Central
14. Menditto, VG, Moretti, M, Babini, L, Mattioli, A, Giuliani, AR, Fratini, M, et al.. Minor head injury in anticoagulated patients: performance of biomarkers S100B, NSE, GFAP, UCH-L1 and Alinity TBI in the detection of intracranial injury. A prospective observational study. Clin Chem Lab Med 2024;62:1376–82. https://doi.org/10.1515/cclm-2023-1169.Search in Google Scholar PubMed
15. Kamada, J, Hamanaka, T, Oshimo, A, Sato, H, Nishii, T, Fujita, M, et al.. Glial fibrillary acidic protein’s usefulness as an astrocyte biomarker using the fully automated LUMIPULSE® system. Diagnostics 2024;14:2520. https://doi.org/10.3390/diagnostics14222520.Search in Google Scholar PubMed PubMed Central
16. Abdelhak, A, Huss, A, Kassubek, J, Tumani, H, Otto, M. Serum GFAP as a biomarker for disease severity in multiple sclerosis. Sci Rep 2018;8:14798. https://doi.org/10.1038/s41598-018-33158-8.Search in Google Scholar PubMed PubMed Central
17. Thelin, E, Al Nimer, F, Frostell, A, Zetterberg, H, Blennow, K, Nyström, H, et al.. A serum protein biomarker panel improves outcome prediction in human traumatic brain injury. J Neurotrauma 2019;36:2850–62. https://doi.org/10.1089/neu.2019.6375.Search in Google Scholar PubMed PubMed Central
18. Rosengren, LE, Wikkelsø, C, Hagberg, L. A sensitive ELISA for glial fibrillary acidic protein: application in CSF of adults. J Neurosci Methods 1994;51:197–204.10.1016/0165-0270(94)90011-6Search in Google Scholar PubMed
19. Tukey, JW. Exploratory data analysis, 18th ed. Addison-Wesley Publishing Company; 1977:688 p.Search in Google Scholar
20. Bland, JM, Altman, DG. Measuring agreement in method comparison studies. Stat Methods Med Res 1999;8:135–60. https://doi.org/10.1191/096228099673819272.Search in Google Scholar
21. Passing, H, Bablok, W. Comparison of several regression procedures for method comparison studies and determination of sample sizes application of linear regression procedures for method comparison studies in clinical chemistry, part II. J Clin Chem Clin Biochem 1984;22:431–45. https://doi.org/10.1515/cclm.1984.22.6.431.Search in Google Scholar PubMed
22. Bilic-Zulle, L. Comparison of methods: Passing and Bablok regression. Biochem Med 2011;21:49–52. https://doi.org/10.11613/bm.2011.010.Search in Google Scholar PubMed
23. Fraser, DD, Close, TE, Rose, KL, Ward, R, Mehl, M, Farrell, C, et al.. Severe traumatic brain injury in children elevates glial fibrillary acidic protein in cerebrospinal fluid and serum. Pediatr Crit Care Med 2011;12:319–24. https://doi.org/10.1097/pcc.0b013e3181e8b32d.Search in Google Scholar
24. Kassubek, R, Gorges, M, Schocke, M, Hagenston, VA, Huss, A, Ludolph, AC, et al.. GFAP in early multiple sclerosis: a biomarker for inflammation. Neurosci Lett 2017;657:166–70. https://doi.org/10.1016/j.neulet.2017.07.050.Search in Google Scholar PubMed
25. Fukuyama, R, Izumoto, T, Fushiki, S. The cerebrospinal fluid level of glial fibrillary acidic protein is increased in cerebrospinal fluid from Alzheimer’s disease patients and correlates with severity of dementia. Eur Neurol 2001;46:35–8. https://doi.org/10.1159/000050753.Search in Google Scholar PubMed
26. Jung, C, Foerch, C, Schänzer, A, Heck, A, Plate, K, Seifert, V, et al.. Serum GFAP is a diagnostic marker for glioblastoma multiforme. Brain 2007;130:3336–41. https://doi.org/10.1093/brain/awm263.Search in Google Scholar PubMed
27. van Asperen, JV, Fedorushkova, DM, Robe, PA, Hol, EM. Investigation of glial fibrillary acidic protein (GFAP) in body fluids as a potential biomarker for glioma: a systematic review and meta-analysis. Biomarkers 2022;27:1–12. https://doi.org/10.1080/1354750x.2021.2006313.Search in Google Scholar PubMed
28. Fazeli, B, Gómez de San José, N, Jesse, S, Senel, M, Oeckl, P, Erhart, DK, et al.. Quantification of blood glial fibrillary acidic protein using a second-generation microfluidic assay. Validation and comparative analysis with two established assays. Clin Chem Lab Med 2024;62:1591–601. https://doi.org/10.1515/cclm-2023-1256.Search in Google Scholar PubMed
29. Oris, C, Khatib-Chahidi, C, Pereira, B, Bailly Defrance, V, Bouvier, D, Sapin, V. Comparison of GFAP and UCH-L1 measurements using two automated immunoassays (i-STAT® and Alinity®) for the management of patients with mild traumatic brain injury: preliminary results from a French single-center approach. Int J Mol Sci 2024;25:4539. https://doi.org/10.3390/ijms25084539.Search in Google Scholar PubMed PubMed Central
30. Zylyftari, S, Luger, S, Blums, K, Barthelmes, S, Humm, S, Baum, H, et al.. GFAP point-of-care measurement for prehospital diagnosis of intracranial hemorrhage in acute coma. Crit Care 2024;28:109. https://doi.org/10.1186/s13054-024-04892-5.Search in Google Scholar PubMed PubMed Central
31. Boulo, S, Kuhlmann, J, Andreasson, U, Brix, B, Venkataraman, I, Herbst, V, et al.. First amyloid β1‐42 certified reference material for re‐calibrating commercial immunoassays. Alzheimer’s Dement 2020;16:1493–503. https://doi.org/10.1002/alz.12145.Search in Google Scholar PubMed PubMed Central
32. Kobeissy, F, Arja, RD, Munoz, JC, Shear, DA, Gilsdorf, J, Zhu, J, et al.. The game changer: UCH-L1 and GFAP-based blood test as the first marketed in vitro diagnostic test for mild traumatic brain injury. Expert Rev Mol Diagn 2024;24:67–77. https://doi.org/10.1080/14737159.2024.2306876.Search in Google Scholar PubMed
Supplementary Material
This article contains supplementary material (https://doi.org/10.1515/cclm-2025-0667).
© 2025 the author(s), published by De Gruyter, Berlin/Boston
This work is licensed under the Creative Commons Attribution 4.0 International License.
Articles in the same Issue
- Frontmatter
- Editorials
- Challenging the dogma: why reviewers should be allowed to use AI tools
- Multivariate approaches to improve the interpretation of laboratory data
- Review
- Interference of therapeutic monoclonal antibodies with electrophoresis and immunofixation of serum proteins: state of knowledge and systematic review
- Opinion Papers
- Urgent call to the European Commission to simplify and contextualize IVDR Article 5.5 for tailored and precision diagnostics
- The importance of laboratory medicine in the management of CKD-MBD: insights from the KDIGO 2023 controversies conference
- Supplementation of pyridoxal-5′-phosphate in aminotransferase reagents: a matter of patient safety
- HCV serology: an unfinished agenda
- From metabolic profiles to clinical interpretation: multivariate approaches to population-based and personalized reference intervals and reference change values
- Genetics and Molecular Diagnostics
- A multiplex allele specific PCR capillary electrophoresis (mASPCR-CE) assay for simultaneously analysis of SMN1/SMN2/NAIP copy number and SMN1 loss-of-function variants
- General Clinical Chemistry and Laboratory Medicine
- From assessment to action: experience from a quality improvement initiative integrating indicator evaluation and adverse event analysis in a clinical laboratory
- Evaluation of measurement uncertainty of 11 serum proteins measured by immunoturbidimetric methods according to ISO/TS 20914: a 1-year laboratory data analysis
- Assessing the harmonization of current total vitamin B12 measurement methods: relevance and implications
- The current status of serum insulin measurements and the need for standardization
- Method comparison of plasma and CSF GFAP immunoassays across multiple platforms
- Cerebrospinal fluid leptin in Alzheimer’s disease: relationship to plasma levels and to cerebrospinal amyloid
- Verification of the T50 Calciprotein Crystallization test: bias estimation and interferences
- An innovative immunoassay for accurate aldosterone quantification: overcoming low-level inaccuracy and renal dysfunction-associated interference
- Oral salt loading combined with postural stimulation tests for confirming and subtyping primary aldosteronism
- Evaluating the performance of a multiparametric IgA assay for celiac disease diagnosis
- Clinical significance of anti-mitochondrial antibodies and PBC-specific anti-nuclear antibodies in evaluating atypical primary biliary cholangitis with normal alkaline phosphatase levels
- Reference Values and Biological Variations
- Establishment of region-, age- and sex-specific reference intervals for aldosterone and renin with sandwich chemiluminescence immunoassays
- Validation of a plasma GFAP immunoassay and establishment of age-related reference values: bridging analytical performance and routine implementation
- Comparative analysis of population-based and personalized reference intervals for biochemical markers in peri-menopausal women: population from the PALM cohort study
- Hematology and Coagulation
- Evaluation of stability and potential interference on the α-thalassaemia early eluting peak and immunochromatographic strip test for α-thalassaemia --SEA carrier screening
- Cardiovascular Diseases
- Analytical and clinical evaluation of an automated high-sensitivity cardiac troponin I assay for whole blood
- Diabetes
- Method comparison of diabetes mellitus associated autoantibodies in serum specimens
- Letters to the Editor
- Permitting disclosed AI assistance in peer review: parity, confidentiality, and recognition
- Response to the editorial by Karl Lackner
- Hemolysis detection using the GEM 7000 at the point of care in a pediatric hospital setting: does it affect outcomes?
- Estimation of measurement uncertainty for free drug concentrations using ultrafiltration
- Cryoglobulin pre-analysis over the weekend
- Accelerating time from result to clinical action: impact of an automated critical results reporting system
- Recent decline in patient serum folate test levels using Roche Diagnostics Folate III assay
- Kidney stones consisting of 1-methyluric acid
- Congress Abstracts
- 7th EFLM Conference on Preanalytical Phase
- Association of Clinical Biochemists in Ireland Annual Conference
- Association of Clinical Biochemists in Ireland Annual Conference
- 17th Congress of the Portuguese Society of Clinical Chemistry, Genetics and Laboratory Medicine