Caries-segnet: multi-scale cascaded hybrid spatial channel attention encoder-decoder for semantic segmentation of dental caries
-
Jayaraman Priya
 and
Subramanian Kanaga Suba Raja
and
Subramanian Kanaga Suba Raja

Abstract
Objectives
Dental caries is a prevalent oral health issue around the world that leads to tooth aches, root canal infections, and even tooth extractions. Existing dental caries diagnosis models may misdiagnose the disorder and take more time to segment the caries. This research work aims to provide an in-depth analysis of spatial and channel attention mechanism techniques used for semantic segmentation in an encoder-decoder network. For effective performance, the research implements novel techniques to segment the dental caries accurately.
Methods
Deep Fully Connected Residual Block (DFCR) is designed to provide relevant features without the loss of significant information. A novel Hybrid Spatial Channel Attention (HSCA) module is developed for combining significant features with the help of multi-scale spatial features and cross-dimensional channel features.
Results
The proposed methodology performs better than other cutting-edge algorithms by achieving 96.63 % accuracy, 95.77 % dice score, 96.28 % Intersection over Union (IOU) score for the caries dataset, and 96.93 % accuracy, 95.21 % dice value, and 96.1 % IOU for the Tufts dental dataset.
Conclusions
The developed model facilitates in detection of cavities precisely at an earlier stage with the help of dental images. The semantic segmentation of dental caries provides accurate diagnosis by assisting medical professionals.
Introduction
Dental caries is a tooth ailment caused by germs, and it is a chronic localized disease that affects all age groups globally. The severity of dental caries can be detected; depending on various factors, whether the lesion is inside the enamel, dentin, or contacts the pulp. Conventionally, dental practitioners visually inspect and probe their investigations [1]. In such cases, it gradually worsened, penetrating the pulp of the tooth, causing inflammation at the tip of the tooth, and eventually developing into an abscess, cyst, or other dental disease, which can lead to tooth loss if tooth decay is not treated promptly. Different dental X-ray types, such as Panoramic, Bitewing, Periapical, Computed Tomography (CT) scans, and Cone Beam Computed Tomography (CBCT)scans are used to record dental caries [2]. Periapical X-rays can capture one or two teeth covering the crown to the root along with the surrounding bones and it is cost-effective when compared to other imaging modalities [2].
Semantic segmentation is an image segmentation task where pixel-wise classification is performed and each pixel is assigned to an associated category. This strategy is commonly adopted in medical image segmentation for identifying the regions of interest [3]. Recent years have seen an exponential expansion in the potential for semantic segmentation of various diseases, which include brain tumors [4], lung cancer [5], breast cancer [6], retinal vessels [7], covid-19 [8], etc., with deep learning-based techniques.
Gradually, deep learning techniques are making their way into the discipline of dentistry for recognizing patterns from dental radiographs with the goal of automatic diagnosis of abnormalities and assist dentists in effective treatment planning promptly. A fully connected network with a U-shaped Network (U-Net) [9] model is utilized for the teeth segmentation from the panoramic X-ray images [10]. Caries Net encapsulates the full-scale axial attention mechanism in a U-shaped network with panoramic images and effectively delineates caries lesions of varying degrees [11]. Dense U-Net integrates anatomical information from oral images by using mean field approximation for segmenting lesions from three-dimensional CBCT scans [12]. Convolutional Neural Network (CNN)-basedResNet classification model is highly efficient in automatically determining the age of humans [13]. Dental plaque is the primary cause of many oral disorders such as periodontitis, gingivitis, and dental caries, and this can be easily identified by employing the DeepLabV3+ [14]. Vision Transformer, SegNet, and ConvNext are adopted for teeth segmentation as well as mandibular segmentation from dental X-ray images [15]. An intelligent ant lion-based convolution neural model is developed for segmenting and classifying periodontal diseases [16].
Ronneberger et al. [9] proposed a CNN-based end-to-end U-Net [9] architecture, which is a major revolution containing skip connections in the deep learning-based model for segmenting medical images, where the architecture incorporates two major parts, the contracting path, and the decoder path [9]. The encoder performs multiple and pooling operations for capturing the features of the image from deep level to high level. As it moves into the deeper layers, there is a reduction in the spatial dimension and the number of channels increases. The expanding path performs upsampling, concatenation of the input from the encoder, and convolution operations for predicting the regions of interest. Though the U-Net architecture demonstrates improved performance, the increased number of parameters in the skip connections and redundancies in learning the parameters and usage of computational resources are the major drawbacks. Another cutting-edge model as Attention U-Net was designed by combining soft attention gates into the classical U-Net model for highlighting the prominent spatial features by focusing the target efficiently and suppressing the irrelevant spatial features. Inspired by the U-Net’s skip connections [9], and the spatial attention mechanism of Attention U-Net [17], this work has proposed a soft attention-based multi-scale cascaded encoder-decoder network for caries lesions segmentation from periapical X-ray images. The rationale behind this work is to combine local features along with their long-range global dependencies in both spatial as well as channel domains with the aid of attention mechanisms thereby improving the quality of training and increasing prediction accuracy.
The proposed system focuses on what are the most salient features and where the features are located while detecting dental caries from periapical X-rays using a hybrid attention mechanism by reducing redundancy in learning parameters and improving the accuracy of the model.
Significant contributions of our work are as follows.
A multi-scale cascaded hybrid spatial channel attention encoder-decoder network with pyramid feature fusion is proposed for efficient performance. Moreover, the developed model provides precise performance for segmenting the caries lesions from dental periapical X-rays.
A DFCR block is proposed at the encoder that combines the advantages of shallow, middle, and high-level features and this block performs better than the encoder of U-Net by preserving feature loss and gleaning more detailed features.
AHybrid Spatial Channel Attention (HSCA) block is proposed to combine the most significant multi-scale spatial features and cross-dimensional channel features and suppress the irrelevant spatial and channel features.
A novel attention gate is proposed and performed with the encoder-decoder network and is responsible for pyramid feature fusion by highlighting the salient features and suppressing the irrelevant features.
We propose a hierarchical loss function and feature map aggregation using the cascaded encoder-decoder network.
Literature review
Conventional image processing for dental caries segmentation
Sornam et al. utilized 120 panoramic caries images to generate 1-rate by a linearly adaptive particle swarm-based optimization algorithm and assessed the classification performance with a backpropagation neural model but suffered from overfitting. Throughout the analysis, the developed model attained 99 % whereas, the error rate of Minimum Mean Square Error (MMSE) achieves 0.008 [18]. The dental caries diagnosis system was developed by extracting statistical features with filtered images by Laplacian filtering, morphological operations, and machine learning-based back propagation neural networks for classifying the features, but failed to consider the depth. Overall, the performance of the model has experimented with different measures like accuracy, false positive rate, Receiver-Operating Characteristic Curve (ROC), and Precision-Recall Curve (PRC). Here, the accuracy of the model was 97 % and the PRC rate was 0.987 [19]. In 2017 Prerna et al. experimented with panoramic images and devised a model for detecting caries automatically based on Radon, Discrete Cosine Transform along with Principal Component Analysis (PCA)to extract the desired information and it was classified using different machine learning-based classifiers. Here, the random forest classifier provided an accuracy of 86 % outperforming other classifiers [20].
Deep learning techniques for dental caries segmentation
Nevertheless, dental image segmentation using deep learning-based techniques was gradually evolving by incorporating various deep learning-based architectures. Choi et al. experimented with 475 Periapical and developed CNN architecture in conjunction with crown extraction algorithm images for boosting the performance of proximal dental caries detection which required a lot of preprocessing. Therefore, the developed model provided a better F1-max of 0.74 [21]. In 2017 Srivastava et al. proposed a Computer Aided Design (CAD)-based CNN model with more than 100 layers to detect cavities and their performance was higher than certified dentists based on overall F1 score but the sensitivity of enamel caries was low. The performance of the F1-score showed the efficient performance of the model. In accordance, 70 % has revealed a significant performance in the analysis of the score [22]. Casalegno et al. developed semantic segmentation of caries lesions at early stages with near-infrared illumination images and achieved a low Mean IOU score of 72.7 % [23]. Haghanifar et al. presented teeth segmentation with a genetic algorithm and caries detection workflow by capsule network utilizing 480 panoramic radiographs to attain caries. Here, the developed model has attained a recognition accuracy of 90.52 % [24]. Deep CNN-based U-Net architecture resembling a U shape is used for the segmentation of cavities as well as for structure segmentation in bitewing X-rays where the sensitivity of initial caries is very low. The different positive measures were evaluated to show the effective performance of the developed model. Henceforth, the F1-score, precision, and recall have outperformed the 64 , 63, and 65 % than the existing approaches [25]. HybridResneXt-RNN, a Meta-heuristic approach was introduced for segmenting and detecting caries [26]. U-Net architecture with 206 periapical radiographs outperforms Segnet and XNet in terms of all metrics for segmenting three types of dental abnormalities Caries, inter radicular radiolucency, and alveolar bone recession. In addition to these, the developed model proved efficient performance while validating with diverse performance measures. It has shown better analysis while computing with the existing approaches [27]. Although CariesNet’s deep learning-based U shape and full-scale axial attention mechanism focus on segmenting caries-affected with a dice value of 93.64 % they are not efficient for segmenting moderate caries regions from panoramic images [11]. Zhu et al. [28] have developed an effective deep-learning model called CariesNetto to differentiate caries from panoramic radiographs. Here, the high-quality panoramic radiograph dataset was utilized with the consideration of shallow, moderate, and deep carries. However, the U-shaped network has been adapted with the CariesNet to segment the caries from the panoramic images. Throughout the analysis, the developed model achieved better performance than the existing approaches. Ying et al. [29] have designed a deep network for segmenting the caries in the clinically gathered from the tooth X-ray images. Here, the skip connection has been applied from the U-shaped network. However, several methods were utilized to improve the features from the multi-scale. The diverse experimental validation was outperformed to improve the pixel classification for the caries. Moreover, the analysis has proved the superior performance rather than existing approaches. Qayyum et al. [30] have implemented a self-training-based method for detecting and segmenting dental caries efficiently. However, the augmentation techniques were adapted to provide better computational performance. Here, the experiments were validated based on the fully labeled dental radiographic dataset which contains 141 images. Throughout the analysis, the developed model has attained superior performance in terms of accuracy other than existing approaches.
Attention mechanisms
Attention mechanisms mimic human biological attention and become popular nowadays. It enables the baseline model like CNN by providing a certain type of interpolation along with their backpropagation mechanism. Recurrent Neural Network (RNN) based gated recursive CNNs with first attention mechanisms were developed in the discipline of Natural Language Processing (NLP) for learning sentences and their grammatical meanings [31]. Attention mechanisms were later introduced and popularly adopted during the past decade in computer vision for duplicating human visual systems and their effectiveness has been impressively demonstrated [32]. Deep learning models encapsulate numerous channels and each channel is responsible for producing a feature map to represent different objects with the notion of what to pay attention to. The Squeeze and Excitation (SE) attention mechanism envisions the channel-wise interdependencies with the squeeze and excitation module. In general, the error rate has been significantly reduced at a rate of 2.251 % [33]. Gated Channel Transformation (GCT) [34], andStyle Based Recalibration Modules [35] show improvements in channel-wise squeeze and excitation networks. The key notion behind the spatial attention mechanism is robust by learning the feature maps with the relevance of importance in the same layer and they focus on where to pay attention. Gather Excite Net (GENET) [36], Recurrent Models of Vision Attention RAM [37], and Spatial Transformer Networks (STN) [38] are some of the spatial attention mechanisms adopted in computer vision for providing attention to spatial features. While considering the analysis of the F1-score, the model has attained 92.9 %. It reveals the efficient performance of the model than the existing approaches. Attention mechanisms are infused with deep learning models for semantic segmentation by focusing more on the target features and overwhelming the irrelevant features. Attention U-Net is the first attempt to segment CT scans for locating the pancreas where a soft attention gate is infused with the CNN architecture for targeting the most relevant spatial features but fails to consider the interrelationship of features [17]. Breast ultrasounds are segmented with the aid of attention mechanisms along with the multi-scale features but they did not generalize well. Here, the different measures have been validated and executed to maximize the performance. Throughout the analysis, the developed model yielded 97 % accuracy and 98 % specificity [39]. USE-Net combines the essence of skip connections and SE modules into the U-Net [9] for obtaining the revamped channel-wise information without considering the spatial information while segmenting prostate gland and brain Magnetic Resonance Imaging (MRI) [40].
Although various methodologies discussed in the literature review using image processing, attention mechanisms, and deep learning techniques proves their performance for dental caries detection, they face the following issues.
Minimized accuracy: Due to the low contrast level in the image and the presence of noise in the dental images, it could degrade the image quality. Thus, it leads to minimize the accuracy performance in the dental caries segmentation process.
Feature loss: In conventional techniques, while accessing the irregular edges and small size of caries leads to inaccurate segmentation outcomes. These results in the conventional models are not efficient for extracting the relevant features that emerge feature loss.
Redundancy in training model parameters: Considering huge volume of images in the segmentation process, the traditional model shows redundancy in training the model parameters. This redundancy in the training process can easily affect the model’s performance. Also, it is not efficient to generalize the data in unseen data.
Needs more computational resources: The large size and complexity of images and datasets in the training process often require high computational resources otherwise, it merely maximizes the training time to detect the outcomes in the traditional models.
Overfitting problem: During the validation process, when a model fits too closely to the training data, overfitting issues are occurred. The emergence of overfitting issues can result in providing insufficient outcomes that affect the quality of the data.
These limitations from the conventional techniques are effectively resolved by developing a new technique to segment the dental caries effectively to suggest the appropriate treatment from the clinicians.
From the existing work, there is a need for a hybrid mechanism to combine channel and spatial attention for fusing both local and global features and producing a combined attention weight for enriching the semantic segmentation feature map and improving the quality of training. The proposed system overcomes the drawbacks of the existing architectures by reducing the redundancies in learning the parameters for segmenting caries-affected portions from X-ray images.
Proposed methodology
Our research aims to do a thorough analysis of spatial and channel attention mechanism techniques and apply them to the encoder-decoder network for semantic segmentation to provide a thorough account of how they interact and affect performance. Both spatial and channel attention are equally important while segmenting the regions of interest. Hence, we have used both spatial and channel features in shallow and deeper layers and integrated their feature maps to emphasize discriminatory regions and adaptively pick more significant spatial locations and channels by improving the caries segmentation accuracy.
Overall architecture
The proposed multi-scale cascaded attention architecture is designed as depicted in (Figure 1). The encoder comprises four DFCR blocks arranged sequentially. The encoder extracts multi-scale features and produces feature maps S1, S2, S3, and S4 which are then fed into the cascaded structure of the decoder. The attention mechanisms incorporated in the decoder along with the cascaded mechanisms that are responsible for producing prediction feature maps at four stages of the decoder, which are then combined to generate an overall prediction map. Finally, binary segmentation is achieved by using the sigmoid activation function.

Overall architecture of Caries-SegNet a. DFCR b. Upconv block c. conv block.
DFCR block
The proposed system includes a novel DFCR block that replaces the encoder blocks in the traditional U-Net architecture [9]. The DFCR block is illustrated in (Figure 1). This block is designed as an inspiration for the concept of residual. Here there are two identical blocks in a sequential fashion with 3×3 conv in which Batch Normalization and Rectified Linear Unit (ReLU) activation are included. There is another block in the skip connection with 3×3 convolutions Batch Normalization that also activates with a ReLU function. Here w1, w2, and w3 are the weights produced by each of these convolutional blocks. These weights are summed up together to extract the shallow, middle layer, and deeper layer information. As these features are equally important additive features are extracted and their result obtained is comparable to using three different filters of sizes 1×1, 3×3, and 5×5. Hence, it is responsible for widening the receptive field for obtaining the multi-scale spatial features by reducing feature information loss and improving the generalization of the module. The pseudo-code of the Caries-SegNet Algorithm is shown in Algorithm 1.
Caries-SegNet algorithm.
| Input: Dental X-ray images, Masks, Hyperparameters |
| Output: The best model for the segmentation of dental cariesen |
| 1. Noise removalsl |
| 2. Resize the images to 256
|
| 3. Normalize the images |
| 4. Divide the input images into training, test, and validation dataset |
| Training dataid |
| #Encoderes |
| 5. Repeat steps 5 to 9 for 100 epochs |
| 6. # W1, W2, and W3<weights of low, middle, and high-level featuresen |
| For
|
|
|
| S1, S2, S3, S4<Output feature maps from encoderca check |
| #Decoder |
| 7.
|
| 8. For
|
| #Concatenate up convolution of the previous layer, attention gateen |
|
|
| p1, p2, p3, p4<feature maps from individual prediction heads of decoderen |
| 9. Compute aggregated output feature map pen |
| #Individual prediction head weights a1 |
|
|
| 10. Minimize the hierarchical loss functionen |
|
|
| 11. Output the best model for caries segmentation |
Cascaded decoder
In the conventional U-Net [9] architecture, the features are just propagated from the encoder to the expanding path and the skip connections between them to enforce a featurefusion approach which leads to the accretion of feature maps with the same scale. Additionally, the contextual information at the higher levels in the decoder part is also being lost. Inspired by U-Net [9] and Attention U-Net [17] a cascaded decoder network with an attention mechanism and hierarchical feature aggregation is proposed to overcome this problem.
The cascaded decoder comprises the up-conv block for feature upsampling, attention gates for cascaded feature fusion, and the HSCA block for enhancing the feature map further in a robust manner. The decoder encapsulates four HSCA blocks to be combined with the features generated from four stages of the encoder in a pyramid fashion. The output features from the encoder through the skip connections are combined with the up-sampled features of the previous decoder for aggregating the multi-scale features. Then the output of the attention gate is fused with the previous layer’s up-sampled features. These concatenated features are processed by using the HSCA block, where the pixels are combined based on both spatial and channel domains and suppressing the background features. Finally, the output of each HSCA block in the decoder is sent to the prediction head, in which all the predictions are aggregated to produce an overall segmentation mask.
Attention gate
The encoder and the decoder features are fused with the attention gates as depicted in (Figure 2) for highlighting the foreground pixels along with their association with the adjacent pixels and eventually suppressing the irrelevant features. The attention gate generates the attention weights by modifying a small number of parameters without the requirement to train a different model. The attention gate produces an attention weight which is an interrelationship of the shallow layers and dense layers for producing both coarse and fine-grained predictions.

Schematic diagram of attention Gate.
Term S l represents the input from the skip connections and G l represents the gating signal from the up-conv. Attention coefficients; βϵ[0,1] conserve only the activations relevant to the salient regions by locating the important visual regions along with interrelated features and trimming the irrelevant feature responses.
W S ,W G is the linear transformation obtained by the 1×1 convolution operation. The non-linearity of these linear transformations is produced by the swish activation function [39]. Swish activation is defined in Equation (1).
Here, the term σ defines the sigmoid activation function. However, the variable y1 defines the feature map and z1 shows the vector of the gating signal.For each pixel, S l f(I,j) attention values are determined. The pixel-wise area to be focused is determined by the gating signal Gl.
Although swish activation functions have already been adopted in classification [41], it is the first attempt to incorporate the attention mechanism in semantic segmentation. Here, the bias terms are represented as b x and b ω .Swish activation, a non-monotonic function performs comparatively better than ReLUactivation and is considered a better alternative by converging smoothly and minimizes the loss function better than ReLU.
To fetch the output from the attention multiplication is done element-wise with the input feature maps and the attention coefficients are determined based on Equation (4).
Here, the term β is defined as a parameter that can be represented as predefined or learnable.
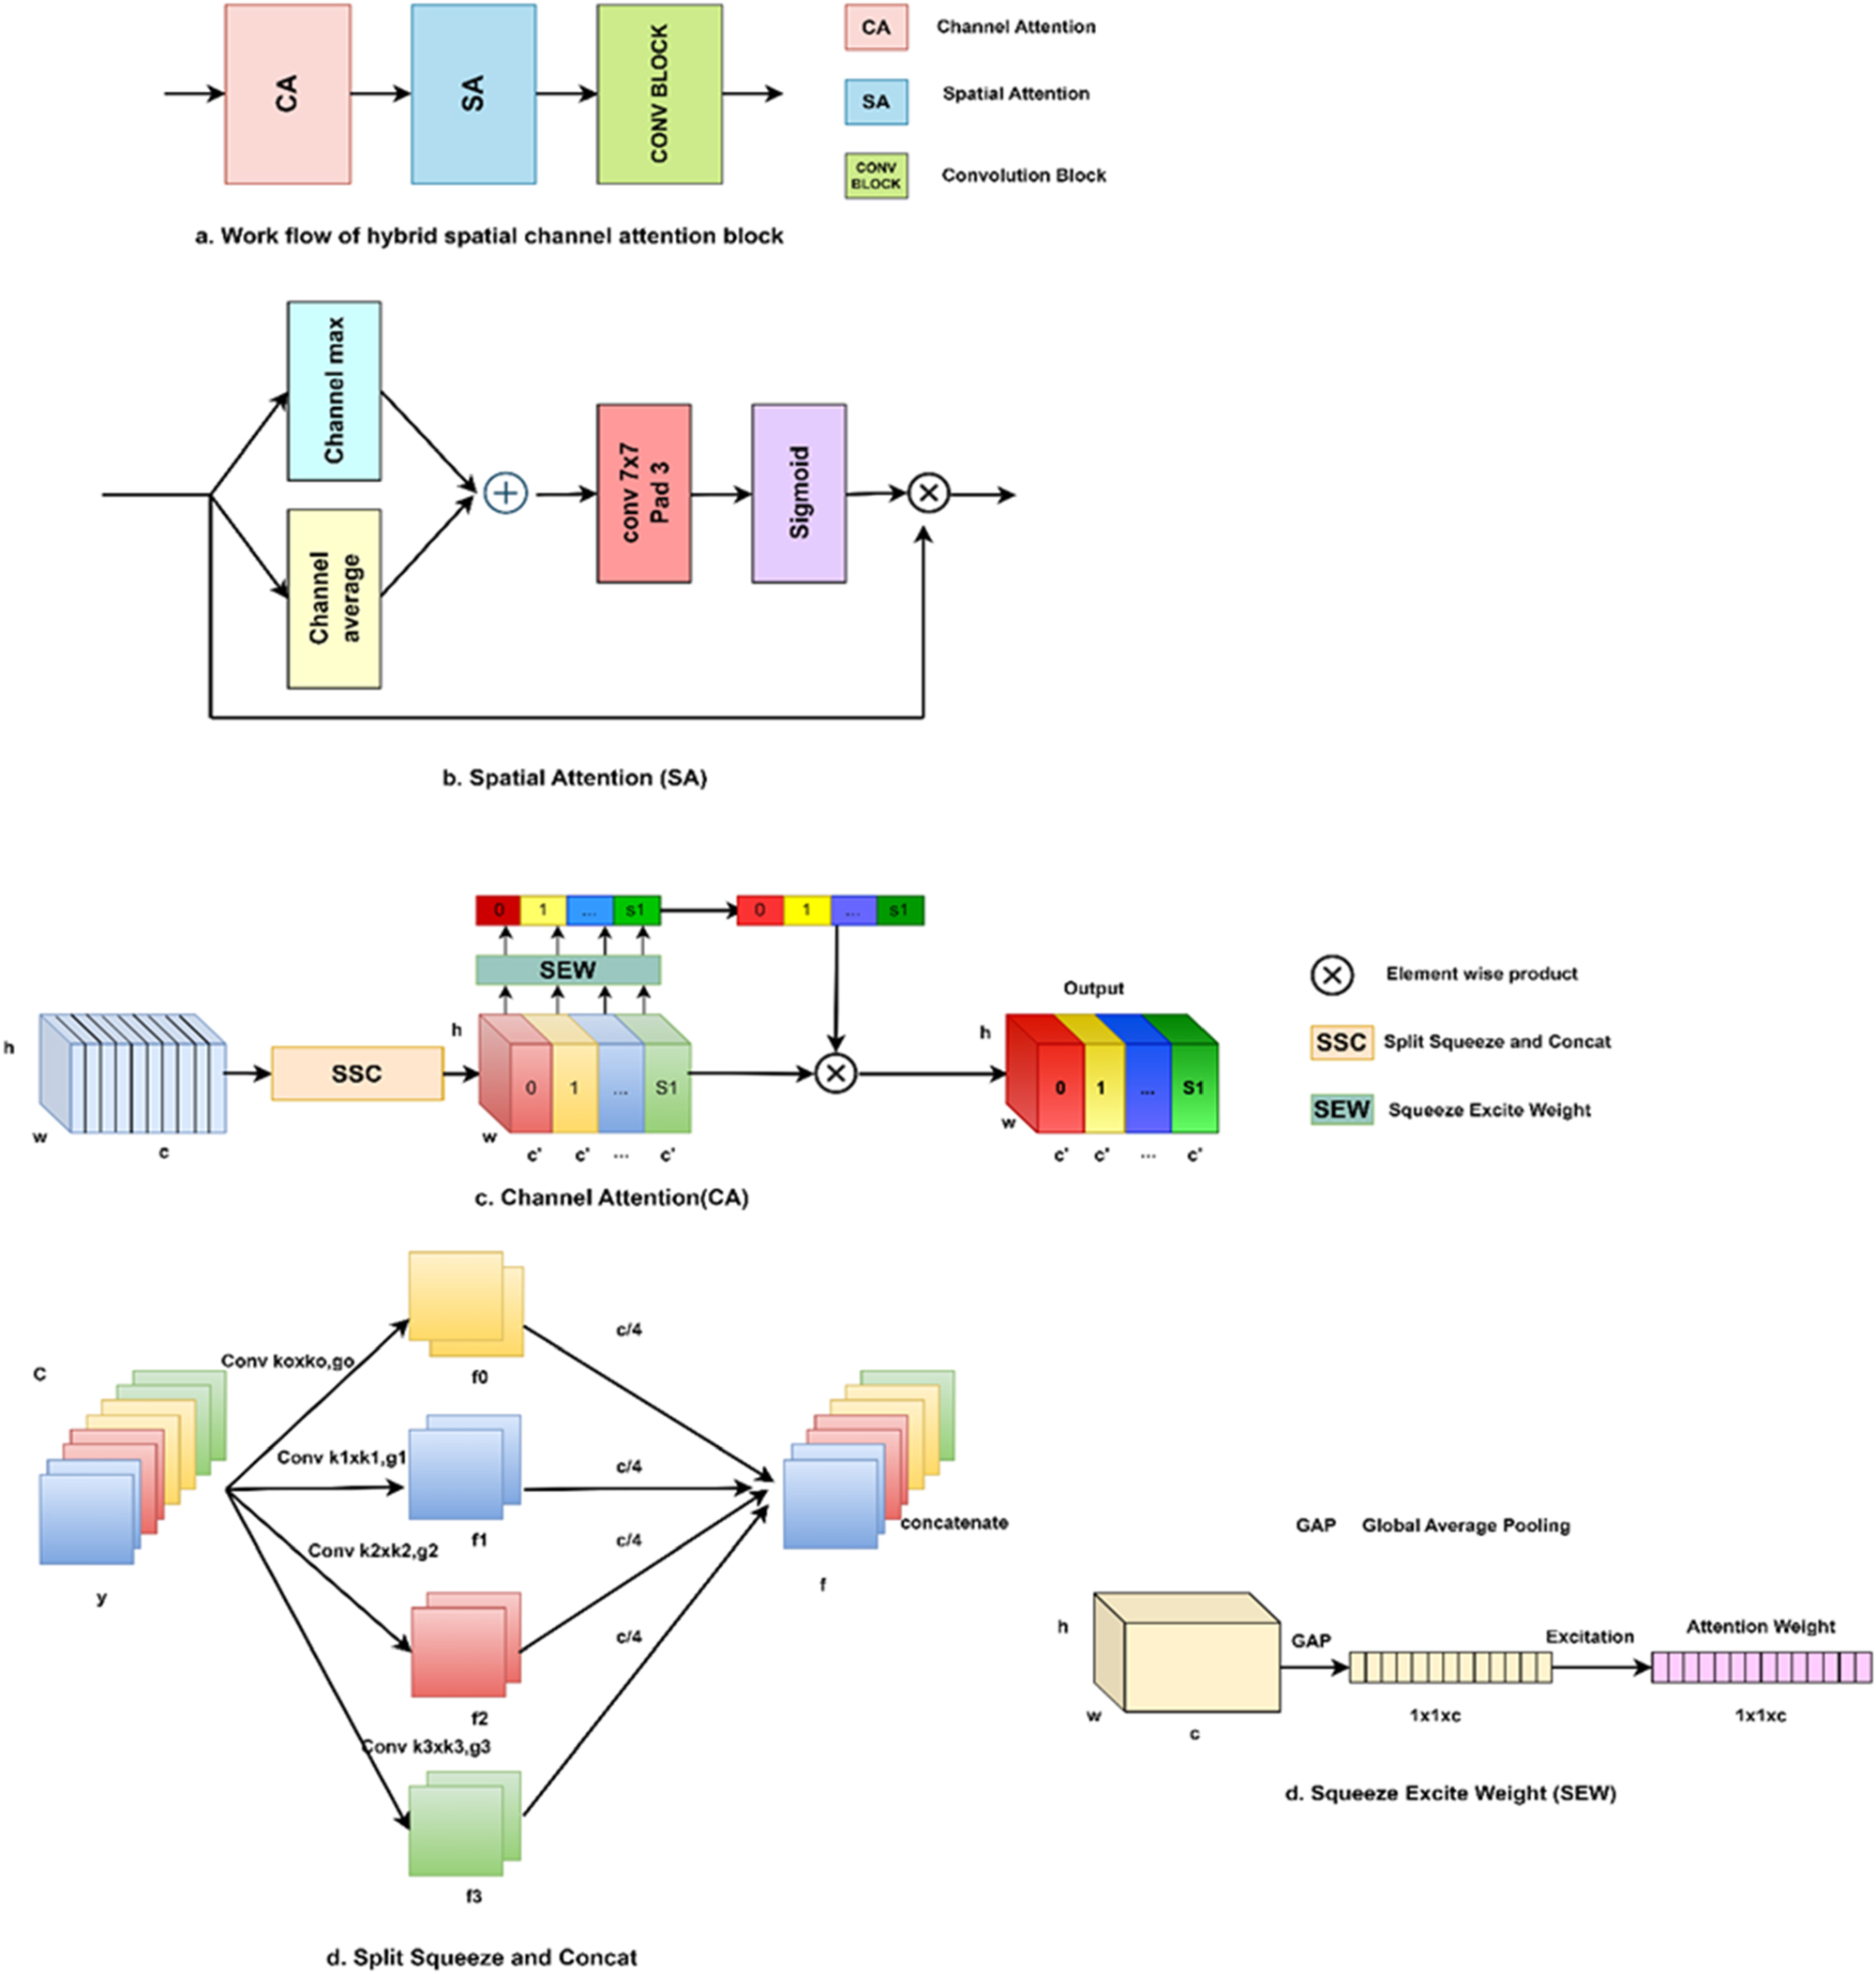
HSCA module
HSCA module as portrayed in (Figure 3) emphasizes blending the features from two primary axes by extracting significant features from the spatial and channel domains to produce aggregated features salient in both domains together. The HSCA module comprises CA(.) and SA(.) arranged in a sequential manner and a convolution block (conv) as in Equation (5).
Here HSCA(.) is the Hybrid Spatial Channel Attention module and y denotes the input tensor. The working principle of the HSCA module is illustrated in (Figure 3). The pseudocode of the Hybrid Spatial Channel Attention is shown in Algorithm 2.
Hybrid spatial channel Attention.
Hybrid spatial channel attention.
| Input: Feature Map of dimension Rwxhxc |
| Output: Feature map of dimension rwxhxcen |
| #Channel attentionit |
| 1. Split and squeeze channels of input feature map with multi-scale kernels to produce feature maps |
|
|
| 2. #Concatenate multi-scale feature maps
|
|
|
| 3. #Generate a vector of attention weight yi using squeeze and excite blocken |
|
|
| 4. #Multi-scalechannel attention vectorit |
|
|
| 5. #Soft attention across various scales |
| ati=softmax(Yi) #channel-wise attention weighten |
| 6. #Channel-wise attention weight multiplied by corresponding feature scaleen |
|
|
| 7. #Integration of multi-scale information |
|
|
| #Spatial attentionen |
| 8. #Input feature map yro |
|
|
| 9. #Spatial attentionit |
|
|
| #Hybrid spatial channel attentionen |
| 10.#
|
|
|
| 11. Return output feature mapro |
Channel attention (CA)
Channel-wise attention is a mechanism that enables the weight of each channel selectively based on their importance and provides a more informative output. A channel attention block is proposed for extracting long-range dependencies along with more granular, multi-scale spatial information. Here, the multi-scale pyramid convolution is being performed to integrate the channel-wise feature maps of the input image. Different scales of spatial information from channel-wise feature maps are obtained by squeezing the input tensor in the channel-wise dimension. Incorporating context features with neighbor scales in this way allows for greater accuracy. The sigmoid activation function enables the recalibration of the attention weights produced by the corresponding channels. Using this channel attention module, the complexity of the model is very low, and it integrates both local and global attention with long-range channel dependencies.
Split Squeeze and Concat (SSC)
This module is responsible for producing channel-wise multi-scale feature maps by ensuring the parallel execution of positional information from the input image at multiple scales. Multiple scale convolution kernels are utilized and channel-wise spatial information with varying scales is obtained by channel-wise squeezing the input tensor. Each feature map with different scales fi has a channel of dimension c’=c/s.i=1, 2,.s-1, and they can learn multi-scale information and interact with cross-channel information locally. Group convolutions are employed in the convolution kernels to decrease the parameters and computational cost.
The group size and kernel size are related as in Equation (6).
Where k denotes the kernel size, g represents the group size. A multi-scale feature map is generated by Equation (7)
Here, the jth kernel size
It represents different scale feature maps. Feature maps are concatenated for producing multi-scale featuremaps with Equation (11).
Figure 3 illustrates the SSC module.
Where f∈Rˆ(c×hxw) represents the multi-scale feature map. Multi-scale attention weight vectors are obtained by extracting the weights from feature maps based on channel-wise attention, which are pre-processed.
The vector of attention weight is represented in Equation (12).
Here, the term SEW(.) defines the Squeeze Excite Weight module. Yi∈Rˆ(C´×1×1), thus it denotes the attention weight. Thus, attention weights with different scales are obtained from the input feature map. Then attention information is fused with cross-dimensional features without destroying the channel-wise original attention vector. The multi-scale channel attention vector is concatenated as shown in Equation (13).
Y represents the multi-scale attention weight vector, Yi denotes the attention value, ⨁ is the concatenation operator. Soft attention across various scales for selecting the different scales of spatial information is provided in Equation (14).
The softmax function is incorporated for producing the recalibrated weight ati, which includes local spatial information and channel-wise attention weight as in Equation (15). This results in the establishment of interplay between local and global channel attention.
Where ati is the attention obtained after channel-wise interaction. Then multi-scale recalibrated channel-wise attention weight ati is multiplied by the corresponding feature scale f i as shown in Equation (16)
Squeeze Excite Weight (SEW) block
The SE block comprises a squeeze and an exciting block for global feature encoding and extracting their channel-wise interrelationship. Let F∈Rˆ(c×h×w) denote the input feature map, and w,c,andh are used for representing width, input channels, and height, respectively. Channel-wise information is obtained using global average pooling using the following equation (18).
Attention weight based on each channel is a calculation as shown in Equation (19).
Here, the term σ represents the sigmoid activation used for the excitation function, ρ represents the ReLU activation function, W1∈Rˆ(C×C/r)andW2∈Rˆ(c/r×C) are the fully connected layers.
Spatial attention (SA)
SA determines to focus in the feature map, which then strengthens the targeted features. The spatial attention SA(.) is represented by Equation (20).
Here, Cm(.) is the maximum value in the channel domain.Ca(.) is the average value in the channel domain. C(.) denotes a 7×7 convolution with a padding of three for increasing the spatial context. σ(.) is the sigmoid activation function.
Conv block
Spatial and channel features extracted by the Hybrid SCA module are further enhanced by using the conv block. EachConvolution block as in Equation (21) comprises three identical blocks.
Here conv(.) represents the conv block, γ represents ReLU, C(.) denotes 3×3 convolution, and BN denotes batch normalization.
Upconv block
The features of the current layer are up-sampled progressively matching the dimension of the features in the succeeding skip connection using Equation (22).
Hierarchical loss function and feature map aggregation
All four stages of the hierarchical encoder are assigned to an individual prediction head. An additive aggregation is used for calculating the final prediction map, as shown in Equation (23).
Terms a1,a2,a3,anda4 are the predictions head weights and p1, p2, p3, and p4 are the feature maps generated by the prediction heads. We have performed our experiments by assigning a value of one to all a1, a2, a3, and a4. We obtained the output of the final prediction for binary segmentation by applying a sigmoid activation function.
Loss functions for individual prediction heads are computed separately, and they are consolidated using Equation (24).
Experimental details
All the experiments in this work are performed using the same approach for training. The hardware configuration used in the experiments was an 11th Gen Intel (R) Core (TM) i5-1155G7 @ 2.50 GHz with 16 GB Random Access Memory (RAM). The Windows 11 operating system with 64 bit, Python 3.10.11, TensorFlow 2.12 and Keras 2.12 deep learning-based frameworks, and Compute Unified Device Architecture (CUDA)12.0 were the software configurations utilized for the experiments. Experiments were carried out for 100 iterations with a batch size of 5, a learning rate of 0.0001, and a ReduceLROnPlateau in the call-back function. The RMSprop optimizer was used for more gentle convergence and improved model performance.
Dental caries dataset
Massive amounts of data play a key role in the Artificial Intelligence (AI)-enabled deep learning era. There is a lack of a sufficient number of dental X-rays used for training the model. Hence, we have collected 1,400 periapical dental X-rays and built a large dental caries data set to meet the data scarcity issues in working with deep learning models.
All the periapical X-rays were collected from a private dental clinic from July 2022 to April 2023, located in Chennai. The images used in this study were fully anonymized and did not contain any personally identifiable information such as the Patient’s name, gender, age, and gender. The study adhered to ethical guidelines and standards applicable to research involving anonymized data. This research involved the use of anonymized data and hence ethical clearance from an Institutional Review Board or ethics committee is exempted. All the images are acquired using SOPRO imaging software and stored in Joint Photographic Experts Group (JPG)format. Digital periapical X-rays are captured by the patient in a sitting position in wheelchair when normal room lighting condition. The images are acquired in two different resolutions 1,496×1,000 and 1,000×1,496. All the images are resized to 256×256 pixels. These images are annotated by three experienced dentists, and caries-affected regions are segmented from the X-rays and labeled using Gimp software (Figure 4). depicts the X-ray image and its corresponding ground truth mask for caries lesions.

Sample image and mask from caries dataset.
Dental X-rays collected from the clinics are degraded by Gaussian noise. Wiener filter, which is a linear filtering technique, adapts itself to the local variance produces better quality images by preserving the edges in the images, and is utilized in the noise removal. Due to privacy issues and labeling expenses, gathering huge datasets for medical imaging is currently difficult. Hence it is essential to adopt data augmentation techniques so it is possible to significantly increase the volume of data. During training time augmentation techniques like horizontal flip, vertical flip, rotation 45°, and diagonal flip were employed to both the images and masks to significantly increase the size of the samples. The parameters of the Weiner filter are shown in Table 1.
Parameters of Weiner filter.
| Parameter | Description | Value |
|---|---|---|
| Noise variance | Variance of the noise | 0.01 |
| Signal variance | Variance of the image signal | 0.1 |
| Kernel size | Size of the filter kernel | 3×3 |
| Local region size | Size of the local averaging region | 5×5 |
| Noise type | Type of noise affecting the image | Gaussian |
Tufts dental dataset
We have also performed our experiments using another benchmark dataset. The images are taken from the Kaggle database by using the link https://www.kaggle.com/datasets/iftakharh/tufts-dental-datasetcustomized. Access date: 22-08-2024.Tufts dental dataset is a multimodal dataset that comprises 1,000 panoramic dental X-rays taken from Tufts Dental University [42]. Radiographic images in TIFF/JPEG format were collected from the patients who underwent radiographic procedures from January 2014 to December 2016. Radiographic images are acquired using OP100 Orthopantomograph and Plammeca Promax 2D (Henry Schein) radiographic units [42]. The images are annotated by dental experts and a fourth-year dental student after a thorough analysis of the radiographs. The images are made visually appealing by adopting the Contrast Limited Adaptive Histogram Equalization (CLAHE)method [43]. Although this is a multimodal dataset with teeth segmentation, abnormality segmentation, and eye tracker information in the experiments only teeth segmentation is used for comparative study.
Evaluation metrics
Model performance is assessed comprehensively using various evaluation metrics from Equation 25–30. True Positive TP refers to correctly segmented caries lesions. True Negative TN denotes a caries lesion misidentified as a healthy area. A False Positive FP is termed as a healthy region that is wrongly identified as a caries-affected region and a False Negative FN is a caries region that is segmented as healthy teeth.
Accuracy: It is the percentage of correctly segmented caries lesions from the background of the image. It is calculated as in Equation (25).
Precision: It refers to the purity of the caries detection as compared with the actual ground truth. It is described in Equation (26).
Recall: It alludes to the way the caries lesion is precisely identified when it appears in the image. It is delineated as in Equation (27).
F1 score: It refers to combining the precision and recall of the caries-affected regions along with the harmonic mean of precision and recall. It is calculated as in Equation (28).
Dice Score: It is the common metric used for pixel-wise comparison between ground truth and predicted caries-affected regions. It is described in Equation (29).
IOU: It is used to measure the common pixels between the real caries masks and predicted caries masks divided by the total pixels in both masks. It is calculated as in Equation (30).
Segmented image results
Figure 5 shows the resultant segmented image comparison on the developed Caries-SegNet-based segmentation model. The Caries-SegNet compared with other algorithms such as UNet [9], UNet++ [44], ResUNet [38], SEResUNet [45], AttentionUNet [17], DANet [46], and TransUNet [47]. Finally, the image results clearly show that the developed model provides the accurate and clear segmented images than other existing models.

Resultant segmented images obtained from the Caries-SegNet and comparison with other algorithms.
Results
The proposed system encapsulates the following aspects like CA, SA, and skips connections that exist between encoder-decoder, and cascaded structure, for correlating the semantic information. U-Net [9] is a classical architecture considered a benchmark for identifying semantic contextual information using a U-shaped model. For evaluating the cascaded structure of the decoder, it resembles the dense connections in the network U-Net++ [44]. The residual connections similar toResUNet [38] are adopted in the DFCR blocks of the encoder to reduce the issue of vanishing gradient. The SE modules in the decoder are inspired by cascaded residual SE blocks from SEResUnet [45]. The hybrid spatial attention module in our system can be compared with DANet [46] which comprises parallel attention techniques for the channel and spatial attention. Inspired by the attention gates in the decoder of Attention Unet [17], the attention gates in the proposed system are included to focus on the salient features of the model. We have also compared our model with the most recent, robust, and powerful TransU-Net [47]. The performance metrics are illustrated in (Figure 7) by fetching the data from Caries and Tufts datasets. The comparative performance analysis of various algorithms with our proposed algorithm for the caries dataset is illustrated in (Table 2).
Performance comparison for Caries dataset.
| Architecture | Accuracy | Precision | Recall | Dice | IOU | F1 score |
|---|---|---|---|---|---|---|
| U-Net [9] | 94.15 | 93.53 | 87.94 | 92.56 | 86.77 | 89.02 |
| U-Net++ [44] | 94.1 | 92.23 | 88.92 | 92.57 | 86.21 | 90.16 |
| ResUNet [38] | 88.12 | 89.61 | 90.71 | 85.24 | 78.94 | 87.97 |
| SEResUNet [45] | 92.23 | 89.96 | 91.59 | 89.62 | 83.29 | 89.26 |
| Attention U-Net [17] | 95.08 | 92.68 | 90.97 | 92.22 | 91.52 | 93.1 |
| DANET [46] | 91.54 | 93.93 | 89.89 | 90.36 | 86.61 | 90.12 |
| TransUNet [47] | 94.12 | 91.78 | 91.6 | 91.6 | 90.12 | 92.45 |
| Caries-SegNet | 96.63 | 95.62 | 94.51 | 95.77 | 96.28 | 94.4 |
Considering Table 2, the performance metrics are entirely implemented on our own with the help of respective models. To ensure a fair and unbiased comparison with the proposed model, we re-implemented all the networks listed in the table and evaluated them using our dataset and experimental conditions. The following steps were taken to ensure consistency:
Uniform Dataset and Preprocessing: The same dataset was used across all methods, ensuring that the input data was identical for every model. Preprocessing steps, such as resizing, normalization, and augmentation, were uniformly applied.
Implementation Details: Each model was implemented following the specifications and configurations described in the respective original papers, using standardized frameworks (e.g., TensorFlow/Keras or PyTorch). Hyperparameters were carefully tuned for each model to achieve optimal performance based on our dataset.
Consistent Evaluation Metrics: The same evaluation metrics (accuracy, precision, recall, F1 score, dice score, and IOU) were applied to all models, ensuring uniformity in assessing performance. The experimental environment, including hardware (CPU/GPU) and software versions, was kept constant.
Reproducibility: Screenshots of the results, along with detailed logs and outputs from each implementation, have been given below to provide transparency and support reproducibility in Figure 6.

Screenshot for implementing the result to ensure transparency and reproducibility of the developed model.

Performance analysis. (a) Overall performance caries dataset; (b) overall performance tufts dataset; (c) accuracy plot caries dataset; (d) accuracy plot tufts dataset; (e) IOU plot caries dataset; (f) IOU plot tufts dataset; (g) dice plot caries dataset; (h) dice plot tufts dataset; (i) ROC plot caries dataset; (j) ROC plot tufts dataset.
The performance of U-Net [9] is like U-Net++ [44] in terms of accuracy, dice score, and IOU, but U-Net outperforms U-Net++ [44] with a 1.3 % rise in precision. ResUNet [38] has comparatively low performance with an accuracy of 88.12 %, precision of 89.61 %, dice score of 85.24 %, IOU of 78.94 %, and F1 score of 87.97 %, but it has a recall value marginally higher than U-Net++ [44] by 1.79 %. The performance of SEResUNet [45] is better than ResUNet [38] with SE modules, but their accuracy is 1.92 % less than U-Net [9] and 1.87 % less than U-Net++ [44]. The accuracy of Attention U-Net [17] is lower than the accuracy of the proposed system by 1.55 %. Recall values of SEResUNet [45]and TransUNet [47] are almost similar. The accuracy of the proposed system is closer to the Attention U-Net [17] by 1.55 %. The proposed system achieves precision higher than DANET [46] by 1.69 % and the recall value is higher than TransUNET [47] by 2.9 %. The F1 score of Attention U-Net is almost close to our system and also has an IOU value compared to the proposed work by 4.76 % [17]. The proposed system is better than TransUNet [47] and Attention U-Net [17] in terms of all metrics.
The performance comparison is done with other models for the Tufts dental dataset [42] as illustrated in (Table 3). ResUNet [38] provides a comparatively low IOU value of 80.1 %, and their differences with the U-Net [9] and U-Net++ [44] are 8.1 and 8.07 % respectively. The proposed system achieves an IOU of 96.1 % which is 16 % higher than ResUNet [38]. The accuracy of U-Net [9] and U-Net++ [44] are lower than the proposed system by 1.71 and 1.74 % respectively. Our system outperforms U-Net by 2 % and obtains a precision of 94.89 % [9]. The F1 score of AttentionUnet [17] is almost like the proposed system. The dice score of SEResUNet [45] is 5.9 % lower than the proposed system. The precision of our system is higher than that of DANET [46] by 1.99 %, U-Net [9] by 2 %, and U-Net++ [44] by 2.78 % respectively. The suggested approach outperforms Attention U-Net [17] by achieving an increase in precision and recall of 2.09 and 1.64 %, respectively. Better performance is provided by the proposed system as compared to the TransUNet [47] with a 3.54 %, and5.98 % increase in terms of dice score and IOU respectively.
Performance comparison for Tufts dental dataset.
| Architecture | Accuracy | Precision | Recall | Dice | IOU | F1 score |
|---|---|---|---|---|---|---|
| U-Net [9] | 95.22 | 93.21 | 87.54 | 92.46 | 86.67 | 89.02 |
| U-Net++ [44] | 95.19 | 92.43 | 88.64 | 92.47 | 86.62 | 90.16 |
| ResUNet [38] | 87.12 | 88.61 | 90.24 | 87.24 | 80.1 | 87.97 |
| SEResUNet [45] | 92.53 | 89.67 | 91.72 | 89.71 | 83.29 | 89.26 |
| Attention U-Net [17] | 94.58 | 93.12 | 92.97 | 92.22 | 91.52 | 92.78 |
| DANET [46] | 92.54 | 93.22 | 90.12 | 90.36 | 88.91 | 90.12 |
| TransUNet [47] | 93.79 | 91.56 | 91.56 | 92.12 | 90.12 | 92.1 |
| Caries-SegNet | 96.93 | 95.21 | 94.61 | 95.66 | 96.1 | 94.32 |
Processing time of the developed model
The processing time of the developed model is computed and compared with diverse existing methods which are shown in Table 4. Certainly, the validation has proved that the developed model attains better performance than the existing methods.
Discussion
The performance measures are compared and validated to assess the reliable performance of the developed model. Here, the different performance measures like accuracy, precision; Recall, Dice, IOU, and F1-score are outperformed as effective performance. While considering accuracy, the ResUNet model shows lower performance which contains 88 % which tentatively affects the system performance. Generally, it does not effectively solve the class imbalance issues. Moreover, the developed model attains 96 % in terms of accuracy. However, the Attention U-Net model attains a second better performance. Throughout the analysis, the developed model attains better performance rather than the existing algorithms. The potential solutions for the developed model are listed below.
Generally, the developed model is not well suited for segmenting the different types of caries in the X-ray images. In accordance, the enhanced ensemble models are to be adapted which helps to eradicate the generalization error in the prediction process. Additionally, the different samples need to be trained to efficiently segment the different types of caries effectively.
In general, there is a lack of large-scale annotated benchmark datasets for caries segmentation. Annotating many training images by experienced dental practitioners and developing a caries dataset is time-consuming and expensive. However, the pre-processing and feature extraction techniques are needed where the significant features are extracted which makes less time while validating the efficient performance for the caries segmentation.
There are a few shortfalls observed in the proposed system. Dentin and pulpal caries are detected more accurately when compared to enamel caries as it is difficult to identify enamel caries radiographically. There are five cases in which periodontal bone loss is wrongly segmented as dental caries. The performance of the proposed system segment for segmenting caries-affected portions from the X-rays is much higher as compared to other cutting-edge models despite a few pitfalls observed. There are a few shortfalls observed while segmenting the teeth mask from the dental X-rays. Metal artifacts present in the teeth sometimes hinder the segmentation accuracy of the model. However, it fails to detect a missing tooth in a few cases with final positive margins of 19. Here, eight of 19 cases contain the final positive margins different from the initial positive margin [48]. However, the proposed system yields excellent performance compared to other models while segmenting the teeth mask from the Tufts dental dataset [42].
Conclusions
A novel model was developed for the automatic segmentation of dental caries from periapical dental X-rays using an encoder-decoder network. The multiscale residual feature extraction in the encoder has learned the finer details of non-homogenous caries-affected regions. The cascaded decoder produced a combined feature map of multiscale spatial and cross-dimensional channel features. This addresses both the essential features to be focused on and where the features were located by suppressing irrelevant background information. It was also responsible for combining local features with their long-range dependencies. Finally, the developed model delivered a segmented outcome with superior performance compared to state-of-the-art algorithms and achieved 96 % accuracy. Based on the visual results and comparison of performance metrics, it was evident that the proposed system was superior to other existing algorithms and yielded excellent performance. Thus, it was demonstrated that the developed model could effectively assist dentists and radiologists in detecting dental caries, and very effective while segmenting the dentin and pulpal caries. However, the developed model can be effective when processed using pixel-level labels and 2D images as they can provide more accurate spatial information. Moreover, using the attention mechanism in the segmented model increases the computational time. Therefore, in the future, the model can concentrate on weakly supervised techniques for processing image-level and point labels rather than pixel-level labels. However, the 2D images can be extended to 3D images to provide more accurate and spatial information. The K-fold validation process can be considered to improve the generalizability of the unseen data and enhance its applicability in real-world scenarios. In addition, a novel strategy can be incorporated for parameter reduction in the CNN-based attention mechanisms to minimize the computational time without degrading the model’s performance.
-
Research ethics: The local Institutional Review Board deemed the study exempt from review.
-
Informed consent: Not applicable.
-
Author contributions: All authors have accepted responsibility for the entire content of this manuscript and approved its submission.
-
Use of Large Language Models, AI and Machine Learning Tools: None declared.
-
Conflict of interest: Authors state no conflict of interest.
-
Research funding: None declared.
-
Data availability: The data underlying this article are available in Dataset: https://www.kaggle.com/datasets/iftakharh/tufts-dental-datasetcustomized.
References
1. Ntovas, P, Loubrinis, N, Maniatakos, P, Rahiotis, C. Evaluation of dental explorer and visual inspection for the detection of residual caries among Greek dentists. J Conserv Dent 2018;21:311–18. https://doi.org/10.4103/jcd.jcd_67_17.Search in Google Scholar PubMed PubMed Central
2. Shivpuje, BV, Sable, GS. A review on digital dental radiographic images for disease identification and classification. J Eng Res Appl 2016;6:38–42.Search in Google Scholar
3. Wang, R, Lei, T, Cui, R, Zhang, B, Meng, H, Nandi, AK. Medical image segmentation using deep learning: a survey. IET Image Process 2022;16:1243–67. https://doi.org/10.1049/ipr2.12419.Search in Google Scholar
4. Isensee, F, Kickingereder, P, Wick, W, Bendszus, M, Maier-Hein, KH. Brain tumor segmentation and radiomics survival prediction: contribution to the BRATS 2017 challenge. Lect Notes Comput Sci 2018;10670:287–97. https://doi.org/10.1007/978-3-319-75238-9_25.Search in Google Scholar
5. Nishio, M, Fujimoto, K, Matsuo, H, Muramatsu, C, Sakamoto, R, Fujita, H. Lung cancer segmentation with transfer learning: usefulness of a pretrained model constructed from an artificial dataset generated using a generative adversarial network. Front Artif Intell 2021;4:1–10. https://doi.org/10.3389/frai.2021.694815.Search in Google Scholar PubMed PubMed Central
6. Baccouch, eA, Garcia-Zapirain, B, Castillo, C, Elmaghraby, AS. Connected-UNets: a deep learning architecture for breast mass segmentation. NPJ Breast Cancer 2021;7:1–12. https://doi.org/10.1038/s41523-021-00358-x.Search in Google Scholar PubMed PubMed Central
7. Zhuang, J. LadderNet: multi-path networks based on U-Net for medical image segmentation. arXivpreprint 2018;2–5. [Online]. Available: http://arxiv.org/abs/1810.07810.Search in Google Scholar
8. Yao, HY, Wan, WG, Li, X. A deep adversarial model for segmentation-assisted COVID-19 diagnosis using CT images. EURASIP J Appl Signal Process 2022;2022. https://doi.org/10.1186/s13634-022-00842-x.Search in Google Scholar PubMed PubMed Central
9. Navab, N, Hornegger, J, Wells, WM, Frangi, AF. Medical image computing and computer-assisted intervention - miccai 2015. In: 18th International Conference Munich, Germany, October 5-9, 2015 proceedings. Springer International Publishing, part III, vol 9351: 12–20 pp.10.1007/978-3-319-24574-4Search in Google Scholar
10. Whaites, E. Dental panoramic radiography. Essentials Dent Radiogr Radiol 2003;161.Search in Google Scholar
11. Zhu, H, Cao, Z, Lian, L, Ye, G, Gao, H, Wu, J. CariesNet: a deep learning approach for segmentation of multi-stage caries lesion from oral panoramic X-ray image. Neural Comput Appl 2022;2. https://doi.org/10.1007/s00521-021-06684-2.Search in Google Scholar PubMed PubMed Central
12. Zheng, Z, Yan, H, Setzer, FC, Shi, KJ, Mupparapu, M, Li, J. Anatomically constrained deep learning for automating dental CBCT segmentation and lesion detection. IEEE Trans Autom Sci Eng 2021;18:603–14. https://doi.org/10.1109/TASE.2020.3025871.Search in Google Scholar
13. Sathyavathi, S, Baskaran, KR. Human age estimation using deep convolutional neural network based on dental images (Orthopantomogram). IETE J Res 2023:1–8. https://doi.org/10.1080/03772063.2023.2165177.Search in Google Scholar
14. You, W, Hao, A, Li, S, Wang, Y, Xia, B. Deep learning-based dental plaque detection on primary teeth: a comparison with clinical assessments. BMC Oral Health 2020;20:1–7. https://doi.org/10.1186/s12903-020-01114-6.Search in Google Scholar PubMed PubMed Central
15. Karacan, MH, Yucebas, SC. A deep learning model with attention mechanism for dental image segmentation. In: HORA 2022 - 4th Int Congr Human-Computer Interact Optim Robot Appl Proc. Ankara, Turkey: IEEE; 2022.10.1109/HORA55278.2022.9800072Search in Google Scholar
16. Jaiswal, P, Bhirud, DS. An intelligent deep network for dental medical image processing system. Biomed Signal Process Control 2023;84:104708. https://doi.org/10.1016/j.bspc.2023.104708.Search in Google Scholar
17. Oktay, O. Attention U-Net: learning where to look for the pancreas. Midl; 2018. [Online]. Available: http://arxiv.org/abs/1804.03999.Search in Google Scholar
18. Sornam, M, Prabhakaran, M. A new linear adaptive swarm intelligence approach using back propagation neural network for dental caries classification. In: IEEE Int Conf Power, Control Signals Instrum Eng. Chennai, India: IEEE; 2017:2698–703 pp.10.1109/ICPCSI.2017.8392208Search in Google Scholar
19. Geetha, V, Aprameya, KS, Hinduja, DM. Dental caries diagnosis in digital radiographs using back-propagation neural network. Health Inf Sci Syst 2020;8. https://doi.org/10.1007/s13755-019-0096-y.Search in Google Scholar PubMed PubMed Central
20. Singh, P, Sehgal, P. Automated caries detection based on Radon transformation and DCT. In: 8th Int Conf Comput Commun Netw Technol IEEE. Delhi, India: IEEE; 2017:1–6 pp.10.1109/ICCCNT.2017.8204030Search in Google Scholar
21. Choi, J, Eun, H, Kim, C. Boosting proximal dental caries detection via combination of variational methods and convolutional neural network. J Signal Process Syst 2018;90:87–97. https://doi.org/10.1007/s11265-016-1214-6.Search in Google Scholar
22. Srivastava, MM, Kumar, P, Pradhan, L, Varadarajan, S. Detection of tooth caries in bitewing radiographs using deep learning. Nips; 2017. [Online]. Available: http://arxiv.org/abs/1711.07312.Search in Google Scholar
23. Casalegno, F, Newton, T, Daher, R, Abdelaziz, M, Lodi-Rizzini, A, Schürmann, F, et al.. Caries detection with near-infrared transillumination using deep learning. J Dent Res 2019;98:1227–33. https://doi.org/10.1177/0022034519871884.Search in Google Scholar PubMed PubMed Central
24. Haghanifar, A, Majdabadi, MM. PaXNet: dental caries detection in panoramic X-ray using ensemble transfer learning and capsule classifier 2020:1–14. [Online]. Available: http://arxiv.org/abs/2012.13666.KoSBSearch in Google Scholar
25. Lee, S, il Oh, S, Jo, J, Kang, S, Shin, Y, won Park, J. Deep learning for early dental caries detection in bitewing radiographs. Sci Rep 2021;11:1–8. https://doi.org/10.1038/s41598-021-96368-7.Search in Google Scholar PubMed PubMed Central
26. Kumari, AR, Rao, SN, Reddy, PR. Design of hybrid dental caries segmentation and caries detection with meta-heuristic-based ResneXt-RNN. Biomed Signal Process Control 2022;78:103961. https://doi.org/10.1016/j.bspc.2022.103961.Search in Google Scholar
27. Khan, HA, Haider, MA, Ansari, HA, Ishaq, H, Kiyani, A, Sohail, K, et al.. Automated feature detection in dental periapical radiographs by using deep learning. Oral Surg Oral Med Oral Pathol Oral Radiol 2021;131:711–20. https://doi.org/10.1016/j.oooo.2020.08.024.Search in Google Scholar PubMed
28. Zhu, H, Cao, Z, Lian, L, Ye, G, Gao, H, Wu, J. CariesNet: a deep learning approach for segmentation of multi-stage caries lesion from oral panoramic X-ray image. Neural Comput Appl 2023;35:16051–9. https://doi.org/10.1007/s00521-021-06684-2.Search in Google Scholar PubMed PubMed Central
29. Ying, S, Wang, B, Zhu, H, Liu, W, Huang, F. Caries segmentation on tooth X-ray images with a deep network. J Dent 2022;119:104076. https://doi.org/10.1016/j.jdent.2022.104076.Search in Google Scholar PubMed
30. Qayyum, A, Tahir, A, Atif Butt, M, Luke, A, Abbas, HT, Qadir, J, et al.. Dental caries detection using a semi-supervised learning approach, scientific reports,2023; 749.10.1038/s41598-023-27808-9Search in Google Scholar PubMed PubMed Central
31. Ch, OK, Van Merriënboer, B, Bahdanau, D, Bengio, Y. On the properties of neural machine translation: encoder–decoder approaches. In: Proc. SSST 2014 - 8th Work. Syntax Semant Struct Stat Transl. arxiv; 2014:103–11 pp.Search in Google Scholar
32. Guo, MH, Xu, TX, Liu, JJ, Liu, ZN, Jiang, PT, Mu, TJ, et al.. Attention mechanisms in computer vision: a survey. Comput Vis Media 2022;8:331–68. https://doi.org/10.1007/s41095-022-0271-y.Search in Google Scholar
33. Hu, J, Shen, L, Sun, G. Squeeze-and-Excitation networks. In: Proc IEEE Comput Soc Conf Comput Vis Pattern Recognit. arxiv; 2018:7132–41 pp.10.1109/CVPR.2018.00745Search in Google Scholar
34. Yang, Z, Zhu, L, Wu, Y, Yang, Y. Gated Channel transformation for visual recognition. In: Proc IEEE Comput Soc Conf Comput Vis Pattern Recognit. CVPR; 2020:11791–800 pp.10.1109/CVPR42600.2020.01181Search in Google Scholar
35. Lee, H, Kim, HE, Nam, HSRM. A style-based recalibration module for convolutional neural networks. In: Proc IEEE Int Conf Comput Vis. ICCV; 2019:1854–62 pp.10.1109/ICCV.2019.00194Search in Google Scholar
36. Hu, J, Shen, L, Albanie, S, Sun, G, Vedaldi, A. Adv Neural inf Process Syst. NeurIPS; 2018:9401–11 pp.Gather-excite: exploiting feature context in convolutional neural networksSearch in Google Scholar
37. Mnih, V, Heess, N, Graves, A, Kavukcuoglu, K. Recurrent models of visual attention. Adv Neural Inf Process Syst 2014;3:2204–12.Search in Google Scholar
38. Diakogiannis, FI, Waldner, F, Caccetta, P, Wu, C. ResUNet-a: a deep learning framework for semantic segmentation of remotely sensed data. ISPRS J Photogrammetry Remote Sens 2020;162:94–114. https://doi.org/10.1016/j.isprsjprs.2020.01.013.Search in Google Scholar
39. Lyu, Y, Xu, Y, Jiang, X, Liu, J, Zhao, X, Zhu, X. AMS-PAN: breast ultrasound image segmentation model combining attention mechanism and multi-scale features. Biomed Signal Process Control 2023;81:104425. https://doi.org/10.1016/j.bspc.2022.104425.Search in Google Scholar
40. Rundo, L, Han, C, Nagano, Y, Zhang, J, Hataya, R, Militello, C, et al.. USE-Net: incorporating Squeeze-and-Excitation blocks into U-Net for prostate zonal segmentation of multi-institutional MRI datasets, 2019, https://doi.org/10.1016/j.neucom.2019.07.006,Search in Google Scholar
41. Avenash, R, Viswanath, P. Semantic segmentation of satellite images using a modified cnn with hard-swish activation function. In: VISIGRAPP 2019 - Proc 14th Int Jt. Conf Comput Vision, Imaging Comput Graph Theory Appl. VISIGRAPP (4: VISAPP); 2019, vol 4:413–20 pp.10.5220/0007469600002108Search in Google Scholar
42. Panetta, K, Rajendran, R, Ramesh, A, Rao, S, Agaian, S. Tufts dental database: a multimodal panoramic X-ray dataset for benchmarking diagnostic systems. IEEE J Biomed Heal Informatics 2022;26:1650–9. https://doi.org/10.1109/JBHI.2021.3117575.Search in Google Scholar PubMed
43. Pisano, ED, Zong, S, Hemminger, BM, DeLuca, M, Johnston, RE, Muller, K, et al.. Contrast limited adaptive Histogram equalization image processing to improve the detection of simulated spiculations in dense mammograms 1998;11:193–200, https://doi.org/10.1007/bf03178082.Search in Google Scholar
44. Zhou, Z, Rahman, MM, Siddiquee, N, Tajbakhsh, Liang, J. Unet++: a nested u-net architecture for medical image segmentation. Lect Notes Comput Sci 2018;11045:3–11. https://doi.org/10.1007/978-3-030-00889-5_1.Search in Google Scholar PubMed PubMed Central
45. Cao, Z, Yu, B, Lei, B, Ying, H, Zhang, X, Chen, DZ, et al.. Cascaded SE-ResUnet for segmentation of thoracic organs at risk. Neurocomputing 2021;53:357–68. https://doi.org/10.1016/j.neucom.2020.08.086.Search in Google Scholar
46. Fu, J. Dual attention network for scene segmentation. In: Proc IEEE/CVF Comput Soc Conf Comput Vis Pattern Recognit. IEEE; 2019:141–3149 pp.10.1109/CVPR.2019.00326Search in Google Scholar
47. Chen, J. TransUNet: transformers make strong encoders for medical image segmentation 2021;1–13, [Online]. Available: http://arxiv.org/abs/2102.04306Search in Google Scholar
48. Prasad, K, Sharma, R, Habib, D, Sinard, R, Mannion, K, Rohde, S, et al.. How often is cancer present in oral cavity Re-resections after initial positive margins? Laryngoscope 2023;134:717–24. https://doi.org/10.1002/lary.30959.Search in Google Scholar PubMed PubMed Central
© 2025 the author(s), published by De Gruyter, Berlin/Boston
This work is licensed under the Creative Commons Attribution 4.0 International License.
Articles in the same Issue
- Frontmatter
- Research Articles
- An exploratory study of pilot EEG features during the climb and descent phases of flight
- Gesture recognition from surface electromyography signals based on the SE-DenseNet network
- Empirical analysis on retinal segmentation using PSO-based thresholding in diabetic retinopathy grading
- Prediction of remaining surgery duration based on machine learning methods and laparoscopic annotation data
- Caries-segnet: multi-scale cascaded hybrid spatial channel attention encoder-decoder for semantic segmentation of dental caries
- An analysis of initial force and moment delivery of different aligner materials
- Influence of microstructure on metal-ceramic bonding in SLM-manufactured titanium alloy crowns and bridges
- Design and evaluation of powered lumbar exoskeleton based on human biomechanics
- Evaluation of mesoporous polyaniline for glucose sensor under different pH electrolyte conditions