Development of a microfluidic electroosmosis pump on a chip for steady and continuous fluid delivery
-
Vania Silverio

 ,
Patricia A. G. Canane
,
Patricia A. G. Canane

Abstract
Infusion therapy is the most common form of therapy used in health care. However, the existing infusion devices show higher flow discrepancies as flow rates decrease to a few nL min−1. As a result, dosing errors can contribute to the morbidity and mortality of patients. In the scope of project 18HLT08 MeDD II – Metrology for drug delivery, this investigation aims at the development of a silicon microchip flow pump capable of steadily and continuously dispense very low flow rates of a few nL min−1. The fabrication methodologies explored here use a combination of typical cleanroom micro/nanofabrication techniques and off-the-shelf equipment. Preliminary tests show flow rates as low as 45 nL min−1 can be obtained in this microfluidic electroosmotic pump. The experimental flow rates are in good agreement with results predicted by multiphysics simulation, with less than 8% deviation ratio. This cost effective electroosmotic micropump has the potential to act as a steady and continuous drug delivery system to neonatal patients as well as to organs on chip (OoC), determining the stability of the shear stress imposed on the cells or the right cell culture medium conditions.
Introduction
Pump technology is a vital solution for a wide range of applications from laboratories to industrial environments. Positive and non-positive displacement pumps are typical types of pumping systems. Positive displacement pumps are set to provide constant flow at fixed speed independent of changes in pressure of the system. Examples of positive displacement pumps are diaphragm pumps, peristaltic pumps and piston pumps. As for non-positive displacement pumps, examples are centrifugal pumps and propeller pumps, typically used for low pressure applications. These differ from positive displacement pumps as flow rate is dependent on pressure at the outlet of the pumping system which is rarely considered constant. The syringe pump is an example of a small, positive displacement pump. Its mechanism relies on a mechanical action by the stepper motor on the linear driver, usually a drive screw, consequently moving the pusher block. A pushing force is then acted on the syringe plunger which in turn exerts a pressure force on the fluid inside the syringe (Figure 1).
![Figure 1:
Diagram showing the parts of a syringe pump [1].](/document/doi/10.1515/bmt-2022-0051/asset/graphic/j_bmt-2022-0051_fig_001.jpg)
Diagram showing the parts of a syringe pump [1].
Syringe pumps are one of the main infusion equipments used in hospitals to deliver drugs to patients [2]. However, Batista et al. [3] showed that these pumps at flow rates lower than 10 μL h−1 may not maintain a steady flow throughout the duration of the process. There is still the need for accurate and precise drug dosage that is both safe and effective at such small flow rates, invaluable to tackle major technological challenges for drug infusion administration.
Microfluidics is the science and technology dealing with fluid-handling in the nano-to-millilitre scale and has major applications in pharmaceutical, food, biomedical, mechanical or chemical sectors. Microfluidics can be particularly interesting to precisely manipulate and control minute amounts of fluid geometrically constrained to a small scale (typically of a few micrometers). Handique and co-workers [4] used cleanroom fabrication techniques to develop a microfluidic pump based on thermopneumatic actuation of air trapped in a chamber connected to the main channel. This thermally induced pumping system was able to produce a flow rate on the order of 1,200 nL min−1 by manipulating the current sent through the microfabricated heater and heating the air in the pressure-generating chamber at a rate of about 360 °C min−1. However, to achieve very low flow rates, of the order of few nL min−1, thermal control is of utmost importance [5]. Thermal insulation is required for quasi-steady flow because small thermal fluctuations of just ±1 °C in the environment cause thermal expansion or contraction of the pump components and can generate flow rate fluctuations [6]. Another example of microfluidic pump development is found in the work of Geipel et al. [7, 8]. The authors developed a MEMS peristaltic piezoelectric pumping system on a silicon chip, able to achieve flow rates in the range 0.1–50 μL min−1. The pump operating mode consisted in the electrical actuation of two piezoelectric diaphragms to generate the flow. The linear correlation between the actuation frequency and the flow rate implied that the volume delivered per stroke at each pump cycle to be constant. However, a decrease of the volume delivered per pump cycle was observed when increasing actuation frequency, as for lower frequencies a pulsatile flow signal was detected [9]. More recently, Temiz and Delamarche [10] presented a microfluidic pump based on capillarity. The chip additionally contained microfabricated electrodes to serve as capacitance sensors to measure the flow. The authors found good agreement of flow rate calculation from capacitance measurements when compared to those obtained by processing images of the flow. Nonetheless, the capillary filling was seen to be highly dependent on the surface wettability and liquid, as expected, and it was suggested to be responsible for non-uniformities of liquid filling. Moreover, the volume of liquid dispensed was limited to the capacity of the pump reservoir of 420 nL.
Electroosmosis pumping offer advantages when compared to the systems described above. They create pulse-free flows at constant temperature and may deliver virtually any amount of fluid [11]. Electroosmotic pumping is a non-mechanical pump principle based on the movement of charged areas in the liquid due to an externally applied electric field. Li and co-workers cover the progress made in electroosmotic pump development on microchips from 2009 to 2018 [12]. They show that one advantage of these pumps is the low flow rates generated, down to a few μL min−1.
In this paper we make use of cleanroom micro/nanofabrication techniques and off-the-shelf equipment to devise a simple microfluidic pump electroosmotically actuated with the objective of dispensing even lower flow rates around 100 nL min−1 in a constant, continuous, and steady manner at driving DC currents. This is done while also canceling the formation of bubbles, characteristic of direct current electroosmotic pumps.
Materials and methods
Simulation of the micropump
The design and operation parameters for the microfluidic pump are firstly determined in COMSOL Multiphysics® 5.1, considering the geometry in Figure 2. The simulation of relevant physical principles is done using the computational fluid dynamics (CFD) module and Microfluidics module.
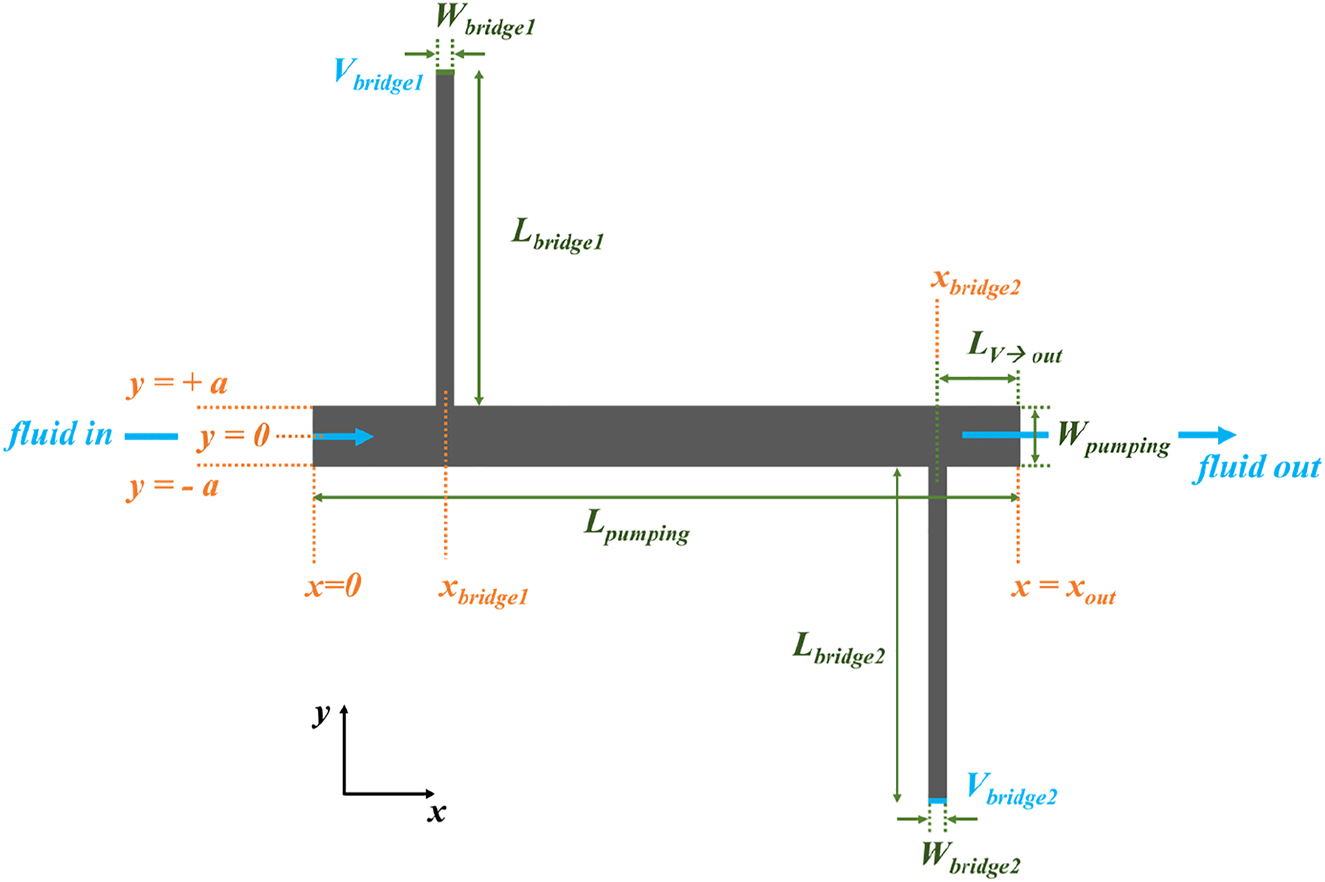
Geometry and variables considered in the simulations. W is the width in mm, L is the length in mm, V is the position in the bridge where voltage is applied (representing the position of the electrical contact).
The flow is modelled for a Newtonian fluid (water, liquid) of constant density and incompressible considering fluid flow induced by applying an electric field [11]. The charged solution is set to form close to the liquid-electrode interface, known as electric-double layer, which started to move along the pumping channel. The problem to be addressed supposes the fluid flows at very low Reynolds numbers. As such, the flow is solved as stationary creeping flow, also referred to as Stokes flow, using the Creeping Flow (spf) interface. As is characteristic of a Stokes flows, inertial terms of the Navier Stokes equations are neglected in preference to the viscous terms. The Stokes equation is solved to determine the conservation of momentum and the continuity equation is solved for the conservation of mass as.
where p is the pressure in [Pa], I is the identity matrix, μ is the dynamic viscosity in [Pa.s], u is the velocity given in [m s−1] and F is the volume force in [N m−3].
And:
where ρ is the volumetric mass density in [kg m−3].
A laminar inflow boundary condition with average velocity is set at the inlet as:
where L entr is the length of the fictitious entrance given in [m], ∇ t is the tangential gradient, p entr is the pressure at the fictitious entrance in [Pa] and n is the boundary normal pointing out of the domain.
The outlet is set with a pressure boundary condition:
where
The fluid electric properties are uniform and the walls are set with electroosmotic velocity, tangential electric field and stationary.
where u EO is the electroosmotic mobility [m2 V−1 s−1] and E t is the tangential component of the electric field, [V m−1] given by
Here, E is the electric field vector in [V m−1], obtained as
where V is the electric potential [V].
The flow that balances viscous stresses with electrical forcing (electroosmotic flow) is given by the velocity term u EO which can be deduced from.
where ϵ r is the relative permittivity [F m−1], ϵ 0 is the permittivity of vacuum ≈1/36π10−9 [F m−1] and ζ is the Zeta potential [V].
Physics interface of electric currents (ec) is set with current conservation.
where Q j is the current source in [A m−3] and J is the current density (volume) [A m−2] defined as
Here σ is the electrical conductivity [S m−1] and J e is the current density generated externally [A m−2].
The electric displacement, D [C m−2] is related to the fluid’s relative permittivity ϵ r as.
The electric insulation follows
The mesh is set to a predefined size as Fine with maximum element size of 1.22 × 10⁻⁴ m and minimum element size of 2.3 × 10⁻⁵ m. The solver used is PARDISO. The geometry resulting from simulations, giving the results within the defined volumetric flow rate range, was fabricated.
Microfabrication
The procedure for microfabrication has 6 main tasks (A–F) and is followed according to Figure 3.
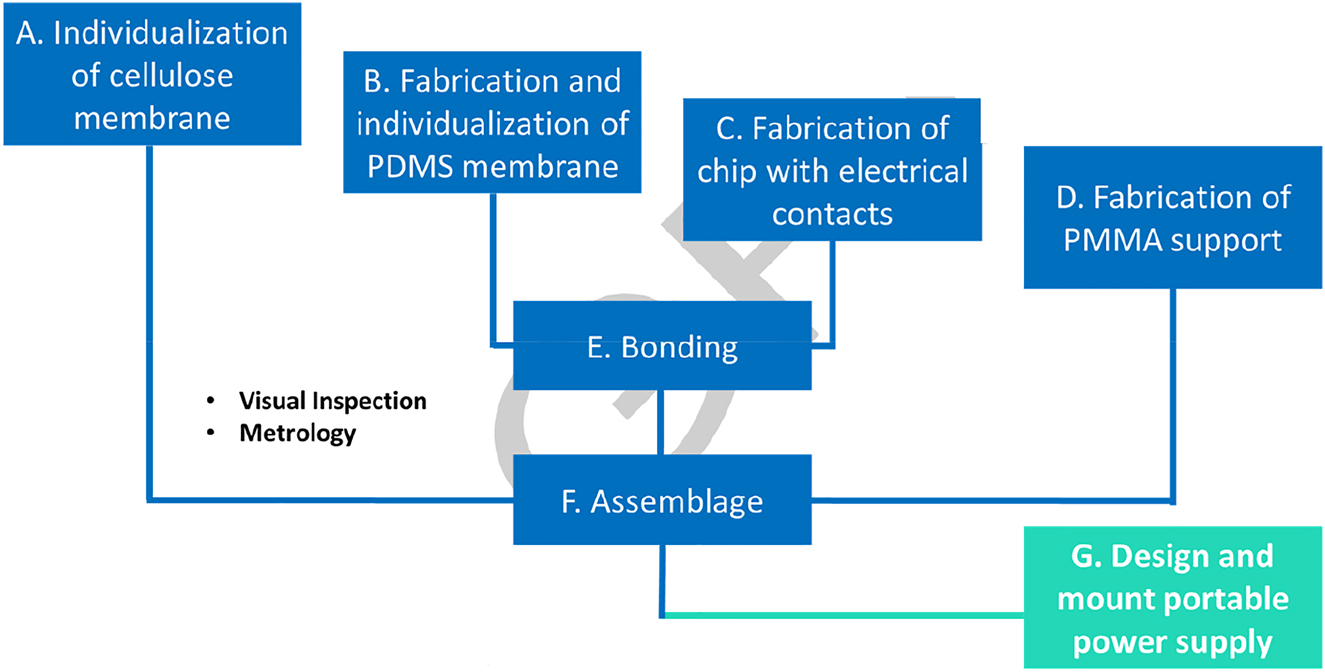
Schematics of the fabrication steps.
Individualization of cellulose membrane
Because gases cannot be pumped in an electroosmotic pump, such a pump cannot fill itself with liquid from an initially empty state [13]. To overcome this limitation, the pump developed integrates a cellulose filter (pore size: 0.2 µm, diameter: 47 mm, thickness: 120 µm, GE Healthcare WhatmanTM) to drive the fluid to the main channel and bridges where the electrical contacts are.
The paper shape is designed in AutoCAD and imported to Silhouette Studio software (Figure 4A) to be defined by xurography (blade nr 1, thickness 15, cutting velocity 10 cm s−1, single cut, 17 s). The individualized paper filters are depicted in Figure 4B.
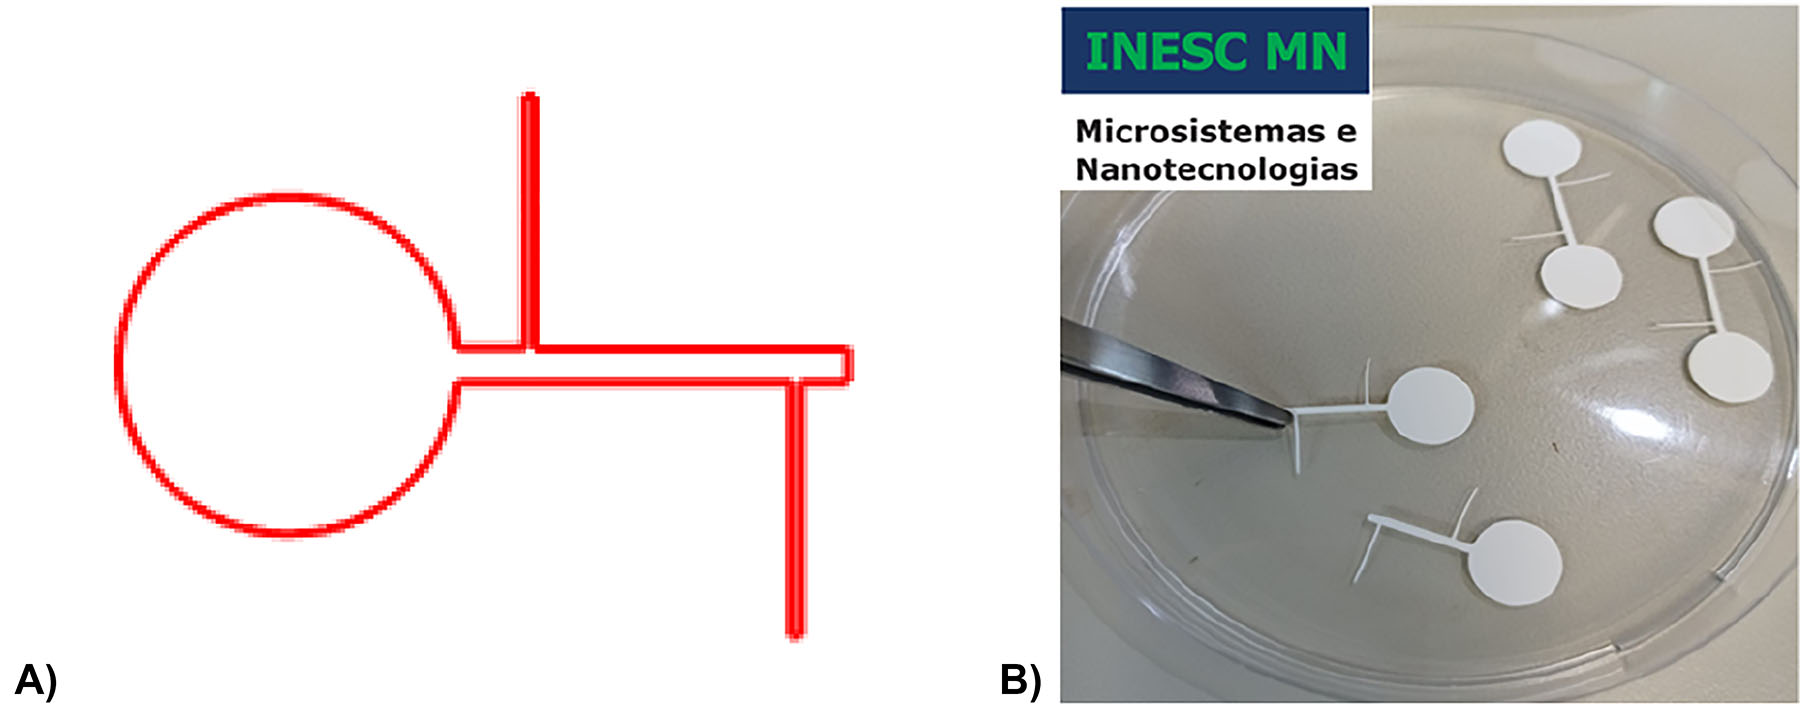
Shape of the cellulose membrane to be integrated in the EO pump. (A) Design imported to the silhouette studio software and (B) individualized cellulose filter.
Fabrication and individualization of PDMS membrane
SYLGARD™ 184 Silicone Elastomer Kit containing 3-dimethyl syloxane (DMS) and 184 silicone elastomer (cross-linking agent) is weighted and manually mixed. The mixtures are deaerated in a vacuum dessicator (1-800-4Bel-Art, Bel-Art Products) for 1 h and absolute pressure 0.22 ± 0.09 atm (R5 rotary vane vacuum pump, Busch). To avoid bubbles, each mixture is gently poured on top of an auxiliary surface. A spin coater was used to set the PDMS (polydimethyl siloxane) thickness (120 μm, step 1:500 rpm, 5 s, 500 rpm s−1, step 2: 965 rpm, 20 s, 100 rpm s−1, modular spin coater ws-650-23NPP, Laurell Technologies Inc). The PDMSis then cured at 70 °C for 1 h 40 min (digitally controlled Memmert GmbH + Co. KG 100–800 oven). All steps of the PDMS preparation are done inside a laminar flow hood (Faster-BSC-EN) to avoid surface contamination.
After curing, the PDMS membrane covers the silicon substrate except the inlet and outlet reservoirs, main channel and bridges, as presented in Figure 5A in blue. The definition of the structures onto the PDMS is conducted by xurography using the Silhouette Curio™ cutting printer and blade (Figure 5B). The auxiliary surface for spin coating is chosen because the PDMS cannot be directly spin coated onto the microfabricated Si substrate as the cut would damage the electrodes (see section C). Instead, the PDMS membrane is fabricated on another Si wafer or on a polystyrene plate (PS, 3 × 100 × 100 mm3, CRYLUX®), ensuring an adequate adhesion during the spin coating process without compromising any future step of peeling, and later transferred to the microfabricated Si substrate. Tests are performed at various combinations of cutting depths and speeds to access the best PDMS cut finishing (Figure 5C).
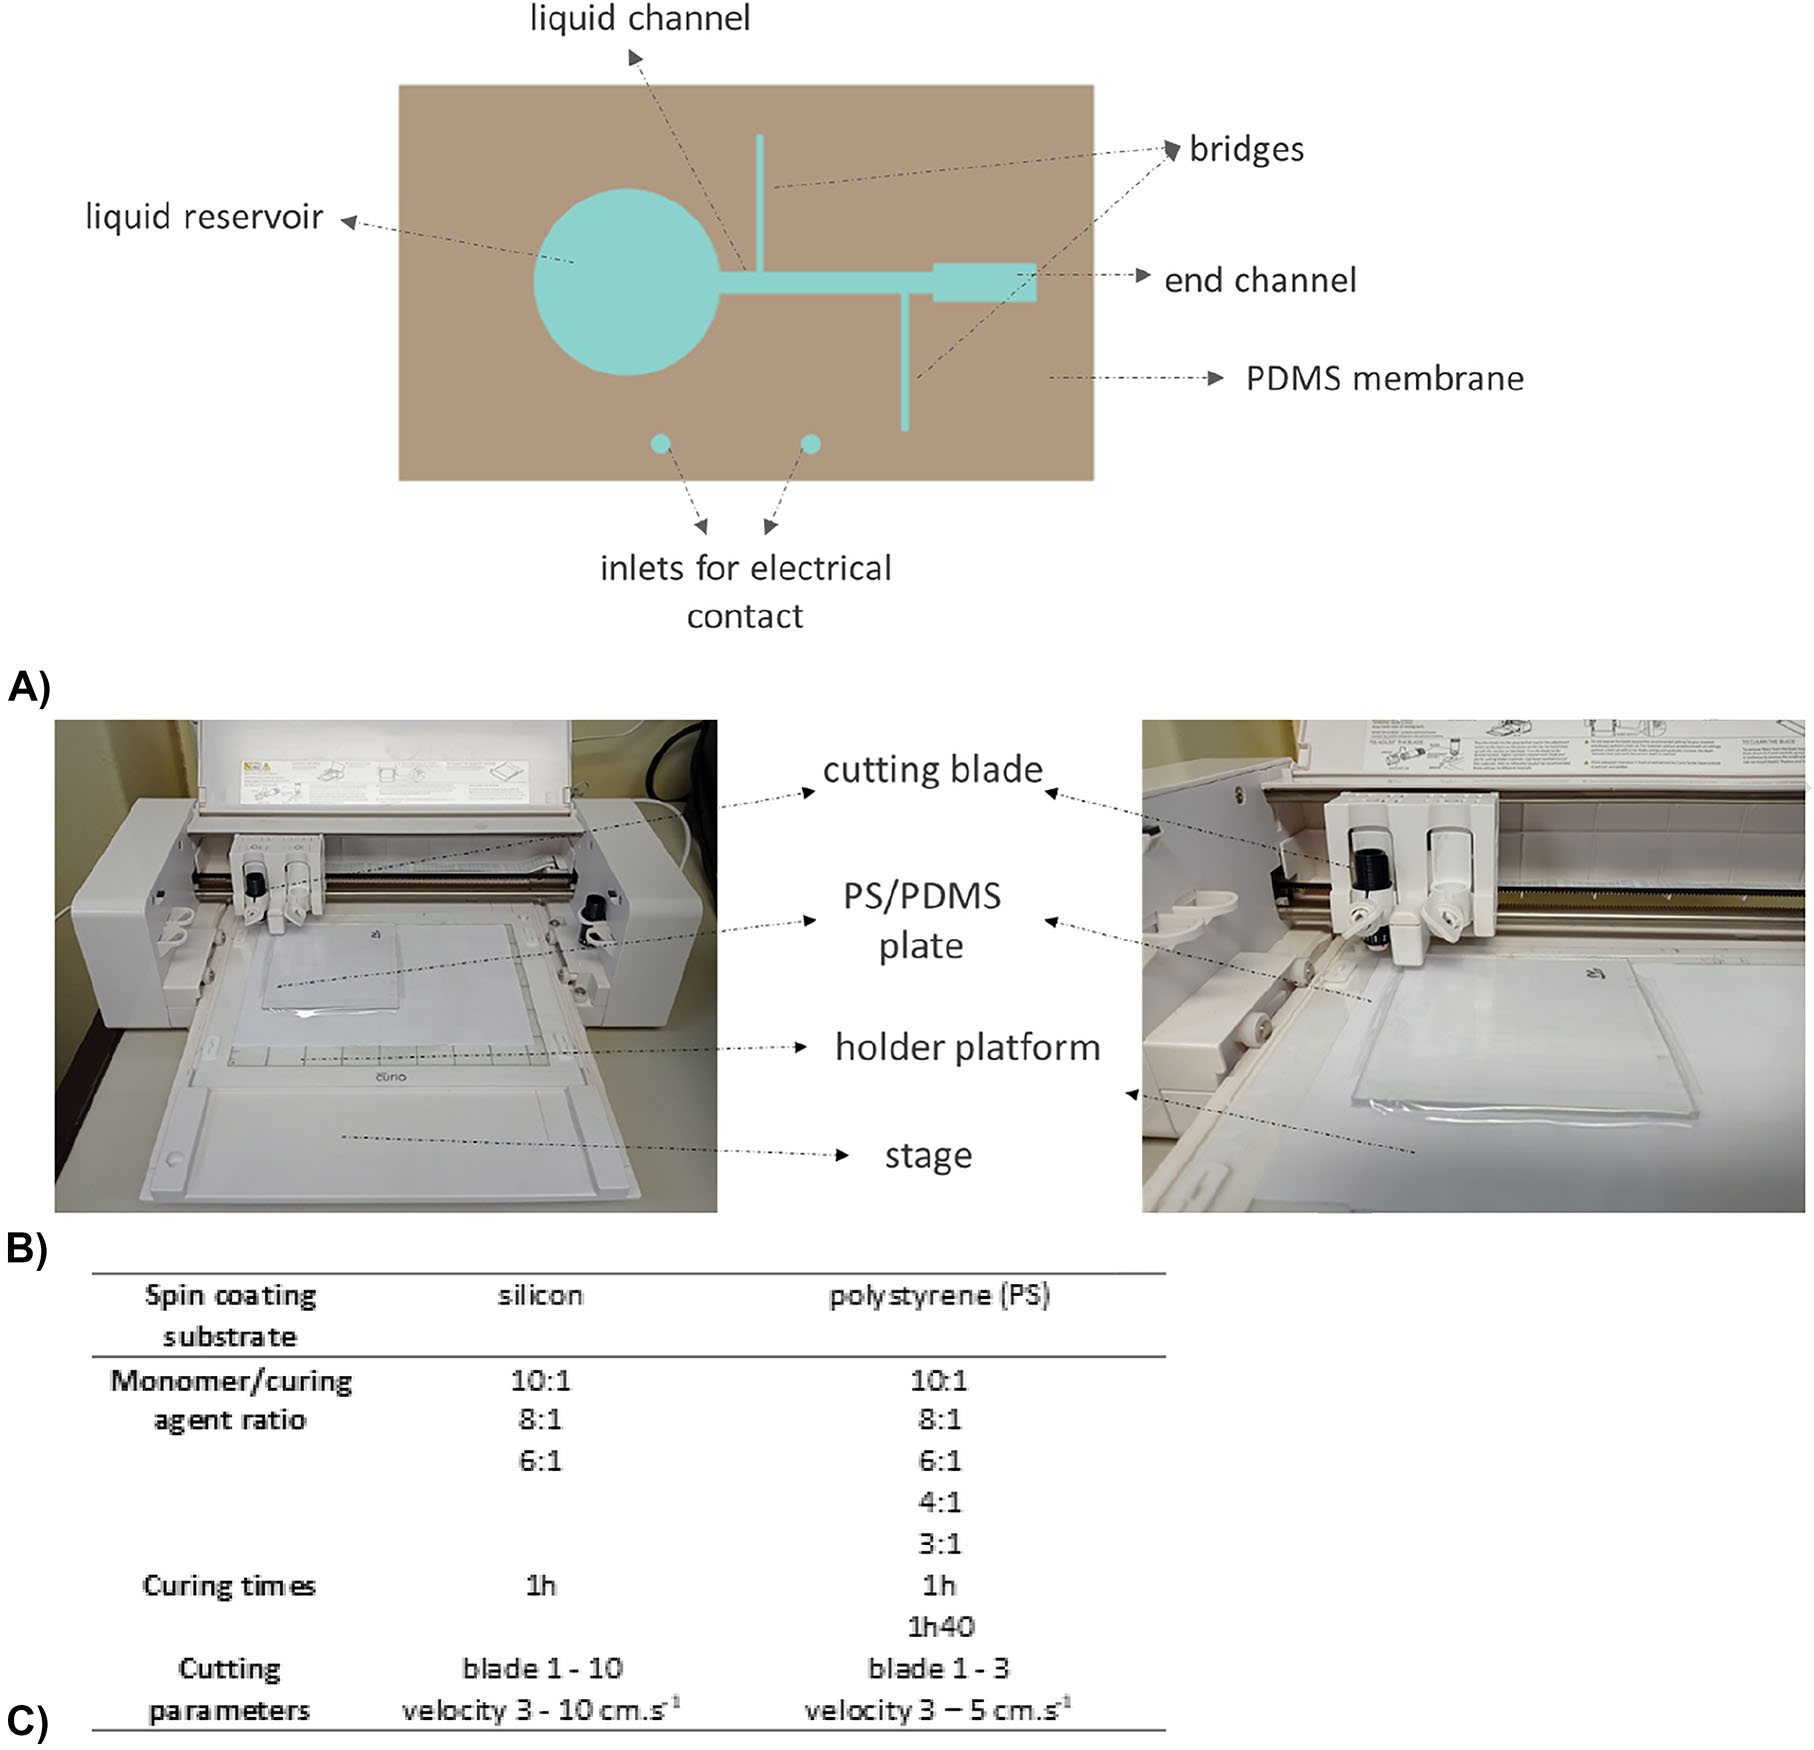
Rapid prototyping of the microfluidic channel by Xurography. (A) Schematics of the coverage of PDMS membrane on silicon/graphene substrate; (B) Setup for the xurography fabrication. On top of the stage, two platforms are placed to secure the plate in place. A blade with size varying from 1 to 3 is used in the tests; (C) Xurography parameters for the fabrication of 120 µm PDMS membrane with silhouette curio and parameters for transfer procedure.
Fabrication of chip with electrical contacts
The surface elements of the microchip flow pump follow typical cleanroom procedures at INESC MN (cleanroom class 100/10). The chip (Figure 6) is fabricated in a standard 6-inch silicon wafer (single side polished Si, mechanical grade, 0.65 mm thick, <100>, University wafer). The electrical components are defined by laser photolithography (Direct Laser Lithography System DWL 2.0, 6″, HeCd laser 422 nm, critical dimensions 0.8 µm, Heidelberg Instruments) of Al98.5Si1.0Cu0.5 (in percentage) deposited by magnetron sputtering (DC Magnetron Sputtering, 2 kW, 3 mTorr, Nordiko 7,000, 6″). Wet etch using TechniEtch Al 80 MOS etchant from Microchemicals is followed by a 2nd photolithography and the deposition of TiW (N) and Cu by ion beam deposition (Nordiko 8,000 coupled to Nordiko 3,600, 8″). Liftoff, 3rd lithography, RF sputtering of Al2O3 (UHVII, base pressure of 5 × 10⁻⁷ Torr, applied power of 200 Wrf, 543 Hz, argon flux of 43.9 sccm, deposition pressure of 4.6 mTorr, 6″) for electrode protection and electric passivation, 2nd liftoff and chip individualization (DISCO DAD 321 Dicing Saw, 6″) follows.
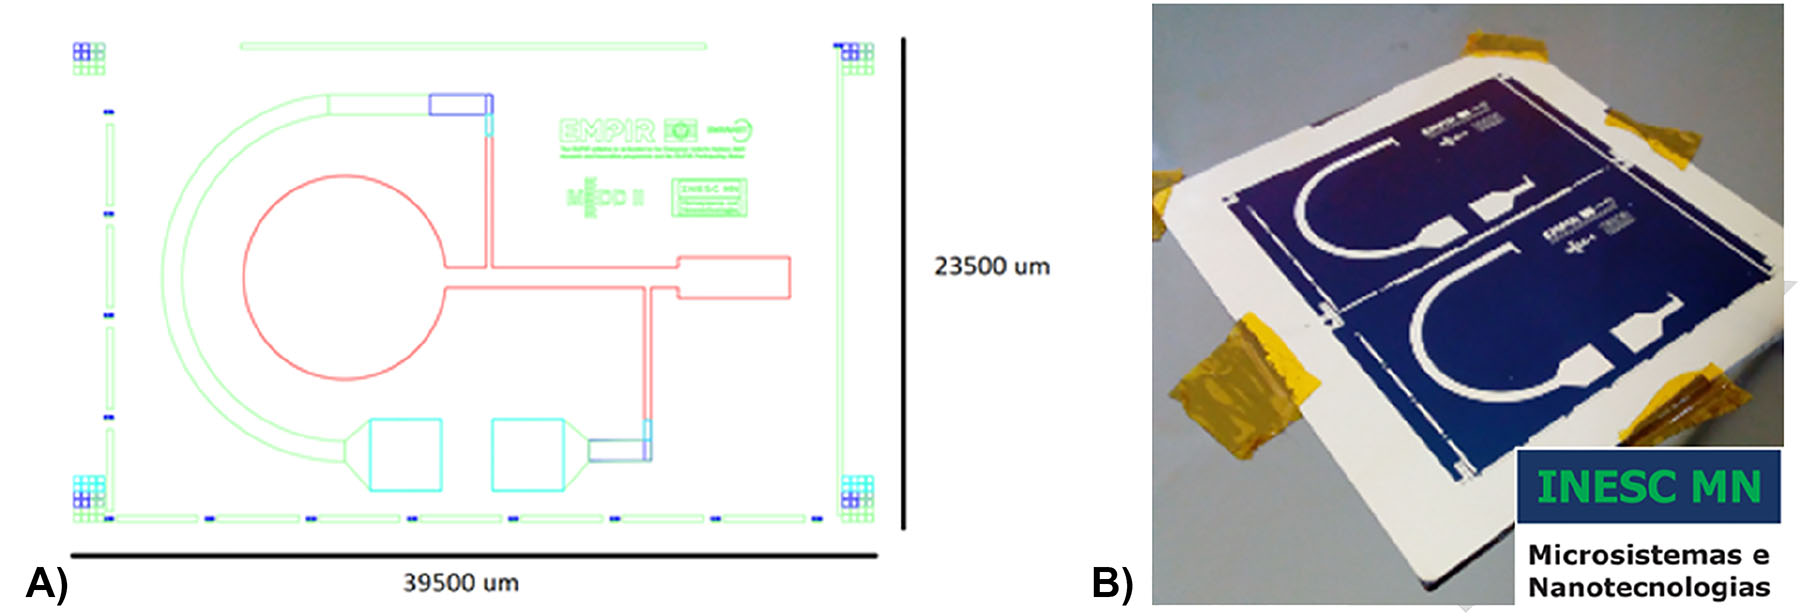
Electroosmotic pump: from the design to the chip. (A) schematics of the chip with electrical contacts. green: electrical contacts Al98.5Si1.0Cu0.5 (3,000 Å); red: cellulose membrane; light blue: passivation layer (Al2O3 3,000 Å); dark blue: TiW (300 Å) + Cu (300 Å) and (B) chip with electrical contacts after microfabrication.
Fabrication of PMMA support
Two PMMA (polymethyl methacrylate) substrates (150 × 150 mm, 4 mm-thick) are fabricated in a high precision 3 axis CNC micromilling machine (SuperTech) with specific designs for top and bottom casings (e.g., pocket, inlet, and outlet structures, Figure 7). These encase the silicon chip with electrical contacts, cellulose filter and PDMS structures.
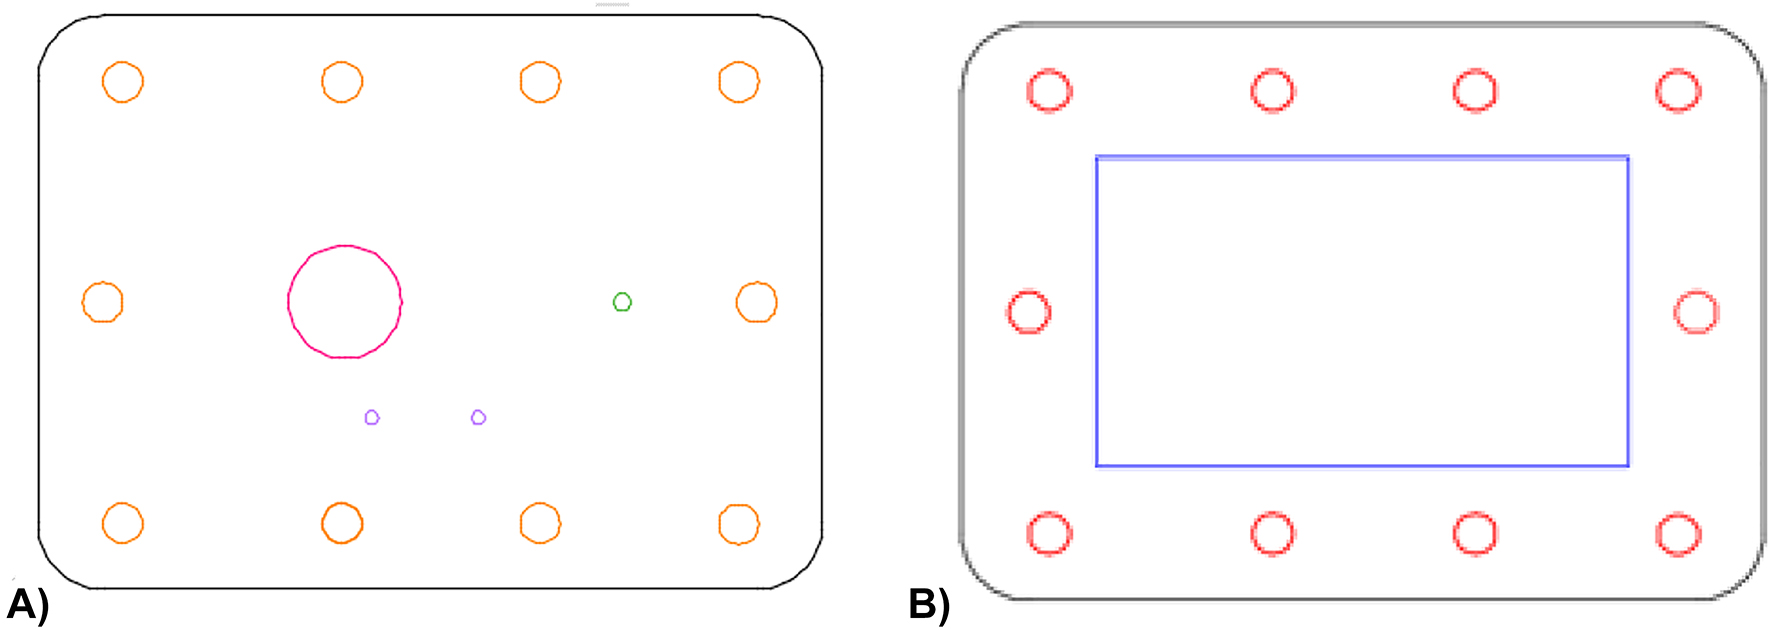
Schematics of the (A) top plate and (B) bottom plate of the PMMA casing in AutoCAD for the encapsulation of the silicon substrate. The top casing presents inlets to contact the main reservoir and the electrodes of the system, an outlet, and perforations to unite the two PMMA plates. The bottom casing includes a pocket structure and perforations aligned with the ones present in the top casing.
Bonding
The PDMS is peeled from the substrate, is permanently bonded to the microflabricated Si chip (300 s, 133 Pa O2 atmosphere, 30 W, 25 °C, RF-power, benchtop 6″ Plasma Cleaner PDC-002CE, Harrick Plasma) and encloses the paper filter. A second PDMS layer is permanently bonded to the first to close the microfluidic system. An example of PDMS bonded to a dummy silicon substrate is depicted in Figure 8.
PDMS permanently bonded to a Si substrate. In this example, the Si is not microfabricated.
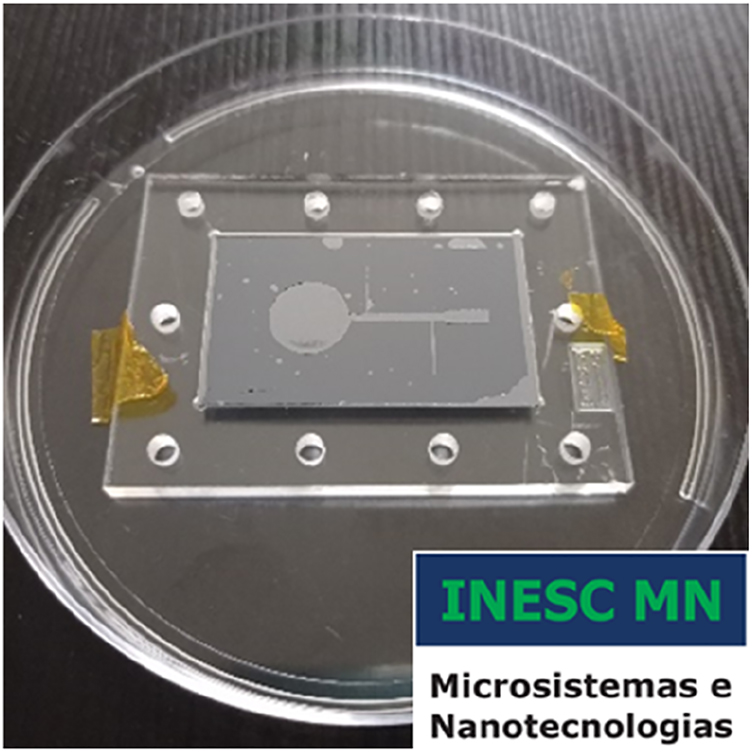
Assemblage
All the elements are assembled to obtain the microfluidic chip pump as shown in Figure 9.
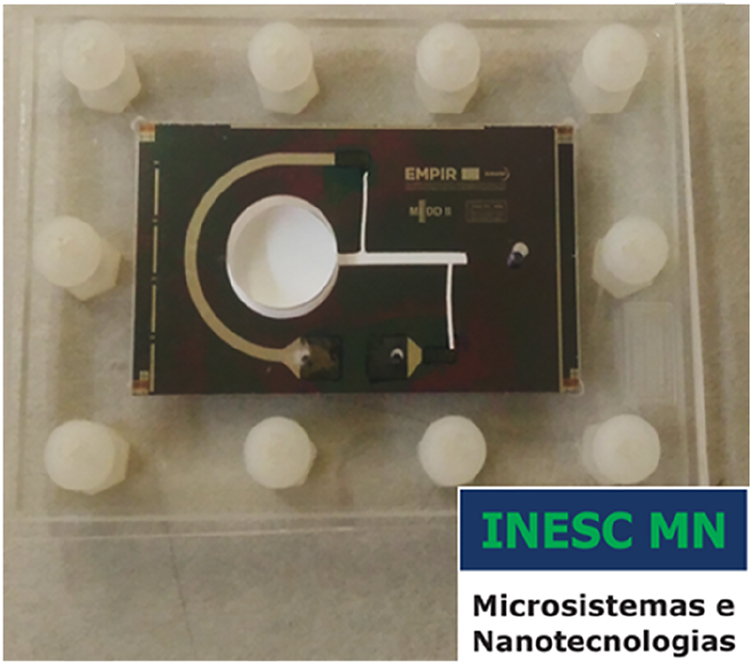
Microfluidic chip flow pump.
Power supply module
The power supply module for this setup is built around the Bellnix OHV12-1.0K1500P, an ultracompact, ultralow ripple noise DC-DC converter. This component accepts a nominal input voltage of 12 V and outputs a fully adjustable voltage from 0 to 1,000 V, with a maximum output power of 1.5 W. The relevant electric specs of this converter are shown in Table 1.
Nominal operating parameters of OHV12-1.0K1500P DC-DC converter.
| OHV12-1.0K1500P | |
|---|---|
| Input voltage (V DC) | 11.0–13.0 |
| Output voltage (V DC) | 0 – +1,000 |
| Output current, mA | 0–1.5 |
| Minimum load resistance, kΩ | 666.7 |
| Typical input current, A | 0.28 |
| Typical ripple noise, mVpp | 5 |
In the complete power supply module, additional components are added both to the input and output sides of the OHV12 converter to enhance its operating characteristics. Moreover, a resistor network is employed to change the control voltage that defines the output voltage of the converter.
An electric field is then imposed to the electrical contacts of the microfluidic pump. The device is tested with de-ionized (DI) water colored with red food coloring die (non-alcoholic, Globo) (Figure 10). Snapshot images of the resulting flow field at the outlet tubbing are captured during flow delivery experiments using a Levenhuk DTX-50 Digital Microscope and analyzed with Image J software.
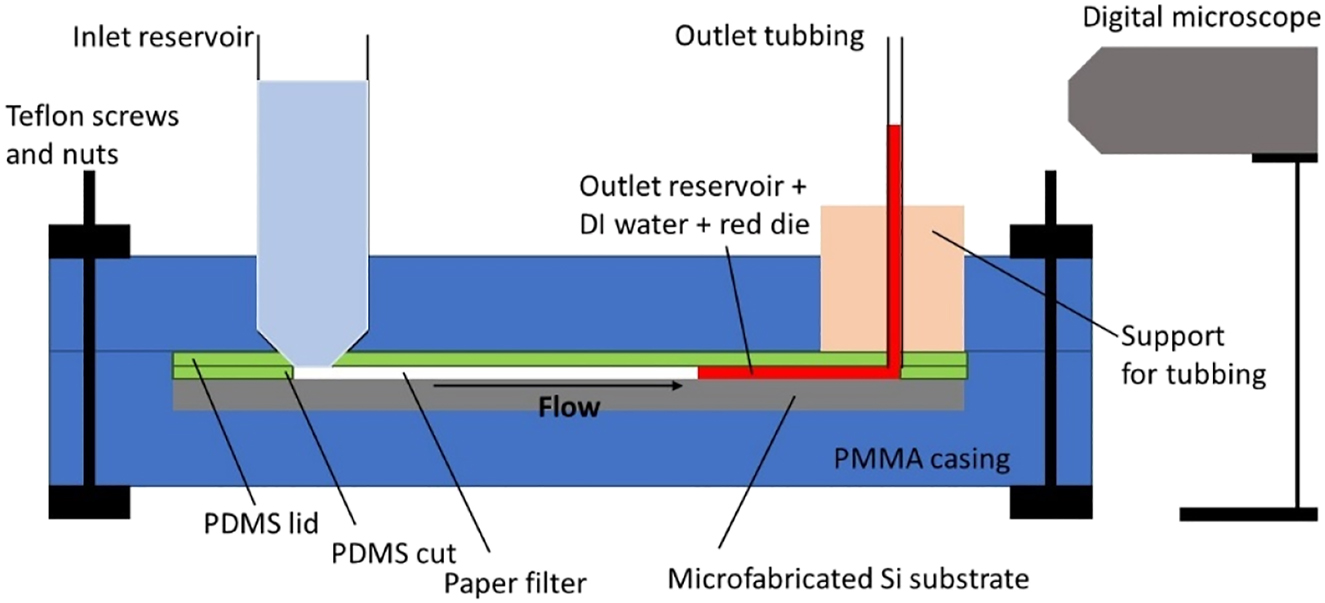
Schematics of the experimental setup.
Results and discussion
Simulation of the micropump
Simulations start by comparing results from 2D and 3D representations of the flow field. The channel is defined by walls in the x-direction and the electric field is applied along the bridges y-direction. It is assumed that the electric potential is steady and constant between the bridges.
The simulated flow velocity depicted in Figure 11 represents the velocity values u x over the line x=x out (black squares) or at z=½ channel height for cut plane x=x out (red circles) considering the flow is fully developed and the system is represented in 2D or in 3D, respectively. The electroosmotic velocity profile is expected to be plug-like, as shown by the red circles in Figure 11. The 2D results (black squares) are common of a Poiseuille flow instead of an electroosmotic (EO) flow. In the EO flow, the maximum velocity is expected near the electrode surface and bottom wall and will decrease linearly to the non-slip channel top. Because the flow velocity in the 2D representation of the channel is failing to express this effect, the 2D results are discarded from the study. Following studies are performed considering 3D channel representations.
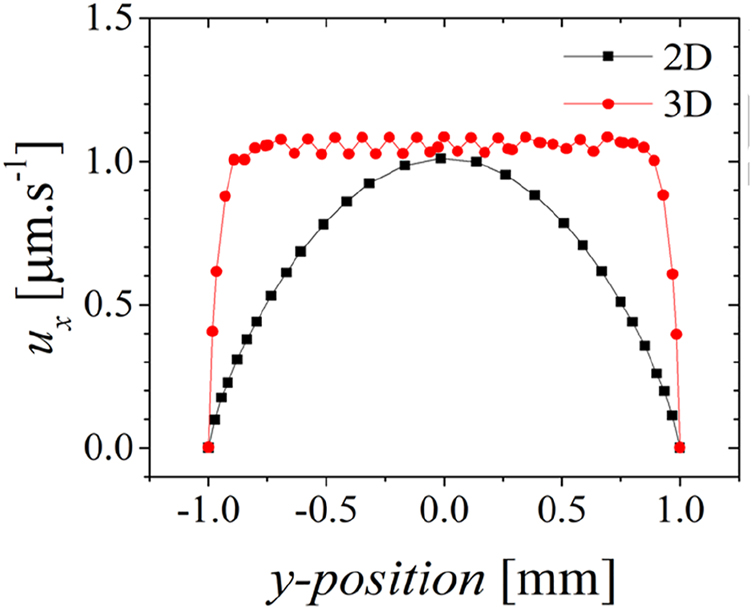
Results of simulated velocity profiles in 2D vs. 3D channels. 3D simulations were performed for a channel height of 120 μm.
Figure 12 shows the influence of the dimensions and spatial arrangement of the electrodes in the channel in the simulated pumping capacity.
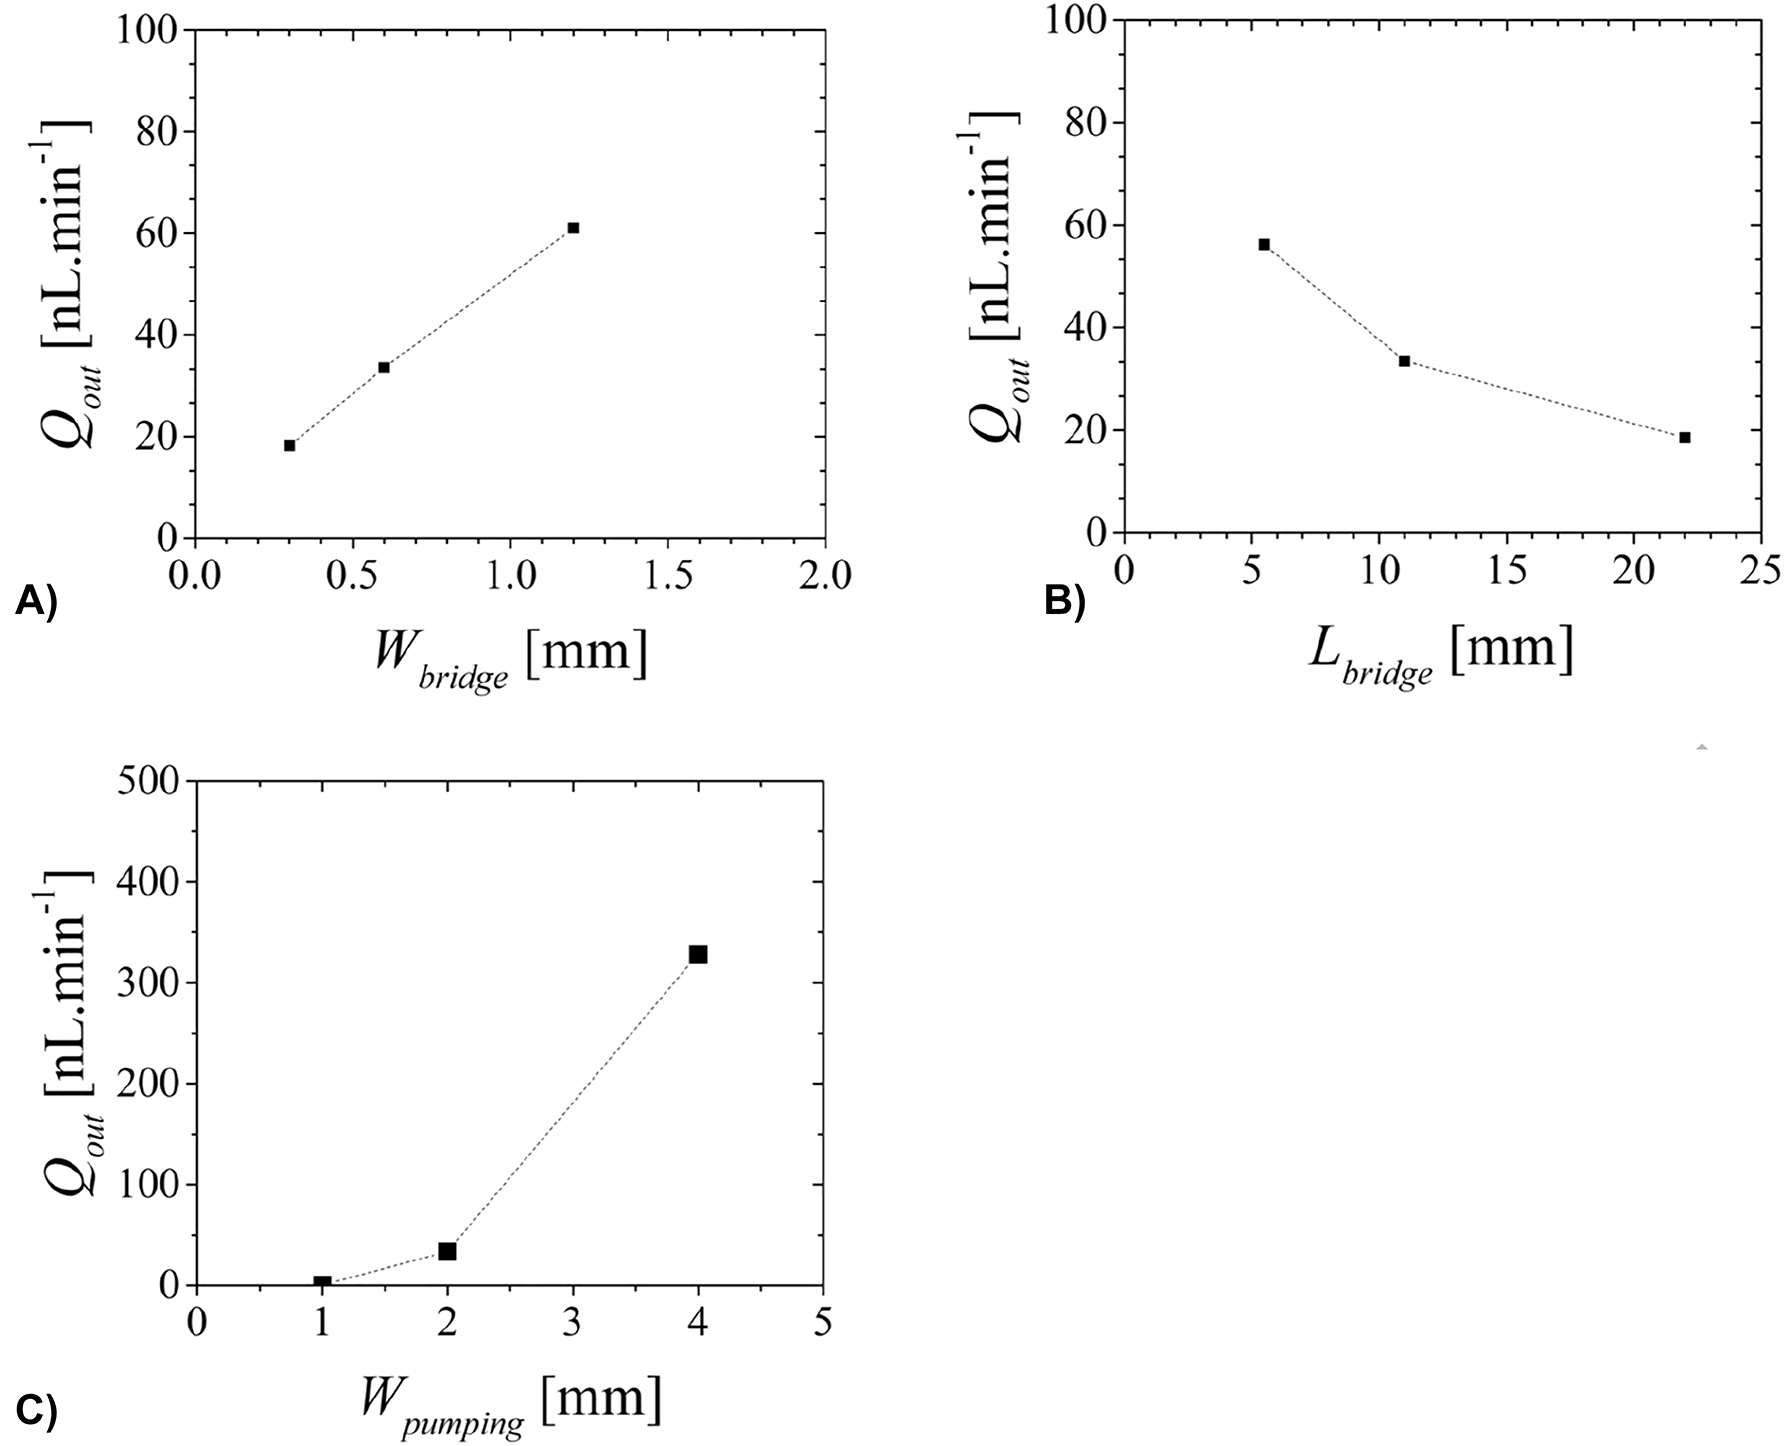
Simulated volumetric flow rate dependence of geometrical parameters: (A) W bridge =W bridge,1 =W bridge,2 , (B) L bridge =L bridge,1 =L bridge,2 and (c) W pumping. Other input parameters are E=2.6 V mm−1, x bridge,1 =4.3 mm, x bridge,2 =20.3 mm, x out=23 mm, L bridge,1 =L bridge,2 =11 mm, L pumping=23 mm, W bridge,1 =W bridge,2 =0.6 mm and W pumping=2 mm.
Here the averaged velocity u average3D ,out is obtained by averaging the velocity over the cut plane x=x out and the volumetric flow rate at the outlet, Q out , is calculated from the averaged velocity
A cs is the cross-section area of the channel. For E=2.6 V mm−1, x bridge,1 =4.3 mm, x bridge,2 =20.3 mm, x out=23 mm, L bridge,1 =L bridge,2 =11 mm, L pumping=23 mm, Wbridge,1 =W bridge,2 =0.3 mm, Lpumping=23 mm, Wpumping=2 mm, L V→out=2.7 mm, Q out is found to be 18.2 nL min−1.
The increase of the fluid flow rate is seen to increase with the surface of the electrodes, W bridge. This increase will increase the electric double layer surface and consequently the DC electroosmotic pumping. While there is a linear proportionality between the width of the bridges and the resulting volumetric flow rate (Figure 12A), this linear dependence is not observed for other dimensions. For the same applied electric field, the increase of the bridge length leads to a decrease of Q out (Figure 12B) due to the decrease in field intensity and consequently a decrease of the Coloumb force. The increase in the width of the pumping channel increases Q out (Figure 12C) due to a compromise between the electroosmotic force and the back pressure exerted in the pumping area. When W pumping becomes smaller the back pressure dominates over the electroosmotic force resulting in lower flow rates. The width of the pumping channel is found to be the dimension that has the biggest influence in the final value obtained for the volumetric flow rate (Figure 12C).
Microfabrication
The pump was fabricated at INESC MN cleanroom class 10/100 facilities using silicon as substrate and typical semiconductor methods to define the actuation strategy. This minimized contamination during the fabrication process, which is lead at controlled temperature and humidity. The use of direct write laser lithography with minimum feature size of 0.8 μm provides the necessary resolution to precisely define the dimensions and position of the electrode structures.
Apart from the electrode structures, the supporting materials chosen to integrate the microfluidic pumpdefine its capabilities. Paper substrates are often used in microfluidics as they achieve simple and cost-effective fabrication. Their porosity and hydrophilic nature are ideal to this end as they guarantee the fluid is perfectly distributed to the electrodes before and during actuation. Additionally, paper can be used to eliminate pressure-driven flow and air bubbles in the microchannel [14]. Poly (methyl methacrylate) (PMMA), was chosen for the pump encapsulation as it is extensively used in microfluidics nowadays due to its many advantages such as optical transparency, chemical stability, biocompatibility, low electrical conductivity and wide range of design possibilities [15]. This choice allowed the visualization of the process while attributing a robust character to microfluidic devices. Two PMMA substrates (4 mm thick) were fabricated with specific designs for top and bottom casings (e.g., pocket, inlet, and outlet structures) to encase the silicon substrate. Plastic screws and nuts (M3) were used to compress the various parts of the microfluidic pump. A critical requirement of the channel material is that it needs to be easily fabricated and peeled. PDMS has been chosen as the channel material as it is one of the most used polymers in the microfabrication of microfluidic devices in the laboratory, mainly because of its optical transparency, gas permeability, biocompatibility, and ease of fabrication and molding [16]. The physical characteristics of PDMS are known to be highly dependent on the monomer/curing agent ratio and curing temperature chosen, increasing the possibility of fabrication of structures and range of applications [17]. This tuning ability is used to achieve the DMS:cross-linking agent ratio with mechanical properties that presented the best finishing after xurography (Figure 13). The diferences are presumed to be due the Young Modulus of the material to be dependent on the amount of curing agent used in the formulation. For a given curing temperature, as the amount of curing agent increases, the PDMS has a more elastic behaviour, reflected by the decrease of the value of the Young modulus from 10:1 ratio up to 6:1 in [17]. After establishing the 3:1 ratio, the minimum cutting velocity is found to be 3 cm s−1, as it is the one at which the definition of the walls is smoother (blade nr 1, thickness 15, single cut). The corner of the channels has round shape due to the working mode of the blade. Nevertheless, xurography provides the ability to obtain channels in a very expedite way when comparing to more traditional fabrication techniques such as soft lithography. Another important contribution to the good definition of the PDMS structures is the adhesion of the PDMS to the auxiliary surface. Silicon wafers are seen to be unsuited for processing the PDMS layer. The cured PDMS layer ruptures when peeling because of the strong bonding it creates with the Si. Polystyrene plates are also tested and result in appropriate peeling, without tearing of the PDMS membrane. The groove formed on the PS after cutting the PDMS is not seen to influence finishing of the patterned PDMS layer.
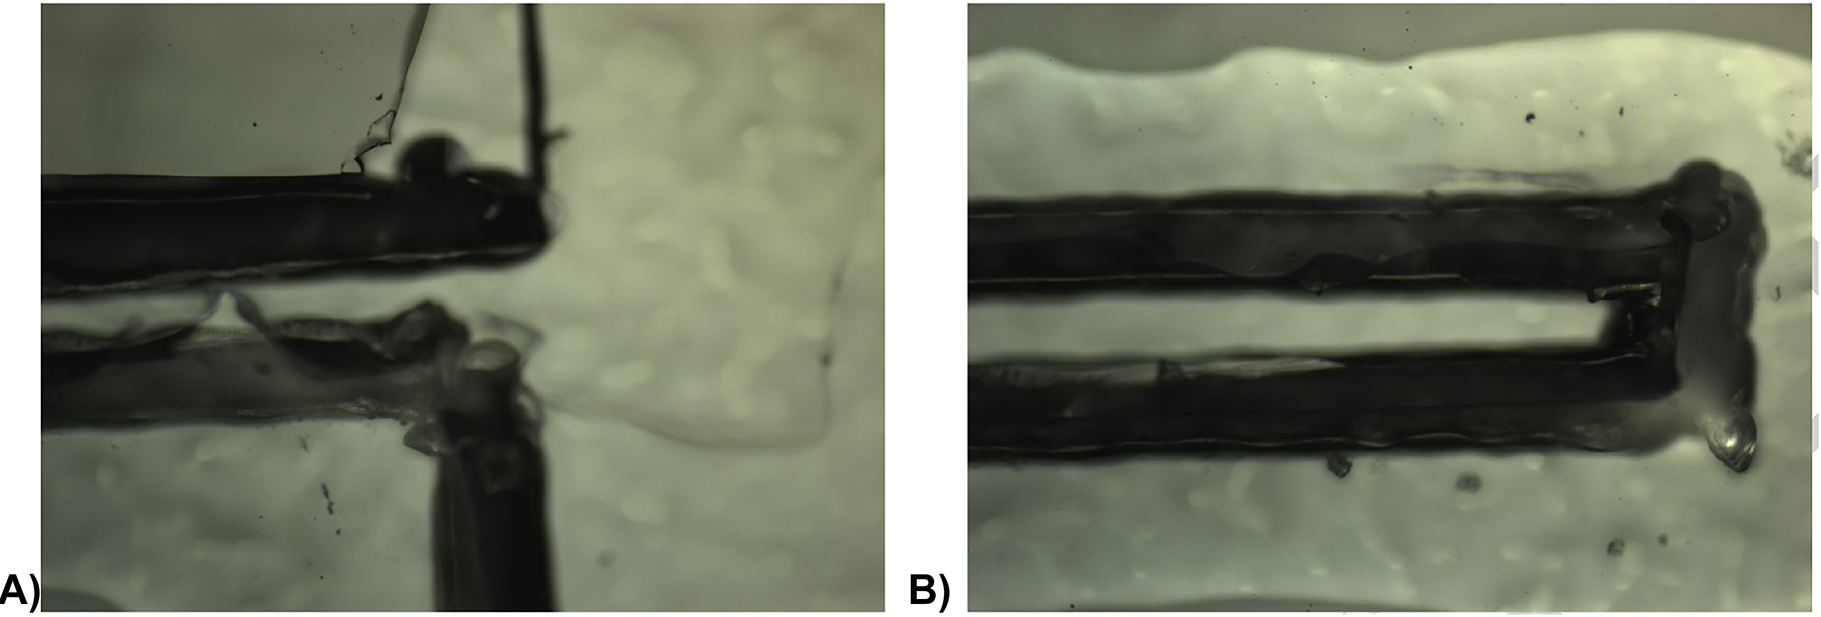
Cut finishing of 0.6 mm-wide bridges on PDMS of (A) 10:1 ratio and (B) 3:1 ratio formulations, spin coated on PS plates. The darkest region is the result of the cut onto the PS plate right below the PDMS.
The power supply has been characterized prior to flow experiments. Considering the relative voltage difference of the power supply to be RVD=(x 2 −x 1 )/x 1 , where x 1 is the set value and x 2 is the read value, the power supply stabilizes around 1,000–2,000 s, and its derivative over time dRVD/dt after that period is found to be lower than 5 × 10⁻⁶ (Figure 14). The higher the voltage set, the faster the power supply achieves a stable voltage. This aspect is taken into consideration when applying a DC voltage to the microfluidic pump.
![Figure 14:
Stabilization times for [100:100:500] V imposed to the power supply.](/document/doi/10.1515/bmt-2022-0051/asset/graphic/j_bmt-2022-0051_fig_014.jpg)
Stabilization times for [100:100:500] V imposed to the power supply.
A preliminary study of the flow has been conducted to evaluate the pump performance. Before the measurements start, the outlet reservoir is filled with DI water died red while the inlet reservoir is filled with DI water alone, as represented schematically in Figure 10. The pressure at both inlet and outlet is left to equalize by having the system open to air. This way, the influence of pressure-driven flows is limited when the measurements take place. At time t=0 s a DC voltage is applied to the electric contacts microfabricated onto the Si chip.
The liquid starts to move towards the outlet and the distance travelled by the fluid in a vertical position, from bottom to top, is recorded. Figure 15 shows an example of the flow of DI water with coloring die at the outlet tubing when applying an electric field of 13.2 V mm−1 to the electrodes. The distance travelled by the fluid in the tubing at the outlet is obtained subtracting the position of the meniscus at time t + Δt from that at time t.
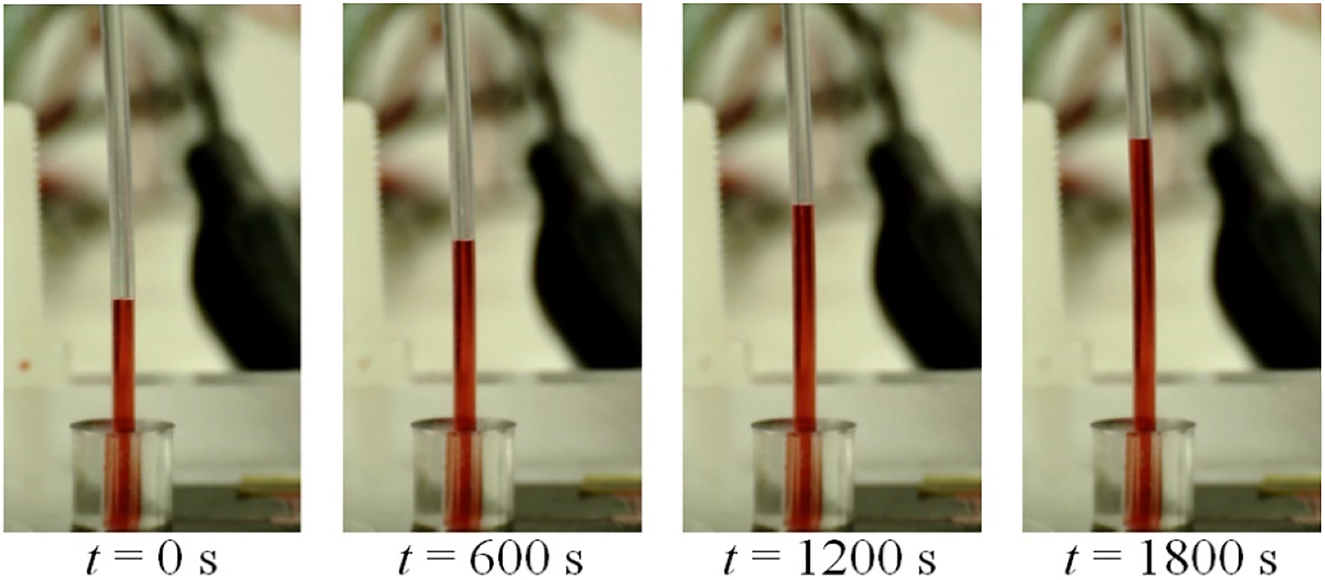
Pumping results obtained with the microfluidic pump while imposing an electric field of 13.2 V mm−1 during 1,800 s. The figure shows the advancement of the fluid consequence of the electroosmosis. The temperature of the room is 22 °C.
From this example, assuming that the inner diameter of the tubbing is that given by the manufacturer, of 0.86 mm, it is possible to roughly estimate the volumetric flow rate of Q out =(161 ± 20) nL min−1. The error is given by the standard deviation of results based on 24 data points for the averaged volumetric flow rate. The value of Q out obtained experimentally is found to be in good agreement with the simulated results under ideal flow conditions (Figure 16). These simulated volumetric flow rate results, which have a maximum difference ratio of just 7.3% to the experimental results, have a considerable impact on minimizing trial and error in the construction of the pump and on achieving the targeted conditions. Moreover, the results demonstrate the microfluidic actuation capability to drive very small volumetric flow rates down to 45 nL min−1, which is also useful in organ-on-a-chip contexts. Here, the fluid shear stress and mass transport regime of nutrients are both dependent on the flow rate, and these will greatly influence the cellular response [18].
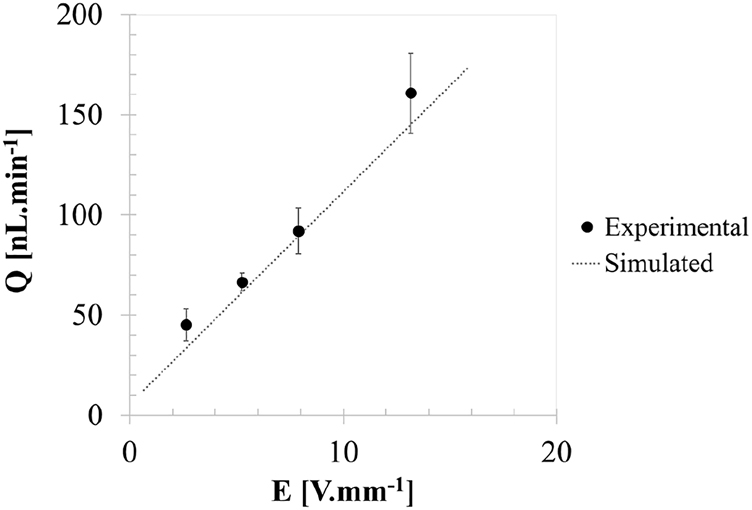
Simulated and experimental volumetric flow rates as a function of the applied electric field, considering x bridge,1 =4.3 mm, x bridge,2 =20.3 mm, x out=23 mm, L bridge,1 =L bridge,2 =11 mm, L pumping=23 mm, W bridge,1 =W bridge,2 =0.6 mm, W pumping=2 mm and L V→out=2.7 mm.
It is necessary to correct the contributions of inner tube diameter, non-zero pressure load at the outlet, surface wettability on the flow path, evaporation, etc., to the measurement error [19] and to assess the deviations of the experimental values to the simulated data. Nonetheless, the preliminary results are very encouraging.
Conclusions
In this work we propose the microfabrication of a new microfluidic pump based on electroosmosis with electrodes and paper channels. The digital twin of this electroosmotic pump served effectively for the optimization of the pump design and working conditions. Cleanroom fabrication techniques were used to microfabricate electrodes on top of a Si chip. Therefore, the proposed pump could easily be integrated with CMOS-based ultrasensitive elements for measurement of temperature or ionic concentration, among others, or even additional actuation strategies for personal diagnostics applications. A desktop cutter machine was used to rapidly define the PDMS walls and paper filter. A 3D CNC milling machine allowed to obtain the case to encapsulate the microfluidic pump. These off-the-shelf equipments were found to Preliminary experimental results of electroosmotic volumetric flow rate were found in good agreement with the prediction from simulated results. The results show a promising cost-effective EO pump providing steady and continuous flow to be easily implemented in clinical and biotechnological environments and mobile healthcare systems.
Funding source: European Association of National Metrology Institutes
Award Identifier / Grant number: Euramet 18HLT08 MeDD II
Funding source: Fundacao para a Ciencia e a Tecnologia
Award Identifier / Grant number: PROGRAMATICO
Award Identifier / Grant number: PTDC-FIS-PLA/31055/2017
Award Identifier / Grant number: plurianual BASE
Research funding
The authors wish to acknowledge the Fundação para a Ciência e a Tecnologia (FCT) for funding of the Research Unit INESC MN (UID/05367/2020) through plurianual BASE and PROGRAMATICO financing. Vania Silverio acknowledges financing through FCT under the program grant PTDC-FIS-PLA/31055/2017. The work was funded by Euramet 18HLT08 MeDD II project. This project (Euramet 18HLT08 MeDD II) has received funding from the EMPIR programme co-financed by the Participating States and from the European Union’s Horizon 2020 research and innovation programme.
-
Author contributions: All authors have accepted responsibility for the entire content of this manuscript and approved its submission.
-
Competing interests: Authors state no conflict of interest.
-
Informed consent: Informed consent was obtained from all individuals included in this study.
-
Ethical approval: Not applicable.
References
1. Chemix. What is a syringe pump? Available from: https://chemyx.com/support/knowledge-base/application-reference-by-topic/what-is-a-syringe-pump-3/ [Accessed 14 Nov 2022].Search in Google Scholar
2. Batista, EGE. Improving infusion dosing accuracy for patient safety. Eur Biopharm Rev 2021;26. Available from: https://www.europeanpharmaceuticalreview.com/article/161042/improving-infusion-dosing-accuracy-for-patient-safety/ [Accessed 14 Nov 2022].Search in Google Scholar
3. Batista, E, Sousa, JA, Cardoso, S, Silverio, V. Experimental testing for metrological traceability and accuracy of liquid microflows and microfluidics. Flow Meas Instrum 2020;71:101691. https://doi.org/10.1016/j.flowmeasinst.2020.101691.Search in Google Scholar
4. Handique, K, Burke, DT, Mastrangelo, CH, Burns, MA. On-chip thermopneumatic pressure for discrete drop pumping. Anal Chem 2001;73:1831–8. https://doi.org/10.1021/ac000711f.Search in Google Scholar PubMed
5. Nevill, JT, Hartmann, DM, Wyrick, D, Votaw, G, Buckner, C, Crenshaw, HC. Sub-nanoliter per minute flow rates with custom microsyringe pumps in a microfluidic chip: the importance of temperature control. In: Proc. twelfth international conference on miniaturized systems for chemistry and life sciences San Diego. USA: California; 2008.Search in Google Scholar
6. Lucas, P, Ahrens, M, Geršl, J, Sparreboom, W, Lötters, J. Primary standard for liquid flow rates between 30 and 1500 nl/min based on volume expansion. Biomed Eng/Biomed Tech 2015;60:317–35. https://doi.org/10.1515/bmt-2014-0132.Search in Google Scholar PubMed
7. Geipel, A, Doll, A, Goldschmidtboing, F, Jantscheff, P, Esser, N, Massing, U, et al.. Pressure-independent micropump with piezoelectric valves for low flow drug delivery systems. In: Proc. 19th IEEE international conference on micro electro mechanical systems; 2006.10.1109/MEMSYS.2006.1627917Search in Google Scholar
8. Geipel, A, Doll, A, Jantscheff, P, Esser, N, Massing, U, Woias, P, et al.. A novel two-stage backpressure-independent micropump: modeling and characterization. J Micromech Microeng 2007;17:949–59. https://doi.org/10.1088/0960-1317/17/5/015.Search in Google Scholar
9. Geipel, A. Novel two-stage peristaltic micropump optimized for automated drug delivery and integration into polymer microfluidic systems [Ph.D. dissertation]. Germany: IMTEK, University of Freiburg; 2008.Search in Google Scholar
10. Temiz, Y, Delamarche, E. Sub-nanoliter, real-time flow monitoring in microfluidic chips using a portable device and smartphone. Sci Rep 2018;8:10603. https://doi.org/10.1038/s41598-018-28983-w.Search in Google Scholar PubMed PubMed Central
11. Wang, X, Cheng, C, Wang, S, Liu, S. Electroosmotic pumps and their applications in microfluidic systems. Microfluid Nanofluidics 2009;6:145–62. https://doi.org/10.1007/s10404-008-0399-9.Search in Google Scholar PubMed PubMed Central
12. Li, L, Wang, X, Pu, Q, Liu, S. Advancement of electroosmotic pump in microflow analysis: a review. Anal Chim Acta 2019;1060:1–16. https://doi.org/10.1016/j.aca.2019.02.004.Search in Google Scholar PubMed
13. Ogden, S, Klintberg, L, Thornell, G, Hjort, K, Bodén, R. Review on miniaturized paraffin phase change actuators, valves, and pumps. Microfluid Nanofluidics 2013;17:531289–713. https://doi.org/10.1007/s10404-013-1289-3.Search in Google Scholar
14. Lim, H, Jafry, AT, Lee, J. Fabrication, flow control, and applications of microfluidic paper-based analytical devices. Molecules 2019;24:2869. https://doi.org/10.3390/molecules24162869.Search in Google Scholar PubMed PubMed Central
15. Gencturk, E, Mutlu, S, Ulgen, KO. Advances in microfluidic devices made from thermoplastics used in cell biology and analyses. Biomicrofluidics 2017;11:051502. https://doi.org/10.1063/1.4998604.Search in Google Scholar PubMed PubMed Central
16. Auner, AW, Mimmi, KMT, Markov, D, McCawley, LJ, Hutson, MS. Chemical-PDMS binding kinetics and implications for bioavailability in microfluidic devices. Lab Chip 2019;19:12. https://doi.org/10.1039/c8lc00796a.Search in Google Scholar PubMed PubMed Central
17. Hocheng, H, Chen, CM, Chou, YC, Lin, CH. Study of novel electrical routing and integrated packaging on bio-compatible flexible substrates. Microsyst Technol 2010;16:423–30. https://doi.org/10.1007/s00542-009-0930-2.Search in Google Scholar
18. Leung, CM, de Haan, P, Ronaldson-Bouchard, K, Kim, G-A, Ko, J, Rho, HS, et al.. A guide to the organ-on-a-chip. Nat Rev Methods Primers 2022;2:33. https://doi.org/10.1038/s43586-022-00118-6.Search in Google Scholar
19. Batista, E, Sousa, JA, Álvares, M, Afonso, J, Martins, RF. Development of an experimental setup for micro flow measurement using the front tracking method. Sensors 2021;18:100152. https://doi.org/10.1016/j.measen.2021.100152.Search in Google Scholar
© 2022 the author(s), published by De Gruyter, Berlin/Boston
This work is licensed under the Creative Commons Attribution 4.0 International License.
Articles in the same Issue
- Frontmatter
- Guest Editorial
- Medical flow and dosing measurement metrology in drug delivery
- Special Issue Articles
- Metrology in health: challenges and solutions in infusion therapy and diagnostics
- Calibration methods for flow rates down to 5 nL/min and validation methodology
- Measurement of internal diameters of capillaries and glass syringes using gravimetric and optical methods for microflow applications
- In-line measurements of the physical and thermodynamic properties of single and multicomponent liquids
- Assessment of drug delivery devices working at microflow rates
- Calibration of insulin pumps based on discrete doses at given cycle times
- Development of a microfluidic electroosmosis pump on a chip for steady and continuous fluid delivery
- Effect of non-return valves on the time-of-arrival of new medication in a patient after syringe exchange in an infusion set-up
- Holographic PIV/PTV for nano flow rates–A study in the 70 to 200 nL/min range
- Unexpected dosing errors due to air bubbles in infusion lines with and without air filters