In-line measurement and modeling of temperature, pressure, and blowing agent dependent viscosity of polymer melts
-
 and
and

Abstract
During processing and bubble growth processes, the melt viscosity changes with temperature, pressure, and blowing agent concentration. Therefore, measurement and prediction methods for viscosity characterization in terms of temperature, pressure, and blowing agent dependency are needed. This study demonstrates the applicability of in-line viscosity measurements during the foam injection molding process and a model for viscosity superposition and prediction. In the present study, polystyrene and a modified polylactide for foaming applications with nitrogen as blowing agent are investigated. By changing the injection speed, temperature, and blowing agent concentration, the process conditions are varied, and thus the resulting pressure drops within the in-line measurement die. The calculated shear rates and viscosities are shifted to a master curve by the application of superposition principles. The viscosity dependency on temperature is described by the Arrhenius equation, the pressure by the Barus equation, and for the blowing agent concentration, a novel Barus-like equation was derived and applied. The prediction of the master curve viscosity function was achieved by the power-law model in combination with the superposition principles and showed good agreement with the shifted in-line data. Finally, the in-line measurements and viscosity predictions are validated by comparing them to rotational and capillary rheometer measurements.
1 Introduction
Thermoplastic polymer foams are widely used because of their lightweight design potential for technical parts, high-cost efficiency, high impact strength, and electrical and thermal insulation properties [1]. Those thermoplastic foams can be produced by physical or chemical injection foam molding and extrusion or expandable beads for autoclave processes [2,3,4]. No matter which thermoplastic foaming process is used, there is always the processing step of generating a homogenous polymer and blowing agent mixture. In the case of physical foaming within the foam extrusion or injection molding process, the blowing agent, for example, gaseous nitrogen (N2) or liquid carbon dioxide (CO2), is injected into the polymer melt during the process [5]. Through mechanical mixing by the screw and the mixing elements at the end of the screw and through sorption, the polymer melt and the blowing agent are homogenized at elevated pressure and temperature to a supersaturated solution. The supersaturated solution is then conveyed through a die, where a sudden pressure drop leads to nucleation and bubble growth [6].
The pressure requirement of the die and the caused nucleation, which depends on the pressure difference within the nucleated bubble and the supersaturated solution as well as the pressure drop rate, are mainly dependent on the viscosity of the supersaturated solution during processing. Thus, the process parameters such as extrusion or injection speed, temperature, pressure, or blowing agent concentration significantly influence viscosity and, therefore, the foaming process [7,8,9,10]. This shows that accurate viscosity measurement methods and prediction models are needed to understand and improve the foaming process, the design of screws, mixing elements or molds, and the development or modification of new and better polymers for foaming applications.
1.1 Viscosity characterization methods for foaming applications
Measuring the viscosity of a blowing agent-loaded polymer melt is not possible with standard rheometers since the blowing agent must be injected into the melt, homogenized, and kept constant throughout the measurement. Therefore, different methods for the viscosity measurement under the influence of temperature, pressure, and a blowing agent concentration are described in the literature [11,12,13,14,15,16,17,18]. In addition, there are methods for rheometer dies within foam extrusion or foam injection molding processes [11,12,13,14,15,16,17,18], as well as modified capillary rheometers or rotational rheometers equipped with a pressure cell [19,20,21,22,23]. Those methods are considered below in more detail.
Lan and Tseng [11] measured the viscosity of a polypropylene/CO2 mixture by two different slit dies during the foam injection molding process. They showed that the mixture viscosity decreased significantly at low shear rates and under the influence of CO2. By increasing the injection speed (and thus the shear rate), the viscosity reduction tended to be less. Qin et al. [12] also performed in-line measurements of polyethylene and chemical blowing agents within the foam injection molding process with a capillary tube die and different length diameter ratios. In order to describe the measured viscosity, they used a method proposed by Areerat et al. [13]. They predicted master curves by combining a simplified Cross-Carreau model and a free volume concept to determine the free volume fractions using pressure, volume, and temperature (PVT) measurements. The analysis of the expansion of the chemical blowing agent and changes in the free volume within the mixture was achieved by fitting the experimental data.
As well as for in-line viscosity measurements performed within the injection molding process, there are also methods for twin-screw extrusion [14] and single-screw extrusion [13,15,16,17,18] with different capillary tube dies, slit dies, or helical barrel rheometer dies for different polymer and blowing agent mixtures.
Besides the in-line shear viscosity measurement methods, Köpplmayr et al. [24] (for pure polymers) and Raps et al. [15] (for polymer blowing agent mixtures) showed concepts based on hyperbolically based dies, and expansion dies for pressure drop measurement and calculation of the elongational viscosity.
Handge and Altstädt [20] showed an off-line rheometer method using a sealed rotational rheometer with a pressure cell system surrounding the parallel plates. They measured polystyrene (PS) with CO2. The main problems were that no real shear rates are applied and that the CO2 concentration depended on pressure, time, and radial position within the parallel plate sample. Therefore, Fick’s law must be applied to determine the radial and time-dependent CO2 concentration during the viscosity measurement. Wingert et al. [19] used a high-pressure cell and a couette rheometer and measured the CO2 influence of viscosity on PS. They adapted a viscosity model using a free volume approach and the Williams, Landel and Ferry (WLF) equation. Gerhardt et al. [21,22] and Kwag et al. [23] used a high-pressure capillary rheometer and different polymer/CO2 solutions. They applied shear rates (similar to shear rates during processing) and pressures, but mixing the polymer melt and the blowing agent within a real extrusion or injection molding process cannot be applied. However, the homogeneity of the polymer blowing agent solution is mainly affected by mixing the polymer melt and the blowing agent [4].
Thus, the main benefit of an in-line viscosity measurement method is the performance of measurements under real process conditions concerning time, deformation, temperature, pressure, and blowing agent concentration.
1.2 Superposition principles for blowing agent-loaded polymer melts
In the literature, temperature T, pressure p, blowing agent concentration c, and shear rate γ̇ dependency on viscosity η(γ̇, T, p, c) are reported (equation (1)) [9,20,25,26]. With increasing temperature, decreasing pressure, and increasing blowing agent concentration, a reduction in viscosity is shown and vice versa. By applying superposition principles for the main influencing parameters, the behavior of viscosity can be predicted [9,10,19,20,25,26]. The −45° shift factors (in double logarithmic presentation) for temperature a T, pressure a p, and blowing agent concentration a c are applied in the following way to generate a master curve of viscosity and shear rate at reference temperature T 0, reference pressure p 0, and reference blowing agent concentration c 0 (equation (1)).
The temperature dependency for more than 100 K above glass transition temperature can be calculated and shifted by an Arrhenius equation (equation (2)) based on an energetic point of view for slip between polymer chains because of temperature [15,25].
The reference temperature T 0, process temperature T, activation energy of flow E A, and the universal gas constant R G are needed for the calculation.
The pressure dependency on viscosity counteracts the temperature dependency. Therefore, viscosity increases with increasing pressure because of the decrease in the free volume within the polymer melt. Thus, the mobility of the polymer chains is reduced. A common way to describe this behavior is by applying the Barus [27] equation (equation (3)) [10,25].
The shift factor for pressure dependency on viscosity a p is described by the pressure coefficient β p, the reference pressure p 0, and the process pressure p.
The superposition of blowing agent concentration dependency on viscosity is more complex than that for temperature or pressure. In the literature, there are mainly two different methods described. First, there are models which are based on changes in the free volume because of the blowing agent concentration within the polymer melt, for example, models from Gerhardt et al. [21], Areerat et al. [13], Di Maio et al. [28], or Fujita and Kishimoto [29]. These models are based on the Doolittle equation [30], and therefore accurate predictions of the PVT behavior of the pure polymer melt and the polymer melt blowing agent solution under defined temperature, pressure, and blowing agent concentration are needed [9]. Since measuring the free volume of a blowing agent-loaded polymer melt is difficult, approaches are often used for prediction [21,28,31]. Second, there are models based on the WLF-Chow model [32] and the changes in glass transition temperature because of pressure and blowing agent concentration. With increase in the pressure, the glass transition temperature increases, whereas with increase in the blowing agent concentration, a decrease in the glass transition temperature is reported [20,26]. WLF-Chow based models, therefore, need accurate measurements or calculations of the glass transition temperature under pressure and the blowing agent concentration [19,20,26,32].
In order to be able to predict the shear viscosity of a blowing agent-loaded polymer melt during processing, in-line viscosity measurements and superposition principles for temperature, pressure, and blowing agent concentration are needed. Mainly for the blowing agent concentration, a model is needed that only uses data gathered during processing without additional free volume and/or glass transition temperature measurements and models. Therefore, this study aims to apply in-line viscosity measurements of blowing agent-loaded polymer melts within the physical foam injection molding process with an already existing in-line slit die [33,34] and to develop a model to analyze and predict the changes in viscosity. The model is based on pure process data such as injection speed, temperature, pressure, and blowing agent concentration without the need for additional data such as the free volume or glass transition temperature described earlier.
2 Experimental section
2.1 Materials
In this study, an amorphous PS with the trade name PS 168N from Ineos Styrolution Group GmbH, Frankfurt am Main, Germany, and a semi-crystalline polylactide (PLA) with the trade name PLA 2003D from NatureWorks LLC, Minnetonka, USA, were investigated. Both polymers were chosen for the rheological analysis and modeling of viscosity because of their importance for foaming applications and the different polymer structures (the PS is amorphous and linear; the PLA, after modification, is semi-crystalline and branched). The PLA was modified (branching of the polymer chains) with 0.2 wt% of dicumyl peroxide (DCUP) on a twin-screw extruder ZSK 26, Coperion GmbH, Stuttgart, Germany, to increase the melt viscosity and melt strength for an enhanced foamability. The modification method used was developed at the IKT, Institut für Kunststofftechnik, University of Stuttgart, Germany, shown in the literature [35–37].
The branching of the modified PLA chains can be shown by applying van Gurp-Palmen plots (Figure 1a) and plots of the storage modulus over the loss modulus (Figure 1b) for pure PLA, modified PLA (PLA + DCUP), and PS.

Van Gurp-Palmen plot (a) and comparison of storage and loss modulus (b) of PLA, modified PLA (PLA + DCUP), and PS at 180°C.
The van Gurp-Palmen plots of pure PLA and PS show typical behavior for linear polymers. In contrast to the pure PLA, the modified PLA (PLA + DCUP) shows a characteristic curve for branched polymers, as reported by Dealy and Wang [25]. The comparison of the storage and loss modulus (Figure 1b) shows that the modified PLA (PLA + DCUP) has an increased storage modulus compared to the pure PLA and thus has an increased elastic behavior. This indicates as well the branching of the polymer chains of the modified PLA in comparison to the pure PLA.
The glass transition temperature (T g) and melt temperature (T m) were determined by differential scanning calorimetry DSC 2/700 from Mettler-Toledo, Columbus, Ohio, USA. The number averaged molecular weight (M n) and weight averaged molecular weight (M w) were obtained by gel permeation chromatography (GPC) Agilent 1260 from Agilent Technologies Deutschland GmbH, Waldbronn, Germany (Table 1). As the standard sample PS was used, the number averaged molecular weight (M n) and weight averaged molecular weight (M w) of the pure PLA and modified PLA (PLA + DCUP) are relative values. The relative number averaged molecular weight (M n) of the PLA + DCUP is slightly increased compared to the pure PLA, whereas the relative weight averaged molecular weight (M w) of the PLA + DCUP is highly increased compared to pure PLA. Thus, the GPC analysis also shows the modification of the PLA + DCUP compared to pure PLA.
Overview of melt temperature (T m), glass transition temperature (T g), number averaged molecular weight (M n), and weight averaged molecular weight (M w) of PS, PLA, and PLA + DCUP
| Melt temperature in °C | Glass transition temperature in °C | Number averaged molecular weight in Da | Weight averaged molecular weight in Da | |
|---|---|---|---|---|
| PS | — | 104.1 | 122,000 | 306,000 |
| PLA | 153.9 | 61.1 | 127,000 | 225,000 |
| PLA + DCUP | 152.0 | 60.1 | 140,000 | 316,000 |
Nitrogen (N2) with a molar mass of M = 28.0134 g mol−1 from Linde AG, Pullach, Germany, with a specified purity ≥99.9993 vol% was used as the physical blowing agent. Only PS and PLA + DCUP are used for further investigations on viscosity.
2.2 Shear viscosity characterization
A capillary rheometer, a rotational rheometer, and an in-line die for viscosity analysis within the injection molding process are used for the rheological characterization of the pure polymer melt. Due to the off-line and in-line measurements, the accuracy of the in-line viscosity measurements within the injection molding process (no blowing agent) are analyzed and validated. The main in-line measurements of viscosity are undertaken during the foam injection molding process with gaseous N2 as the blowing agent to measure the effect of blowing agent concentration in combination with temperature and pressure at different shear rates on viscosity.
The in-line die used had a slit width of 10 mm, a slit height of 3 mm, and an effective slit length of 80 mm and is shown in Figure 2. Three pre-calibrated pressure transducers of the MDA series from Dynisco Europe GmbH, Heilbronn, Germany are used with an axial positioning of 40 mm to each other, recording the melt pressure during flow. The flow direction in Figure 2 is from the right to the left-hand side. The die is designed as a two-piece die and has, therefore, a sealing at each half of the die and holes along the flow path for assembly. The right-hand side of the die is mounted to the cylinder of the injection molding machine, and at the left-hand side of the die, the screwable nozzle tip is mounted.
![Figure 2
Schematic drawing of the in-line viscosity measurement die within the foam injection molding process, developed at the IKT [33,34,38].](/document/doi/10.1515/arh-2022-0123/asset/graphic/j_arh-2022-0123_fig_002.jpg)
The injection molding experiments are carried out with the injection molding machine Arburg Allrounder 520S 1,600–400 with the plasticizing and drive unit h injection 400, Arburg GmbH & Co. KG, Loßburg, Germany. An eight-cavity tensile rod mold with hot runners and needle valve unit was used. The design of the mold is irrelevant for the experiments, but for the foaming application, a needle valve is needed because of the pressurized melt. The physical blowing agent (N2) was injected into the melt by the MuCell T-200, Trexel Inc., Wilmington, USA, dosing and injection system.
For the experimental investigations, the injection speed was varied from 5 to 120 cm3/s for PS (5, 10, 15, 20, 25, 30, 35, 40, 45, 50, 80, 100, and 120 cm3/s) and from 5 to 70 cm3/s for PLA + DCUP (5, 10, 15, 20, 25, 30, 35, 40, 45, 50, 55, 60, and 70 cm3/s) if the maximum safety pressure of 750 bar for the two-piece die was not reached earlier. However, if maximum pressure was reached, the process was stopped, and no higher injection speeds were applied. The melt temperature was varied between 240, 260, and 280°C for PS and between 200, 210, and 220°C for PLA + DCUP. According to the polymer datasheet, the recommended injection molding temperature range is between 180 and 280°C for PS, and a general processing temperature at 210°C is recommended for the PLA. The higher temperature range was chosen for PS to keep the pressure from reaching the maximum safety pressure for all temperatures and injection speeds. For PLA + DCUP, a smaller temperature range was applied because of the thermal and shear sensibility of the polymer. The hot runner temperature was according to the melt temperature, and the mold temperature was held constant at 20°C for PS and 30°C for PLA + DCUP. The N2 concentration was varied between 0, 0.25, and 0.5 wt%. An average N2 concentration injection time was 6.8 s with 224 bar. The screw speed was set at 15 m/min for the experiments without a blowing agent concentration and for experiments with a blowing agent concentration at 13 m/min. The lower screw speed was chosen to assure a complete dissolution and homogeneous distribution of the blowing agent concentration in the melt because of a longer metering time. The injection volume was held constant at 65 cm3 throughout the process parameter variation. The chosen parameters showed complete mold filling at the maximum expansion of N2 within the melt (at 0.5 wt% N2). The cycle time was measured at 136 s at the lowest injection speed. The process parameter variation was performed as a full factorial experimental design.
With equations (4) and (5), the shear stress τ and the apparent shear rate γ̇ app was calculated with respect to the slit geometry (height h, effective length ΔL, and width w), the injection speed V̇, and the recorded pressure drop Δp between the pressure transducers along the flow path.
The oscillating measurements of dynamic viscosity were performed on the rotational rheometer DHR2 from TA Instruments Inc., New Castle, USA, at frequencies between 628 and 0.1 rad/s for PS and from 628 to 0.01 rad/s for PLA + DCUP. Within this frequency range, the zero shear viscosity was reached at all temperatures for PS and PLA + DCUP. Before the viscosity measurement by frequency sweep mode and parallel plate setup (measurement gap 2 mm and plate diameter 25 mm), a time sweep and a deformation sweep were applied to ensure time–temperature stability during measurement and deformations within the linear viscoelastic limit. For all measurements, a deformation of 5% strain was used.
The shear viscosity was measured with the capillary rheometer RG50, Göttfert Werkstoff-Prüfmaschinen GmbH, Buchen, Germany, and a slit die (width 10 mm, height 1 mm, and length 50 mm) at apparent shear rates between 10 and 3,000 s−1 for PS and 10 and 2,000 s−1 for PLA + DCUP. The temperatures are the same for the in-line and dynamic viscosity measurements. Using the Weissenberg–Rabinowitsch transformation [39], the true shear rates are calculated according to equation (10) [34,40]. The apparent shear rates used for capillary rheometer measurements are in the same range as the in-line measurements of the pure polymer melt within the injection molding process, as well as overlapping shear rates for comparison with rotational rheometry. By combining the viscosity data gathered by those methods, the rule according to Cox and Merz [41] was applied, and the in-line measurements without a blowing agent concentration and a mold (no counter pressure) can be validated. This step was needed to ensure correct data acquisition and viscosity measurement of the blowing agent-loaded polymer melt with the in-line die.
2.3 Shear viscosity modeling of blowing agent-loaded polymer melt
Different methods and models were discussed earlier in the introduction and section of superposition principles for blowing agent-loaded polymer melts. Those models are based on changes within the free volume or the glass transition temperature because of the blowing agent concentration within the polymer melt. In order to be able to predict the shear viscosity of a blowing agent-loaded polymer melt with pure process data, a novel approach for the blowing agent concentration dependency on viscosity is shown.
The influence of the blowing agent concentration and the related shift factor a c were modeled by a novel equation derived from the Barus equation for pressure shifting, which is shown in equation (6). Instead of the pressure coefficient (β p in equation (3)), a blowing agent coefficient –β c is used with the reference blowing agent concentration c 0 and the blowing agent concentration during measurement c. Through the negative sign of the blowing agent coefficient, the counteraction with pressure is indicated.
Therefore, the basic principle was used that a blowing agent concentration increases the free volume between the polymer chains and thus reduces the viscosity as well as counteracts the pressure influence on viscosity. For example, in the literature, it is shown that at a specific blowing agent concentration (CO2), the pressure effect on viscosity is neutralized, and with increasing concentration, the viscosity is decreased below the viscosity at atmospheric pressure [25]. This was shown for linear as well as for long-chain branched polymers [9,25,42].
As viscosity function, the power-law model according to Ostwald [43], was used because of the shear rate range within the injection molding experiments, the temperature dependency on viscosity is taken into account by the law according to Arrhenius, equation (2), and the dependency of pressure by the equation according to Barus, equation (3). By combining the power-law model with equations (2), (3), and (6), the temperature, pressure, blowing agent concentration, and shear rate dependent viscosity function η(γ̇, T, p, c) can be calculated and predicted according to equation (7).
The power-law model can be expressed by fluidity Ф and the exponent m, which can be calculated from the slope of shear rate and shear stress within a double logarithmic plot. However, if the flow consistency index k is used, then the power-law exponent n must be calculated as the slope n − 1 from the double logarithmic plot of shear viscosity and shear rate data. Both consistency index k and fluidity Ф, as well as the exponents n and m, can be transferred into each other like it is shown in equations (8) and (9):
The measured data within the in-line die must be corrected because of the Newtonian assumption for shear rate calculations in equation (5). Therefore, the transformation according to Weissenberg and Rabinowitsch [39] for slit dies was used to calculate the true shear rate, equation (10), or true fluidity for the power-law model, equation (11) [40,44].
3 Results and discussion
In this section, the recorded pressure signals are discussed, and the reproducibility of the pressure signals are evaluated. Using the pressure signals resulting from the applied process parameters, the apparent shear viscosity is calculated in dependency of temperature, pressure, blowing agent concentration, and injection speed. By correcting the apparent data and applying the superposition principles for the relevant process parameters, the master curve of viscosity is calculated and predicted in combination with the power-law model. Finally, the validation of the superposition principles is shown by comparison with rotational and capillary rheometer measurements and shifting to the applied process parameters within the rotational and capillary rheometer.
3.1 Analysis of recorded in-line measurement data
As mentioned before, an eight-cavity tensile rod mold with hot runners and needle valves was used. Needle valves are essential for foam injection molding processes as the injection unit is not lifted off the mold because of the blowing agent concentration and high pressure within the system. However, a needle valve at the end of the in-line die was not possible because of the length of the in-line die and thus of the injection unit.
The recorded pressure signals p 1, p 2, and p 3, according to Figure 2, are shown in Figure 3 for a first injection cycle and its repetition cycle (p 1,2,3 repetition), which shows good agreement between the first and the second (repetition) injection cycle over the whole injection time.
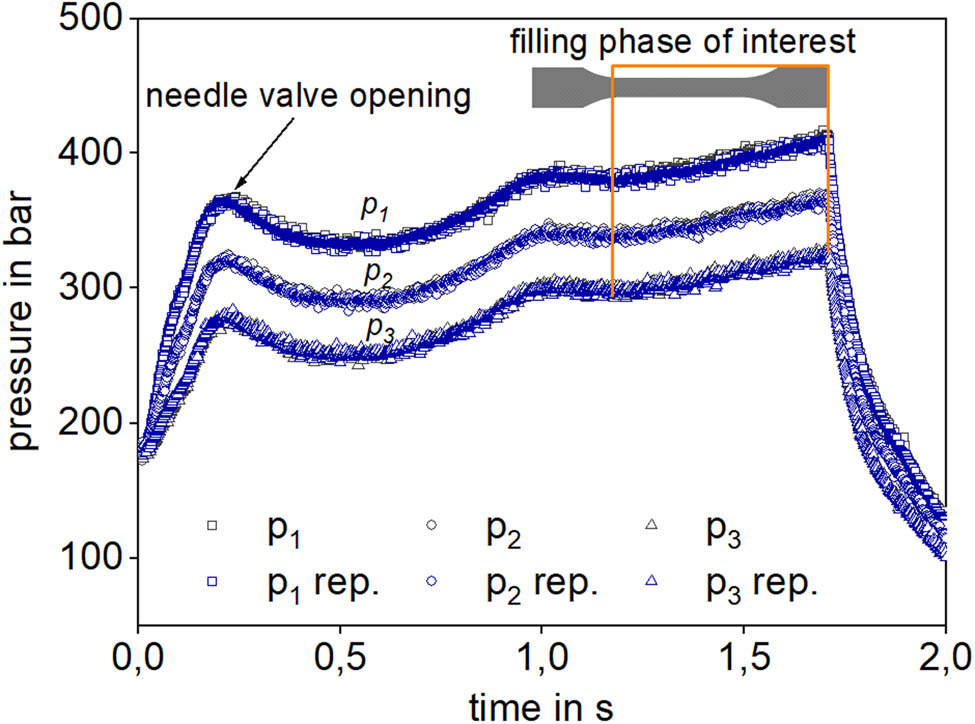
Pressure signal analysis within the in-line measurement die during the physical foam injection molding process for PS at 240 °C, 0.5 wt% N2, and 35 cm3/s.
The pressure level for p 1 is elevated compared to p 2, and p 3 because of the pressure decrease with increase in the slit length. This is because, at the beginning of the injection cycle, the needle valves are closed, and the pressure increases until opening the needle valves. Afterward, the pressure decreases slightly and increases again until the beginning of the filling phase of the cavities. The same can be seen for the experiments with PLA + DCUP.
The filling phase of interest is highlighted as well in Figure 3. Within this phase, the pressure curves are increasing parallel until the end of the filling phase as the melt volume in the cavity is increased. Therefore, this time range within the injection cycle is suitable for evaluating the pressure drop between p 1, p 2, and p 3 over the length between the three pressure transducers for each data point recorded at each time step. The pressure sampling time is set at 10−3 s, and thus at every 0.001 s, the pressure levels are recorded within the injection cycle with otherwise constant process parameters. The data sampling and pressure acquisition were developed in LabView® 2016 with the data acquisition module NI USB-6255 both from National Instruments, Austin, USA.
3.2 Reproducibility of pressure signals within the filling phase of interest
The reproducibility of the whole injection cycle for the pressure acquisition is shown in Figure 3. Now the reproducibility for the filling phase of interest is taken more closely into account. This is shown in Figure 4 for PS and in Figure 5 for PLA + DCUP at exemplary process conditions.

Reproducibility of pressure acquisition within the relevant filling phase for PS at 280°C and 0.5 wt% N2.

Reproducibility of pressure acquisition within the relevant filling phase for PLA + DCUP at 200°C and 0.25 wt% N2.
The pressure signals and the shape of the curves are the same for PS and PLA + DCUP (Figures 4 and 5) for all applied process parameters but at different pressure levels. With increase in the injection speed, the pressure level increases and decreases with increase in the temperature and blowing agent concentration and vice versa. The pressure drop rate increases with increase in the injection speed, thus the slope of the pressure profile over time is increased. The linearity at the relevant filling phase of interest is described by linear regression (Figures 4 and 5) of the pressure signals recorded with each pressure transducer at each position over the flow path. The deviation between the pressure signals within the filling phase of interest and the process parameter variation for the first and a repetition injection cycle are within 0.5–2.0% for PS and 2.4–5.0% for PLA + DCUP. Nevertheless, higher deviations for PLA + DCUP were expected because of the shear and thermal sensibility of PLA at higher injection speeds and thus higher shear rates. Therefore, high reproducibility and accuracy for all process conditions was achieved.
As mentioned before, not all injection speeds could be applied because of the maximum allowed pressure of 750 bar within the two-piece in-line die. This only occurred for measurements with PLA + DCUP at 200 and 210°C. Thus, the entire injection speed range (up to 70 cm3/s) was not evaluated. This can be seen in Figure 5, and the nearly reached maximum pressure for 35 cm3/s, 200°C, and 0.25 wt% N2. Therefore, the shear rate range for PLA + DCUP measurements is narrower than that for PS. Higher temperatures are not applicable for PLA + DCUP to minimize the pressure within the in-line die at higher injection speeds due to both the highly increased thermal degradation at temperatures above 220°C and higher shear rates. An increase in N2 concentration was not possible because of solubility problems and the corresponding inhomogeneity of the blowing agent concentration within the polymer melt.
3.3 Viscosity superposition and modeling
The shear stress was calculated at each sample time (every 0.001 s) of pressure (p 1, p 2, and p 3) within the filling phase of interest, according to equation (4), with a correlated averaged counter pressure of the three pressure signals for each sample time. The apparent shear rate was calculated according to equation (5). Finally, the temperature, injection speed, and N2 concentration were recorded and stored with the pressure dataset (p 1, p 2, and p 3) and the correlated averaged counter pressure for each sample time. Therefore, each shear stress at each sample time during the injection cycle is dependent on an average counter pressure within the in-line die, temperature, injection speed, and blowing agent concentration. The authors previously published the method for data acquisition and processing [38].
The physical foam injection molding experiments were carried out according to the described process parameters and the associated variations. Therefore, approximately 61,500 pressure value pairs (p 1, p 2, and p 3) and the applied process parameters (T, p, c, and γ̇) for PS and 87,800 for PLA + DCUP were recorded and analyzed. Due to the lower injection speeds and thus longer injection times, more datasets were recorded for PLA + DCUP than for PS. The calculated apparent viscosity in dependency of temperature, pressure, and N2 concentration at each injection speed is shown in Figure 6.

Calculated apparent viscosity for each injection speed in dependency of temperature, pressure, and blowing agent concentration.
The apparent viscosity for PLA + DCUP is higher than for PS within the process parameter variation. This can be referred to the lower temperatures for PLA + DCUP. However, it can be seen that the applied process parameters highly affect the viscosity.
In order to be able to describe the viscosity data gathered in dependency of temperature, pressure, and N2 concentration, master curves were calculated according to equation (7) with the described superposition approach for the N2 concentration (equation (6)). The apparent viscosity data from Figure 6 is corrected (equations (10) and (11)) and shifted by the shown shift factors in Figure 7 to the master curve references for comparison with the master curve predictions shown in Figure 8.

Overview of the shift factors a T, a p, and a c used to reach the master curve of the measurement data gathered by in-line viscosity measurement.

Prediction of master curves using the power-law model in combination with superposition principles for PS (reference conditions: T 0 = 260°C, p 0 = 250 bar, and c 0 = 0.25 wt% N2), PLA + DCUP (reference conditions: T 0 = 210°C, p 0 = 350 bar, and c 0 = 0.25 wt% N2), and shifted apparent viscosity data from in-line measurements.
For comparison of the shifted measurement data with the calculated master curve in Figure 8, the shear rate is multiplied, and the viscosity is divided by the shift factors a T, a p, and a c (Figure 7 and equation (1)). The law, according to Arrhenius, can therefore also be used for PS since the glass transition temperature is far enough below the process temperatures used for the experiments. The numerical calculations of the activation energy E A, the pressure coefficient β p, the concentration coefficient β c, the consistency index k, and the power-law exponent n for the power-law model were performed with Matlab® R2017a, The MathWorks Inc., Natick, USA.
The overall agreement between the shifted in-line measurement data from Figure 6 and the modeled master curves at reference conditions in Figure 8 are in good accuracy to each other with a deviation of 4.6% for PS and 3.7% for PLA + DCUP. The calculated master curve parameters and shifting coefficients, as well as the activation energies, are shown in Table 2. In addition, the apparent fluidity Фapp and the true fluidity Ф as well as the flow exponent m can be calculated from equations (8), (9), and (11).
Overview of power-law and superposition parameters for the master curve prediction and shifting of measurement data for PS (reference conditions: T 0 = 260°C, p 0 = 250 bar, and c 0 = 0.25 wt% N2) and PLA + DCUP (reference conditions: T 0 = 210°C, p 0 = 350 bar, and c 0 = 0.25 wt% N2)
| Consistency index k in kPa s n | Power-law exponent n | Activation energy E A in kJ/mol | Pressure coefficient β p in bar−1 | Concentration coefficient β c in (wt% N2)−1 | |
|---|---|---|---|---|---|
| PS | 28.1 | 0.195 | 128 | 3.67 × 10⁻³ | 0.774 |
| PLA + DCUP | 34.8 | 0.294 | 88.0 | 1.52 × 10⁻³ | 0.373 |
By comparing the activation energy, pressure, and the concentration coefficient of PS with PLA + DCUP, the dependency of the polymer structure is shown as well. Since amorphous polymers (e.g., PS) have an increased free volume compared with semi-crystalline polymers (e.g., PLA), the dependency of temperature, pressure, and N2 concentration on viscosity is increased for amorphous polymers. This is also shown in the literature for other mixtures and prediction models [10,34,45].
The validation of viscosity predictions in dependency of temperature, pressure, and N2 concentration is achieved by comparing with rotational and capillary rheometer measurements. Therefore, the viscosity function (master curves, Figure 8) is shifted to the measurement conditions (T, p, and c) of rotational and capillary rheometry. In addition, in-line measurements for PS and PLA + DCUP are carried out without a mold (no counter pressure) and no N2 concentration at all temperatures. Thus, the in-line measurement and data acquisition can be validated as well by comparing with rotational and capillary rheometer measurements. This is shown for PS in Figure 9 at 260°C for true viscosity data.

Validation of in-line viscosity measurements and superposition principles for PS.
The measurements at 220°C for PS in Figure 9 were performed by rotational and capillary rheometry to show the shifting of the master curve to lower temperatures. Both the in-line measurements and the shifted master curve to the rotational and capillary rheometer measurements at 220 and 260°C at 1 bar counter pressure and 0 wt% N2 concentration show good overall agreement within the power-law shear rate range. Therefore, the concentration shift factor a c defined as a counteraction to pressure, and the in-line measurement method is validated for PS.
The viscosity reduction in PS in terms of temperature or N2 concentration increase can be quantified by the developed model. If the N2 concentration is raised to e.g., 1 wt% N2 or the temperature by 20 K to 280°C from the data in Figure 9 at 260°C, 1 bar, and 0 wt% N2, then the viscosity reduction tends to be nearly the same either way (Figure 10). Due to the linearity of the power-law model, the reduction in viscosity can be analyzed at an exemplary reference shear rate of e.g., 500 s−1, which can be chosen freely within the power-law shear rate range. Therefore, the viscosity is reduced by 18.5% through temperature and 14.1% through N2 concentration increase.

Quantification of viscosity reduction by increasing the N2 concentration and temperature.
The same can be seen for PLA + DCUP in Figure 11. Furthermore, the comparison of viscosity prediction for PLA + DCUP (master curve shifted to 210°C, 1 bar, 0 wt% N2 in Figure 11) with rotational and capillary rheometer measurements and with in-line measurements without a mold (no counter pressures and no N2 concentration) also shows good overall agreement. Therefore, the viscosity prediction is validated for PLA + DCUP as well. In addition, the rule of Cox-Merz applies for all measurements carried out within the process parameter variation for PS and PLA + DCUP.

Validation of in-line viscosity measurements and superposition principles for PLA + DCUP.
If the effect of viscosity reduction is taken into account for PLA + DCUP from 210°C, 1 bar, and 0 wt% N2 (Figure 11), then the viscosity is reduced by 10.4% due to an increase in the N2 concentration to e.g., 1 wt% N2 and by 22.6% through temperature increase of 20 K to 230°C.
4 Conclusion
This study demonstrates the applicability of the in-line slit die and the pressure acquisition within the physical foam injection molding process for viscosity measurements in dependency of injection speed, temperature, pressure, and blowing agent concentration. The advantage is the evaluation of a high number of pressure levels recorded at each sample time during the injection cycle. Multiple experiments at constant process conditions showed good reproducibility even for the experiments at elevated temperatures and blowing agent concentrations. An averaged repeatability for the relevant filling phase of 1% for PS and 3.7% for PLA + DCUP was achieved. The in-line viscosity measurements at 1 bar counter pressure and 0 wt% N2 were confirmed by comparing them to rotational and capillary rheometer measurements. The superposition for temperature with the law of Arrhenius, Barus equation for pressure, and the novel equation for the blowing agent concentration was successfully demonstrated. Therefore, a master curve of the recorded datasets was successfully generated. Predictions of the master curve viscosity function by the power-law model combined with the superposition principles showed good accuracy compared to the shifted in-line measurements. Finally, the prediction of the shifted viscosity function is in good agreement with rotational and capillary rheometer measurements within the corresponding shear rate range of the power-law model. Therefore, the superposition principle developed for the blowing agent concentration is validated, and no other data, for example, the free volume or glass transition temperatures, are needed. The findings also show the typical deviation in temperature, pressure, and blowing agent concentration dependencies between amorphous and semi-crystalline polymers.
In summary, it is demonstrated that in-line measurements and predictions of shear rate, temperature, pressure, and blowing agent concentration dependent viscosity were achieved only with data recorded during processing. The presented superposition principles and their shifting parameters may further be used to better understand the processing of blowing agent-loaded polymer melts and bubble growth processes. Therefore, the shift factors should be used in combination with a prediction model for elongational viscosity. Furthermore, existing foaming processes and new polymers for foaming applications can be optimized by such viscosity and superposition data.
Acknowledgments
The authors gratefully thank the Arburg GmbH & Co. KG, Germany, for providing the physical foam injection molding machine and the Ineos Styrolution Group GmbH, Germany, for the supply of PS samples.
-
Funding information: This study was funded by the Deutsche Forschungsgemeinschaft (DFG, German Research Foundation) – project number 426052763.
-
Author contributions: Conceptualization, methodology, software, validation, formal analysis, investigation, resources, data curation, writing – original draft preparation, writing – review and editing, and visualization: T.S.; supervision and funding acquisition: C.B. All authors have read and agreed to the published version of the manuscript.
-
Conflict of interest: The authors state no conflict of interest and no competing financial interest.
-
Data availability statement: The datasets generated during and/or analyzed during the current study are available with the corresponding author on reasonable request.
-
Ethical approval: The conducted research is not related to either human or animal use.
References
[1] Bonten C. Plastics technology: Introduction and fundamentals. Munich: Hanser; 2019.10.3139/9781569907689Search in Google Scholar
[2] Throne JL. Thermoplastic foam extrusion: An introduction. Munich: Hanser; 2004.Search in Google Scholar
[3] Jin F-L, Zhao M, Park M, Park S-J. Recent trends of foaming in polymer processing: a review. Polymers. 2019;11(6):953(1–23). 10.3390/polym11060953.Search in Google Scholar PubMed PubMed Central
[4] Gendron R. Thermoplastic foam processing: principles and development. Boca Raton: CRC Press; 2004.10.1201/9780203502167Search in Google Scholar
[5] Praller A. Foaming plastics with inert gases. Kunststoffe Plast Europe. 2005;95(6):96–9.Search in Google Scholar
[6] Klempner D, Aseeva RM. Handbook of polymeric foams and foam technology. 2nd edn. Munich: Hanser; 2004.Search in Google Scholar
[7] Park CB, Baldwin DF, Suh NP. Effect of the pressure drop rate on cell nucleation in continuous processing of microcellular polymers. Polym Eng Sci. 1995;35(5):432–40. 10.1002/pen.760350509.Search in Google Scholar
[8] Taki K. Experimental and numerical studies on the effects of pressure release rate on number density of bubbles and bubble growth in a polymeric foaming process. Chem Eng Sci. 2008;63(14):3643–53. 10.1016/j.ces.2008.04.037.Search in Google Scholar
[9] Park HE, Dealy JM. Effects of pressure and supercritical fluids on the viscosity of polyethylene. Macromolecules. 2006;39(16):5438–52. 10.1021/ma060735+.Search in Google Scholar
[10] Park HE, Dealy JM, Co A, Leal GL, Colby RH, Giacomin AJ. Effects of supercritical fluids, pressure, temperature, and molecular structure on the rheological properties of molten polymers. AIP Conference Proceedings. Vol. 1027; 2008. p. 366–8. 10.1063/1.2964693.Search in Google Scholar
[11] Lan H-Y, Tseng H-C. Study on the rheological behavior of PP/supercritical CO2 mixture. J Polym Res. 2002;9(3):157–62. 10.1023/A:1021366923334.Search in Google Scholar
[12] Qin X, Thompson MR, Hrymak AN, Torres A. Rheology studies of polyethylene/chemical blowing agent solutions within an injection molding machine. Polym Eng Sci. 2005;45(8):1108–18. 10.1002/pen.20371.Search in Google Scholar
[13] Areerat S, Nagata T, Ohshima M. Measurement and prediction of LDPE/CO2 solution viscosity. Polym Eng Sci. 2002;42(11):2234–45. 10.1002/pen.11113.Search in Google Scholar
[14] Nobelen M, Hoppe S, Fonteix C, Pla F, Dupire M, Jacques B. Modeling of the rheological behavior of polyethylene/supercritical CO2 solutions. Chem Eng Sci. 2006;61(16):5334–45. 10.1016/j.ces.2006.03.052.Search in Google Scholar
[15] Raps D, Köppl T, Heymann L, Altstädt V. Rheological behaviour of a high-melt-strength polypropylene at elevated pressure and gas loading for foaming purposes. Rheol Acta. 2017;56(2):95–111. 10.1007/s00397-016-0988-6.Search in Google Scholar
[16] Choudhary M, Delaviz Y, Loh R, Polasky M, Wan C, Todd DB, et al. Measurement of shear viscosity and solubility of polystyrene melts containing various blowing agents. J Cell Plast. 2005;41(6):589–99. 10.1177%2F0021955X05059036.Search in Google Scholar
[17] Fernández-Ronco MP, Hufenus R, Heuberger M. Effect of pressurized CO2 and N2 on the rheology of PLA. Eur Polym J. 2019;112:601–9. 10.1016/j.eurpolymj.2018.10.023.Search in Google Scholar
[18] Raps D, Hosseinabadi HG, Heymann L, Köppl T, Altstädt V. Rheological properties of thermoplastic polymers with dissolved gases for foaming applications. 2018, https://arxiv.org/pdf/1804.07956.Search in Google Scholar
[19] Wingert MJ, Shukla S, Koelling KW, Tomasko DL, Lee LJ. Shear viscosity of CO2-plasticized polystyrene under high static pressures. Ind Eng Chem Res. 2009;48(11):5460–71. 10.1021/ie800896r.Search in Google Scholar
[20] Handge UA, Altstädt V. Viscoelastic properties of solutions of polystyrene melts and carbon dioxide: Analysis of a transient shear rheology approach. J Rheol. 2012;56:743–66. 10.1122/1.4708601.Search in Google Scholar
[21] Gerhardt LJ, Garg A, Manke CW, Gulari E. Concentration‐dependent viscoelastic scaling models for polydimethylsiloxane melts with dissolved carbon dioxide. J Polym Sci Part B Polym Phys. 1998;36(11):1911–8. 10.1002/(SICI)1099-0488(199808)36:11%3C1911:AID-POLB12%3E3.0.CO;2-A.Search in Google Scholar
[22] Gerhardt LJ, Manke CW, Gulari E. Rheology of polydimethylsiloxane swollen with supercritical carbon dioxide. J Polym Sci Part B: Polym Phys. 1997;35(3):523–34. 10.1002/(SICI)1099-0488(199702)35:3%3C523:AID-POLB11%3E3.0.CO;2-J.Search in Google Scholar
[23] Kwag C, Manke CW, Gulari E. Rheology of molten polystyrene with dissolved supercritical and near‐critical gases. J Polym Sci Part B Polym Phys. 1999;37(19):2771–81. 10.1002/(SICI)1099-0488(19991001)37:19%3C2771:AID-POLB6%3E3.0.CO;2-9.Search in Google Scholar
[24] Köpplmayr T, Luger H-J, Burzic I, Battisti MG, Perko L, Friesenbichler W, et al. A novel online rheometer for elongational viscosity measurement of polymer melts. Polym Test. 2016;50:208–15. 10.1016/j.polymertesting.2016.01.012.Search in Google Scholar
[25] Dealy JM, Wang J. Melt rheology and its applications in the plastics industry. Engineering materials and processes. 2nd edn. Dordrecht: Springer; 2013.10.1007/978-94-007-6395-1Search in Google Scholar
[26] Royer JR, Gay YJ, Desimone JM, Khan SA. High‐pressure rheology of polystyrene melts plasticized with CO2: Experimental measurement and predictive scaling relationships. J Polym Sci Part B Polym Phys. 2000;38(23):3168–80. 10.1002/1099-0488(20001201)38:23%3C3168:AID-POLB170%3E3.0.CO;2-E.Search in Google Scholar
[27] Barus C. Isothermals, isopiestics and isometrics relative to viscosity. Am J Sci. 1893;s3–45(266):87–96. 10.2475/ajs.s3-45.266.87.Search in Google Scholar
[28] Di Maio E, Iannace S, Mensitieri G, Nicolais L. A predictive approach based on the Simha–Somcynsky free‐volume theory for the effect of dissolved gas on viscosity and glass transition temperature of polymeric mixtures. J Polym Sci Part B Polym Phys. 2006;44(13):1863–73. 10.1002/polb.20845.Search in Google Scholar
[29] Fujita H, Kishimoto A. Diffusion‐controlled stress relaxation in polymers. II. Stress Relax Swollen Polym J Polym Sci. 1958;28(118):547–67. 10.1002/pol.1958.1202811806.Search in Google Scholar
[30] Doolittle AK, Doolittle DB. Studies in Newtonian flow. V. Further verification of the free-space viscosity equation. J Appl Phys. 1957;28(8):901–5. 10.1063/1.1722884.Search in Google Scholar
[31] Lee M, Park CB, Tzoganakis C. Measurements and modeling of PS/supercritical CO2 solution viscosities. Polym Eng Sci. 1999;39(1):99–109. 10.1002/pen.11400.Search in Google Scholar
[32] Chow TS. Molecular interpretation of the glass transition temperature of polymer-diluent systems. Macromolecules. 1980;13(2):362–4. 10.1021/ma60074a029.Search in Google Scholar
[33] Geyer A, Bonten C. Material characterization within the injection molding process. AIP Conf Proc. 2019;2055:120005(1–5). 10.1063/1.5084895.Search in Google Scholar
[34] Geyer A. Inline-Charakterisierung von Kunststoffen im Spritzgießprozess und ihre Potentiale im Kontext selbstlernender Maschinen. Dissertation. Stuttgart: University of Stuttgart; 2020.Search in Google Scholar
[35] Göttermann S, Weinmann S, Bonten C, Standau T, Altstädt V. Modified standard polylactic acid (PLA) for extrusion foaming. AIP Conference Proceedings; 2016. p. 60001(1–5). 10.1063/1.4965522.Search in Google Scholar
[36] Standau T, Murillo Castellón S, Delavoie A, Bonten C, Altstädt V. Effects of chemical modifications on the rheological and the expansion behavior of polylactide (PLA) in foam extrusion. e-Polymers. 2019;19(1):297–304. 10.1515/epoly-2019-0030.Search in Google Scholar
[37] Murillo Castellón S. In-situ-Modifikation von Polylactiden mittels reaktiver Extrusion zur Herstellung von Bio-Schäumen. Dissertation. Stuttgart: University of Stuttgart; 2020.Search in Google Scholar
[38] Schaible T, Grauf F, Bonten C. Inline-Viskositätsmessung von treibmittelbeladenen Kunststoffschmelzen. In: Bonten C, Kreutzbruck M, editors. 27. Stuttgarter Kunststoff-Kolloquium; 2021. p. 57–63.Search in Google Scholar
[39] Rabinowitsch B. Über die Viskosität und Elastizität von Solen. Z für Physikalische Chem. 1929;145A(1):1–26. 10.1515/zpch-1929-14502.Search in Google Scholar
[40] Geiger K, Martin G, Sobotta A, Bonten C. Numerische simulation von Strömungsvorgängen in Extrusionswerkzeugen für teilvernetzte oder hochgefüllte Kunststoffschmelzen. Z Kunststofftechnik/Journal Plast Technol. 2017;13(2):144–74. 10.3139/O999.03022017.Search in Google Scholar
[41] Cox WP, Merz EH. Correlation of dynamic and steady flow viscosities. J Polym Sci. 1958;28(118):619–22. 10.1002/pol.1958.1202811812.Search in Google Scholar
[42] Park HE, Dealy J, Münstedt H. Influence of long-chain branching on time-pressure and time-temperature shift factors for polystyrene and polyethylene. Rheol Acta. 2006;46(1):153–9. 10.1007/s00397-006-0116-0.Search in Google Scholar
[43] Ostwald W. Ueber die Geschwindigkeitsfunktion der Viskosität disperser Systeme. II. Kolloid-Zeitschrift. 1925;36(3):157–67. 10.1007/BF01423485.Search in Google Scholar
[44] Pahl M, Gleißle W, Laun H-M. Praktische Rheologie der Kunststoffe und Elastomere. Kunststofftechnik. 4th edn. Düsseldorf: VDI-Verl; 1995.Search in Google Scholar
[45] Sedlacek T, Zatloukal M, Filip P, Boldizar A, Saha P. On the effect of pressure on the shear and elongational viscosities of polymer melts. Polym Eng Sci. 2004;44(7):1328–37. 10.1002/pen.20128.Search in Google Scholar
© 2022 Tobias Schaible and Christian Bonten, published by De Gruyter
This work is licensed under the Creative Commons Attribution 4.0 International License.
Articles in the same Issue
- Research Articles
- Modeling thixotropic break-down behavior of dense anaerobically digested sludge
- Structure of pumpkin pectin and its effect on its technological properties
- Free volumes in mixed-tacticity poly(3-hydroxybutyrate) determined by viscosimetry and their correlations with structural features and mechanical properties
- In-line measurement and modeling of temperature, pressure, and blowing agent dependent viscosity of polymer melts
- Determining the gas accumulation period using fluid inclusion observations: Xiang Zhong Basin, China
- Rheological thixotropy and pasting properties of food thickening gums orienting at improving food holding rate
- Evaluation of four different cogeneration cycles by using some criteria
- Effect of phosphogypsum and water-retaining in the stabilization and durability of stabilized mortars
- Determination of gamma-ray transmission factors of WO3–TeO2–B2O3 glasses using MCNPX Monte Carlo code for shielding and protection purposes
- Assessment of the usability conditions of Sb2O3–PbO–B2O3 glasses for shielding purposes in some medical radioisotope and a wide gamma-ray energy spectrum
- Exergy analyses of two and three stage cryogenic cycles
- Special Issue on Rheological Behavior and Engineering Stability of Rock Mass - Part I
- Mechanical properties of sandstone under hydro-mechanical coupling
- GIS-based landslide susceptibility mapping using frequency ratio and index of entropy models for She County of Anhui Province, China
- Reinforcement placement on mechanics and deformation of stepped reinforced retaining wall experimental study of characteristics