Optimizing hybrid power system at highest sustainability
-
Qusay Hassan
 ,
Marek Jaszezur
,
Marek Jaszezur

Abstract
The current research investigated the utilization of fuel cells as an energy storage unit in microgrid energy system applications in an effort to enhance self-consumption of renewable energy. The prototype evaluation is constructed of solar photovoltaic and fuel cell energy storage units. The study utilizes experimental weather and electrical load data for household obtained at 1-min temporal resolution. The daily average energy consumption for the evaluated household was 10.3 kWh, with a peak power output of 5.4 kW and an annual energy consumption of 3757 kWh. The Solar System under investigation has a capacity of 3.6 kWp, while the fuel cell system has a capacity of 0–3 kW, allowing for effective integration with the photovoltaic system and a maximum renewable energy fraction. The research indicates that by installing fuel cells powered by hydrogen generated from renewable energy sources, self-consumption and self-sufficiency significantly increase. The annual energy flow demonstrated that the implementation of 2.5 kW fuel cells improved renewable fraction utilization from 0.622 to 0.918, while increasing energy self-consumption by 98.4% to 3338.2 kWh/year and self-sufficiency by 94.41% to 3218.8 kWh/year.
Introduction
The renewable energy sources are gaining relevance in sustainable energy and environment economics owing to their falling particular prices and reduced emissions. The growing popularity of photovoltaic (PV) correlates with the emergence of a large number of decentralized prosumers who can also generate energy. Energy markets enable prosumers of all types to exchange their excess energy with one another and with the grid, especially with the development of intelligent technology. The outcomes of the research focusing on the formation of an energy community indicate that overall costs may be greatly lowered compared to producers and consumers acting alone (Kühnbach, Bekk, and Weidlich 2022; Mustika et al. 2022). Due to the unpredictable and stochastic nature of renewable energy production, however, energy exchanges between producers and consumers and distribution networks cause severe power quality issues. PV cannot provide power on demand; rather, the quantity and timing of production are dependent on weather conditions. Perhaps short-term cloud movements might result in a rapid and large power change. Consequently, unexpected voltage spike, which may occur as the penetration rate of renewable energy sources rises, and power quality, which occurs when PV generation exceeds demand, are examples of such issues. When the production is less than peak loading or the loading is less than the output, the voltage issue often arises. Specifically, maintaining the voltage under a certain limit at the peak irradiance or load is crucial for grid safety. Frequently, reverse power flow happens when demand is less than production, notably during the summer in the northern hemisphere. Due to the incompatibility of reverse power flow with current grid infrastructure, reverse power flow generates security and operating issues that degrade energy quality, such as over/under voltage and overcapacity. Increasing the frequency of transformer is desirable but costly in networks planned expansion (Tercan et al. 2022; Zarrilli et al. 2017). Table 1 shows the technical specifications of the proposed system components.
Technical specifications of the proposed system.
| Component | Model | Efficiency (%) | Rated power (kW) | Ref. |
|---|---|---|---|---|
| PV module | LONGI | 19.7 | 0.45 | LONGI PV Modules |
| EL | Geemblue | 90 | 3 | Electrolyzer Type Greemblue 1 kW |
| FC | Aerostak | 40 | 0.5 | Fuel Cell Type Aerostak A |
| Hydrogen tank | Doosan | 98 | 20 | Hydrogen Tank Doosan 1kW |
| Converter | Absopulse | >95 | 7 | Solar Inverter Type REVO |
Within the framework, self-consumption provides a new challenge based on a revised definition of the utility. Using a PV system in combination with a Fuel Cell (FC) as a storage energy unit might be a viable option.
Using modeling software, D’Adamo et al. (2022) examined self-consumption PV systems and investigated the environmental and energy outcomes. The average yearly demand curves for hospitals in Europe favored optimum use of solar systems, resulting in very high rates of self-consumption. Furthermore, by utilizing 30–50% of the roof surface, an average of 25–30% of the yearly power demand could be met, and CO2 emissions could be reduced. So, putting solar systems in hospitals in the Mediterranean region so they can use their own energy is a very interesting idea. In Turkey, Ceylan and Devrim (2021) constructed and optimized an integration of renewable systems comprised of PV/Electrolyzer (EL)/FC to generate power and heat for greenhouses. The combination of a PV system with FC was selected for year-round, uninterrupted generation of electricity. In addition, a micro-combined cycle application was employed to heat the greenhouse using heat provided by FC. The authors used MATLAB/Simulink for the design and optimization of the hybrid proposed system under consideration. Solar energy was used to create the hydrogen (H2) needed to power the electrolyzer in the planned system. In instances when solar energy was insufficient and unable to fulfill the electrical needs of the electrolyzer, the H2 needs for the functioning of the FC were provided by the H2 storage tanks, and energy continuity was maintained. The electrolyzer was built to meet the 3 kW FC H2 needs, which satisfied the greenhouse energy requirement. The electrical and thermal efficiency of an FC-based hybrid system are 48 and 45%, respectively. According to optimization findings for the proposed hybrid system, the levelized cost of energy was determined to be $0.117/kWh. The results show that the proposed PV/EL/FC hybrid power system could be used to power stand-alone applications in an independent way. Babatunde, Munda, and Hamam (2022) examined the capabilities of HOMER to assess the possibility of choosing a renewable energy system. The Nigerian home load will be powered by an energy system comprised of wind turbines (WTs), solar PV, FC, EL, H2 storage, and battery (BT) energy storage. In accordance with the economic measure, the ideal scenario is a PV-BT with a net present cost (NPC) of $9070 and an initial investment cost of $3820. However, if the energy systems are rated based on several criteria (economic, technological, and situational influences), a hybrid PV/FC/WT/BA (initial cost: $7680; NPC: $10,325) is the most desired of the viable energy systems. The research outcomes show that for the implementation of hydrogen energy storage as part of a hybrid power system to be viable, the decision metrics should be based on many criteria. Salameh et al. (2021) provided a study and effectiveness of a combined hybrid solar PV/FC/diesel generator (DG)/BA/supercapacitor (SU) in Sharjah, UAE. On the basis of daily energy use, the HOMER Pro program was utilized to develop and simulate the hybrid energy system (HES). According to the simulation results, using an energy storage system would improve the performance of HES in terms of levelized Cost of Energy (COE) and greenhouse gas (GHG) emissions. The proposed HES with energy storage system has a renewable percentage of 68.1% and a COE of $0.346/kWh. The proposed system meets the city annual AC primary demand (13.6 GWh) with minor extra power and a 1.38% electrical load shortfall. With energy storage, GHG emissions went down by 83.2%, which saved 814,428 gallons of fuel. Budak and Devrim (2019) conducted a comparative investigation of a PV/FC hybrid system based on the electrolysis of water and methanol. The proposed system consists of PV, EL, and FC. The proposed hybrid system is intended to provide the hydrogen required by the FC system as well as satisfy the H2 needs of other applications. Actual Izmir, Turkey solar irradiation statistics are used in the simulation. The methanol and water electrolyzers were developed to meet the 1.2 kW FC H2 consumption, which satisfied a typical household’s energy needs. Analyses indicate that the methanol electrolyzer produces 27% more hydrogen than the water electrolyzer. The results of the study showed that the hybrid system based on methanol was a possible way to be self-sufficient at home. Choukai et al. (2022) are investigating the technical and economic features of PV systems for university building self-consumption enhancement, as well as the deployment of solar street lights to enhance the performance of nighttime illumination. Additionally, an introduction to the intelligent smart building idea that permits centralized technical control of the installed equipment and, more specifically, the lighting protocol, was expanded. Also, this technology lets them manage the use of resources electronically and in real time. This will give us a higher level of comfort while reducing the amount of energy used. Castillo-Cagigal et al. (2011) investigate the impact of active demand-side management and storage devices on the regional electrical energy consumption. It is based on a concept of a solar home with power grid, PV production, lead–acid batteries, programmable appliances, and smart metering. They conducted simulations for long-term experiments and actual measurements for short and medium-term ones. The results reveal a nonlinear connection between electrical fluxes and storage capabilities, which becomes an essential design requirement. Utilizing an innovative performance assessment, Villar, Neves, and Silva (2017) assess the suitability and potential effect of PV systems for self-consumption. Regarding various panel positions and tilts, the genuine demand profiles from home, commercial, hospitality, and industry clients, as well as the simulated solar PV supply profiles for various places. To evaluate the optimal consumer and enterprise profile, the discounted payback time and investment interest rate are employed as benchmarks. Self-consumption is driven by tariff and demand pattern, as well as the compensation for solar energy excess. The residential and retail sectors show the greatest energy and economic outcomes, with varied panel orientations and tilts ranging from 3 to 6 years and an internal rate of return between 17 and 27% for ideal orientation and placement. Given the variety of domestic consumers, the finest prosumers are found in profiles or flats with diurnal occupation, 17% self-consumption, and various panel orientations and tilts of seven years. McKenna, Pless, and Darby (2018) deal with the self-consumption issue by analyzing 1-min power measurements for 302 UK microgrid participant houses. The research found that the average home uses 855 kWh per year, which is 45% of the PV production. The researchers perform a simple regression analysis to evaluate self-consumption and use the outcomes to illustrate that self-consumption for an average UK household with an energy consumption of 4000 kWh/year and a 2.9 kWp PV system is equivalent to a 24% decrease in average annual energy consumption from the grid. The methodology could be successfully adapted to assess and anticipate self-consumption in different solar markets, which has progressively significant consequences for valuing solar investments, establishing feed-in tariffs, and analyzing the effects of PV on networks and retail sales. Mateo et al. (2018) provide a power stream quantitative evaluation of this effect using European typical network infrastructure and by analyzing possible downsides that could be encountered under different PV adoption scenarios and when various policies are implemented. The results indicate that the size of the systems has a significant effect on voltage and heat limit breaches, which is often even greater than the effect of PV penetration. The current solutions to prevent or delay network expenditures are recommended, such as the use of curtailment; the adjustment of current voltage limitations. Tongsopit et al. (2019) investigate the economics of distributed solar PV power self-consumption in Thailand. On the basis of the research, researchers evaluate the viability of distributed solar PV self-consumption systems for four client categories. Among the three evaluated systems, all customer groups are successful, and net metering provides the greatest consumer advantages. However, researchers suggest the implementation of net invoicing not only due to its adequate degree of economic feasibility but also due to its adaptability in resolving the concerns of a wide range of stakeholders. The analytical method captures in detail how these compensating methods potentially affect the distributed solar PV size relative to the load. During an energy transition, nations that want to build or change their national-level distributed solar PV self-consumption policies might imitate our methods. Martín-Chivelet and Montero-Gómez (2017) present an approach to assist building integrated PV designers in attaining these goals. Its application to a real-world scenario demonstrates that the various facades of the building envelope may contribute to the local PV generation provided their orientations get adequate insolation during peak demand hours. Particularly in the northern hemisphere, all exterior surfaces of the building that are not oriented to the north should be considered as a first step, followed by an analysis and comparison of the options that provide the highest production match in order to determine the optimal solution. Nyholm et al. (2016) effort optimizes family self-sufficiency by reducing the quantity of grid-purchased power and increasing the degree of PV electricity self-consumption. The study was done for various combinations of PV configuration size and battery capacity for different types of single-family houses, which covers around 2000 Swedish families. The results indicate that the use of batteries with capacities within the tested range of 0.15–100 kW h could boost self-consumption by a maximum of 20–50 percentage points. Based on the load profiles of a home that uses 20 MWh of electricity a year and has a 7 kWp PV installation, this range of enhanced self-consumption of PV-generated energy needs 15–24 kWh of battery capacity. Yu (2018) has shown that domestic PV systems paired with Li-ion batteries in France might become economical for private investors prior to 2030. Therefore, the demand for energy in the domestic sector in France will be natural in the near future. However, substantial PV integration presents new difficulties for participants in the power system. The research demonstrates that PV self-consumption with storage batteries has less of an effect on the electricity system than complete grid infusion. Moreover, it is demonstrated that quick integration is more expensive than the alternative of gradual PV system adoption. In order to enable participants to adjust to the new market scenario, we advocate a regular and gradual approach for the switch to PV self-consumption. By analyzing four distinct scenarios, Keiner et al. (2019) they determine the cost-optimal combination of complementary technologies such as batteries, electric cars, heating systems, and thermal preservation for PV producers and consumers worldwide. In addition, the study gives the criteria for economically optimal maximum battery capacity per installed PV capacity, as well as self-consumption rates, demand coverage ratios, and heat cover proportions for 145 distinct global areas. The research of its type is to do a worldwide analysis of PV producers and consumers with a variety of alternatives for meeting their total energy consumption in 2050. In the future, the most cost-effective choice for families in most parts of the world will be to use as much of their own solar PV energy as possible to meet all of their energy needs.
This study proposes an effective PV/FC size approach that takes into account the balance between self-consumption and self-sufficiency to supplement existing research. The methodology is evaluated on Iraqi environments for housing system and sun irradiation to investigate the influence of simulating climatic areas on the outcomes. The following subjects are examined:
Self-consumption and self-sufficiency metrics to quantify the enhanced cooperation potential between PV production and FC for residential power generation.
The best PV/FC configuration for residential power utilizing a novel framework and metric that takes into account the balance between self-consumption and self-sufficiency.
The effect of the installation of FC capacity on the best PV/FC size for residential power production.
This study is structured offers the simulation data, assumptions, scenarios, FC capacity, and demand matching metrics utilized. The outcomes for generation-load profiles and optimum PV/FC size in residential power production. Highlights of the conclusions and potential future work are described further.
System description and governing equations
Figure 1 depicts the strategy for the chosen renewable energy sources, PV/FC/EL/hydrogen tank (HT). The PV system produced energy throughout the day, which is utilized to power the necessary load, while surplus energy is sent to the electrolyzer in order to manufacture hydrogen. The stored hydrogen is used to feed the fuel cell in order to give energy to the required load when the intended load exceeds the amount of energy generated by the PV system, as well as during nighttime and overcast times.
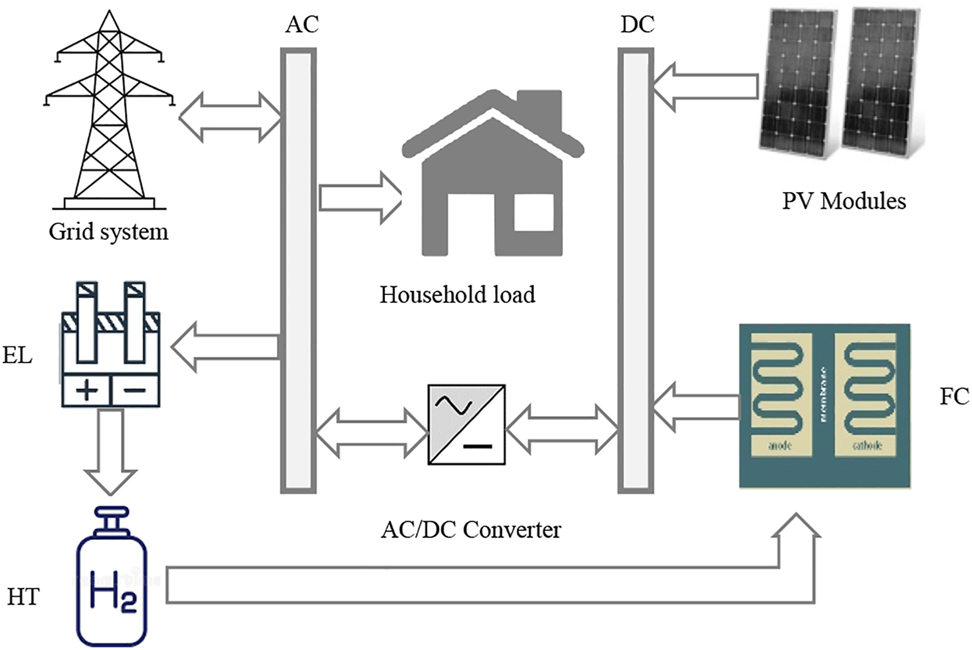
Proposed system schematic diagram.
Experimental data
Electrical load: The analyses were performed on the distinct load profiles. The actual load profiles derived from experimental power demand measurements with a resolution of 1 min, for a home in Baqubah, Diyala, Iraq. The average daily electrical energy consumption and production are 10.1 kWh and 0.429 kW, respectively, with a highest peak output of 6.225 kW and an annual energy usage of 3759.5 kWh. Figure 2(a) and (b) depicts the daily for two days and monthly electrical energy consumption.
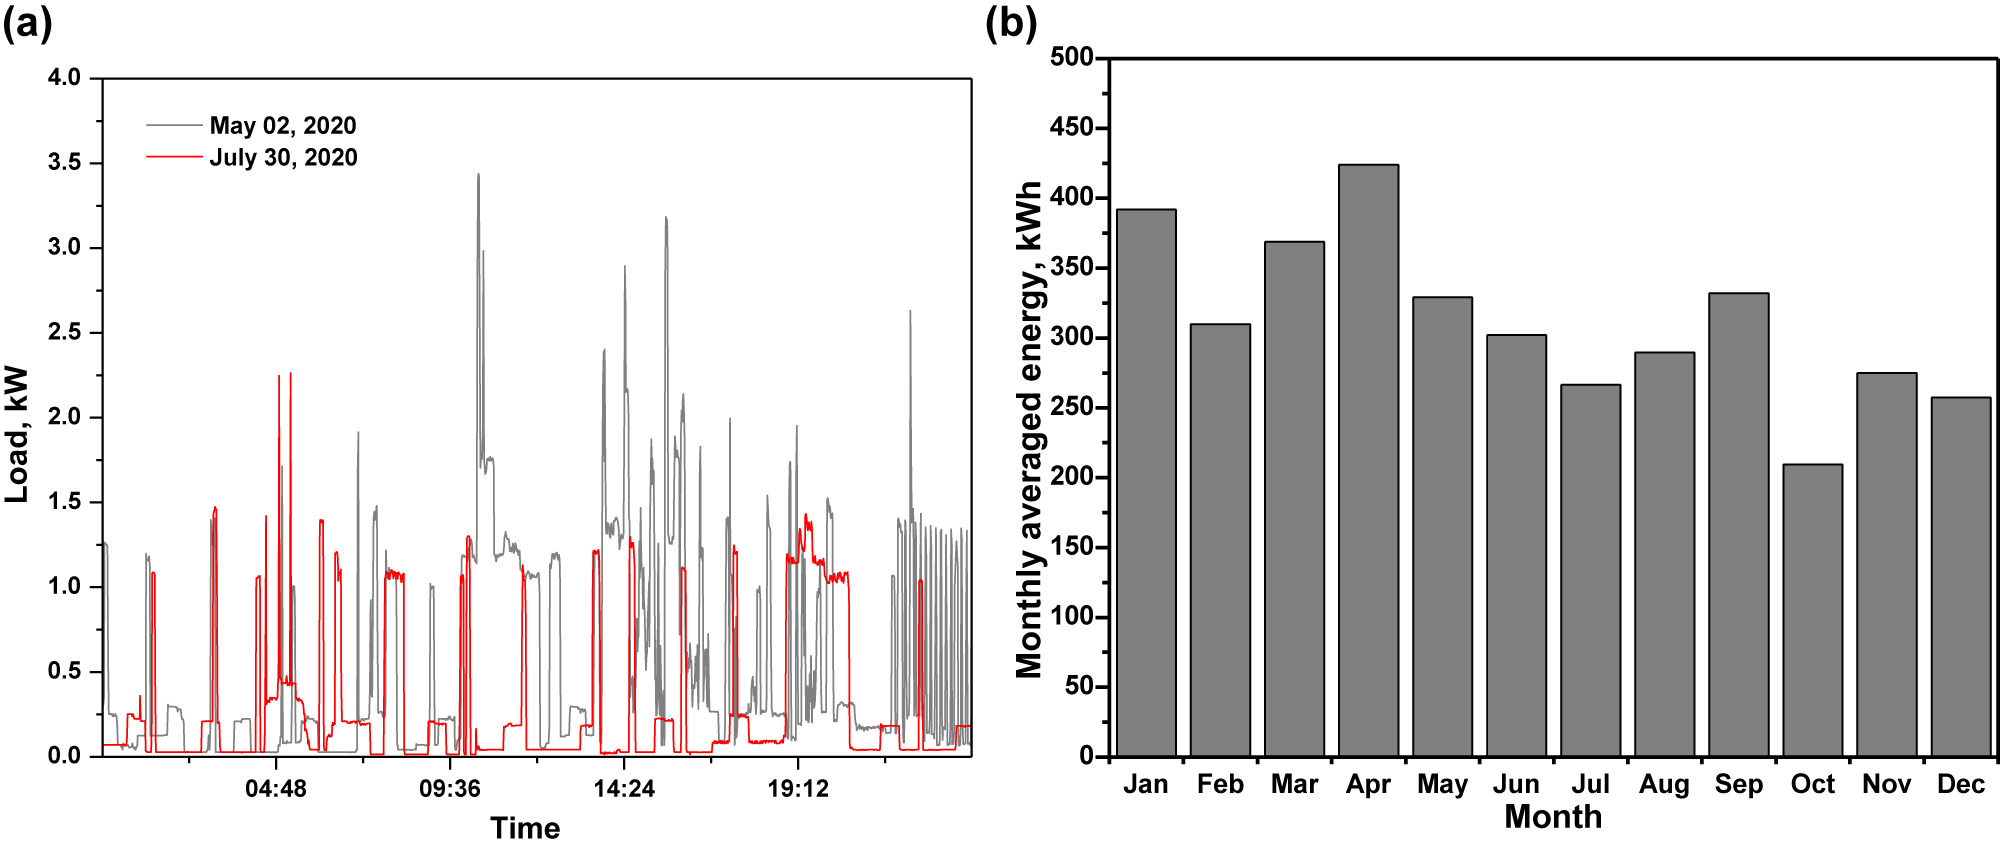
The experimental electrical load (a) for two selected days; (b) monthly energy consumption.
Solar radiation: Total solar irradiation was measured horizontally at the same location and during the same time period. The annual average horizontal plane daily irradiance was 4.6 kWh/m2/d, with the greatest monthly average in July at 6.29 kWh/m2/d and the lowest in December at 2.69 kWh/m2/d. Figure 3(a) and (b) illustrates the average daily and monthly irradiance for selected days.
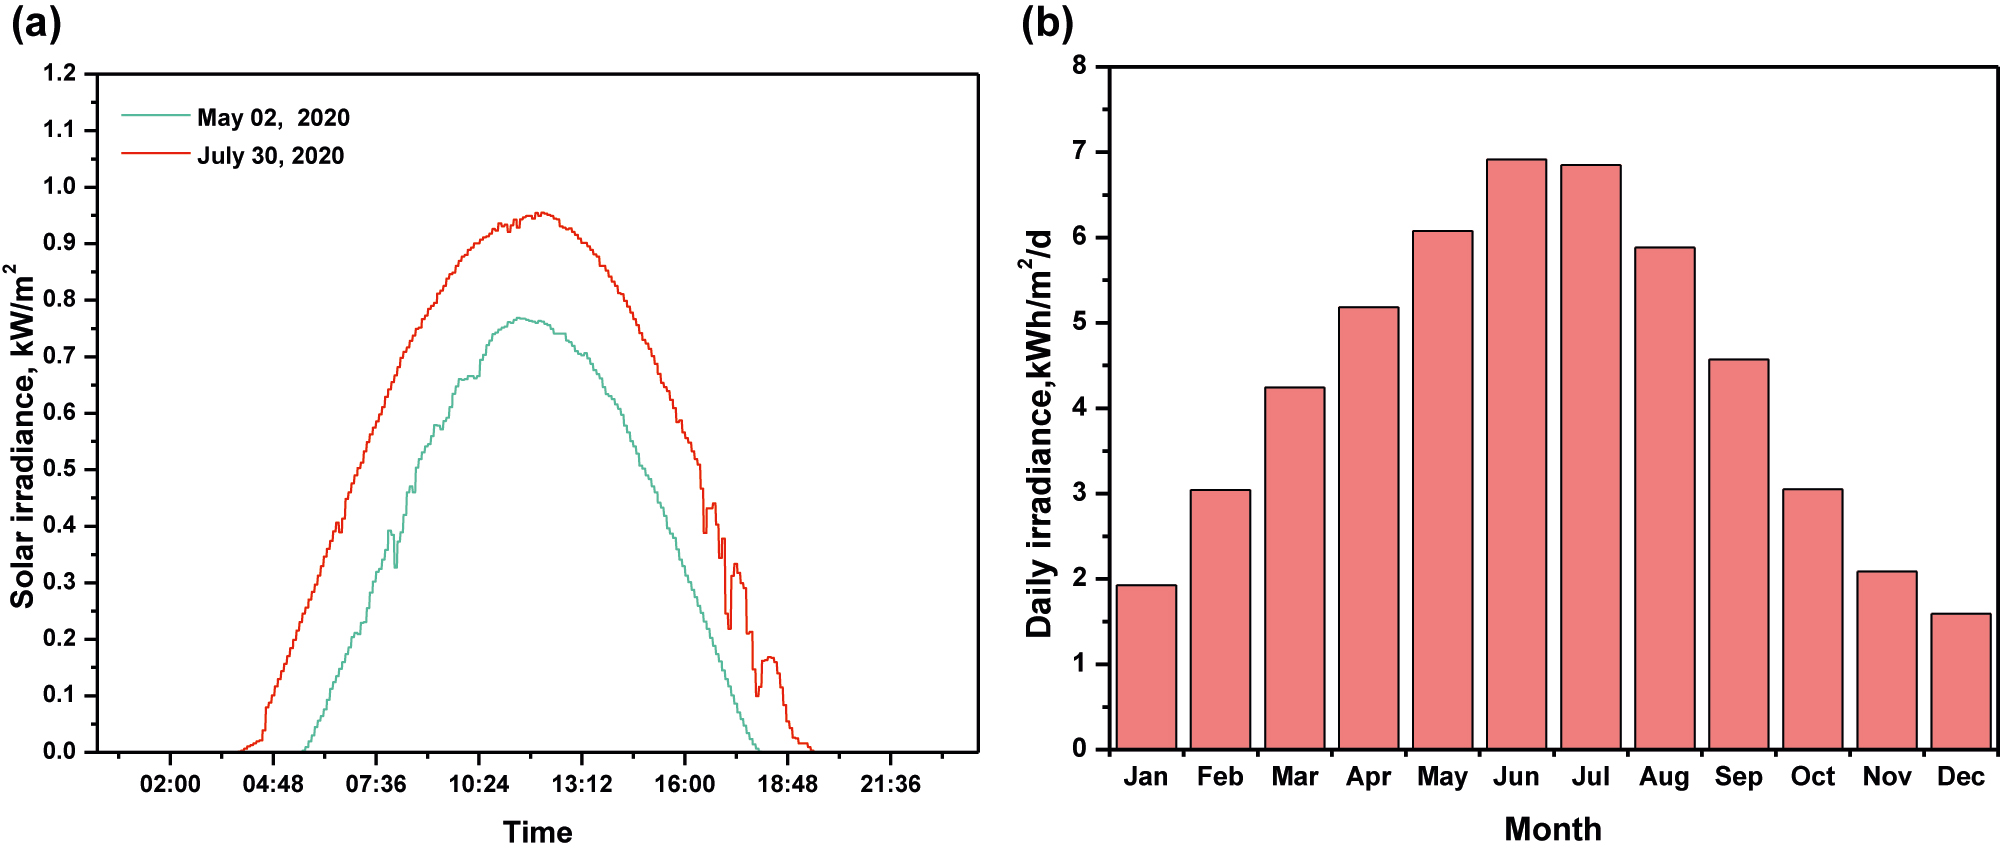
Solar irradiance for (a) selected days; (b) monthly daily averaged irradiance.
Governing equations
To achieve continuous power supply dependability, the system was outfitted with a source of extra hydrogen that is utilized by the fuel cell when the hydrogen generated by the electrolyzer is inadequate. The energy analysis was conducted on the basis of the following equations (Abdulateef et al. 2021; Hassan et al. 2021; Jaszczur et al. 2018c):
where PL, ELL, PPV, PFC, and PG are the power of load demand, electrolyzer, generated by the PV array, FC load demand and taken from the grid (in kW), respectively.
The power production from a PV system is dependent on the number of PV modules, solar irradiance, module working temperature, and instantaneous PV module efficiency value. On the basis of the interdependence written as follows, it could be evaluated (Hassan et al. 2019; Jaszczur et al. 2020):
where HT, HT,STC, PVC, PVη, αP,TC, TC,STC is the irradiance, irradiance at standard conditions (STC) is the array capacity, array derating factor, moduel cell temperature power coefficient, module cell temperature, and module cell temperature at STC, respectively.
This research examines the influence of photovoltaic cell temperatures on the array’s rated power in order to account for an effect that reduces modeling inaccuracy. The temperatures of a photovoltaic module can be computed as follows (Jaszczur et al. 2021; Jaszczur, Hassan, and Palej 2019a):
where Ta,t is the environmental temperature, and k is the coefficient of Ross taken (0.0312 km2/W).
The FC power output can be expressed as (Jaszczur, Hassan, and Palej 2019b; Hassan, Jaszczur, and Abdulateef 2016):
where VFC is the cell voltage, IFC is the cell current, and τ is the cells number.
The distribution of electricity flow for the grid-connected PV/FC system can be defined as:
Energy metric
The self-consumption (SC) and self-sufficiency (SS) of energy are defined for a PV/FC equipped with the grid as the system electricity being consumed locally to meet the anticipated electrical demand. The set of equations were used to calculate energy metric values (in kWh) (Ceran et al. 2021; Luthander et al. 2015):
where EPV, EFC, EL, and n are the PV array energy, FC energy, electrical energy consumption, and the number of simulation iterations, respectively.
The percentages of self-consumption and self-sufficiency in the present study are summarized as below (Jaszczur, Hassan, and Teneta 2018a):
where EFed to grid is the energy delivered to the grid (kWh) and EFrom grid is the energy taken from the grid (kWh).
The renewable energy fraction Rf is computed total energy output from renewable sources divided by total yearly energy usage as follows (Jaszczur, Hassan, and Teneta 2018b; Rodrigo et al. 2020):
where Eren and Etot represents the overall yearly renewable energy output and the total home energy consumption.
Results and discussion
The paper analyzed a PV array with a capacity of 3.6 kWp connected to the grid in combination with various fuel cell capacities to determine the optimal fuel cell capacity for achieving maximum self-sufficiency. The PV array is positioned at the optimal tilt angle for the specified location (tilt angle β = 30°, azimuth angle γ = 0°, facing south). A big fuel cell capacity has no direct influence on the load utilization of renewable energy. The electrolyzer was designed to solely receive energy from the Solar System for H2 production, and the fuel cell was designed to fulfill the needed demand without exporting power to the grid. However, by storing renewable energy for later use, such as after sunset, it reduces the amount of energy supplied to the grid. The outcomes were thoroughly described and divided into two sub-sections (daily and annual) as shown below:
Daily energy flow
Figure 4(a)–(d) shows the daily energy values for different fuel cell capacities for the selected day (May 02, 2020) (0, 1, 2, and 2.5 kW, respectively). The PV system has a capacity of 3.6 kWp when paired with fuel cell units ranging from 1 to 6 (0.5 kW/unit). The total power usage for the day is 12.84 kWh, while the Solar System produces roughly 14.22 kWh of renewable energy. During the day, the PV system provides roughly 54% of the peak electricity demand, with the rest coming from the grid and fuel cell (depending on the fuel cell capacity).

Daily power flow for May 02, 2020 at several fuel cell capacity: (0, 1, 2 and 2.5) kW in (a, b, c, and d) respectively.
Self-consumption and self-sufficiency on the specified day of May 02, 2020, at different fuel cell capacities are shown in Figure 5(a)–(d). As a consequence, the energy self-consumption grew from 7.29 kWh without fuel cell to 13.6 kWh with 2.5 kW fuel cell capacity, corresponding to a 51.3% increase from the case without fuel cell to 98.6% for 2.5 kW fuel cell (see Figure 6(a) and (b)). Figure 5(c) and (d) shows that the self-sufficiency grew from 7.15 kWh in the absence of fuel cell to 12.64 kWh in the presence of 2.5 kW fuel cell, and that the recount increased from 55.86% in the absence of fuel cell to 98.31% in the presence of 2.5 kW fuel cell (d).

Self-consumption and self-sufficiency for May 02, 2020 at several fuel cell capacity: SC energy (a), SC percentage (b), SS energy (c), SS percentage (d).

Daily power flow for July 30, 2020 at several fuel cell capacity: (0, 1, 2 and 2.5) kW in (a, b, c, and d) respectively.
The daily energy distribution for the day of 30 July 2020, is shown in Figure 6(a)–(d) for varied fuel cell capacities of 0, 1, 2, and 2.5 kW. The PV system has a capacity of 3.6 kWp when paired with fuel cell units ranging from 0 to 6 (0.5 kW/unit). On the indicated day, electrical energy consumption was 6.64 kWh, while renewable energy generated by the PV system was around 16.98 kWh. The Solar System provides around 68% of the daytime load high peaks, with the remaining energy coming from the grid and fuel cell (depending on the fuel cell/HT state of charge).
Figure 7(a)–(d) shows the self-consumption and self-sufficiency for the chosen day of July 30, 2020, at different fuel cell capacities. The self-consumption grew from 2.67 kWh without fuel cell to 6.76 kWh with 2.5 kW fuel cell, and the self-consumption percentage grew from 15.76 to 99.55%. Figure 7(c) and (d) shows that the self-sufficiency grew from 2.62 kWh without fuel cell to 6.34 kWh at 2.5 kW fuel cell capacity, while the self-sufficiency percentage increased from 39.48% without fuel cell to 95.45% at 2.5 kW fuel cell.

Self-consumption and self-sufficiency for July 30, 2020 at several fuel cell capacity: SC energy (a), SC percentage (b), SS energy (c), SS percentage (d).
Yearly energy flow
The PV system generates 4026.93 kWh of electricity per year. This energy is utilized to power the necessary demand, then sent to the electrolyzer to make hydrogen, and finally delivered to the grid as a surplus. Figure 8(a) and (b) illustrates the overall energy consumption and the energy produced by fuel cell, respectively. The largest yearly energy provided by fuel cell for feeding the electrical demand is about 1982 kWh, which is around 30% of the required load. Figure 8(c) depicts yearly hydrogen production by electrolyzer from a Solar System. With an operational reserve of 6% from the hydrogen necessary to feed the fuel cell, the maximum reported output is 70 kg/year. The yearly fuel cell operating hours are shown in Figure 8(d). With increasing fuel cell capacity, this parameter declined, with the greatest value of about 4228 h at 0.5 kW fuel cell and the lowest value of roughly 2007 h at 3 kW.

Annual fuel cell energy, percentage, consumption of hydrogen, hours of fuel cell operation (a, b, c, and d), respectively.
Energy self-consumption improved from 2581.6 kWh at 0.5 kW fuel cell to 3338.2 kWh at 2.5 kW fuel cell capacity, resulting in an increase in self-sufficiency from 33.03% for the system without fuel cell to 98.4% for the system with 2.5 kW fuel cell. Figure 9(c) and (d) shows that energy self-sufficiency grew from 2494.7 kWh at 0.5 kW fuel cell to 3218.8 kWh at 2.5 kW fuel cell, equal to a 34.7% rise in self-sufficiency for the situation without fuel cell to 58.7% for 2.5 kW fuel cell capacity.
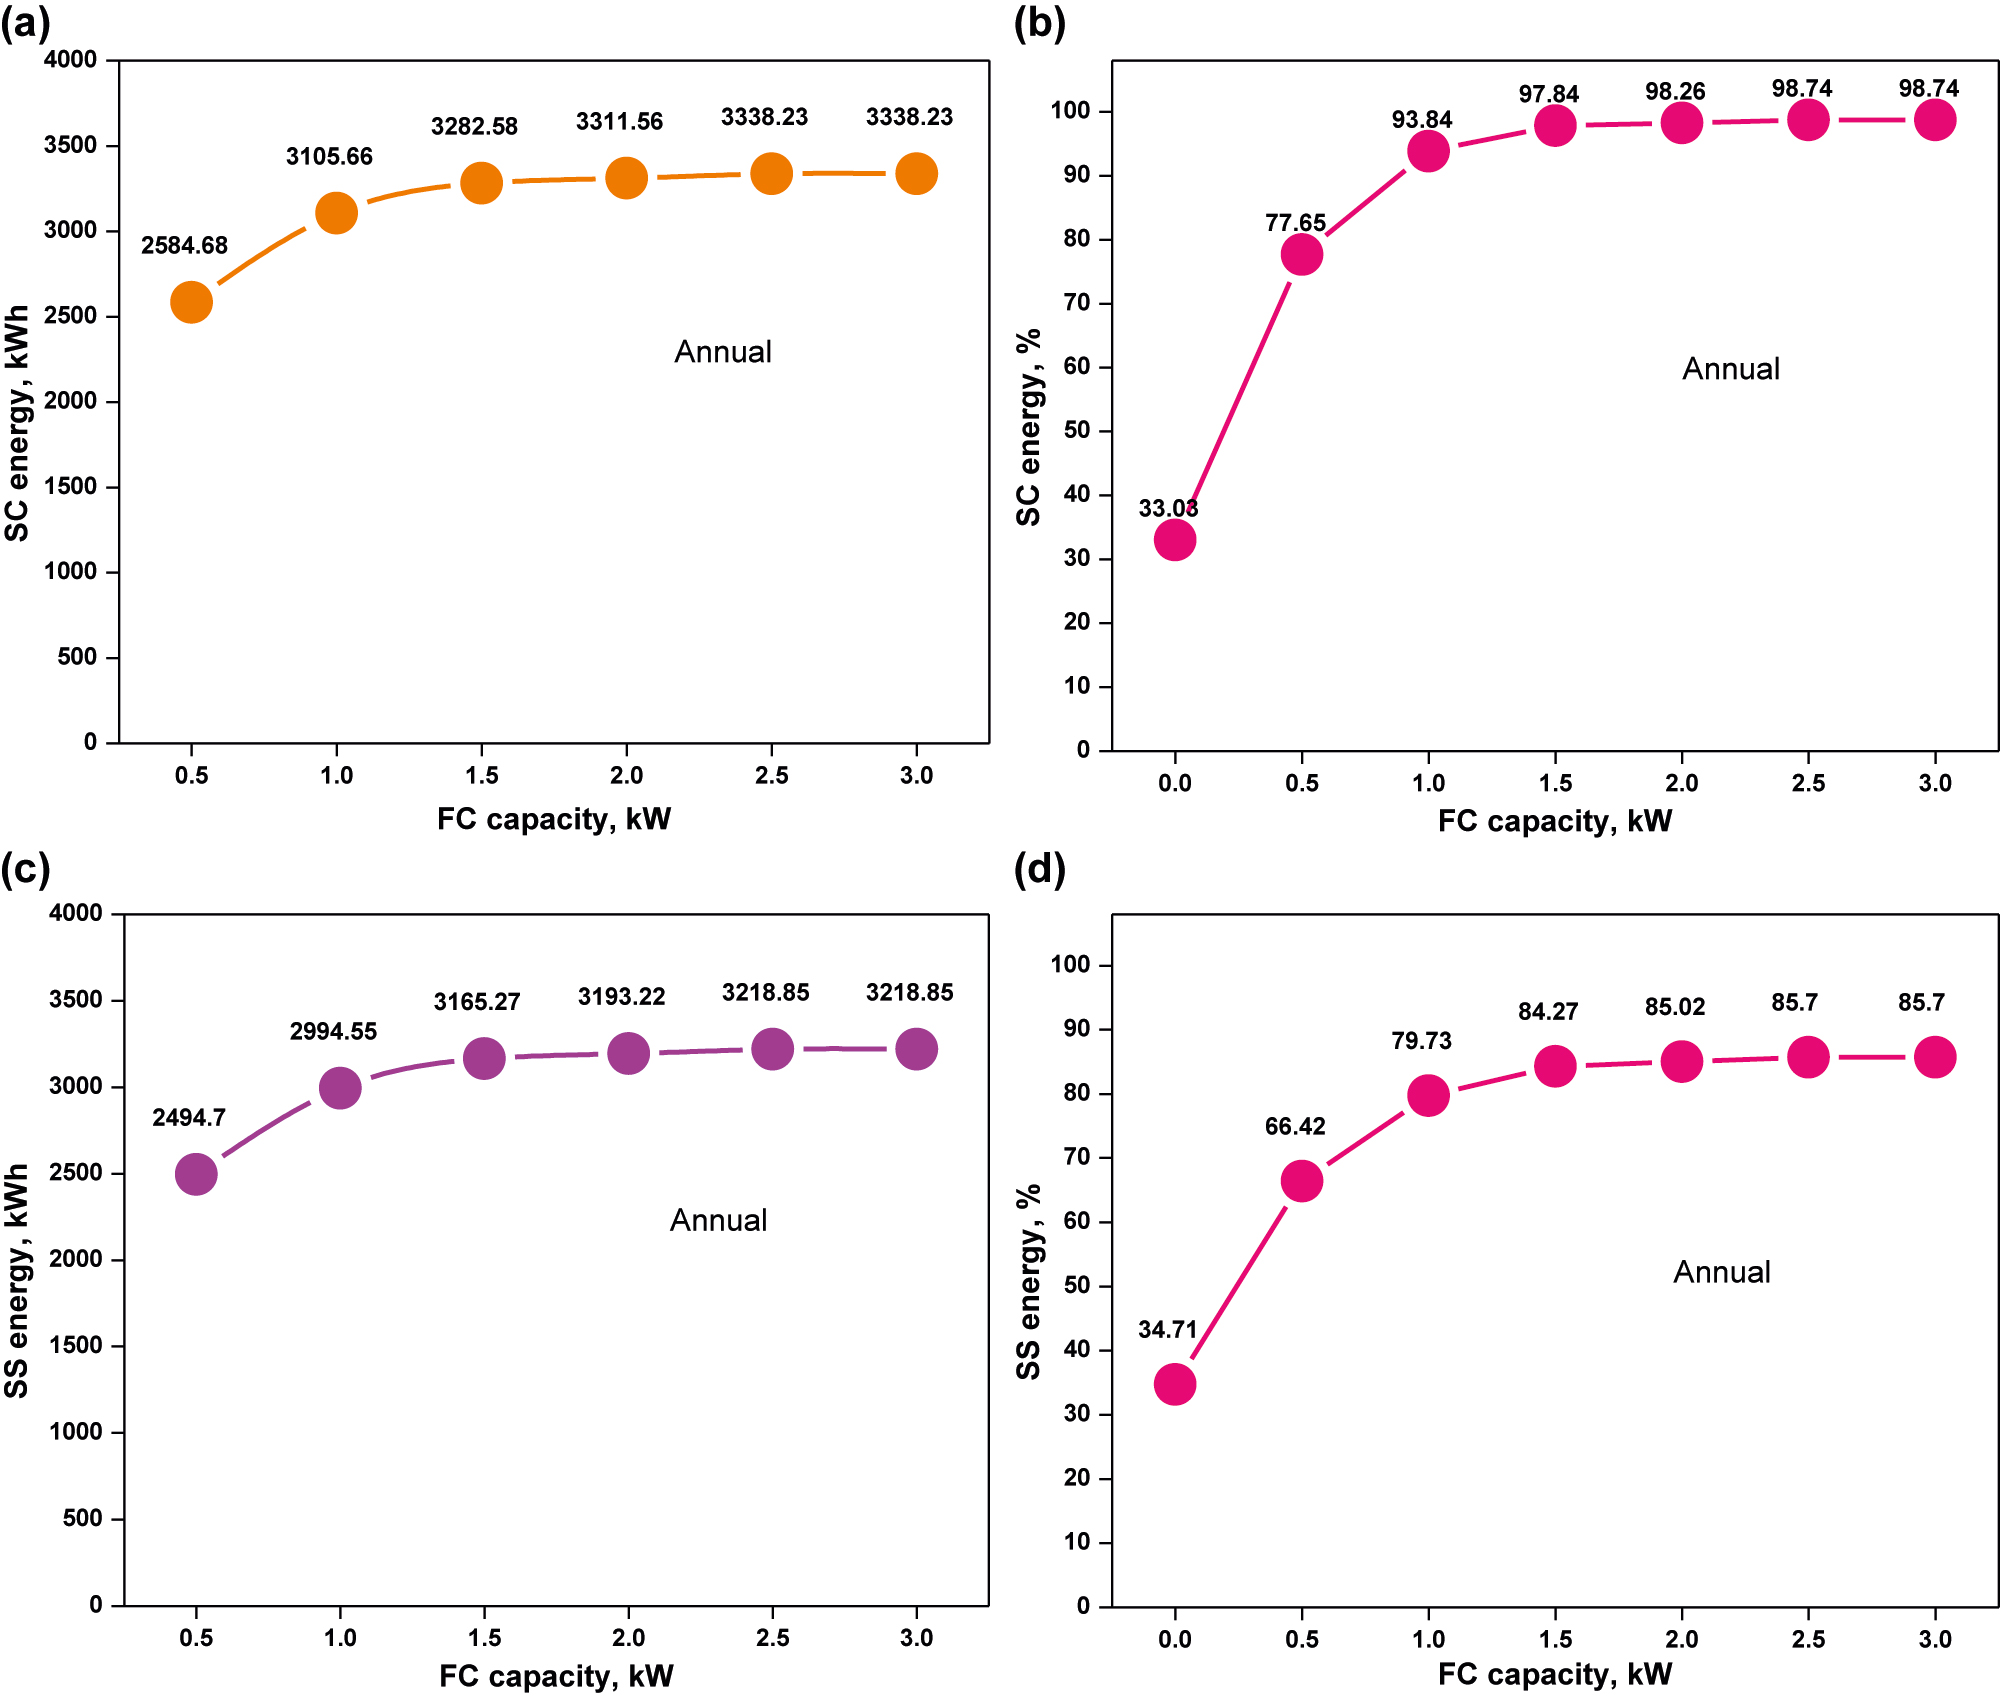
Annual self-consumption and self-sufficiency at several fuel cell capacity: SC energy (a), SC percentage (b), SS energy (c), SS percentage (d).
The yearly renewable fraction is shown in Figure 10. This result indicates that the maximum yearly renewable energy proportion for 2.5 kW fuel cell is about 0.918. The best observed fuel cell capacity is 2.5 kW, which may be paired with 3.6 kWp PV to meet the greatest annual self-consumption and self-sufficiency as well as sustainable fraction to feed 3755 kWh of yearly energy demand.

The annual renewable fraction at different fuel cell capacities.
Conclusions
This work proposes a model for the optimum dispatch of fuel cell capacity in combination with PV arrays to operate in a self-consumption regime, which has been highlighted as a viable strategy to minimize grid-sourced energy consumption. In particular, the method can be used to accurately calculate facility dispatch and use it as an input in prefeasibility processes, to best estimate the size of the facility for a given site, or to effectively organize the processes of hydrogen facilities in operation in order to maximize profits. The model takes into account the predictability of fuel cell production and home energy in time periods ranging from a few hours to many days, which is plausible given the capabilities of existing forecasting instruments. In addition, the proposed model takes into account the dynamics of electrolysis systems and the potential of including environmental limitations to guarantee that solar irradiance and hydrogen are utilized to create renewable energy. The outputs of the performance of the dispatched model include optimum parameters of operational states of the fuel cell and electrolyzer, the load factor in production, and the energy imported and exported to the electrical grid for each hour in the given time.
The research indicates that the usage of a fuel cell supplied by H2 produced with an electrolyzer driven only by sustainable energy produced by a PV array could greatly boost both self-consumption and self-sufficiency. The yearly data demonstrates that using a fuel cell with a capacity of 2.5 kW could create 1985 kWh per year and raise the renewable fraction from 0.622 for the system without FC/HT to 0.918 for the system with a fuel cell of 2.5 kW. Self-consumption of energy went from 33.03 to 98.7% at the same time that self-sufficiency of energy went from 34.7 to 85.7%.
Winter days need, on average, more imported energy than spring/autumn days, which require more imports than summer days. This outcome may be tainted, however, if ecological limitations are not followed and prices justify the importation of additional energy during months with greater solar radiation. Depending on the season, the need for energy imports often decreases substantially. If energy imports are to be avoided, the designer of such a system must take into consideration seasonal fluctuations in addition to the average radiation profiles when designing the hydrogen storage after the electrolyzer. Also, it has been found that the demand for H2 by fuel cell is the main reason the electrolysis system needs to be powered by imported energy. However, the higher the demand, the more money the plant makes.
In conclusion, the optimum model developed under this research is used for the running of PV/FC facilities operating in a self-consumption regime. This model, when coupled with weather forecasting for predicting renewable energy production, can provide a useful decision support tool for operating H2 production facilities.
-
Author contributions: All the authors have accepted responsibility for the entire content of this submitted manuscript and approved submission.
-
Research funding: None declared.
-
Conflict of interest statement: The authors declare no conflicts of interest regarding this article.
References
Abdulateef, A. M., M. Jaszczur, Q. Hassan, R. Anish, H. Niyas, K. Sopian, and J. Abdulateef. 2021. “Enhancing the Melting of Phase Change Material Using a Fins–Nanoparticle Combination in a Triplex Tube Heat Exchanger.” Journal of Energy Storage 35: 102227. https://doi.org/10.1016/j.est.2020.102227.Search in Google Scholar
Babatunde, O. M., J. L. Munda, and Y. Hamam. 2022. “Hybridized Off-Grid Fuel Cell/Wind/Solar PV/Battery for Energy Generation in a Small Household: A Multi-Criteria Perspective.” International Journal of Hydrogen Energy 47 (10): 6437–52. https://doi.org/10.1016/j.ijhydene.2021.12.018.Search in Google Scholar
Budak, Y., and Y. Devrim. 2019. “Comparative Study of PV/PEM Fuel Cell Hybrid Energy System Based on Methanol and Water Electrolysis.” Energy Conversion and Management 179: 46–57. https://doi.org/10.1016/j.enconman.2018.10.053.Search in Google Scholar
Castillo-Cagigal, M., E. Caamaño-Martín, E. Matallanas, D. Masa-Bote, Á. Gutiérrez, F. Monasterio-Huelin, and J. Jiménez-Leube. 2011. “PV Self-Consumption Optimization with Storage and Active DSM for the Residential Sector.” Solar Energy 85 (9): 2338–48. https://doi.org/10.1016/j.solener.2011.06.028.Search in Google Scholar
Ceran, B., A. Mielcarek, Q. Hassan, J. Teneta, and M. Jaszczur. 2021. “Aging Effects on Modelling and Operation of a Photovoltaic System with Hydrogen Storage.” Applied Energy 297: 117161. https://doi.org/10.1016/j.apenergy.2021.117161.Search in Google Scholar
Ceylan, C., and Y. Devrim. 2021. “Design and Simulation of the PV/PEM Fuel Cell Based Hybrid Energy System Using MATLAB/Simulink for Greenhouse Application.” International Journal of Hydrogen Energy 46 (42): 22092–106. https://doi.org/10.1016/j.ijhydene.2021.04.034.Search in Google Scholar
Choukai, O., C. El Mokhi, A. Hamed, and A. A. Errouhi. 2022. “Feasibility Study of a Self-Consumption Photovoltaic Installation with and without Battery Storage, Optimization of Night Lighting and Introduction to the Application of the DALI Protocol at the University of Ibn Tofail (ENSA/ENCG), Kenitra–Morocco.” Energy Harvesting and Systems, https://doi.org/10.1515/ehs-2021-0080.Search in Google Scholar
D’Adamo, I., M. Gastaldi, and P. Morone. 2022. “Solar Collective Self-Consumption: Economic Analysis of a Policy Mix.” Ecological Economics 199: 107480.10.1016/j.ecolecon.2022.107480Search in Google Scholar
Electrolyzer Type Greemblue 1 kW. Available at https://www.geemblue.com/ (accessed September 01, 2021).Search in Google Scholar
Fuel Cell Type Aerostak A-500. Available at https://www.fuelcellstore.com/ (accessed September 01, 2021).Search in Google Scholar
Hassan, Q., M. K. Abbas, A. M. Abdulateef, J. Abulateef, and A. Mohamad. 2021. “Assessment the Potential Solar Energy with the Models for Optimum Tilt Angles of Maximum Solar Irradiance for Iraq.” Case Studies in Chemical and Environmental Engineering 4: 100140. https://doi.org/10.1016/j.cscee.2021.100140.Search in Google Scholar
Hassan, Q., M. Jaszczur, and J. Abdulateef. 2016. “Optimization of PV/Wind/Diesel Hybrid Power System in Homer for Rural Electrification.” Journal of Physics: Conference Series. 745 (3): 032006. https://doi.org/10.1088/1742-6596/745/3/032006.Search in Google Scholar
Hassan, Q., M. Jaszczur, M. S. Juste, and R. Hanus. 2019. “Predicting the Amount of Energy Generated by a Wind Turbine Based on the Weather Data.” IOP Conference Series: Earth and Environmental Science. 214 (1): 012113. https://doi.org/10.1088/1755-1315/214/1/012113.Search in Google Scholar
Hydrogen Tank Doosan 1kW. Available at http://www.doosanmobility.com/ (accessed September 01, 2021).Search in Google Scholar
Jaszczur, M., Q. Hassan, A. M. Abdulateef, and J. Abdulateef. 2021. “Assessing the Temporal Load Resolution Effect on the Photovoltaic Energy Flows and Self-Consumption.” Renewable Energy 169: 1077–90. https://doi.org/10.1016/j.renene.2021.01.076.Search in Google Scholar
Jaszczur, M., Q. Hassan, and P. Palej. 2019a. “An Optimisation of the Hybrid Renewable Energy Systems.” In E3S Web of Conferences, Vol. 113, 03022. EDP Sciences.10.1051/e3sconf/201911303022Search in Google Scholar
Jaszczur, M., Q. Hassan, P. Palej, and J. Abdulateef. 2020. “Multi-objective Optimisation of a Micro-grid Hybrid Power System for Household Application.” Energy 202: 117738. https://doi.org/10.1016/j.energy.2020.117738.Search in Google Scholar
Jaszczur, M., Q. Hassan, K. Styszko, and J. Teneta. 2019b. “Impact of Dust and Temperature on Energy Conversion Process in Photovoltaic Module.” Thermal Science 23 (Suppl. 4): 1199–210. https://doi.org/10.2298/tsci19s4199j.Search in Google Scholar
Jaszczur, M., Q. Hassan, and J. Teneta. 2018a. “Temporal Load Resolution Impact on PV/Grid System Energy Flows.” In MATEC Web of Conferences, Vol. 240, 04003. EDP Sciences. https://doi.org/10.1051/matecconf/201824004003.Search in Google Scholar
Jaszczur, M., Q. Hassan, J. Teneta, E. Majewska, and M. Zych. 2018b. “An Analysis of Temperature Distribution in Solar Photovoltaic Module under Various Environmental Conditions” In MATEC Web of Conferences, Vol. 240. EDP Sciences.10.1051/matecconf/201824004004Search in Google Scholar
Jaszczur, M., Q. Hassan, J. Teneta, K. Styszko, W. Nawrot, and R. Hanus. 2018c. “Study of Dust Deposition and Temperature Impact on Solar Photovoltaic Module.” In MATEC Web of Conferences, Vol. 240, 04005. EDP Sciences.10.1051/matecconf/201824004005Search in Google Scholar
Keiner, D., M. Ram, L. D. S. N. S. Barbosa, D. Bogdanov, and C. Breyer. 2019. “Cost Optimal Self-Consumption of PV Prosumers with Stationary Batteries, Heat Pumps, Thermal Energy Storage and Electric Vehicles across the World up to 2050.” Solar Energy 185: 406–23. https://doi.org/10.1016/j.solener.2019.04.081.Search in Google Scholar
Kühnbach, M., A. Bekk, and A. Weidlich. 2022. “Towards Improved Prosumer Participation: Electricity Trading in Local Markets.” Energy 239: 122445.10.1016/j.energy.2021.122445Search in Google Scholar
LONGI PV Modules. Available at https://en.longi-solar.com/ (accessed September 01, 2021).Search in Google Scholar
Luthander, R., J. Widén, D. Nilsson, and J. Palm. 2015. “Photovoltaic Self-Consumption in Buildings: A Review.” Applied Energy 142: 80–94. https://doi.org/10.1016/j.apenergy.2014.12.028.Search in Google Scholar
Mustika, A. D., R. Rigo-Mariani, V. Debusschere, and A. Pachurka. 2022. “A Two-Stage Management Strategy for the Optimal Operation and Billing in an Energy Community with Collective Self-Consumption.” Applied Energy 310: 118484. https://doi.org/10.1016/j.apenergy.2021.118484.Search in Google Scholar
McKenna, E., J. Pless, and S. J. Darby. 2018. “Solar Photovoltaic Self-Consumption in the UK Residential Sector: New Estimates from a Smart Grid Demonstration Project.” Energy Policy 118: 482–91. https://doi.org/10.1016/j.enpol.2018.04.006.Search in Google Scholar
Mateo, C., R. Cossent, T. Gómez, G. Prettico, P. Frías, G. Fulli, A. Meletiou, and F. Postigo. 2018. “Impact of Solar PV Self-Consumption Policies on Distribution Networks and Regulatory Implications.” Solar Energy 176: 62–72. https://doi.org/10.1016/j.solener.2018.10.015.Search in Google Scholar
Martín-Chivelet, N., and D. Montero-Gómez. 2017. “Optimizing Photovoltaic Self-Consumption in Office Buildings.” Energy and Buildings 150: 71–80.10.1016/j.enbuild.2017.05.073Search in Google Scholar
Nyholm, E., J. Goop, M. Odenberger, and F. Johnsson. 2016. “Solar Photovoltaic-Battery Systems in Swedish Households – Self-Consumption and Self-Sufficiency.” Applied Energy 183: 148–59. https://doi.org/10.1016/j.apenergy.2016.08.172.Search in Google Scholar
Rodrigo, P. M., S. Gutiérrez, L. Micheli, E. F. Fernández, and F. M. Almonacid. 2020. “Optimum Cleaning Schedule of Photovoltaic Systems Based on Levelised Cost of Energy and Case Study in Central Mexico.” Solar Energy 209: 11–20. https://doi.org/10.1016/j.solener.2020.08.074.Search in Google Scholar
Salameh, T., M. A. Abdelkareem, A. G. Olabi, E. T. Sayed, M. Al-Chaderchi, and H. Rezk. 2021. “Integrated Standalone Hybrid Solar PV, Fuel Cell and Diesel Generator Power System for Battery or Supercapacitor Storage Systems in Khorfakkan, United Arab Emirates.” International Journal of Hydrogen Energy 46 (8): 6014–27. https://doi.org/10.1016/j.ijhydene.2020.08.153.Search in Google Scholar
Solar Inverter Type REVO. Available at https://www.soropower.com/ (accessed September 01, 2021).Search in Google Scholar
Tercan, S. M., O. Elma, E. Gokalp, and U. Cali. 2022. “An Expansion Planning Method for Extending Distributed Energy System Lifespan with Energy Storage Systems.” Energy Exploration & Exploitation 40 (2): 599–618. https://doi.org/10.1177/01445987211058304.Search in Google Scholar
Tongsopit, S., S. Junlakarn, W. Wibulpolprasert, A. Chaianong, P. Kokchang, and N. V. Hoang. 2019. “The Economics of Solar PV Self-Consumption in Thailand.” Renewable Energy 138: 395–408. https://doi.org/10.1016/j.renene.2019.01.087.Search in Google Scholar
Villar, C. H., D. Neves, and C. A. Silva. 2017. “Solar PV Self-Consumption: An Analysis of Influencing Indicators in the Portuguese Context.” Energy Strategy Reviews 18: 224–34. https://doi.org/10.1016/j.esr.2017.10.001.Search in Google Scholar
Yu, H. J. J. 2018. “A Prospective Economic Assessment of Residential PV Self-Consumption with Batteries and Its Systemic Effects: The French Case in 2030.” Energy Policy 113: 673–87. https://doi.org/10.1016/j.enpol.2017.11.005.Search in Google Scholar
Zarrilli, D., A. Giannitrapani, S. Paoletti, and A. Vicino. 2017. “Energy Storage Operation for Voltage Control in Distribution Networks: A Receding Horizon Approach.” IEEE Transactions on Control Systems Technology 26 (2): 599–609.10.1109/TCST.2017.2692719Search in Google Scholar
© 2022 Walter de Gruyter GmbH, Berlin/Boston
Articles in the same Issue
- Frontmatter
- Review
- A comprehensive review on electric vehicles: charging and control techniques, electric vehicle-grid integration
- Research Articles
- Evaluation of parameters influencing the performance of photovoltaic-thermoelectric (PV-TE) hybrid system
- Dispatchable power supply from beam down solar point concentrator coupled to thermal energy storage and a Stirling engine
- Modelling, design and parametric analysis of a levitation based energy harvester
- Performance optimization of flywheel using experimental design approach
- Assessment and optimization of photovoltaic systems at the University Ibn Tofail according to the new law on renewable energy in Morocco using HOMER Pro
- Optimizing hybrid power system at highest sustainability
- Preparation of Na2HPO4⋅12H2O-based composite PCM and its application in air insulated box
- The efficiency of linear electromagnetic vibration-based energy harvester at resistive, capacitive and inductive loads
- A numerical investigation of optimum angles for solar energy receivers in the eastern part of Algeria
- Experimental investigation of soiling effects on the photovoltaic modules energy generation
- Frequency domain analysis of a piezoelectric energy harvester with impedance matching network