
Insight into the Structural, Electrical, and Magnetic Properties of Al-Substituted BiFeO3 Synthesised by the Sol–Gel Method
-
Mukhtar Ahmad


Abstract
Multiferroics with chemical formula BiAlxFe1−xO3 (x = 0, 0.1, 0.2, and 0.3) and substituted by Al are synthesised using sol–gel auto-combustion. The materials are sintered at 500 °C for 5 h. In the ongoing study, the crystal structure of BiAlxFe1−xO3 was investigated by X-ray diffraction. After confirming the rhombohedral single-phase crystal structure, various characterisation techniques, such as scanning electron microscopy (SEM), energy-dispersive X-ray (EDX) spectroscopy, elemental mapping images, electrical properties, Fourier transform infrared spectroscopy, and vibrating sample magnetometry (VSM), were used to investigate the synthesised samples. The grain size estimated from SEM images decreased as Al contents increased. Elemental composition was confirmed by EDX spectra. Direct current electrical resistivity increased whereas drift mobility decreased with increasing Al contents. The VSM results of Al-doped BiFeO3 (BFO) demonstrate that BFO crystals with size >60 nm show anti-ferromagnetic behaviour, which is evident in the present study. The increase in Al doping results in an increase in coercivity, as grain size and coercivity are inversely related with each other. This is because of the replacement of Fe3+ by Al3+ ions, which weakens the sub-lattice interactions. It has been observed that BFO materials with such parameters are favourable for ferroelectric random access memories where data can be written electrically and read magnetically.
1 Introduction
The family of materials that yield ferroelectric, ferromagnetic, antiferromagnetic, and ferroelastic effects simultaneously in the same material are termed as multiferroics, as they possess different ferroic characteristics [1]. In these materials, magnetic and electric phase transitions are strong due to magnetoelectric effects. At low temperatures, multiferroics show multiferroicity in the form of a single phase, and in composite form, these materials exhibit magnetostrictive properties and piezoelectricity. Basically, there are two requirements for multiferroics. First is the coexistence of magnetic and electric dipoles. Second is the coupling between different order parameters and simultaneous violation of space and time inversion [2]. BiFeO3 (BFO) is promising in this regard due to coupling between ferroelectric and magnetic ordering at room temperature, leading to room temperature devices. BFO is a smart material due to its multiferroic properties, i.e. ferroelectricity with high Curie temperature (TC = 820–850 °C) [3], [4] and antiferromagnetic properties under Néel temperature (TN = 350–380 °C) [5], [6]. BFO shows antiferromagnetic G-type spin configuration [7]. Multiferroic materials have attracted great attention due to their potential applications in multifunctional devices [8], [9]. Since the discovery of BFO in 1960, bismuth ferrite powders have been prepared by the solid-state, mechano-chemical, solution chemistry, hydro-thermal, sono-chemical, and sol–gel methods [10]. These methods require high-temperature treatments at >800 °C [11]. To get nanosized samples avoiding bismuth volatilisation, low-temperature synthesis methods are being developed progressively. Among the various solution-based methods for synthesising BFO nanoparticles, we chose sol–gel auto-combustion due to easy control of chemical composition and relatively low sintering temperature, preventing bismuth volatilisation. Bismuth ferrite has a rhombohedral distorted perovskite structure with space group R3c and general chemical formula ABO3 [12]. BFO is considered a promising candidate for magnetic storage or in the applications of spintronic devices [13]. However, leakage current due to oxygen vacancies or impurities is the major problem in BFO [14]. The main reasons of leakage current in BFO are oxygen vacancies and Fe2+. Oxygen vacancies are due to Bi3+, and Fe3+ reduction is the cause of Fe2+. The aim of doping in BFO is to decrease leakage current [15]. The most studied room temperature BFO is doped with different ions to increase the electric, dielectric, and magnetic properties [16]. In BFO, A site cation is responsible for ferroelectricity and B site cation is responsible for magnetism. Both substitutions or even one substitution in BFO can enhance the electrical and magnetic properties for many purposes [17]. Magnetisation in BFO relies on the radius of doping cation at Bi site. Co doping of Ca2+ and Ba2+ alkaline earth metals affects the characteristics of BFO nanoparticles [18]. Rana and Singh studied pure and Ni-substituted ZnO nanoparticles for magnetic and optical properties. Scanning electron microscopy (SEM) images revealed the spherical nanocrystalline structure of the prepared nanoparticles. Optical properties with Ni substitution resulted in blue shift in absorption edge contrary to intrinsic ZnO nanoparticles. Antibacterial activity was enhanced with Ni substitution and sunlight exposure from 40 to 45 μg [19]. Rana et al. and Singh et al. studied the effect of Co doping on ZnO and Fe–ZnO nanoparticles. Co doping changed the diamagnetic behaviour of prepared ZnO nanoparticles into ferromagnetic behaviour. Co-doped ZnO nanoparticles resulted in enhanced antimicrobial activity. Saturation magnetisation increased with Co doping in case of Fe–ZnO nanoparticles [20], [21].
In previous studies, Al3+ substitution resulted in increased electrical resistivity, hence decreasing the saturation magnetisation and dielectric losses. These developments can be beneficial to enhance the microwave-absorbing properties of ferrite materials [22], [23]. Moreover, Al3+ ion substitution prevents grain growth and enhances the mechanical strength of the prepared ferrites. Therefore, it seemed reasonable to investigate Al-substituted BFO at Fe3+ sites synthesised by using the sol–gel (auto-combustion) method in order to alter the different electrical and magnetic properties to use them for different technological and high-frequency applications where low eddy current losses are desired.
2 Experimental
2.1 Sample Preparation
Nanocrystalline powders of BiAlxFe1−xO3 (x = 0.0, 0.1, 0.2, and 0.3) were synthesised by using the sol–gel (auto-combustion) method. First, the solution was prepared by dissolving analytical grade Bi(NO3)3 ⋅ 5H2O, Fe(NO3)3 ⋅ 9H2O, Al(NO3)3 ⋅ 9H2O, and C6H8O7 ⋅ H2O in deionised water according to the stoichiometric ratios. Citric acid was used as a chelating or igniting agent. The ratio of citric acid to metal nitrates was set as 1:1. Thereafter, the solution was placed on a hot plate magnetic stirrer while being heated at about 70–80 °C and continuously stirred by the magnetic stirrer until the solution was transformed into a dried gel. When the solution in beaker was left almost 100 mL, then ammonium hydro-oxide was added drop by drop in the mixture to maintain its pH neutral. After 8–10 h, the dried gel was ignited and converted into fluffy powder. As a result, a feathery nanoferrite powder is obtained by blazing the gel through a self-burning process. The synthesised powder is placed into drying oven at 120 °C for 24 h. After synthesising, the materials were crushed for 10 min by use of agate mortar and pestle. The crushed powder was placed into furnace by adjusting its temperate to 500 °C for at least 5 h to sinter the materials. In sintering, the atoms are diffused across the particle boundaries, in order to increase the crystallinity. Thereafter, the material was ready for characterisation.
2.2 Characterisation Techniques
The purposed phase of these ferrites was confirmed using a Bruker axis D8 diffractometer with Cu–Kα (λ = 1.54 Ả) radiation while operating at 40 kV and 30 mA in the 2θ range of 15–80°. The scan step was 0.2°/s during these measurements. The microstructure and grain size was estimated by a field emission scanning electron microscope (Philips XL30SFEG). In addition, the elemental composition of some representative samples was also evaluated using energy-dispersive X-ray (EDX) spectrometry. Room temperature direct current (DC) electrical resistivity was measured using a two-point probe method after converting the powder in round-shaped pellets. Fourier transform infrared (FTIR) analysis was carried out using Shimadzu 8400S IR spectrometer by the KBr pellet method. The room temperature magnetic properties were measured using a vibrating sample magnetometer (LakeShore M-7407).
3 Results and Discussion
3.1 Structural Analysis
Figure 1 shows the X-ray diffraction (XRD) patterns of BiAlxFe1−xO3 (x = 0.0, 0.1, 0.2, and 0.3) samples prepared using sol–gel (auto-combustion). These patterns were compared with the standard patterns of the same compound having Joint Committee on Powder Diffraction Standards card no. 01-086-1518. It can be seen from these patterns that all samples exhibited a single-phase rhombohedral crystal structure and that there was no extra peak of any impurity phase. This confirms that Al has been successfully substituted in the BFO lattice.
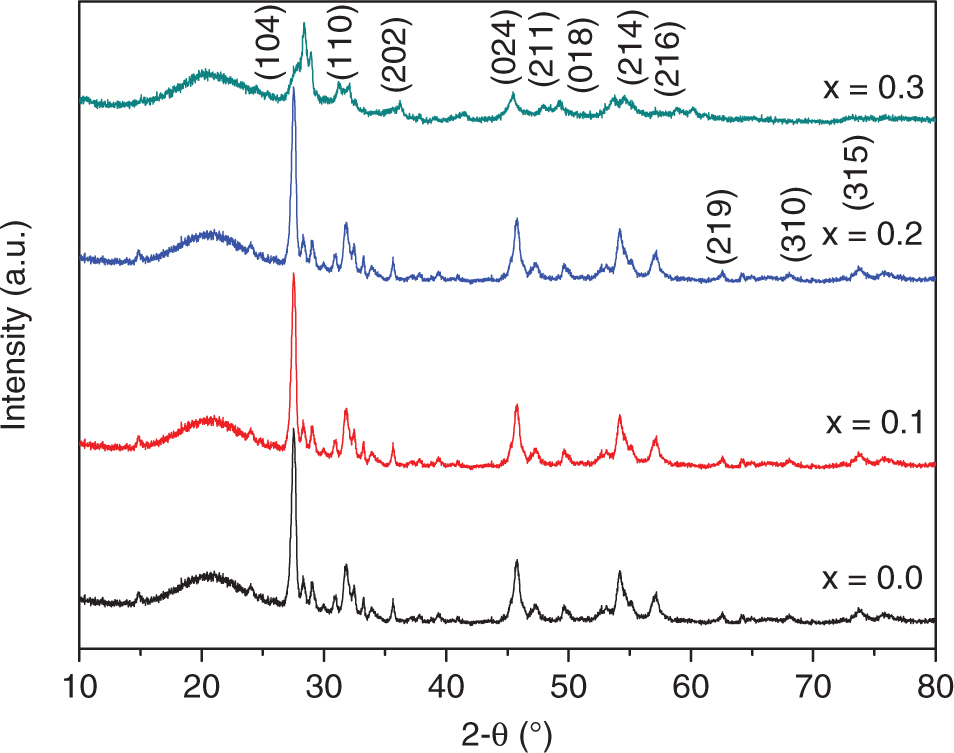
XRD patterns of Al-substituted BiAlxFe1−xO3 (x = 0.0, 0.1, 0.2, and 0.3) samples.
The lattice constants (a and c) were calculated for all samples by using the given formula and are listed in Table 1.
Variation of structural parameters (a, c, V, and Dx) as a function of Al substitution.
| X | a (Å) | c (Å) | V (Å)3 | Dx (g/cm3) |
|---|---|---|---|---|
| 0.0 | 5.597 | 13.986 | 483.131 | 6.46 |
| 0.10 | 5.517 | 13.901 | 423.108 | 7.30 |
| 0.20 | 5.521 | 13.887 | 423.295 | 7.22 |
| 0.30 | 5.501 | 13.904 | 420.748 | 7.20 |
It is seen that the values of lattice constants were smaller for Al-substituted samples in comparison with the unsubstituted samples and unit cell volume (V) decreased with increasing Al contents in the BFO lattice.
This can be explained on the basis of the dissimilarity in ionic radii of Fe3+ and Al3+. In this case of BiAlxFe1−xO3 (x = 0.0, 0.1, 0.2, and 0.3), bigger Fe3+ (0.67 Å) ions are replaced by lesser Al3+ (0.51 Å); hence, a reduction in lattice constants and unit cell volume is expected [24]. The volume of unit cell and X-ray density were calculated by the following formulae [2]:
where M is molar mass, Z is number of formula units in a unit cell, V is volume of unit cell, and NA is Avogadro’s number. The value of Z is equal to 6 because of the R3c space group [3]. Commonly, the crystallite size decreases with enlarging substituents with smaller ionic radii because of mismatch in the size of host and doping cation, leading to local structure disorder [25] and alteration of structural parameters such as a, c, and V. Furthermore, the value of the X-ray density of Al-substituted samples was in the range of 7.30–7.20 g/cm3, which is in good agreement with the previous reported values for the same structure [26].
3.2 Grain Size and Morphology
Figure 2 shows the SEM images of clean and Al-doped BFO samples. It can be seen that the grain size decreased with increase in Al doping. This is because of the formation of aluminium oxides at the given boundaries, which stopped grain growth [27]. The surface structure of the samples was dense and non-uniform. Samples had little grain and grain borders, whereas with doped Al, diffuse grain boundaries were observed. Furthermore, the grain size of doped samples was decreased (Tab. 2) with substitution of Al [28]. The decrease in the grain size may be recognised to the covered up oxygen vacancy as a result of doping, that is oxygen vacancies moving during the sintering procedure, which facilitate grain growth [29]. In addition, it has been discussed in XRD analysis that Al doping causes the shrinkage of the unit cell, and it has been reported earlier that shrinkage in unit cell is directly related to the grain size [30].
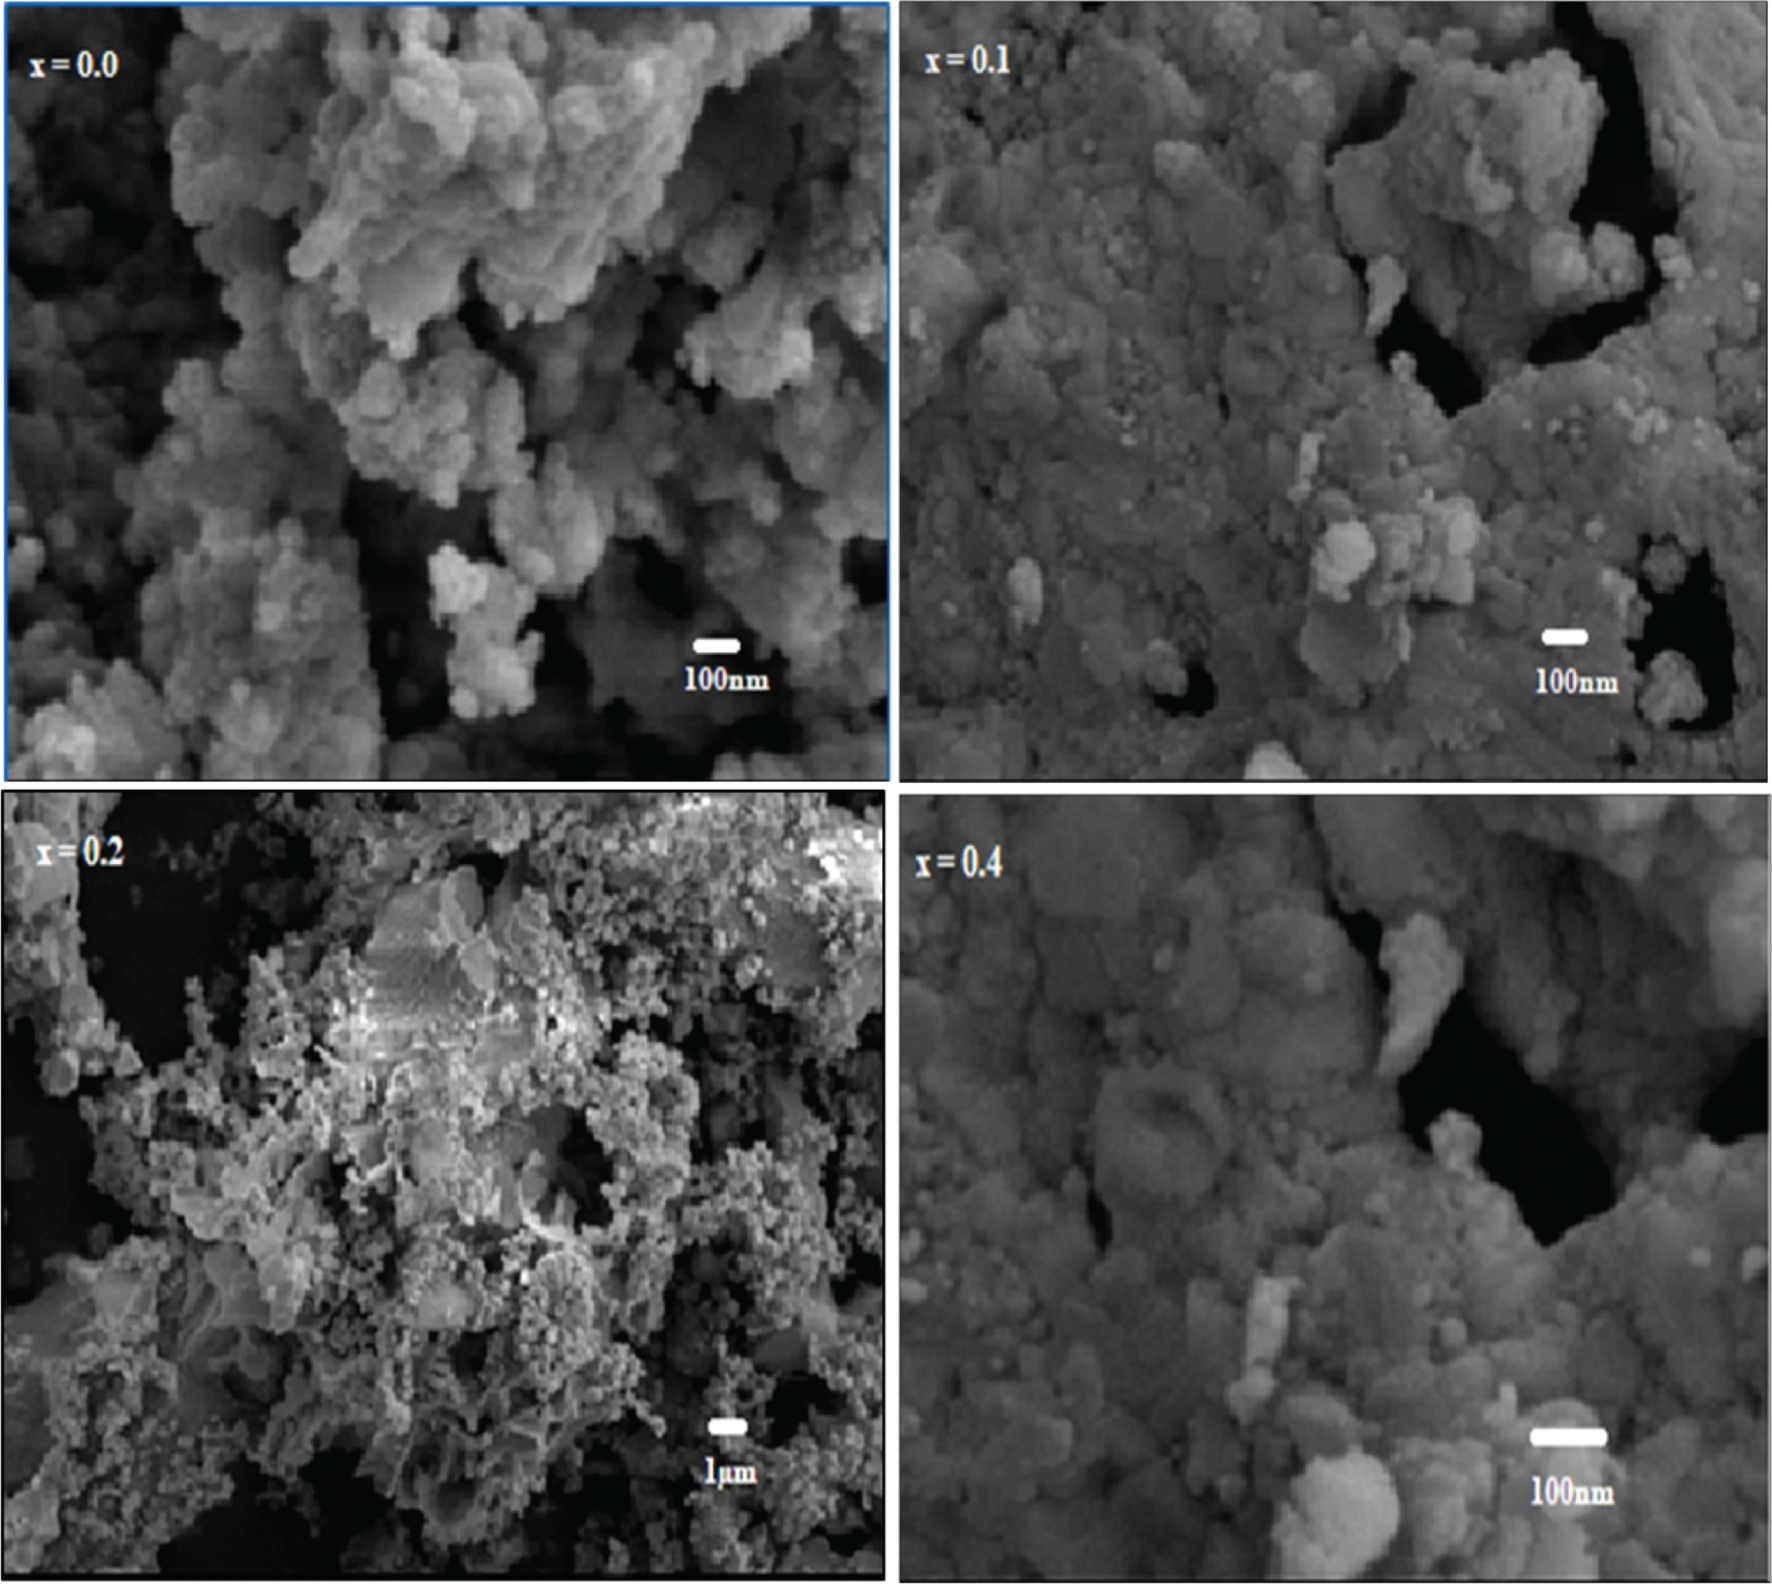
SEM images of Al-substituted BiAlxFe1−xO3 (x = 0.0, 0.1, 0.2, and 0.3) samples.
3.3 Elemental Composition
EDX microanalysis is carried out at working voltage to confirm the content of doping agent in BiAlxFe1−xO3. The location of peaks guide the classification of elements, and the peak height helps in the quantification of the concentration of every element in the sample. In the present study, the elemental composition of the synthesised series was calculated by using EDX, and the suitability of replacing Al instead of Fe in the mixture was assessed. The EDX spectra (Fig. 3) of BiAlxFe1−xO3 (x = 0.0, 0.1, and 0.3) for these samples revealed the presence of Bi, Al, O, and Fe, and their contents were in close agreement with the elemental compositions of the dissolved reactants, thus confirming that aluminium ions replaced iron ions in the lattice structure [22]. Every peak was exclusive for all atoms and corresponded to each element. This gives the confirmation of the soluble materials, and no impurity was observed, which matched the XRD results that all samples are single phase with a rhombohedral crystal structure [31]. Each element has unique peaks and energy. EDX is used for both qualitative (element types) and quantitative analyses.
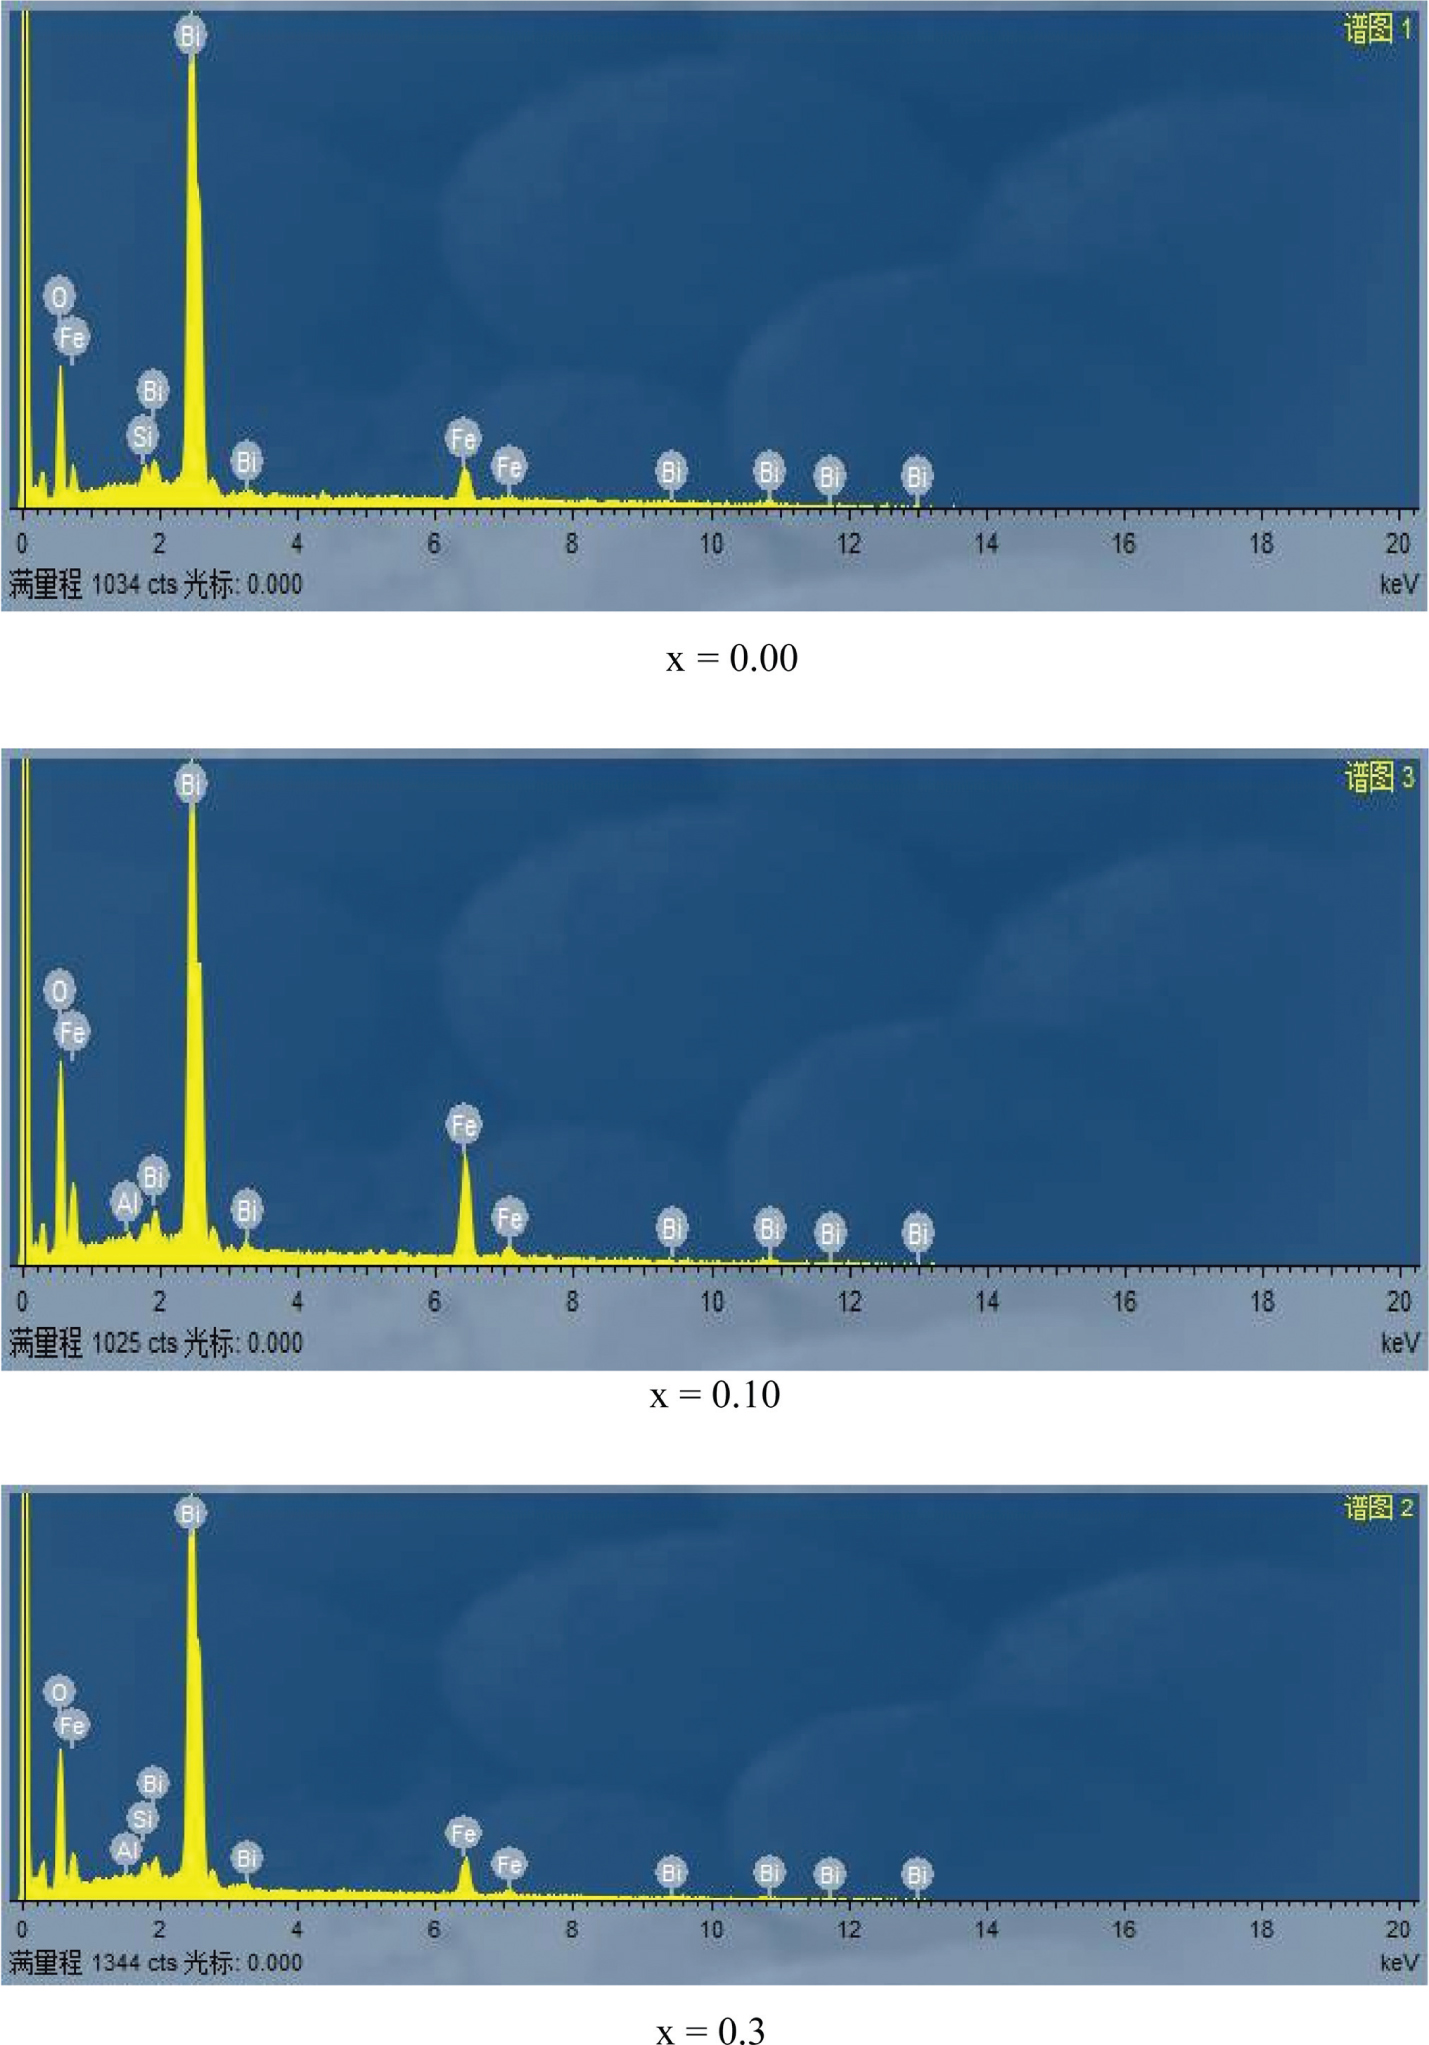
EDX spectra of Al-substituted BiAlxFe1−xO3 (x = 0.0, 0.1, and 0.3) samples.
Variation of grain size vs. Al contents (x).
| x | Grain size (nm) |
|---|---|
| 0.0 | 73 |
| 0.10 | 64 |
| 0.20 | 66 |
| 0.30 | 58 |
3.4 Elemental Mapping
Figure 4 shows the elemental mapping images of an Al-substituted BiAlxFe1−xO3 (x = 0.0) sample. The elemental mapping images of BiAlxFe1−xO3 were recorded to study the distribution of elements in the nanostructures. These images showed that Bi, Fe, and O were uniformly distributed in the BFO solution. The density of the particles was the same throughout the material [32].
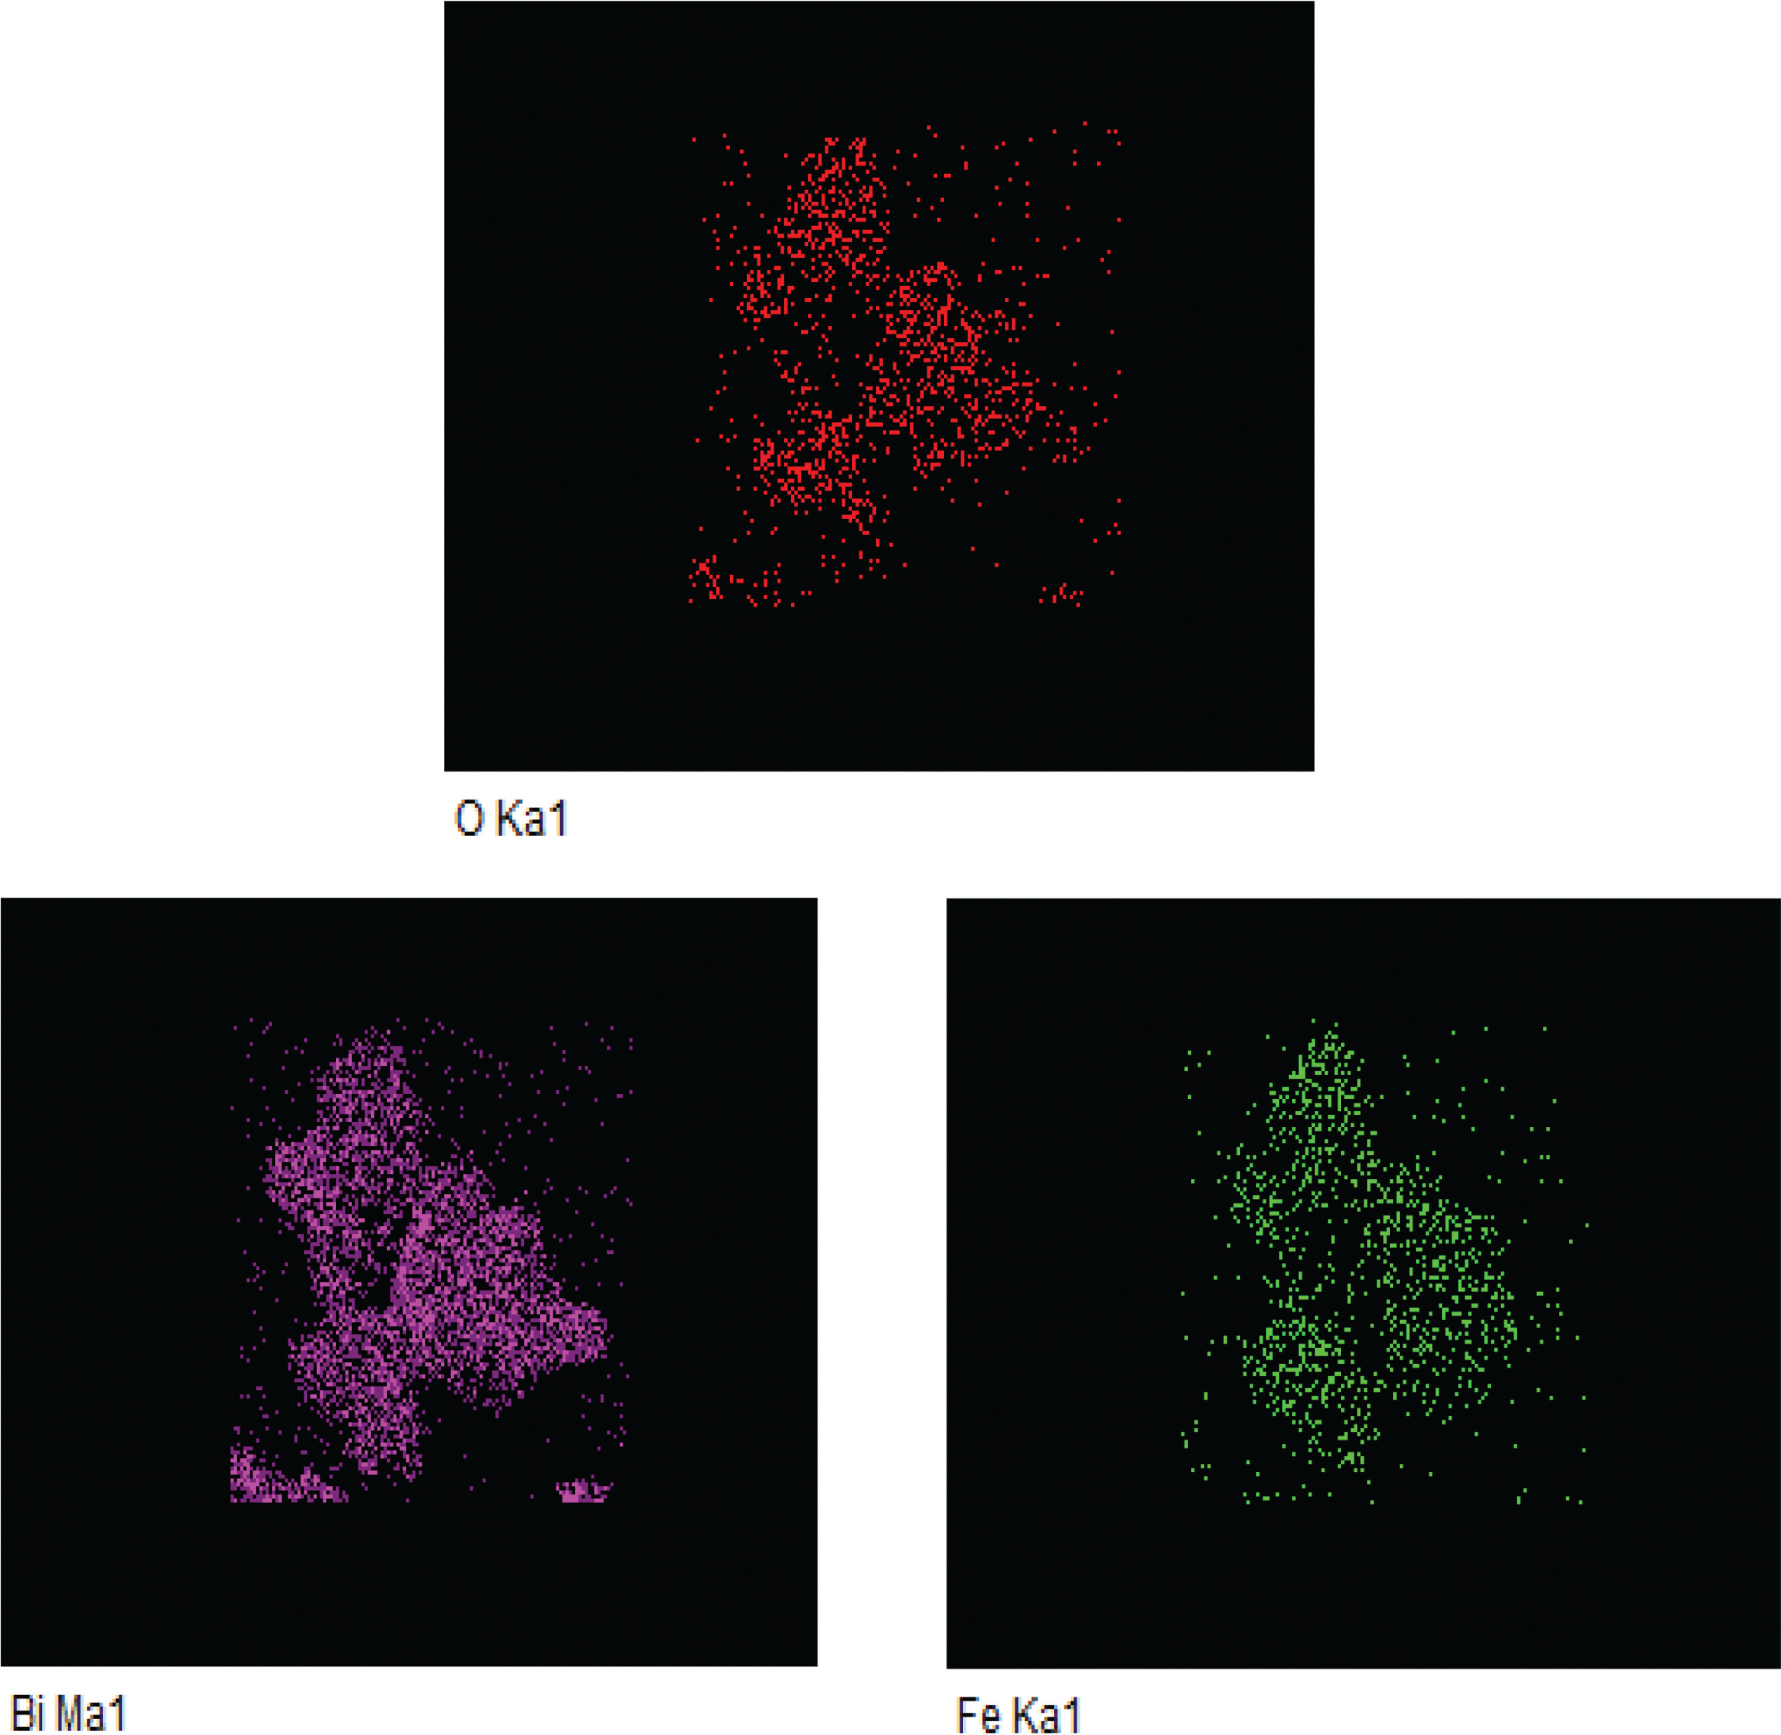
Elemental mapping images of Al-substituted BiAlxFe1−xO3 (x = 0.0) sample.
3.5 Electrical Properties
Room temperature DC electrical resistivity (ρdc) can be calculated using the given formula [22]:
where R, A, and t in (4) represent resistance, area, and thickness of the pellet.
Many factors such as microstructure homogeneity, chemical composition, site occupancy of substituted ions, particle size, porosity, and crystal structure affect the resistivity of ceramic materials [33]. In these materials, greater electron hopping between ferrous (Fe2+) and ferric (Fe3+) ions at the octahedral sites results in greater conductivity and vice versa. The electrical resistivity of the unsubstituted (x = 0.0) sample was found to be lower than that of the Al-substituted samples (Tab. 3). The minimum value was 8.5 × 10⁷ Ω-cm at x = 0.0 which increased about four folds to maximum of 7.38 × 10¹⁰ Ω-cm at x = 0.3. Substituted Al ions possess an octahedral site preference [34]. Consequently, they replace Fe3+ ions at these sites. As the percentage of Al increases from 0 % to 30 %, the concentration of Al ions increases at the octahedral sites and that of Fe3+ ions decreases. This results in lesser hopping of ferrous and ferric ions, as the hopping is proportional to their concentration at the octahedral sites. The Maxwell–Wagner model proposes that low resistive grains are surrounded by resistive grain boundaries. The Al ions can accumulate at the grain boundaries, which are resistive in nature [35]. Increased Al concentration will result in more Al ion accumulation. This decrease in hopping rate and Al ion accumulation results in higher resistivity for Al-substituted samples.
Resistivity (ρ), number of charge carriers (n), and drift mobility (μd) of BiAlxFe1−xO3 at x = 0.0, 0.1, 0.2, and 0.3.
| x | ρ (Ω-cm) | n (cm−3) | μd × 10−13 (cm2V−1s−1) |
|---|---|---|---|
| 0.0 | 8.5 × 10⁷ | 2.69 × 10²² | 3.13 |
| 0.1 | 4.34 × 10⁸ | 4.56 × 10²² | 2.88 |
| 0.2 | 1.15 × 10⁹ | 7.13 × 10²² | 2.56 |
| 0.3 | 7.38 × 10⁹ | 8.62 × 10²² | 2.48 |
The drift mobility (μd) of the electrons for the given materials can be calculated using the following formula:
In (5), σ is conductivity while n and e represent electron concentration and electric charge, respectively. The electron (charge) concentration can be calculated using the following formula:
where NA is Avogadro’s number, dB is bulk density, M is molecular mass, and PFe is iron atom concentration as determined by EDX analysis.
The drift mobility of the given samples decreased with increasing Al substitution. The maximum μd was 3.13 × 10⁻¹³ cm2 V−1 s−1 (x = 0.0), which decreased to a minimum value of 2.48 × 10⁻¹³ cm2 V−1 s−1 (x = 0.3). This decrease in drift mobility is attributed to the decrease in Fe3+ ions at octahedral sites with Al substitution resulting in a low hopping rate.
3.6 FTIR Study
The Fourier spectra are important for analysing the stretching produced due to absorption of water, nitrate ions, and metal–ion interactions. The FTIR spectra of BiAlxFe1−xO3 at x = 0.2 is shown in Figure 5 with wave number varying from 4000 to 500 cm−1. The absorption peaks at 1400 and 820 cm−1 were due to absorption of nitrate ions. The Fe–O and O–Fe–O bond stretching are responsible for absorption peaks appearing at 589 and 529 cm−1, respectively. These results are in agreement with characteristic absorption bands already observed for BFO [36]. Quantities such as Vt, Vo, Kt, and Ko were calculated for characteristic absorption bands and listed in Table 4.
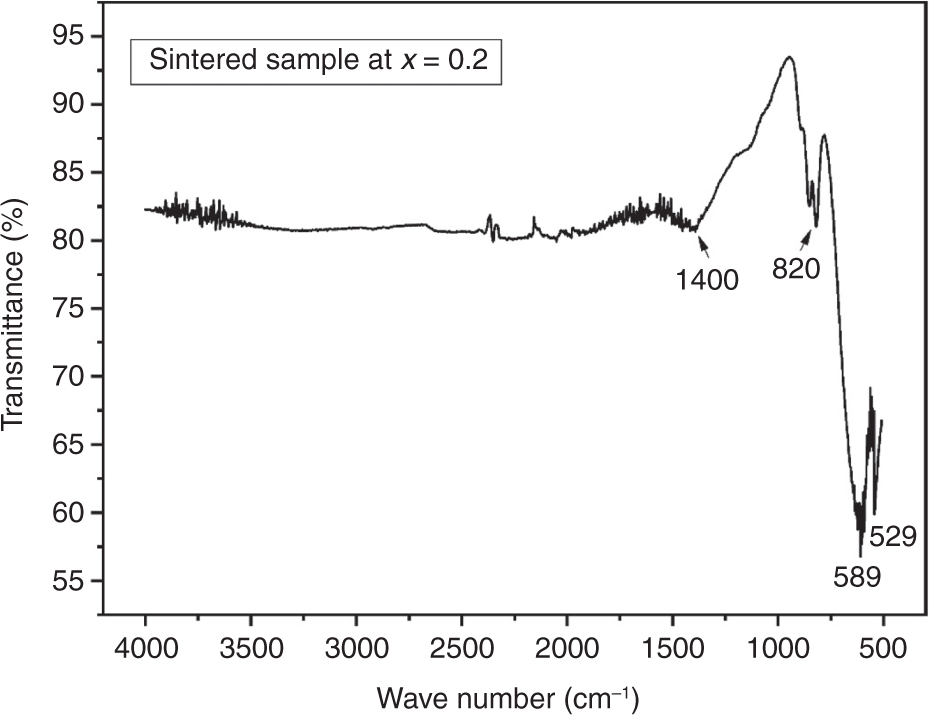
FTIR spectrum of Al-substituted BiAlxFe1−xO3 (x = 0.2) sample.
Values of Vo, Vt, Kt, and Ko for unsintered BiFeO3 at x = 0.2.
| Vibrational studies of sample | Vt (cm−1) | Vo, (cm−1) | Kt × 105 (dyne/cm) | Ko × 105 (dyne/cm) |
|---|---|---|---|---|
| Sintered | 589.69 | 529.79 | 5.515 | 2.56 |
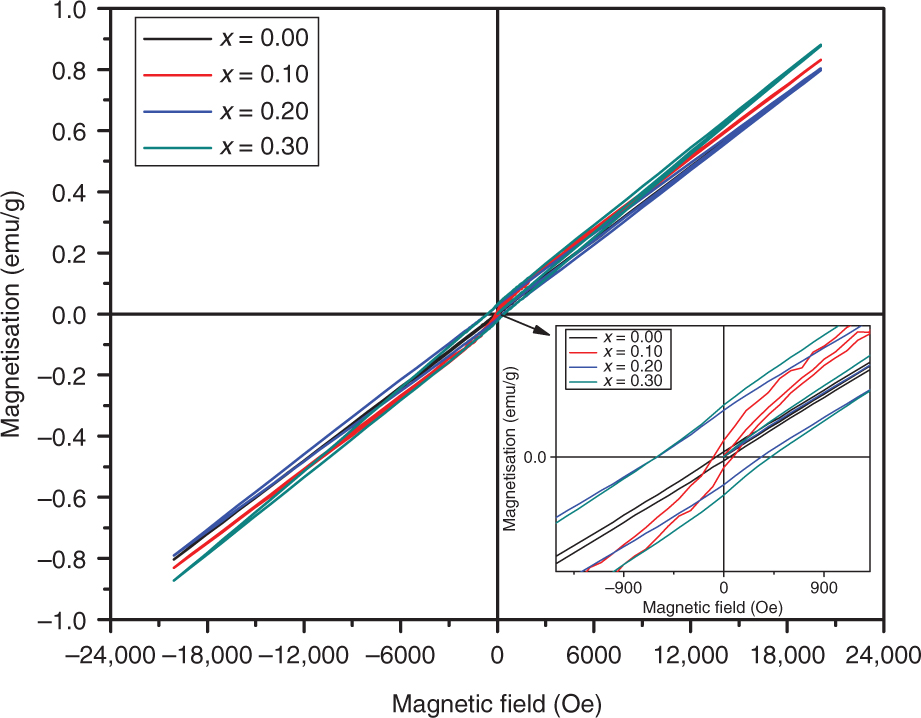
M–H loops for Al-substituted BiAlxFe1−xO3 (x = 0.0, 0.1, 0.2, and 0.3) samples. Inset shows the low field coercivity.
Magnetisation (M), magnetic remanence (Mr), and coercivity (Hc) of BiAlxFe1−xO3 at x = 0.0, 0.1, 0.2, and 0.3.
| x | Magnetisation at 20 kOe (M) (emu/g) | Magnetic remanence (Mr) (emu/g) | Coercivity (Hc) (Oe) |
|---|---|---|---|
| 0.0 | 0.797 | 0.003 | 70.40 |
| 0.1 | 0.830 | 0.01 | 93.95 |
| 0.2 | 0.803 | 0.028 | 601.55 |
| 0.3 | 0.878 | 0.031 | 603.74 |
3.7 Magnetic Measurements
The magnetic–hysteresis (M–H) loops for BiAlxFe1−xO3 at x = 0.0, 0.1, 0.2, and 0.3 are shown in Figure 6 with magnetic field varying between −20,000 and 20,000 Oe. The obtained magnetic parameters for all samples are listed in Table 5. It is well known that BFO crystals with size >60 nm show anti-ferromagnetic behaviour [37], which is evident in the present study. Such materials show enhancement in magnetisation due to changes in particle size [38]. The minimum value of magnetisation was 0.797 emu/g for the unsubstituted sample and a maximum value of 0.878 emu/g was observed at x = 0.3 for the substituted sample. This is attributed to blocking of anti-ferromagnetism with reduction in particle size along with the meaningful contribution from anisotropic stresses and spin decompensation on the nanoparticle surface [39]. The magnetic remanence represents the quantity of magnetisation left in the material, when applied magnetic field is nullified. The remanent magnetisation increased from 0.003 to 0.031 emu/g for the unsubstituted and Al-substituted (x = 0.3) samples. This is due to the nearly distorted spin cycloid structure [40]. The coercivity of the prepared samples increased from 70.40 Oe for x = 0.0 to a maximum of 603.74 for x = 0.3. Changes in Fe and O vacancies result in an increase or decrease in coercivity [41]. Moreover, it has also been observed in XRD and SEM analyses that grain size decreases with Al substitution in the BFO lattice, which enhances the coercivity of the prepared samples as both grain size and coercivity are inversely related with each other. It has been observed earlier that BFO materials with such parameters are favourable for ferroelectric random access memories, where data can be written electrically and read magnetically.
4 Conclusion
Single-phase BiAlxFe1−xO3 (x = 0.0, 0.1, 0.2, and 0.3) samples were successfully prepared using sol–gel auto-combustion. The rhombohedral single-phase structure was confirmed by XRD analysis. Values of lattice constants were found to be smaller for Al-substituted samples in comparison with the unsubstituted sample, and the unit cell volume decreased with increasing Al contents in the BFO lattice. The morphology of the samples was dense and non-uniform. The grain size decreased with increasing Al doping. The elemental mapping investigation clearly showed that the distribution of the elements was uniform in the sample. The FTIR spectrum of the sample showed Fe–O and Bi–O bond stretching in the range of 500–600 cm−1. The increase in Al substitution resulted in increase in coercivity due to the replacement of Fe3+ by Al3+ ions, weakening the sub-lattice interactions.
References
[1] D. I. Khomskii, J. Magnetism Magnetic Mater. 306, 1 (2006).10.1016/j.jmmm.2006.01.238Suche in Google Scholar
[2] E. Mostafavi, A. Ataie, M. Ahmadzadeh, M. Palizdar, T. P. Comyn, et al., Mater. Chem. Phys. 162, 106 (2015).10.1016/j.matchemphys.2015.05.017Suche in Google Scholar
[3] C. Michel, J.-M. Moreau, G. D. Achenbach, R. Gerson, and W. J. James, Solid State Commun. 7, 701 (1969).10.1016/0038-1098(69)90597-3Suche in Google Scholar
[4] V. Isupov and A. Skaya, Sov. Phys. Solid State 2, 2651 (1961).Suche in Google Scholar
[5] G. Smolenskii, V. Yudin, E. Sher, and Y.E. Stolypin, Sov. J. Exp. Theor. Phys. 16, 622 (1963).Suche in Google Scholar
[6] J.-M. Moreau, C. Michel, R. Gerson, and W. J. James, J. Phys. Chem. Solids 32, 1315 (1971).10.1016/S0022-3697(71)80189-0Suche in Google Scholar
[7] D.-C. Jia, J.-H. Xu, H. Ke, W. Wang, and Y. Zhou, J. Eur. Ceram. Soc. 29, 3099 (2009).10.1016/j.jeurceramsoc.2009.04.023Suche in Google Scholar
[8] G.-C. Xu, W. Zhang, X.-M. Ma, Y.-H. Chen, L. Zhang, et al., J. Am. Chem. Soc. 133, 14948 (2011).10.1021/ja206891qSuche in Google Scholar PubMed
[9] S. Wei, Y. Liu, H. Tian, H. Tong, Y. Liu, et al., J. Magnetism Magnetic Mater. 377, 419 (2015).10.1016/j.jmmm.2014.10.128Suche in Google Scholar
[10] M.-G. Ma and J.-F. Zhu, Recent Patents Nanotechnol. 4, 164 (2010).10.2174/187221010792483690Suche in Google Scholar
[11] B. Baruwati, D. K. Kumar, and S. V. Manorama, Sens. Actuators B Chem. 119, 676 (2006).10.1016/j.snb.2006.01.028Suche in Google Scholar
[12] Y. Inaguma, M. Yoshida, and T. Katsumata, J. Am. Chem. Soc. 130, 6704 (2008).10.1021/ja801843vSuche in Google Scholar PubMed
[13] G. W. Burr, B. N. Kurdi, J. C. Scott, C. H. Lam, K. Gopalakrishnan, et al., IBM J. Res. Dev. 52, 449 (2008).10.1147/rd.524.0449Suche in Google Scholar
[14] M. Shisode, P. B. Kharat, D. N. Bhoyar, V. Vinayak, M. K. Babreka, et al., in: AIP Conference Proceedings, AIP Publishing, USA 2018.Suche in Google Scholar
[15] J. Xie, C. Feng, X. Pan, and Y. Liu, Ceram. Int. 40, 703 (2014).10.1016/j.ceramint.2013.06.058Suche in Google Scholar
[16] F. Gheorghiu, L. Curecheriu, A. Ianculescu, M. Calugaru, and L. Mitoseriu, Scr. Mater. 68, 305 (2013).10.1016/j.scriptamat.2012.10.050Suche in Google Scholar
[17] J. R. Sahu and C. Rao, Solid State Sci. 9, 950 (2007).10.1016/j.solidstatesciences.2007.06.006Suche in Google Scholar
[18] C. Yang, C. Z. Liu, C. M. Wang, W. G. Zhang, and J. S. Jiang, J. Magnetism Magnetic Mater. 324, 1483 (2012).10.1016/j.jmmm.2011.11.033Suche in Google Scholar
[19] S. Rana and R. P. Singh, J. Mater. Sci. Mater. Electron. 27, 9346 (2016).10.1007/s10854-016-4975-6Suche in Google Scholar
[20] S. B. Rana, R. Singh, and S. Arya, J. Mater. Sci. Mater. Electron. 28, 2660 (2017).10.1007/s10854-016-5843-0Suche in Google Scholar
[21] R. P. P. Singh, I. S. Hudiara, S. Panday, and S. B. Rana, J. Superconduct. Novel Magnetism 29, 819 (2016).10.1007/s10948-015-3349-2Suche in Google Scholar
[22] M. Ahmad, R. Grössinger, I. Ali, I. Ahmad, and M. U. Rana, J. Alloys Comp. 577, 382 (2013).10.1016/j.jallcom.2013.05.135Suche in Google Scholar
[23] A. Bhosale and B. Chougule, Mater. Chem. Phys. 97, 273 (2006).10.1016/j.matchemphys.2005.08.022Suche in Google Scholar
[24] M. Mozaffari, Z. Abooalizadeh, and J. Amighian, J. Magnetism Magnetic Mater. 323, 2997 (2011).10.1016/j.jmmm.2011.06.026Suche in Google Scholar
[25] P. Kumar and M. Kar, Phys. B Condensed Matter 448, 90 (2014).10.1016/j.physb.2014.03.080Suche in Google Scholar
[26] M. K. Sharif, M. A. Khan, A. Hussain, F. Iqbal, I. Shakir, et al., J. Alloys Comp. 667, 329 (2016).10.1016/j.jallcom.2016.01.184Suche in Google Scholar
[27] C. Ramesh, K. Maniysundar, and S. Selvanandan, Mater. Today Proc. 3, 1363 (2016).10.1016/j.matpr.2016.04.016Suche in Google Scholar
[28] V. Verma, A. Beniwal, A. Ohlan, and R. Tripathi, J. Magnetism Magnetic Mater. 394, 385 (2015).10.1016/j.jmmm.2015.06.067Suche in Google Scholar
[29] V. Kumar, A. Gaur, N. Sharma, J. Shah, and R. K. Kotnala, Ceram. Int. 39, 8113 (2013).10.1016/j.ceramint.2013.03.084Suche in Google Scholar
[30] A. Paul, M. J. H. van Dal, A. A. Kodentsov, and F. J. J. van Loo, Acta Mater. 52, 623 (2004).10.1016/j.actamat.2003.10.007Suche in Google Scholar
[31] M. W. Mukhtar, M. Irfan, I. Ahmad, I. Ali, M. N. Akhtar, et al., J. Magnetism Magnetic Mater. 381, 173 (2015).10.1016/j.jmmm.2014.12.072Suche in Google Scholar
[32] K. Shehzad, M. Ahmad, C. Xie, D. Zhan, W. Wang, et al., J. Hazard. Mater. 373, 75 (2019).10.1016/j.jhazmat.2019.01.021Suche in Google Scholar PubMed
[33] F. Ren, H. Wang, P. A. Menchhofer, and J. O. Kiggans, Appl. Phys. Lett. 103, 221907 (2013).10.1063/1.4834700Suche in Google Scholar
[34] G. F. Dionne, Proc. IEEE 63, 777 (1975).10.1109/PROC.1975.9827Suche in Google Scholar
[35] J. Buban, Science 311, 212 (2006).10.1126/science.1119839Suche in Google Scholar PubMed
[36] R. Mishra, D. K. Pradhan, R. N. P. Choudhary, and A. Banerjee, J. Phys. Condensed Matter 20, 045218 (2008).10.1088/0953-8984/20/04/045218Suche in Google Scholar
[37] W. Eerenstein, N. Mathur, and J. F. Scott, Nature 442, 759 (2006).10.1038/nature05023Suche in Google Scholar PubMed
[38] R. Mazumder, P. S. Devi, D. Bhattacharya, P. Choudhury, A. Sen, et al., Appl. Phys. Lett. 91, 062510 (2007).10.1063/1.2768201Suche in Google Scholar
[39] T.-J. Park, G. C. Papaefthymiou, A. J. Viescas, A. R. Moodenbaugh, and S. S. Wong, Nano Lett. 7, 766 (2007).10.1021/nl063039wSuche in Google Scholar PubMed
[40] P. Kumar and M. Kar, Mater. Chem. Phys. 148, 968 (2014).10.1016/j.matchemphys.2014.09.007Suche in Google Scholar
[41] J. Lin, Z. Guo, M. Li, Q. Lin, K. Huang, et al., J. Appl. Biomater. Funct. Mater. 16, 93 (2018).Suche in Google Scholar
©2020 Walter de Gruyter GmbH, Berlin/Boston
Artikel in diesem Heft
- Frontmatter
- Dynamical Systems & Nonlinear Phenomena
- Bifurcation Analysis for Small-Amplitude Nonlinear and Supernonlinear Ion-Acoustic Waves in a Superthermal Plasma
- Propagation of Waves in a Nonideal Magnetogasdynamics with Dust Particles
- Delta-Shock Solution to the Eulerian Droplet Model by Variable Substitution Method
- Solitary Wave with Quantisation of Electron’s Orbit in a Magnetised Plasma in the Presence of Heavy Negative Ions
- Heat and Mass Transfer of Temperature-Dependent Viscosity Models in a Pipe: Effects of Thermal Radiation and Heat Generation
- Solid State Physics & Materials Science
- Michelson Interferometric Hydrogen Sulfide Gas Sensor Based on NH2-rGO Sensitive Film
- Insight into the Structural, Electrical, and Magnetic Properties of Al-Substituted BiFeO3 Synthesised by the Sol–Gel Method
- Theoretical Studies of the Defect Structures for Cu(en)32+ and Ru(en)33+ Clusters in Tris(Ethylenediamine) Complexes
- Thermodynamics & Statistical Physics
- A Framework for Sequential Measurements and General Jarzynski Equations