
Michelson Interferometric Hydrogen Sulfide Gas Sensor Based on NH2-rGO Sensitive Film
-
Shaodian Liu
 ,
Wenlin Feng
,
Wenlin Feng

Abstract
A highly sensitive hydrogen sulfide gas sensor based on NH2-rGO-coated thin-core-fibre (TCF) Michelson interferometer (MI) is proposed and evaluated. Two sections of TCFs are alternately sandwiched between three single-mode-fibres (SMFs). A Faraday rotator mirror (FRM) is fixed to the end of the last SMF to reflect the light signal and enhance the interference. Then the structure SMF-TCF-SMF-TCF-SMF-FRM (STSTS-F) is successfully constructed. NH2-rGO, as sensing film, is coated on two TCFs and is used to detect traces of hydrogen sulfide gas. Raman spectra and XPS analysis show that NH2-rGO has been successfully synthesised. The thickness of the NH2-rGO film coated on the TCF surface is about 500 nm. By introducing 0–60 ppm hydrogen sulfide gas into the chamber, with the increase in concentration of the gas, the monitoring trough exhibits a blue shift. Our experimental results show that the sensor has good linearity (R2 = 0.98096) and selectivity for hydrogen sulfide gas. The sensitivity is 21.3 pm/ppm, and the response and recovery times are about 72 and 90 s, respectively. The sensor has the advantages of high sensitivity, high selectivity, and small size, enabling the detection of trace hydrogen sulfide in toxic gas environments.
1 Introduction
Hydrogen sulfide (H2S) is a highly toxic gas, which is produced in industrial activities such as petroleum gas drilling and refining, wastewater treatment, coke ovens, tanneries, landfills, etc. [1], [2], [3]. Moreover, H2S gas can induce some diseases, including diabetes, hypertension, stroke, and Alzheimer’s disease [4]. It has been found that 2–5 ppm or higher H2S is harmful to human respiratory health, and 100 ppm or higher H2S harms the human nervous systems. When the concentration of H2S is 1000–2000 ppm, it will cause immediate death [5]. Therefore, the effective detection of trace H2S is vital for human health and life safety.
In recent years, optical fibre sensors have been widely used in environmental monitoring, such as that of biomolecules [6], [7], [8], gases [9], [10], [11], temperature and humidity [12], [13], [14], pH [15], [16], etc. Among them, the Michelson interferometer (MI) has received much attention. Recently, a temperature-insensitive MI refractive index (RI) sensor was fabricated and evaluated with the SMF-TCF-SMF (SMF: single-mode fibre, TCF: thin-core fibre) structure [17], [18]. This sensor could remove the temperature cross-sensitivity for RI [17], [18]. Considering that the intensity is greatly affected by the external environment, and the RI sensor modulated by the wavelength is more stable, an MI RI sensor based on two long-period fibre gratings (LPFGs) is proposed. The reflective film is coated on the end surface as a mirror, and the sensitivity is greatly improved by corroding the cladding [19]. In order to obtain a highly stable optical fibre sensor, many researchers use a Faraday rotator mirror (FRM) as a reflector [20], [21], [22]. Typically, the gas adsorption-desorption and catalytic reactions usually occur on the surface of the sensing films, so new high-performance gas sensing materials play a key role for gas sensors. Among these sensing materials, reduced graphene oxide (rGO) possesses excellent electrical and thermal conductivity with good mechanical and corrosion-resistance properties, too. Thus, some gas sensors based on rGO were fabricated and used in NO2, NH3, and H2 gas detection [23], [24], [25]. The rGO-based gas sensing properties are improved by decorating the interface charge layer [26]. However, there are different molecules that can regulate the carrier concentration, and hence the selectivity cannot be neglected [27]. Recently, carboxyl-, amide-, or metal-group-functionalised rGO was reported to improve the selectivity of gas sensors [28]. SnO2 quantum dots and MoO3-modified rGO were used as gas sensing materials for the quantitative detection of low concentrations H2S, and the results showed that these sensors have excellent selectivity and sensitivity [29], [30]. However, to the best of our knowledge, there is no report in the literature on the combination of NH2-rGO and optical fibre sensing technology for trace hydrogen sulfide detection. Therefore, in this work, a Michelson interferometric hydrogen sulfide gas sensor based on NH2-rGO film is fabricated and evaluated. The hydrogen sulfide sensing properties are investigated and the results are discussed.
2 Principle
Figure 1 shows the schematic set-up of the SMF-TCF-SMF-TCF-SMF-FRM (STSTS-F) MI gas sensor. Two TCFs are coupled between three SMFs, alternatively, and an FRM is connected to the end face of the final SMF to form the structure STSTS-F. Light from a broadband amplified spontaneous emission (ASE, C+L band, Kangguan, Beijing, China) source is transmitted to STSTS-F via an optical fibre circulator, and eventually the light is reflected back to the optical spectrum analysers (OSA, AQ6370D, Yokogawa, Japan). Because the SMF has a larger core diameter than TCF, part of the light in the SMF core will be coupled to the cladding of the TCF (Nurern, 460-hp, 2.5 μm core diameter), and the light passing through the cladding of TCF-L will be coupled back to the core of the middle SMF. Part of the light from the core of the middle SMF is coupled to the cladding of the TCF-R, and the light from the cladding mode of the TCF-R is coupled back to the core of the terminal SMF and then transmitted to the FRM (Thorlabs, Newton, NJ, USA). The input light will rotate by 45° the first time it passes through FRM, and it will be reflected on the high-reflectivity mirror with 45° rotation again. Therefore, the FRM makes the polarisation directions of the input and output light perpendicular to each other, thus eliminating the polarisation of the interference spectrum.

Schematic diagram of the experimental set-up. The inset shows the STSTS-F structure.
An interferogram is formed by coupling the core mode (LP01) with the cladding mode (LP0m, m > 1). The intensity of the output light (Is) can be expressed as [31]
where Ico and Icl,m are the intensity of the core and cladding modes, respectively. Because the effective refractive indices of core and cladding modes are different, the formulas are as follows:
where
where
When the refractive index of the external environment changes, the variation (
In the experiment, the NH2-rGO gas sensing film was coated on the cladding surface of two TCF segments. When hydrogen sulfide gas is introduced, the interaction between the gas and sensing film causes a change of the effective RI of the TCF cladding. According to (8),
3 Experiment and Method
3.1 Preparation of NH2-rGO
Graphene oxide dispersion (GO; 2 mg/mL) was obtained from Nanjing Xianfeng Nanomaterials Technology Co., Ltd. (Nanjing, China. Ethylenediamine (C2H8N2, EDA; 99 %), ammonia (NH3 ⋅ H2O; 25–28 %), sodium borohydride (NaBH4; 98 %), hydrogen peroxide (H2O2; 30 %), sulfuric acid (H2SO4; 98 %), N,N-dimethylformamide (DMF; AR), and anhydrous ethanol (C2H6O; AR) were obtained from Sinopharm Chemical Reagent Co., Ltd. (Shanghai, China) and were used without further purification.
GO dispersion (30 mL) and absolute ethanol (50 mL) were fully mixed together, and ammonia was slowly added to the mixed solution dropwise until pH = 10. Then EDA (15 mL) was added to the mixed solution and the sample was heated at 80 °C for 3 h with stirring. It was filtered and washed with de-ionised water and ethanol, respectively, thereby removing unreacted ammonia and EDA. The obtained sample was ground for 1 h after vacuum-drying at 60 °C for 12 h, dispersed in 50 mL DMF using ultrasound, and then 0.02 g sodium borohydride was added to the mixture with stirring at 60 °C for 3 h. After that, the product was filtered and washed by de-ionised water, and finally dried it at 60 °C for 12 h. Then NH2-rGO was obtained.
3.2 Instruments and Methods
The morphology of the sensing-film-coated TCF was characterised using a Gemini SEM 300 field emission scanning electron microscope (FE-SEM; Zeiss, Germany). Raman spectra were obtained using a Raman spectrometer (LabRAM HR Evolution, Horiba Scientific, France). X-ray photoelectron spectroscopy (XPS) of NH2-rGO was performed using an XPS-Theta probe instrument (Escalab250Xi, Thermo Fisher, MA, USA).
3.3 Fabrication of Sensor
Two TCFs and several standard SMFs were prepared. The splicing machine (Furukawa, S178, Japan) parameters were as follows: first discharge starting strength +90, the second discharge intensity +40, the pre-welding time +160 ms, automatic discharge time +1300 ms, the second discharge intensity +100, the section interval +20, and other parameters all zero. As shown in Figure 1, one end of the optical fibre is connected to the spectrometer and the other end to the ASE light source to form the Mach–Zehnder interferometer (MZI). In addition, one end of the optical fibre is connected to the fibre circulator and the other end to the FRM to form the Michelson interferometer. Figure 2 shows the related structural parameter optimisation. Shown in Figure 2a are the spectra of MZI without FRM and MI with FRM. By magnifying the waveband around 1575 nm, it can be clearly seen that MI with FRM has stronger anti-interference ability than MZI. The result shows that FRM can improve the signal-to-noise ratio and enhance the stability of the interferometer. The reason is that when the input light passes through the FRM, the polarisation angle of the input light is rotated by 45° and the light is deflected by 45° again after being reflected back by the highly reflective material. The FRM makes the input light and the output light to have mutually perpendicular polarisation directions, which can eliminate the polarisation interference of the spectrum. It should be pointed out that when only one TCF is used, the interference peaks are fewer, the depth of the spectral peaks is not enough, and the interference phenomenon may be not obvious for the sensitivity test.

Structural parameter optimisation. (a) Spectra of MZI without FRM and MI with FRM. (b) Interference spectra with different TCF-SMF-TCF lengths. (c) FFT spectrum of STSTS-F structure after coating. The inset is the interference spectrum after coating.
In order to investigate the influence of length of the TCF and SMF on the interference spectra, the optimum optical fibre length and high-stability reflectance spectrogram were obtained. As shown in Figure 2b, when the lengths of TCF-L and TCF-R are 3 cm and the length of the SMF is 5 cm, there are fewer interference peaks with only two obvious troughs. When the lengths of TCF and SMF are 2 and 6.5 cm, respectively, the output spectrum shows more obvious interference. However, the obvious trough noise makes it difficult to observe the trough movement. When the lengths of TCF-L, TCF-R, and SMF are 2.5, 2, and 6.5 cm, respectively, the maximum intensity attenuation of the corresponding mth-order mode is about 30 dBm, and the interference pattern is most stable. So, 2.5 cm TCF-L, 2 cm TCF-R, and 6.5 cm SMF were used to fabricate the STSTS-F MI hydrogen sulfide gas sensor.
Two TCFs with lengths 2.5 and 2 cm were spiced between the SMFs. Piranha solution was prepared by adding 30 % hydrogen peroxide to 98 % sulfuric acid at a volume ratio of 3:7 under ultrasonication for 5 min. First, the fused TCFs were cleaned with ethanol, then dried, and further soaked in 70 °C sulfuric acid and hydrogen peroxide solution for 30 min. Surface-modified TCFs with hydroxylation were obtained after drying in nitrogen atmosphere. Second, a suitable amount of NH2-rGO was dispersed in 60 mL ethanol. After magnetic stirring and cryogenic ultrasonication, the solution was fully mixed. Finally, the hydroxylated TCF segments were immersed in NH2-rGO for 20 s and vacuum-dried for 1 h at 60 °C. The above steps were repeated several times until a light black film was formed on the surface of the optical fibres. The coated optical fibres were placed in the vacuum drying chamber at 60 °C for 6 h.
The interference spectra and the fast Fourier transform (FFT) spectra of the MI sensor with STSTS-F structure after coating are shown in Figure 2c. Most of the light is transmitted in the core, and the core fundamental mode (LP01) is coupled with the stimulated high-order cladding mode (LP0m) to form the interference.
4 Results and Discussion
4.1 Surface Morphology
The NH2-rGO-coated TCF was characterised by SEM, and the surface morphologies are shown in Figure 3. From Figure 3a, a uniform and compact sensing film is formed on the surface of TCF. From the end-face diagram of TCF, as shown in Figure 3b, the thickness of the sensing film is about 500 nm.

Surface morphology. (a) Outside surface of TCF coated with NH2-RGO. (b) Cross-section of NH2-rGO-coated TCF.
4.2 Raman Spectra and XPS Analysis
Raman spectra of GO and NH2-rGO are shown in Figure 4a. The D band represents the defect of the C atom lattice and the G band represents the in-plane stretching vibration of sp2-hybridised C atom [32]. The D and G bands of GO are located at 1339 and 1585 cm−1, respectively, while the D band, G band, and 2D band of NH2-rGO are located at 1336, 1588, and 2927 cm−1, respectively. These results are consistent with those in the literature [33]. The intensity ratio (ID/IG) of the D and G bands of GO and NH2-rGO are 0.990 and 1.184, respectively. The larger the ratio, the more the number of defects or vacancies. That is to say, NH2-rGO has more defects than GO.
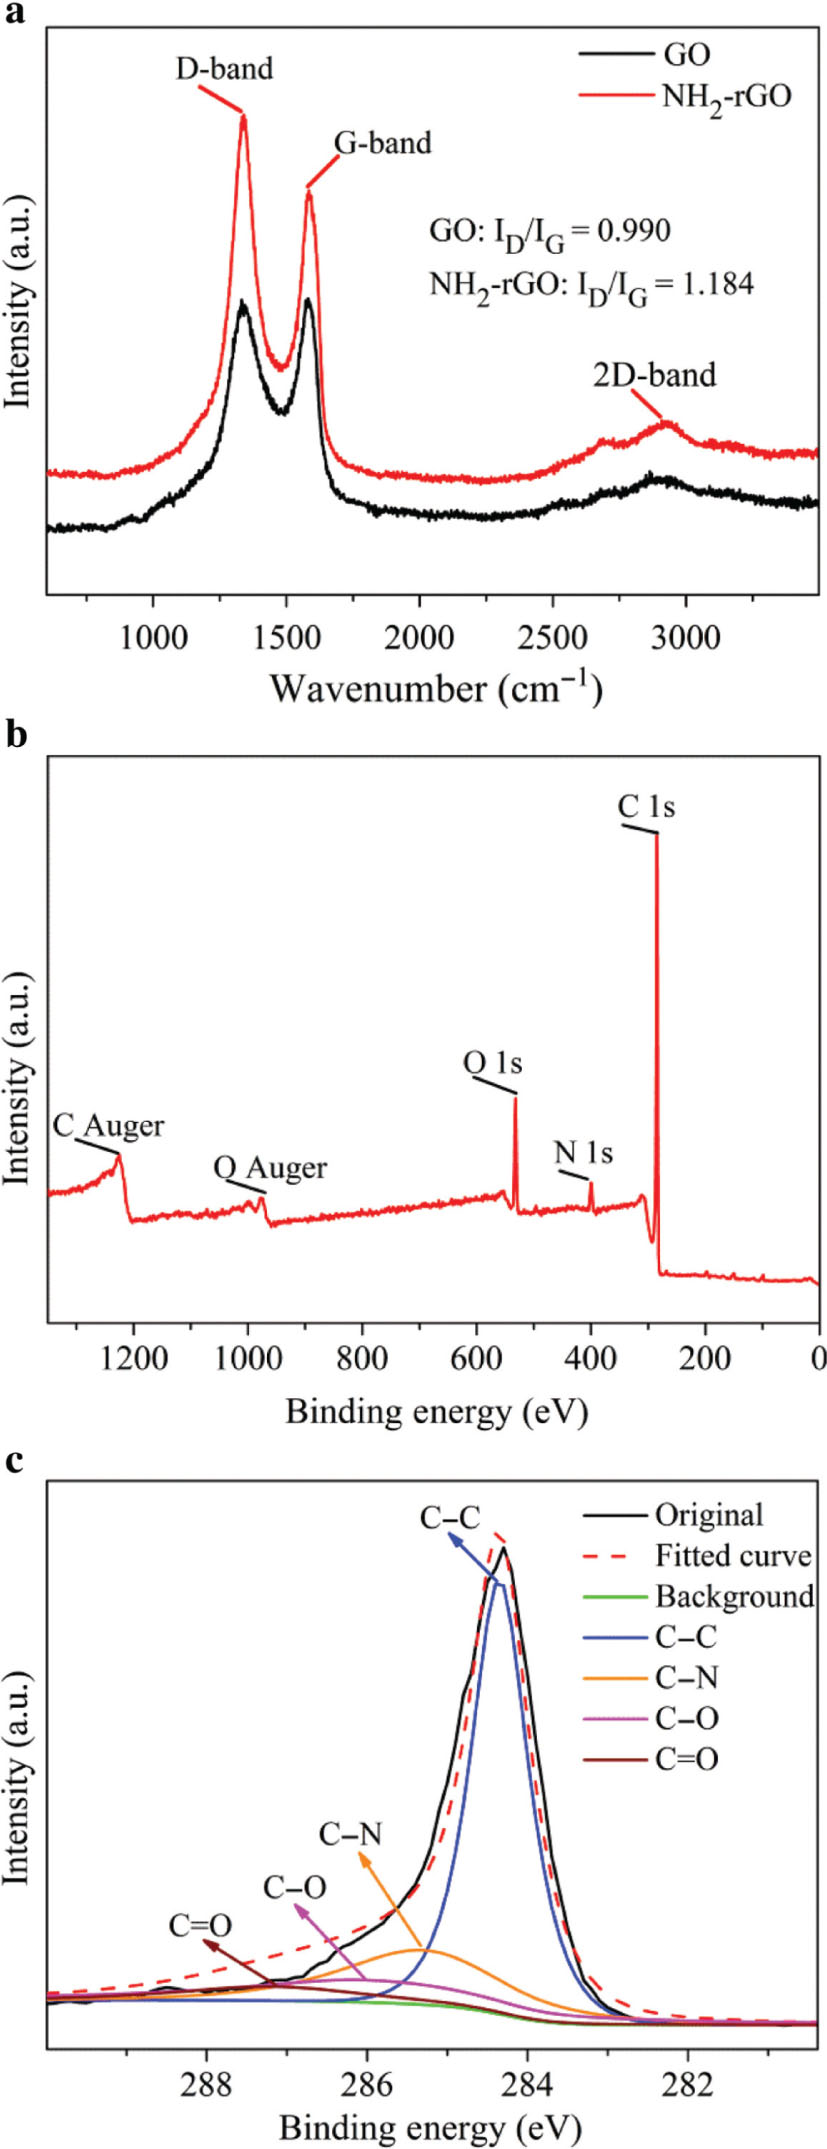

Raman and XPS spectra. (a) Raman spectra of GO and NH2-rGO. (b) XPS image of NH2-rGO. (c) High-resolution XPS scan of C 1s. (d) High-resolution XPS scan of N 1s.
Figure 4b–d shows the results of XPS of NH2-rGO. From Figure 4b, the sample contains C, N, and O elements, which are consistent with the expected compositions. H 1s does not exist because the ionisation interface of H is too small, and the 1s electron of H is easily transferred and bound to other atoms [34]. The binding energies of C 1s, N 1s, and O 1s correspond to 284.7, 398.7, and 532 eV, respectively, and C and O Auger energies correspond to 1221.4 and 979.7 eV, respectively. As shown in Figure 4c, high-resolution peak splitting fitting results of C 1s binding energies of C–C, C–N, C–O, and C=O correspond to 284.5, 285.5, 286.0, and 287.2 eV, respectively. From Figure 4d, the splitting peak fitting results of N 1s show those of –CO–NH and –CH2–NH2, corresponding to 398.2 and 399.2 eV, respectively. The formation of –CO–NH– is due to the dehydration and condensation reaction of –COOH and –NH2 when they graft with the amino groups. The existence of the –CH2–NH2 peak indicates that –NH2 is successfully grafted onto rGO.
4.3 Gas Sensing Properties
Hydrogen sulfide gas was injected into the chamber, and the gas concentration and the corresponding monitoring wavelength were recorded. As shown in Figure 5a, with the increase in hydrogen sulfide concentration, the wave trough shows a blue shift. The sensitivity is 21.3 pm/ppm and the linear fitting value is R2 = 0.98096. The limit of detection (LOD) of the sensor is given as LOD = 3σ/k [35], where σ (∼0.0112 nm) is the standard deviation of the slope and k (∼21.3 pm/ppm) is the sensitivity; thus the LOD of the sensor is 1.577 ppm. The response of the sensor to some typical gases, such as CO, H2S (the concentration of both gases is 30 ppm), as well as pure N2, O2, and CO2 at room temperature are shown in Figure 5b. It can be concluded that the NH2-rGO film is most sensitive to hydrogen sulfide, which indicates that NH2-rGO film has good selectivity to hydrogen sulfide gas. When 60 ppm hydrogen sulfide gas was injected into the chamber, and the data were collected every 10 s (see Fig. 5c), the response and recovery time of the sensor were 72 and 90 s, respectively. A detailed comparison of the designed sensor with other fibre gas sensors is shown in Table 1 [34], [36], [37]. The results indicate that this sensor has some good characteristics such as sensitivity and selectivity for H2S.

Gas sensing properties. (a) Wavelength versus concentration of hydrogen sulfide. The inset shows the spectral response of the sensor under various concentrations of hydrogen sulfide. (b) Selectivity for hydrogen sulfide, helium, nitrogen, carbon dioxide, and oxygen. (c) Dynamic response of the hydrogen sulfide gas sensor.
Parameter comparison of the proposed sensor and other fibre gas sensors.
| Sensing material | Size | Sensitivity | Selectivity | References |
| MoS2/citric acid | 1 cm | 10.52 pm/ppm | H2S | [34] |
| Cu/ZnO | 1 cm | ∼300 pm/ppm | Not given | [36] |
| Ag | 10.0 ± 0.2 mm | 3.32 × 10⁻⁵ dBm/ppm | Not given | [37] |
| NH2-rGO | 2 cm | 21.3 pm/ppm | H2S | This work |
The following is the error analysis of the experimental data. From Table 2, the arithmetic mean of wavelength deviation can be obtained as
H2S content, measured wavelength data (MWD), theoretical wavelength data (TWD), and the wavelength deviation Δλi (WDD).
| H2S content | 0 ppm | 6 ppm | 10 ppm | 20 ppm | 30 ppm | 40 ppm | 50 ppm | 60 ppm |
|---|---|---|---|---|---|---|---|---|
| MWD (nm) | 1563.88 | 1563.82 | 1563.62 | 1563.34 | 1563.18 | 1562.96 | 1562.80 | 1562.64 |
| TWD (nm) | 1563.855 | 1563.727 | 1563.642 | 1563.429 | 1563.216 | 1563.003 | 1562.79 | 1562.577 |
| WDD (nm) | 0.025 | 0.093 | 0.022 | 0.089 | 0.036 | 0.043 | 0.010 | 0.063 |
The variance can be written as
The standard deviation of wavelength is
The small variance denotes small fluctuation. That is, the difference
4.4 Temperature Response of the Sensor
As shown in Figure 6, the effect of temperature on the sensing performance was evaluated. When the temperature is between 20 °C and 45 °C, the effect of temperature on the sensor is very small. However, when the temperature is higher than 45 °C, the effect on the sensor becomes obvious. Therefore, the sensor is suitable for H2S detection in a small temperature range (20–45 °C).

Influence of temperature change on sensing performance.
4.5 Sensing Mechanism
Since the amino group (–NH2) can donate an electron on the rGO surface, amino functionalisation enhances the negative carrier concentration of rGO [38]. Because of the enhancement in charge density in NH2-rGO by the presence of amine groups on the surface, NH2-rGO behaves like a p-type semiconductor, which can act as an acceptor. As a reduced gas, H2S easily loses electron to the sensing film. After H2S is injected into the gas chamber and makes contact with the film surface, the film surface is considered to effect the migration of a small amount of electronic charge transfer at room temperature (Fig. 7), resulting in a change in thickness of the sensing film and hence a change in the RI of the film. Thus, the resonant wavelength will be shifted. When fresh air is introduced into the gas chamber, desorption occurs, and the negative carrier is transferred from the film to H2S.
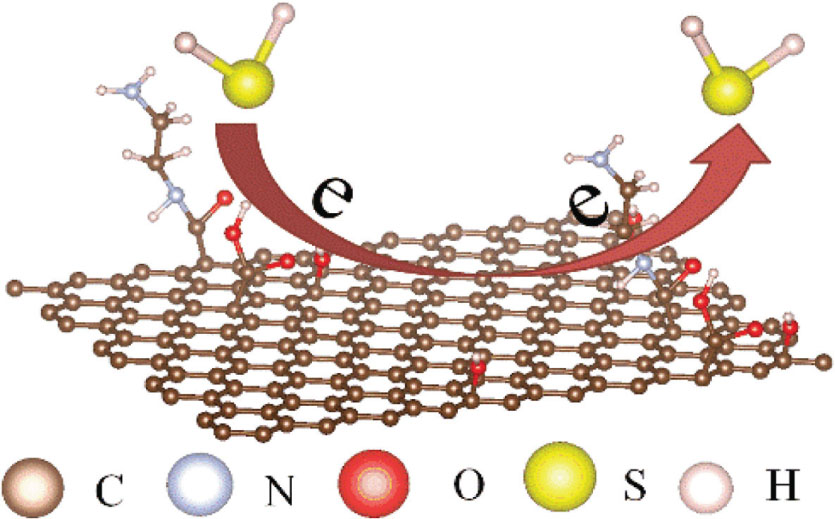
Sensing mechanism of the sensing film.
5 Conclusions
In summary, a novel hydrogen sulfide MI gas sensor was demonstrated based on NH2-rGO-coated TCF. With the increase in hydrogen sulfide concentration, the dip wavelengths of the interference spectra show a blue shift. The sensitivity is 21.3 pm/ppm and the linearity R2 is 0.98096 within the range 0–60 ppm H2S, and the LOD is 1.577 ppm. The response and recovery times are 72 and 90 s, respectively. The gas sensor has a small size, is easy to fabricate, and has high sensitivity and selectivity, and can be applied for environmental monitoring of toxic H2S.
Funding source: National Natural Science Foundation of China
Award Identifier / Grant number: 51574054
Funding source: University Innovation Team Building Program of Chongqing
Award Identifier / Grant number: CXTDX201601030
Funding source: Chongqing Science and Technology Bureau
Award Identifier / Grant number: cstc2017shmsA20017
Award Identifier / Grant number: cstc2018jcyjAX0294
Award Identifier / Grant number: CSTCCXLJRC20
Award Identifier / Grant number: CSTCCXLJRC 201905
Funding source: Postgraduate Research Innovation Project of CQUT
Award Identifier / Grant number: ycx2018258
Funding statement: This work was supported by the National Natural Science Foundation of China (Funder Id: http://dx.doi.org/10.13039/501100001809, Grant No. 51574054), the University Innovation Team Building Program of Chongqing (Grant No. CXTDX201601030), Chongqing Science and Technology Bureau (Grant Nos. cstc2017shmsA20017, cstc2018jcyjAX0294, CSTCCXLJRC20, CSTCCXLJRC 201905), and the Postgraduate Research Innovation Project of CQUT (Grant No. ycx2018258).
References
[1] A. Natkaeo, D. Phokharatkul, J. H. Hodak, A. Wisitsoraat, and S. K. Hodak, Sens. Actuators B: Chem. 260, 571 (2018).10.1016/j.snb.2017.12.134Suche in Google Scholar
[2] M. Nour, K. Berean, A. Chrimes, A. S. Zoolfaka, K. Latham, et al., J. Membr. Sci 470, 346 (2014).10.1016/j.memsci.2014.07.047Suche in Google Scholar
[3] N. Van Hoang, C. M. Hung, N. D. Hoa, N. Van Duy, and N. Van Hieu, J. Hazard. Mater. 360, 6 (2018).10.1016/j.jhazmat.2018.07.084Suche in Google Scholar PubMed
[4] H. H. Chen, X. Y. Gong, X. W. Liu, Z. Li, J. J. Zhang, et al., Sens. Actuators B: Chem. 281, 542 (2019).10.1016/j.snb.2018.10.086Suche in Google Scholar
[5] O. Yassine, O. Shekhah, A. H. Assen, Y. Belmabkhout, K. N. Salama, et al., Angew. Chem. Int. Ed. 55, 15879 (2016).10.1002/anie.201608780Suche in Google Scholar PubMed
[6] W. C. Zhou, K. W. Li, Y. L. Wei, P. Hao, M. B. Chi, et al., Biosens. Bioelectron. 106, 99 (2018).10.1016/j.bios.2018.01.061Suche in Google Scholar PubMed
[7] B. Q. Jiang, K. M. Zhou, C. L. Wang, Q. Z. Sun, G. L. Yin, et al., Sens. Actuators B: Chem. 254, 1033 (2018).10.1016/j.snb.2017.07.109Suche in Google Scholar
[8] X. G. Li, L. V. Nguyen, Y. Zhao, H. Ebendorff-Heidepriem, and S. C. Warren-Smith, Sens. Actuators B: Chem. 269, 103 (2018).10.1016/j.snb.2018.04.165Suche in Google Scholar
[9] B. Q. Wu, C. L. Zhao, B. Xu, and Y. N. Li, Sens. Actuators B: Chem. 255, 3011 (2018).10.1016/j.snb.2017.09.124Suche in Google Scholar
[10] X. Y. Huang, X. M. Li, Y. Li, J. C. Yang, and C. Y. Tao, Sens. Actuators B: Chem. 226, 7 (2016).10.1016/j.snb.2015.11.078Suche in Google Scholar
[11] J. Hromadka, B. Tokay, R. Correia, S. P. Morgan, and S. Korposh, Sens. Actuators B: Chem. 260, 685 (2018).10.1016/j.snb.2018.01.015Suche in Google Scholar
[12] P. P. Wang, K. Ni, B. W. Wang, Q. F. Ma, and W. J. Tian, Sens. Actuators B: Chem. 288, 75 (2019).10.1016/j.sna.2019.01.031Suche in Google Scholar
[13] R. Chu, C. Y. Guan, Y. T. Bo, J. H. Shi, Z. Zhu, et al., Sens. Actuators B: Chem. 284, 623 (2019).10.1016/j.snb.2019.01.011Suche in Google Scholar
[14] L. Y. Shao, Y. Luo, Z. Y. Zhang, X. H. Zou, B. Luo, et al., Opt. Commun. 336, 73 (2015).10.1016/j.optcom.2014.09.075Suche in Google Scholar
[15] A. L. Aldaba, V. González-Vila, M. Debliquy, M. Lopez-Amo, C. Caucheteur, et al., Sens. Actuators B: Chem. 254, 1087 (2018).10.1016/j.snb.2017.07.167Suche in Google Scholar
[16] C. R. Zamarreño, M. Hernáez, Del Villar, I. R. Matías, and F. J. Arregui, Sens. Actuators B: Chem. 155, 290 (2011).10.1016/j.snb.2010.12.037Suche in Google Scholar
[17] Z. Y. Li, Y. P. Wang, C. R. Liao, S. Liu, J. T. Zhou, et al., Sens. Actuators B: Chem. 199, 31 (2014).10.1016/j.snb.2014.03.071Suche in Google Scholar
[18] J. T. Zhou, Y. P. Wang, C. R. Liao, B. Sun, and J. He, Sens. Actuators B: Chem. 208, 315 (2015).10.1016/j.snb.2014.11.014Suche in Google Scholar
[19] A. Singh, Photon. Sens. 5, 172 (2015).10.1007/s13320-015-0222-7Suche in Google Scholar
[20] H. Lu, X. Wang, S. L. Zhang, F. Wang, and Y. F. Liu, Opt. Laser Technol. 101, 507 (2018).10.1016/j.optlastec.2017.11.014Suche in Google Scholar
[21] F. Wang, H. Zhu, Y. P. Li, H. H. Zhao, X. Wang, et al., Opt. Commun. 367, 286 (2016).10.1016/j.optcom.2016.01.077Suche in Google Scholar
[22] L. J. Li, Q. Ma, M. Y. Cao, G. N. Zhang, Y. Zhang et al., Sens. Actuators B: Chem. 234, 674 (2016).10.1016/j.snb.2016.05.045Suche in Google Scholar
[23] H. J. Park, W. J. Kim, H. K. Lee, D. Lee, J. Shin, et al., Sens. Actuators B: Chem. 257, 846 (2018).10.1016/j.snb.2017.11.032Suche in Google Scholar
[24] W. W. Li, X. Li, L. Cai, Y. L. Sun, M. X. Sun, et al., J. Nanosci. Nanotechnol. 18, 7927 (2018).10.1166/jnn.2018.15563Suche in Google Scholar
[25] N. Sharma, V. Sharma, S. K. Sharma, and K. Sachdev, Mater. Lett. 236, 444 (2019).10.1016/j.matlet.2018.10.145Suche in Google Scholar
[26] Y. Zhou, Y. D. Jiang, T. Xie, H. L. Tai, and G. Z. Xie, Sens. Actuators B: Chem. 203, 135 (2014).10.1016/j.snb.2014.06.105Suche in Google Scholar
[27] M. M. Alaie, M. Jahangiri, A. M. Rashidi, A. H. Asl, and N. Izadi, J. Ind. Eng. Chem. 29, 97 (2015).10.1016/j.jiec.2015.03.021Suche in Google Scholar
[28] K. Toda, R. Furue, and S. Hayami, Anal. Chim. Acta 878, 43 (2015).10.1016/j.aca.2015.02.002Suche in Google Scholar PubMed
[29] M. MalekAlaie, M. Jahangiri, A. M. Rashidi, A. Haghighi Asl, and N. Izadi, Mater. Sci. Semicond. Process. 38, 93 (2015).10.1016/j.mssp.2015.03.034Suche in Google Scholar
[30] Z. L. Song, Z. R. Wei, B. C. Wang, Z. Luo, S. M. Xu, et al., Chem. Mater. 28, 1205 (2016).10.1021/acs.chemmater.5b04850Suche in Google Scholar
[31] H. Lu, X. Wang, S. L. Zhang, F. Wang, and Y. F. Liu, Opt. Laser Technol. 101, 507 (2018).10.1016/j.optlastec.2017.11.014Suche in Google Scholar
[32] Q. Liu, A. M. Gao, Y. L. Huang, F. Y. Yi, H. H. Cheng, et al., J. Alloys Compd. 777, 1176 (2019).10.1016/j.jallcom.2018.11.108Suche in Google Scholar
[33] M. Divagar, A. Gowri, S. John, and V. V. R. Sai, Sens. Actuators B: Chem. 262, 1006 (2018).10.1016/j.snb.2018.02.059Suche in Google Scholar
[34] X. Qin, W. L. Feng, X. Z. Yang, J. J. Wei, and G. J. Huang, Sens. Actuators B: Chem. 272, 60 (2018).10.1016/j.snb.2018.05.152Suche in Google Scholar
[35] X. Y. Zhu, Y. C. Guo, H. Ren, C. Gao, and Y. Zhou, Sens. Actuators B: Chem. 248, 560 (2017).10.1016/j.snb.2017.04.030Suche in Google Scholar
[36] R. Tabassum, S. K. Mishra, and B. D. Gupta, Phys. Chem. Chem. Phys. 15, 11868 (2013).10.1039/c3cp51525gSuche in Google Scholar PubMed
[37] H. Zhou, J. Q. Wen, X. Z. Zhang, W. Wang, D. Q. Feng, et al., Phys. Procedia 56, 1102 (2014).10.1016/j.phpro.2014.08.023Suche in Google Scholar
[38] S. Rani, M. Kumar, R. Garg, S. Sharma, and D. Kumar, IEEE Sens. J. 16, 2929 (2016).10.1109/JSEN.2016.2524204Suche in Google Scholar
©2020 Walter de Gruyter GmbH, Berlin/Boston
Artikel in diesem Heft
- Frontmatter
- Dynamical Systems & Nonlinear Phenomena
- Bifurcation Analysis for Small-Amplitude Nonlinear and Supernonlinear Ion-Acoustic Waves in a Superthermal Plasma
- Propagation of Waves in a Nonideal Magnetogasdynamics with Dust Particles
- Delta-Shock Solution to the Eulerian Droplet Model by Variable Substitution Method
- Solitary Wave with Quantisation of Electron’s Orbit in a Magnetised Plasma in the Presence of Heavy Negative Ions
- Heat and Mass Transfer of Temperature-Dependent Viscosity Models in a Pipe: Effects of Thermal Radiation and Heat Generation
- Solid State Physics & Materials Science
- Michelson Interferometric Hydrogen Sulfide Gas Sensor Based on NH2-rGO Sensitive Film
- Insight into the Structural, Electrical, and Magnetic Properties of Al-Substituted BiFeO3 Synthesised by the Sol–Gel Method
- Theoretical Studies of the Defect Structures for Cu(en)32+ and Ru(en)33+ Clusters in Tris(Ethylenediamine) Complexes
- Thermodynamics & Statistical Physics
- A Framework for Sequential Measurements and General Jarzynski Equations