Neutron Activation Analysis of the Rare Earth Elements (REE) – With Emphasis on Geological Materials
-
Heinz-Günter Stosch


Abstract
Neutron activation analysis (NAA) has been the analytical method of choice for rare earth element (REE) analysis from the early 1960s through the 1980s. At that time, irradiation facilitieswere widely available and fairly easily accessible. The development of high-resolution gamma-ray detectors in the mid-1960s eliminated, formany applications, the need for chemical separation of the REE from the matrix material, making NAA a reliable and effective analytical tool. While not as precise as isotopedilution mass spectrometry, NAA was competitive by being sensitive for the analysis of about half of the rare earths (La, Ce, Nd, Sm, Eu, Tb, Yb, Lu). The development of inductively coupled plasma mass spectrometry since the 1980s, together with decommissioning of research reactors and the lack of installation of new ones in Europe and North America has led to the rapid decline of NAA.
1 Introduction
The principle of neutron activation analysis (NAA) was proposed by von Hevesy and Levi in 1936, following the detection of the neutron by James Chadwick in 1932 [1, 2]. The practical application of NAA, of course, had to await the development of neutron-generating devices, in particular the nuclear reactor, after World War II, which made high neutron fluxes (1012 cm−2 s−1 and above) available for analytical purposes. For more than 20 years, from the mid-1960s to the late 1980s, NAA remained the most widely employed method for the analysis of the rare earth elements (REEs) as well as a number of other elements, present at the trace element level in geological and biological materials. An excellent account of the state of NAA towards the end of this period is provided by Potts [3]. A web page with much useful information is maintained by Kubešová [4].
2 Principles of neutron activation: activation equation, cross sections
An atomic nucleus that is hit by a neutron (n) may undergo a variety of nuclear reactions, depending upon the energy of the neutron. At low-to-intermediate kinetic energies, below about one million electron volts (MeV), (n, γ) reactions prevail, meaning that the neutron is captured by the nucleus which then emits a γ-ray. Higher kinetic energies of the neutron cause reactions such as (n, p), by which the neutron is captured and a proton p is emitted, or (n, α), which indicates that an α-particle (a helium nucleus) is emitted. As neutrons do not carry an electric charge, they experience no repulsion by an atomic nucleus. For this reason, neutrons with very small kinetic energies can be captured by a nucleus. In fact, neutrons, thermal are most commonly utilized in NAA. Thermal neutrons carry kinetic energies less than about 0.1 eV (1eV = 1.602 × 10⁻¹⁹ J). Using the relation E = kB × T, where kB is Boltzmann’s constant (8.617 × 10⁻⁵ eV K−1), we calculate that a temperature of 300 K corresponds to an energy of just 0.026 eV.
If a target which contains atomic nuclei of kind X is exposed to a beam of neutrons (or other particles), the number N of nuclei Y, formed by a reaction, can be calculated:
where dNY/dt is the production rate of Y, σ is the cross section, neutron (cm2), Φ is the neutron flux (cm−2 s−1), assumed to remain constant across the target, and NX the number of nuclei X, also assumed to remain essentially constant. The cross section σ indicates the probability of the reaction to occur. It is commonly associated with the apparent cross section of nucleus A for a neutron that approaches the nucleus. Historically, the word “barn, neutron cross section” has been coined as the unit for the cross section where 1 barn (b) = 10−24 cm2; 1 b corresponds approximately to the cross section of a uranium nucleus. For thermal neutrons, σ decreases approximately as a function of 1/v, where v is the speed of the neutron. The slower the neutron is, the larger is the probability that it is captured by a nucleus. Above the thermal energy range, there is the range of epithermal energies up to about 100 eV. This range is characterized by sharp increases in σ at well-defined energies that correspond to resonances, the formation of a compound nucleus in discrete excited states (Figure 1) [5].
![Figure 1: Dependence of the neutron-absorption cross section σ upon the neutron energy displaying the decrease of σ with neutron energy for thermal neutrons and neutron capture resonances at epithermal energies (redrawn from De Soete et al. [5]). 103Rh displays a strong resonance at an energy of 1.26 eV (and more resonances at higher energies). This corresponds to an excited state of the compound nucleus 104Rh, which forms with a high probability when natural rhodium is irradiated with neutrons with appropriate energy. This compound nucleus decays rapidly (≈4 × 10⁻¹⁵ s by γ-emission into 104mRh and 104Rh, which both are radioactive and decay by β− emission into stable 104Pd.](/document/doi/10.1515/psr-2016-0062/asset/graphic/j_psr-2016-0062_fig_001.jpg)
Dependence of the neutron-absorption cross section σ upon the neutron energy displaying the decrease of σ with neutron energy for thermal neutrons and neutron capture resonances at epithermal energies (redrawn from De Soete et al. [5]). 103Rh displays a strong resonance at an energy of 1.26 eV (and more resonances at higher energies). This corresponds to an excited state of the compound nucleus 104Rh, which forms with a high probability when natural rhodium is irradiated with neutrons with appropriate energy. This compound nucleus decays rapidly (≈4 × 10⁻¹⁵ s by γ-emission into 104mRh and 104Rh, which both are radioactive and decay by β− emission into stable 104Pd.
Neutron capture of an atomic nucleus results in the formation of an isotope of the same element in an excited state. A prompt γ-ray is released immediately and carries away part or all of the excitation energy, depending upon the existence and stability of excitation levels. Prompt γ-ray NAA is one of the methods of neutron activation. It requires the detector to be set up close to the neutron source, for example, a reactor. It may be the method of choice if only stable isotopes of an element are produced during neutron irradiation or if only radioactive isotopes with very short half-lives are generated. Among the REEs, only Sm and Gd can be reasonably well analysed at normal concentrations in rock samples [6]; prompt γ-ray NAA will not further be considered here.
In many cases, Y is a radioactive isotope that decays with its characteristic half-life t½ into a stable isotope or into another radioactive isotope of a different element. The β− decay results in the formation of an element with a higher atomic number Z + 1 by emission of an electron or to an isotope of an element with a lower atomic number Z − 1 by the nucleus capturing an orbiting electron, more rarely by emission of a positron from the nucleus (β+ decay), for example,
where ɛ denotes electron capture, h and d time in hours and days, respectively. Half-life and decay constant λ are related by
At least part of the decays by β−, β+ or electron capture results in the formation of a nucleus in an excited state. The excitation energy is immediately released by emission of one or more γ-rays with characteristic energies. These γ-rays are registered and evaluated in NAA.
A decay scheme is used to illustrate the decay of a radioactive isotope. This is illustrated in a simplified form in Figure 2 for the decay of 140La into stable 140Ce. Almost all β− decays go into excited levels of 140Ce which decay through γ-ray emission. The four strongest decays at 328.8, 487.0, 815.8 and 1,596.6 keV are most suitable for γ-ray counting.
![Figure 2: Decay of radioactive 140La into stable 140Ce. β− decays to various excited states andto the ground state of 140Ce are displayed by green arrows; decay of the various excited statesby γ-emission is shown by dark blue arrows. Levels of excited states of 140Ce are shown in lightblue. The total decay energy between the ground state of 140La and the ground state of 140Ceamounts to 3,762 keV. More than 99 % of all β− decays end up at excited levels of 140Cewhich release their excitation energies through γ-emission. Values in parentheses are γ-rayabundances per 100 β− decays. Modified after Ref. [7].](/document/doi/10.1515/psr-2016-0062/asset/graphic/j_psr-2016-0062_fig_002.jpg)
Decay of radioactive 140La into stable 140Ce. β− decays to various excited states andto the ground state of 140Ce are displayed by green arrows; decay of the various excited statesby γ-emission is shown by dark blue arrows. Levels of excited states of 140Ce are shown in lightblue. The total decay energy between the ground state of 140La and the ground state of 140Ceamounts to 3,762 keV. More than 99 % of all β− decays end up at excited levels of 140Cewhich release their excitation energies through γ-emission. Values in parentheses are γ-rayabundances per 100 β− decays. Modified after Ref. [7].
If nuclide Y, produced according to eq. (1), is radioactive, it will start to decay during neutron irradiation and we must subtract its rate of decay
from eq. (1) which gives:
Assuming that NX remains essentially constant during irradiation and that NY = 0 at the beginning of irradiation, the integration of this equation provides
with t being the duration of irradiation and NY being the number of radioactive nuclei at the end of irradiation. As NAA counts the number of decays within a defined period of time, it is convenient to replace NY by the activity AY, where A = λ × N. We then obtain
Typical irradiation times range from seconds to several days. For a given nuclide 50 % of the maximum activity is reached after irradiating the sample for one half-life, 90 % are reached after 3.3 half-lives. After the end of irradiation, the induced activity decays away as a function of decay time td:
After seven half-lives less than 1 % of the original activity is still present; this represents an approximate limit where a nuclide can be quantitatively measured with an acceptable precision. In a natural sample such as a piece of rock, many radioactive nuclides with different half-lives will be produced during irradiation. A nuclide with a short half-life, such as 165Dy (2.35 h), has reached its saturation activity after an irradiation time of one day whereas a nuclide with a long half-life such as 160Tb (72.3 d) has achieved only about 1 % at that time (Figure 3). Whereas the activity of 165Dy must be counted within about 12 h after the end of irradiation, the activity of nuclides with long half-lives is counted much later when all short-lived activities have decayed. In practice, it is preferable to split the sample, irradiate one split for a short time (minutes) and count the induced activities of the short-lived nuclides within less than a day after the end of irradiation, and irradiate the second split for a longer time (hours to days) and let the short-lived activities decay before counting the activities of the long-lived nuclides.
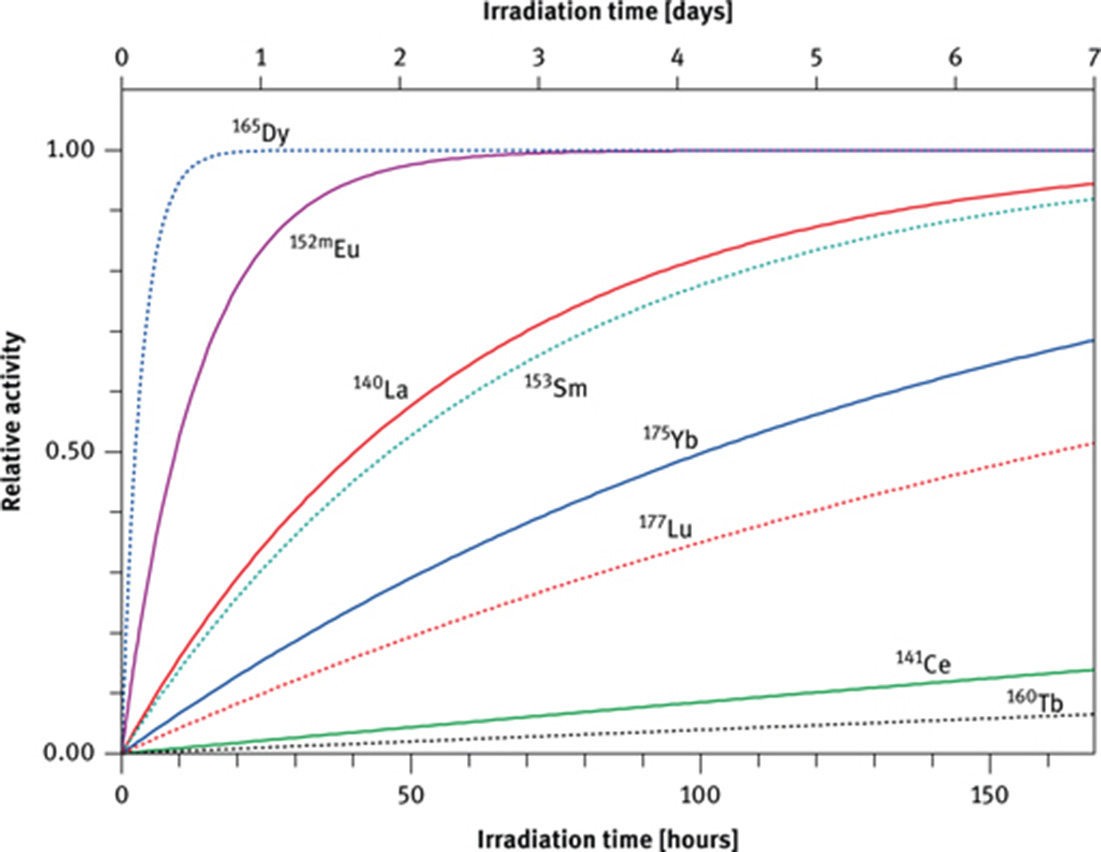
The saturation factor, NAA (1 − e−λ×t) as a function of irradiation time for nuclides of the REE with different half-lives.
Normally, NAA is used as a relative method; this eliminates the need to precisely know the value of the neutron flux Φ (and flux variations) as well as the cross section σ. Instead, single- or multi-element standards are irradiated together with the samples of interest (see Section 4.2). However, considerable efforts have also been undertaken to develop the single-comparator method where only one element or isotope, in particular 197Au, is required for standardization [8, 9, 10].
3 Equipment
3.1 Neutron sources
Obviously, NAA depends upon the availability of powerful neutron sources. By far the most important source is the fission reactor. Other sources are accelerators and the bombardment of light nuclei by α- or γ-rays.
3.1.1 The fission reactor
Research fission reactors produce neutrons through fission of 235U by using uranium fuel enriched in this isotope. 235U is fissionable by thermal neutrons with a high (n, f) cross section of 586 b (f = fission). Fission of 235U produces two large fragments plus, on average, 2.5 neutrons that are required to entertain a chain reaction. Schematically, the fission reaction can be written as
with X and Y denoting the two fragments with mass A and atomic number Z and ν being the number of neutrons generated per reaction, for example,
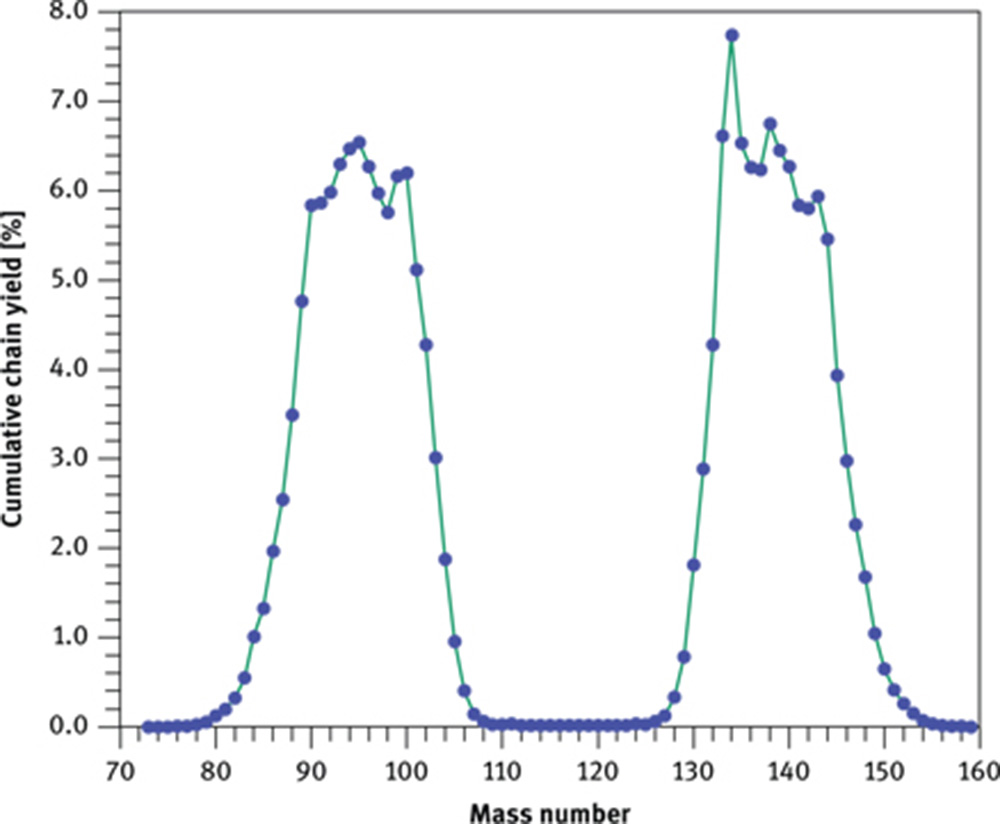
Cumulative chain yield for the fission of 235U with thermal neutrons as afunction of mass number. Because fission of one 235U yields two heavy fragments, thesum of the yields equals 200 %.
The two to three neutrons released during fission of 235U are neutrons, fast that, on average, carry away a total energy of about 5 MeV. Before they can be absorbed by another 235U nucleus or be utilized for standard NAA, they must be thermalized through elastic collisions with a moderator, that is, with nuclei of light elements, in particular hydrogen, carbon and oxygen until equilibrium is achieved with the thermal motion of the moderator. Current research reactors reach thermal neutron flux densities between about 1012 and 1015 n cm−2 s−1.
In 2012, there were about 382 research reactors in operation worldwide [13] with many facing decommissioning within a few years. In Germany, for example, there are currently only three research reactors left (Berlin, Mainz and Munich) whereas some 40 years ago there were about a dozen in operation. It is evident, therefore, that today NAA is of little importance in this country and many others as small new neutron generating facilities, in particular neutron generators, are still in the state of development.
3.1.2 Accelerators, neutron generators, isotopic neutron sources
Accelerator-generated neutrons have been employed in NAA since the 1970s. Charged particle accelerators (cyclotron, linear accelerator, Van de Graaff accelerator) can be used to bombard isotopes of light elements with deuterium, causing reactions such as [5]
9Be(d, n) 10B
7Li(d, n) 8Be
2H(d, n) 3He (also called the d–d reaction)
3H(d, n) 4He (also called the d–t reaction)
(d, n) denotes that the target (isotopes of Be, Li, H) is bombarded with deuterons leading to the formation of a compound nucleus which emits a neutron and decays into isotopes of B, Be and He.
The last three reactions provide monoenergetic neutrons or nearly so. The d–d and the d–t reactions generate high neutron yields already at low bombarding energies and therefore are particularly useful to manufacture neutron generators with small footprints (in principle, tabletop machines) and thus have been in the focus of research in recent years [13, 14]. The d–d fusion reaction currently is capable of producing 1010 n s−1 using a neutron generator in which a deuterium beam, produced with a radio-frequency generated plasma and 100–140 kV of acceleration voltage is focused on a target, commonly metal hydride [15, 16]. However, the maximum thermal neutron flux at sample position was only 2 × 10⁷ n cm−2 s−1, insufficient for trace element analysis. The d–d reaction is being explored for prompt γ-ray NAA as well as for standard NAA. Deuterium (2H) has the advantage over tritium (3H) to be easily available and stable whereas the latter is radioactive (half-life 12.3 years [a]) and must be manufactured through nuclear reactions. Neutron generators employing the d–d reaction contain no radioactivity and thus are safe when switched off. The d–t reaction produces high-energy neutrons (14.7 MeV). Such fast neutrons may be employed in the determination of light elements like carbon, nitrogen and oxygen through (n, p), (n, α) and (n, 2n) reactions; these elements are not well activated by (n, γ) reactions [17].
Isotopic neutron sources have been (and are) of little importance in NAA due to rather low neutron intensities of less than 107 n s−1 [13]. They require an α-emitting radioactive source such as 241Am (half-life 432.2 a) or 226Ra (1600 y) and a target, in particular Be, to induce (α, n) reactions, for example, 9Be(α, n) 12C. Photon activation using a radioactive source of high-energy γ-rays, in particular 124Sb (half-life 60.3 d) is essentially limited to the analysis of Be through the reaction 9Be(γ, n) 8Be where the latter instantaneously disintegrates into two 4He atoms. Upon decaying into 124Te, 124Sb emits a γ-ray of energy 1.69 MeV which is just barely energetic enough to induce the (γ, n) reaction on 9Be that requires a threshold energy of 1.67 MeV. Almost all other (γ, n) reactions have threshold energies in excess of 8 MeV [5]. Photons exceeding this energy are produced as bremsstrahlung by firing a high-energy electron beam from an accelerator on a target metal. In this way, some REE can be analysed by photon activation in geological and biological materials if present at concentration levels of tens of ppm [18].
3.2 The counting system
A NAA counting system consists of a detector and the pulse-processing electronics. The latter comprises preamplifier, main amplifier, a multichannel analyser that includes an analogue-to-digital converter and an output device (computer) (Figure 5) [3]. The amplifiers are required to amplify the small signal registered in the detector and to achieve a high signal-to-noise ratio. The multichannel analyser sorts and stores the incoming signals as a function of γ-ray energy. Evaluation of the spectra (calculation of photopeak areas) is carried out by dedicated software on a computer.
![Figure 5: Schematic sketch of an NAA counting system (modified after [3]).](/document/doi/10.1515/psr-2016-0062/asset/graphic/j_psr-2016-0062_fig_005.jpg)
Schematic sketch of an NAA counting system (modified after [3]).
3.2.1 Detectors
During the early years of NAA the most suitable detector was a scintillation detector, commonly a big transparent single crystal (or polycrystalline material) of NaI doped with Tl as an activator (order of 0.1 mol%), connected to a photocathode and a photomultiplier. The energy of γ-rays entering such a crystal is absorbed and transferred to electrons which are caught by the activator. A tiny flash of light is then emitted during transition from the excited to the ground state. The light is converted to an electric signal by the photocathode and the signal is amplified by a photomultiplier. The advantage of the Tl-doped NaI detector is that the crystals are fairly easy to grow from the melt to large sizes [19]. Sizes of 3 in. (diameter) by 3 in. (height) were the standard in the 1960s. They were able to register a large fraction of the incoming γ-rays. In contrast to semiconducting diodes, they also can be operated at ambient temperatures. The main disadvantage of the Tl-doped NaI detector is its poor energy resolution. NAA of the REE in geological materials at that time required the chemical separation of each REE using time-consuming ion-exchange techniques [20]. NaI scintillation detectors are still used today when it is important to detect as large a fraction of the incoming γ-rays as possible, for example, in nuclear medicine or environmental sciences.
The high-resolution Ge semiconductors that are used today were developed in the early 1960s [21, 22]. Ge has a higher atomic number than Si that is used as detector material in X-ray fluorescence and therefore Ge is much better suited to stop the high-energy γ-rays. Moreover, to create an electron–hole pair requires only an energy of 2.95 eV at the operating temperature of about 80 K (3.72 eV in Si at the same temperature). Absorption of a 1-MeV γ-ray will then create about 3.4 × 10⁵ electrons equivalent to a charge of 5.7 × 10⁻¹⁴ C [3]. Until the 1980s, the process of growing germanium left unacceptably high levels of impurity inside the crystal which acted as p-type (“positive holes” in the valence band, due, for example, to atoms with three valence electrons instead of the four in germanium, causing the formation of acceptor levels in the forbidden energy region between valence band and conduction band) or n-type semiconductors (negative charges, e.g. by atoms with five valence atoms, forming donor levels). Such impurities cause conduction of the germanium under an electrostatic field even in the absence of ionizing radiation. In order to compensate for this effect, Li, which enters interstitial sites in the Ge, was diffused into a cylinder of p-type Ge, leaving only the central part of the cylinder as a p-type semiconductor [3]. These crystals were thus called coaxial Ge(Li) detectors. As lithium diffuses fairly rapidly through germanium at room temperature, these crystals had always to be cooled to the temperature of liquid nitrogen, even if not in use. High-purity Ge became gradually available during the 1970s, initially as small crystals only, eliminating the need of Li drifting. These crystals were first used to manufacture “planar” (disc-shaped) Ge detectors with a typical volume of ≤ 100 cm3 and an active area of 0.X mm2 that were employed in the detection of low-energy γ-rays (≈60–250 keV). The maximum volume of high-purity Ge detectors has increased about linearly from the mid-1970s (less than 100 cm3) to about 800 cm3 in 2003 [23], thus permitting the fabrication of detectors for any need.
The quality of a detector is judged by its efficiency, of a detector to detect a signal as well as its resolution. The absolute efficiency is the fraction of γ-rays emitted from a sample that cause an event in the detector. This parameter is strongly dependent upon the geometry, in particular the distance between sample and detector, as the sample will emit photons isotropically in all directions (Figure 5). More important is the relative efficiency which permits a comparison to be made between different detectors. Relative efficiency is the relative photopeak efficiency (total absorption of a γ-ray in the crystal by the photoelectric effect, see below) of a detector compared to that of a 3 in. × 3 in. NaI(Tl) detector at an energy of 1,333 keV (60Co) and a distance of 25 cm between source and detector [24]. Obviously, relative efficiency increases with the volume of the detector and values of more than 100 % are nowadays reached for high-purity Ge detectors. The efficiency decreases with γ-energy, above about 300 keV approximately proportional to E−0.5. A large Ge(Li) or Ge detector possesses a maximum efficiency at about 100 keV and it decreases by about one order of magnitude at 1,333 keV. A planar Ge detector has a maximum efficiency below about 50 keV and it decreases by about one order of magnitude at 200 keV.
The resolution, of a detector is reported as full width at half maximum (FWHM), that is the width of a peak at half its maximum intensity. For coaxial Ge(Li) and big high-purity Ge detectors, resolution is usually specified for the 1,333 keV line of 60Co (see Figure 6), either as an absolute value in keV or as a relative one (100 × FWHM divided by the energy of the γ-peak). For planar Ge detectors resolution is reported for the 122.1 keV γ-peak of 57Co or the 121.8 keV peak of 152Eu. In the former case, resolution is about 2 keV absolute or 0.15 relative, 20–30 times better than the resolution of a NaI(Tl) detector, in the latter case it may be about 0.55 keV absolute or 0.45 % relative. As high-energy γ-rays are much less likely to be absorbed in a planar Ge detector than in a high-volume Ge detector, the Compton background (see next section) is much diminished which makes the planar detector the detector of choice for detecting γ-rays with energies below ≈150 keV.
![Figure 6: The high-energy part of a γ-ray spectrum of 60Co showing the superior energy resolution of a Li-drift Ge detector over a Tl-doped NaI scintillation detector [21]; keV = 1,000 eV. The resolution of the Ge(Li) detector is shown for the 1,333 keV γ-ray (FWHM = full width at half maximum).](/document/doi/10.1515/psr-2016-0062/asset/graphic/j_psr-2016-0062_fig_006.jpg)
The high-energy part of a γ-ray spectrum of 60Co showing the superior energy resolution of a Li-drift Ge detector over a Tl-doped NaI scintillation detector [21]; keV = 1,000 eV. The resolution of the Ge(Li) detector is shown for the 1,333 keV γ-ray (FWHM = full width at half maximum).
3.2.2 Interaction of electromagnetic radiation with matter
The absorption, of radiation of X-rays or γ-rays by matter follows an exponential relation:
where I0 is the initial intensity of the photon beam, I is the remaining intensity after having travelled distance d (cm) through matter and μ (cm−1) is the absorption coefficient. The latter is the sum of three terms, the photoelectric effect, the Compton effect and the pair-production effect, plotted for Ge and Si in Figure 7.
![Figure 7: Linear absorption coefficients for germanium and silicon plotted against γ-rayenergy. μ∑ is the sum of the three individual terms (plotted with data extracted fromRef. [25]). μ∑ is equal to μ in eq. (7).](/document/doi/10.1515/psr-2016-0062/asset/graphic/j_psr-2016-0062_fig_007.jpg)
In the photoelectric effect the entire energy of the photon is transferred to an orbital electron, in about 80 % of cases to a K electron and in 20 % to an L electron [5]. The energy of the electron corresponds to the energy of the photon minus the binding energy of the electron. Instantaneously an electron from the next higher shell fills the gap, thus emitting a characteristic X-ray. The energies of the photoelectron and the X-ray are absorbed by ionization of detector atoms. There is a small probability for the X-ray to escape from the detector, thus giving rise to an “escape peak” with an energy of the original photon minus the energy of the X-ray. The photoelectric effect is most important for atoms with high atomic number and low photon energies (Figure 7). It is essentially these photons that are of interest in NAA.
The Compton effect is the result of elastic scattering between a photon and an electron, most likely an outer orbital one, of the interacting atom. Only part of the energy of the photon is transferred to the electron, thereby reducing the energy of the photon that is deflected at an angle ϑ relative to its incident direction. The energy of the scattered photon is dependent upon ϑ [5]:
where Eγ is the energy of the photon after collision, E0 is the energy of the photon prior to collision and m0 × c2 is the rest mass of the electron (9.109 × 10−31 kg × 299,792,4582 m2 s−2 = 8.187 × 10⁻¹⁴ J or 511 keV as 1 eV = 1.602 × 10⁻¹⁹ J). Eγ attains its maximum for ϑ = 0 (Eγ = E0) and its minimum value for ϑ = 180∘ (E0/[1 + 2E0/(m0 × c2)]). For ϑ = 180, the maximum energy of the Compton electron
will then be
As Eγ may vary continuously between its minimum and maximum values, so may the energy of the Compton electron Ee between the value calculated from eq. (9) and zero. The scattered photon can undergo further Compton interactions, be totally absorbed by the photoelectric effect or escape from the detector. If only the energy of the scattered electron is absorbed in the detector whereas the scattered photon escapes, it contributes to the Compton continuum, a region with an undesired high background in a γ-spectrum. For the 1,333 keV γ-ray of 60Co, eq. (9) provides a value of 1,119 keV; this is called the Compton edge (see Figure 6). Similarly, the 1,173 keV line of 60Co produces a Compton edge at 949 keV and a Compton continuum below that value. {γ-Ray} absorption due to the Compton effect dominates μ at intermediate energies and also decreases with energy, but less steeply so than the photoelectric effect (Figure 7).
At very high energies of the γ-rays the pair production effect begins to dominate μ, for Ge in excess of about 10 MeV (Figure 7). Such a photon can interact with the strong electromagnetic field of an absorber nucleus to produce an electron–positron pair. The minimum energy of the photon that can give rise to pair production equals the rest masses of electron plus positron (511 keV each), that is 1,022 keV. Excess energies of the incident photon will be shared as kinetic energy by electron and positron. After the positron has lost its kinetic energy, it annihilates by reaction with another electron, generating two 511 keV γ-rays. These photons may subsequently be absorbed through the photoelectric effect or the Compton effect.
4 Practical considerations
4.1 Instrumental versus radiochemical NAA
Two types of NAA are commonly distinguished, instrumental NAA (INAA) and radiochemical NAA (RNAA). In Instrumental neutron activation analysis (INAA) γ-ray counting is carried out after neutron irradiation without further manipulation of the sample, except, maybe, of re-packaging. As NAA is a true multi-element method, for a rock like basalt INAA typically permits the analysis of about 15–20 elements (Na, Sc, Cr, Mn, Fe, Co, Sb, Cs, La, Ce, Nd, Sm, Eu, Tb, Yb, Lu, Hf, Ta, Th, U), depending upon their concentration.
In Radiochemical neutron activation analysis (RNAA), the sample is chemically treated after irradiation in order to separate the element(s) of interest from the matrix prior to counting of the photopeaks. This, of course, requires access to a laboratory where radiochemistry can be carried out. Apart from taking time, this generates additional radioactive waste, in particular in liquid form. All REE are, in principle, accessible to RNAA.
Figure 8 shows the naturally occurring REE nuclides together with those employed in NAA. Table 1 provides additional information on cross sections for neutron absorption and γ-lines that can be evaluated for analysis (analytical photopeak data from Refs [29, 30]; other data from Refs [11, 31]). In natural rocks, where the light REE (La–Nd) are present at the 101 or even 102 ppm level and the heavy REE (Ho–Lu) at the 100 ppm level, the elements La, Ce, Nd, Sm, Eu, Tb, Yb and Lu can normally be analysed by INAA whereas Pr and Er can only be measured after REE separation from the matrix activity. Due to the short half-life of 165Dy (2.35 h), Dy can only be measured after a separate short (few minutes) irradiation and immediate transport of the activated samples from the reactor to the laboratory for γ-ray counting which must be finished within about five half-lives when the induced activity has decayed to about 3 % of the value at the end of irradiation. This short irradiation is also beneficial for the determination of 166Ho the signal of which is severely enhanced by second-order activation of 164Dy in irradiations of long duration (Section 4.5).
![Figure 8: Excerpt from the chart of the nuclides [11] showing isotopes, naturally occurring isotopes, radioactive, used in NAA of the REE and Hf in black and radioactive ones employed in NAA in various colours. Small fractions (<5 %) of 142Pr, 154Eu and 170Tm also decay by electron capture to 142Ce, 154Sm and 170Er, respectively. Whereas La, Ce, Nd, Sm, Eu, Tb, Yb and Lu can commonly be analysed by INAA in geological samples, the analysis of Pr and Er always requires RNAA (see also Table 1). Among the naturally occurring REE nuclides, some are very weakly radioactive and form the basis of decay systems that are used in geochronology and isotope geochemistry: 147Sm decays, with a half-life of 106 × 109 years, by α-emission into 143Nd [26]. 176Lu decays by β− emission into 176Hf (half-life 37.2 × 10⁹ years [27]. 138La undergoes a branched decay, by electron capture into 138Ba and by β− emission into 138Ce; only the latter is of some importance (partial decay constant λβ ≈ 2.37 × 10⁻¹² a−1 [28]).](/document/doi/10.1515/psr-2016-0062/asset/graphic/j_psr-2016-0062_fig_008.jpg)
Excerpt from the chart of the nuclides [11] showing isotopes, naturally occurring isotopes, radioactive, used in NAA of the REE and Hf in black and radioactive ones employed in NAA in various colours. Small fractions (<5 %) of 142Pr, 154Eu and 170Tm also decay by electron capture to 142Ce, 154Sm and 170Er, respectively. Whereas La, Ce, Nd, Sm, Eu, Tb, Yb and Lu can commonly be analysed by INAA in geological samples, the analysis of Pr and Er always requires RNAA (see also Table 1). Among the naturally occurring REE nuclides, some are very weakly radioactive and form the basis of decay systems that are used in geochronology and isotope geochemistry: 147Sm decays, with a half-life of 106 × 109 years, by α-emission into 143Nd [26]. 176Lu decays by β− emission into 176Hf (half-life 37.2 × 10⁹ years [27]. 138La undergoes a branched decay, by electron capture into 138Ba and by β− emission into 138Ce; only the latter is of some importance (partial decay constant λβ ≈ 2.37 × 10⁻¹² a−1 [28]).
Information on isotopes, naturally occurring isotopes, radioactive, used in NAA reaction cross sections and analytical photopeaks for the REE, Y and some other elements that are commonly analysed by INAA.
Element | Isotope mass number | Nat. abundance (at%) | Activation cross section [b] | Product isotope | Half-lifea | Analytical photopeaks [keV]b | Decay product(s) | Method | Irradiation timec | Comment |
La | 139 | 99.91 | 9 | 140La | 40.272 h | 328.75 (21.3), 487.03 (45.7), 815.8 (23.6), 1,596.2 (96.0) | 140Ce | INAA, RNAA | Short, long | |
Ce | 140 | 88.48 | 0.58 | 141Ce | 32.5 d | 145.45 (49.3) | 141Pr | INAA, RNAA | Long | |
Pr | 141 | 100 | 11.5 | 142Pr | 19.13 h | 1,575.9 (3.7) | 142Nd | RNAA | Long | 4 b for formation of metastable 142Pr which decays into ground state with half-life of 14.6 min; 7.5 b for formation of 142Pr in ground state |
Nd | 146 | 17.19 | 1.4 | 147Nd | 10.98 d | 91.10 (28.3), 531.0 (13.5) | →147Pm →147Sm | INAA, RNAA | Long | |
Sm | 152 | 26.7 | 206 | 153Sm | 46.27 h | 103.18 (28.2) | 153Eu | INAA, RNAA | Short, long | |
Eu | 151 | 47.8 | 3,150 | 152mEu | 9.3 h | 121.78 (9.0), 841.6 (13.0), 963.5 (12.0) | 152Gd (72 %), 152Sm (28 %) | INAA, RNAA | Short | 152mEu is a metastable state of 152Eu |
151 | 47.8 | 6,000 | 152Eu | 13.33 a | 121.78 (33.2), 344.27 (31.4), 778.85 (15.2), 964.0 (17.3), 1,407.92 (24.3) | 152Gd (27.9 %), 152Sm (72.1 %) | INAA, RNAA | Long | ||
Gd | 152 | 0.20 | 900 | 153Gd | 239.47 d | 97.50 (30.0), 103.20 (22.5) | 153Eu | RNAA, rarely INAA | Long | |
Tb | 159 | 100 | 23.1 | 160Tb | 72.3 d | 86.79 (20.9), 298.54 (35.0) | 160Dy | INAA, RNAA | Long | |
Dy | 164 | 28.2 | 2,700 | 165Dy | 2.35 h | 94.60 (4.0) | 165Ho | RNAA, rarely INAA | Short | 1,700 b for formation of metastable 165mDy which decays into the ground state with a half-life of 1.3 min; 1,000 b for formation of 165Dy |
165 | 0 | 5,500 | 166Dy | 81.5 h | 82.45 (12.0) | 166Ho | RNAA | Long | 2,000 b for neutron capture of 165mDy, 3,500 b for neutron capture of 165Dy in the ground state | |
Ho | 165 | 100 | 61 | 166Ho | 26.8 h | 80.60 (5.4) | 166Er | RNAA, rarely INAA | Long, short | |
Er | 170 | 14.9 | 6 | 171Er | 7.52 h | 111.60 (25.0), 124.03 (11.0), 295.90 (28.0), 308.30 (63.0) | 171Tm →171Yb | RNAA | Long, short | |
Tm | 169 | 100 | 105 | 170Tm | 128.6 d | 84.26 (10.0) | 170Yb | RNAA, rarely INAA | Long | |
Yb | 168 | 0.13 | 2,400 | 169Yb | 32 d | 63.50 (45.0), 110.00 (18.0), 130.70 (11.0), 177.00 (22.0), 197.80 (40.0), 307.50(10.0) | 169Tm | INAA, RNAA | Long | |
174 | 31.8 | 100 | 175Yb | 4.2 d | 113.50 (1.9), 282.60 (3.7), 396.10 (6.0) | 175Lu | INAA, RNAA | Long, short | ||
Lu | 176 | 2.59 | 1,780 | 177Lu | 6.71 d | 112.96 (6.5), 208.34 (11.0) | 177Hf | INAA, RNAA | Long, short | |
Y | 89 | 100 | 1.25 | 90Y | 64.1 h | 1,760.7 (0.02) | 90Zr | (RNAA) | No useful γ-rays; requires β− counting | |
Na | 23 | 100 | 0.53 | 24Na | 14.96 h | 1,368.6 (100), 2,754.1 (98.85) | 24Mg | INAA | Short, long | |
Sc | 45 | 100 | 27 | 46Sc | 83.82 d | 889.3 (100), 1,120.5 (100) | 46Ti | INAA | Long | |
Cr | 50 | 4.345 | 16 | 51Cr | 27.7 d | 320.1 (9.8) | 51V | INAA | Long | |
Mn | 55 | 100 | 13.3 | 56Mn | 2.58 h | 846.6 (99.0), 1,811.2 (30.0), 2,112.6 (15.5) | 56Fe | INAA | Short | |
Fe | 58 | 0.28 | 1.3 | 59Fe | 44.503 d | 142.54 (0.81), 192.23 (2.80), 1,099.27 (56.0), 1,291.58 (44.0) | 59Co | INAA | Long | |
Co | 59 | 100 | 37.2 | 60Co | 5.272 a | 1,173.23 (99.88), 1,332.52 (100) | 60Ni | INAA | Long | |
Sb | 123 | 42.64 | 4.06 | 124Sb | 60.3 d | 602.71 (98.1), 722.78 (10.8), 1,691.04 (50.0) | 124Te | INAA | Long | |
Cs | 133 | 100 | 29 | 134Cs | 2.06 a | 569.33 (15.8), 604.7 (98.0), 795.79 (89.0) | 134Ba | INAA | Long | |
Hf | 180 | 35.1 | 13 | 181Hf | 42.39 d | 133.05 (41.0), 136.25 (6.9), 345.95 (12.0), 482.16 (83.0) | 181Ta | INAA | Long | |
Ta | 181 | 99.988 | 20 | 182Ta | 114.43 d | 100.10 (11.9), 152.44 (7.1), 222.11 (7.98), 1,121.19 (37.0), 1,188.95 (17.1), 1,221.31 (28.9), 1,230.93 (12.1) | 182W | INAA | Long | |
Th | 232 | 100 | 7.37 | 233Pa | 27 d | 98.44 (13.5), 111.0 (4.85), 300.11 (6.6), 311.9 (38.0), 340.47 (4.43) | 233U | INAA | Long | 233Th decays with a half-life of 22.3 m to 233Pa which has a half-life of 27.0 d |
U | 238 | 99.2745 | 2.7 | 239Np | 2.355 d | 99.5 (11.0), 103.7 (18.0), 106.13 (21.06), 117.7 (6.3), 228.19 (9.5), 277.6 (12.1) | 239Pu | INAA | Long, short | 239U decays with a half-life of 23.5 m to 239Np which has a half-life of 2.355 d |
4.2 Samples and standards
Samples and standards are commonly irradiated as solids but liquids and even gases can also be used if care is taken to avoid leakage during and after neutron irradiation. Sealed SiO2 glass tubes or ampoules are particularly suited as containers for liquids and gases. Biological samples may be freeze-dried prior to irradiation. Geological samples, if necessary, can simply be dried in an oven to remove moisture. During neutron irradiation prompt γ-rays are emitted by the sample due to neutron absorption and scattering; in addition, decay of the formed radioactive isotopes releases radiation. Partial absorption of this radiation by the sample produces heat. This causes radiolytic decomposition of H2O and biological materials during long irradiations (hours and more, depending upon the neutron flux) and a build-up of pressure in the sample containers; organic material may even carbonize [5].
Geological samples will normally be present as finely ground powders but irradiation of rock chips or single mineral grains is also acceptable, provided that they are representative of the bulk samples. It is useful to have a broad idea on the range of REE concentrations to be expected in order to adjust the quantity of sample for irradiation. Quantities between less than 1 mg and a few grams are used, with the most typical quantities being on the order of 100 mg. Pulverized samples can be put into aluminium or SiO2 glass containers and sealed; coarse grains or chips can be simply wrapped in Al foil. For short irradiations or irradiation in reactors with low neutron fluxes polyethylene foil or vials may also be used. In high-flux reactors, polyethylene foil becomes brittle within several minutes. In addition, in the manufacturing process compounds of antimony are employed as catalysers (e.g. [32]), that are a source of high-energy γ-rays from the decay of 124Sb and, consequently, cause an appreciable Compton background during counting. SiO2 tubes and Al foil are available at very high purity, eliminating the need to transfer the irradiated samples to inactive containers before γ-ray counting. Safely encapsulating powder in Al foil, however, is difficult and thus not advisable. If low-purity Al containers are used, the samples must be transferred to inactive containers prior to γ-ray counting.
Although eq. (6) can be solved for NX, the number of atomic nuclei of interest, thus making NAA an absolute analytical method, this equation is not practical to employ. First, the absolute value of the activity AY cannot be easily derived and depends upon the counting geometry (mainly the distance between sample and detector) and the efficiency of the detector. Second and more importantly, the neutron flux Φ is not precisely known and may fluctuate. Major- and minor-element isotopes of geological and biological samples (H, C, N, O, Na, Mg, Al, Si, P, S, Ca, Ti, Fe) have small cross sections for neutron absorption (less than a few barns). Therefore, it can be safely assumed that the neutron flux remains constant across a set of samples during irradiation. The neutron flux, however, varies as a function of distance in the core region of a reactor. Whereas flux variations across samples are small in the core of a large graphite-moderated reactor (≤0.5 % cm−1), they may reach 10 % cm−1) in the core of a small water-moderated reactor [5]. These uncertainties are eliminated by the irradiation of two or more sets of standards and, sometimes, flux monitors together with the samples. The single-comparator method, NAA not further considered here, requires precise knowledge of γ-ray intensities, isotopic abundances, and thermal neutron cross sections from which a “k0-factor” can be calculated [4, 33].
The flux monitor, NAA may be a thin rod or wire of a metal such as Fe, Co or Au. Short wires (few centimetres) may be wrapped around each sample in order to precisely record the neutron dose (flux × time) at the position of the sample. Thin metal sheets may be placed inside aluminium cans, large containers used for irradiation, in between individual samples or layers of samples [3]. Flux monitors are recommended if samples are to be irradiated in small research reactors and accelerators and/or if the highest possible analytical precision is to be achieved.
Standards can be prepared from commercially available multi-element or single-element standard solutions for inductively coupled plasma mass spectrometry (ICP-MS) analysis. They may, of course, also be prepared by dissolving metals or compounds. If oxides are used, care has to be employed with regard to the exact stoichiometry. Terbium, for example, forms a stable oxide Tb4O7 instead of the normal REE2O3 composition. If stock solutions must be diluted, this should be done shortly before use in order to minimize loss of elements by adsorption to the walls of polyethylene or PTFE containers. Appropriate quantities of the solutions may be pipetted on small sheets of high-purity Al foil or into SiO2 glass containers and dried. Quantities varying between a few micrograms (Sm, Eu, Lu) and about 100 μ g (Gd) are considered reasonable. This is at least one order of magnitude more than present in most geological samples. When combining several elements in preparing standards, interferences of γ-lines must be avoided. For example, uranium can often be measured in geological samples through the decay of 239Np (
International reference standards should also be included in a set of samples in order to estimate the accuracy of the concentration data. As REEs (and other trace element concentrations) are vastly different in different types of geological materials, it is advisable to select a standard similar in composition to the samples, for example, a standard granite for the analysis of granites or a standard ultramafic rock for the analysis of peridotites. These rocks will have REE concentrations that typically differ by more than two orders of magnitude.
For the purpose of neutron irradiation in a reactor, the samples are packed into an aluminium can which may have a diameter of 1.5–3 cm and a length of ≈ 10 cm. About 10–40 samples fit into such a can, each ≈ 100-mg sample sealed in SiO2 glass or an aluminium container. In order to correct for neutron flux gradients, the position of each sample and standard inside the can must be known. As the induced activity AY is a linear function of the neutron flux (eq. (6)) and as the irradiation time is the same for all samples and all standards, two sets of element standards, one set placed at the bottom and the other at the top of the irradiation can, are sufficient to correct for neutron flux variations by linear interpolation. More sets of standards or flux monitors, of course, will improve the flux correction at the cost of additional time for γ-ray counting. In large research reactors, the variation in neutron flux between top and bottom of an aluminium can with a length of 10 cm will typically be on the order of 10 % only.
4.3 Counting strategies
Before irradiating the samples, the subsequent counting strategies should be considered and irradiation parameters adjusted.
If all REEs are to be measured, radiochemical separation is indispensible. In this case, each sample is split into two portions. One split should be irradiated for a short time (on the order of 10 min) and immediately (after a delay of no more than 1 h) be transferred to the radiochemistry laboratory. This split serves for γ-ray counting of 165Dy and 166Ho, and possibly 171Er, 152mEu, 140La and 153Sm. The second split should be irradiated for at least several hours up to about 1 week, depending upon the expected REE concentrations. After a delay of 1–2 days (“cooling time”), these samples are transferred to the laboratory for performing radiochemical separation of the REE and subsequent counting. The most critical isotope to be measured is 171Er (t½ = 7.52 h); for its detection, not much more than 1 day (≈ three half-lives) should be allowed to pass between the end of irradiation and γ-ray counting, together with isotopes having half-lives less than about 1 week (142Pr, 166Ho, 140La, 153Sm, 175Yb, 177Lu). Two to 4 weeks later, after the short-lived activities have decayed, the longer lived nuclides can be measured, i.e. 147Nd, 141Ce, (177Lu), 169Yb, 160Tb, 170Tm, 153Gd, and 152Eu. 142Pr and 140La have no low-energy γ-lines; for their detection, a large-volume Ge(Li) or Ge detector is required. All other REE nuclides listed in Table 1.1 can, in principle, be analysed using a planar Ge detector. In the energy range below ≈ 150 keV, the planar detector is the preferred one due to its lower Compton background and better resolution.
If no radiochemistry laboratory is accessible or if other elements, in addition to the REE are to be measured, then the instrumental NAA method must be employed. In this case, the short irradiation is of little benefit as 56Mn, and in favourable cases 165Dy, are the only nuclides that cannot be detected in geological samples after the long irradiation. The long (hours to days) irradiation requires a cooling time of about 2 days or more before the first series of γ-ray counting can be started, targeting at 140La, 153Sm, 175Yb, 177Lu, 24Na, and 239Np. At that time, 24Na may still constitute the main activity in many geological and biological samples (Figures 9(a) and 10(a)); its high-energy γ-rays contribute highly to the Compton background. The second γ-ray counting may take place about 3–5 weeks after the end of irradiation. At this time, the short-lived nuclides have decayed to negligible values and the Compton background of geological samples is now determined by 59Fe and 46Sc and, maybe, 60Co (Figure 9(b)). Among the REEs, 141Ce, 147Nd, 152Eu, 160Tb and 169Yb can now be expected to be detectable as shown in Figure 10(b and c) for the case of a volcanic rock.
![Figure 9: γ-Activities of a number of nuclides as a function of cooling time for the internationalstandard rock basalt BCR-1 released by the US Geological Survey, the supply of which islong exhausted. For each nuclide, only the activity of the main γ-ray, displayed in boldfacein Table 1, has been calculated as A = λ × N × relative intensity (where more than one γ-lineis highlighted, the one with the higher intensity was used, except for 239Np (277.6 keV)).The energy-dependent efficiency of the detectors has not been considered. Calculations wereperformed for a thermal neutron flux of 5 × 1013 cm−2 s−1 and an irradiation time of 24 h.Recommended concentrations in BCR-1 are Na 2.43, Sc 32.8, Mn 1410, Fe 9.41, Co 36.3,La 25.0, Ce 53.7, Pr 6.9, Nd 28.7, Sm 6.58, Eu 1.96, Gd 6.68, Tb 1.05, Dy 6.35, Ho 1.11, Er 3.61,Tm 0.59, Yb 3.39, Lu 0.512, Hf 4.90, Ta 0.79, Th 6.04, U 1.71 (all values in ppm, exceptNa and Fe in %) [34]. Although many of these activities are high, be aware that only a smallfraction of the γ-rays are registered by the detector. In INAA, the activity is dominated by 24Naduring the first week after irradiation. Afterwards, 46Sc, 59Fe and 60Co are the maincontributors. All these nuclides release high-energy γ-rays during decay, thus causing a highCompton background, in particular in the large-volume Ge detector.](/document/doi/10.1515/psr-2016-0062/asset/graphic/j_psr-2016-0062_fig_009.jpg)
![Figure 9: γ-Activities of a number of nuclides as a function of cooling time for the internationalstandard rock basalt BCR-1 released by the US Geological Survey, the supply of which islong exhausted. For each nuclide, only the activity of the main γ-ray, displayed in boldfacein Table 1, has been calculated as A = λ × N × relative intensity (where more than one γ-lineis highlighted, the one with the higher intensity was used, except for 239Np (277.6 keV)).The energy-dependent efficiency of the detectors has not been considered. Calculations wereperformed for a thermal neutron flux of 5 × 1013 cm−2 s−1 and an irradiation time of 24 h.Recommended concentrations in BCR-1 are Na 2.43, Sc 32.8, Mn 1410, Fe 9.41, Co 36.3,La 25.0, Ce 53.7, Pr 6.9, Nd 28.7, Sm 6.58, Eu 1.96, Gd 6.68, Tb 1.05, Dy 6.35, Ho 1.11, Er 3.61,Tm 0.59, Yb 3.39, Lu 0.512, Hf 4.90, Ta 0.79, Th 6.04, U 1.71 (all values in ppm, exceptNa and Fe in %) [34]. Although many of these activities are high, be aware that only a smallfraction of the γ-rays are registered by the detector. In INAA, the activity is dominated by 24Naduring the first week after irradiation. Afterwards, 46Sc, 59Fe and 60Co are the maincontributors. All these nuclides release high-energy γ-rays during decay, thus causing a highCompton background, in particular in the large-volume Ge detector.](/document/doi/10.1515/psr-2016-0062/asset/graphic/j_psr-2016-0062_fig_010.jpg)
γ-Activities of a number of nuclides as a function of cooling time for the internationalstandard rock basalt BCR-1 released by the US Geological Survey, the supply of which islong exhausted. For each nuclide, only the activity of the main γ-ray, displayed in boldfacein Table 1, has been calculated as A = λ × N × relative intensity (where more than one γ-lineis highlighted, the one with the higher intensity was used, except for 239Np (277.6 keV)).The energy-dependent efficiency of the detectors has not been considered. Calculations wereperformed for a thermal neutron flux of 5 × 1013 cm−2 s−1 and an irradiation time of 24 h.Recommended concentrations in BCR-1 are Na 2.43, Sc 32.8, Mn 1410, Fe 9.41, Co 36.3,La 25.0, Ce 53.7, Pr 6.9, Nd 28.7, Sm 6.58, Eu 1.96, Gd 6.68, Tb 1.05, Dy 6.35, Ho 1.11, Er 3.61,Tm 0.59, Yb 3.39, Lu 0.512, Hf 4.90, Ta 0.79, Th 6.04, U 1.71 (all values in ppm, exceptNa and Fe in %) [34]. Although many of these activities are high, be aware that only a smallfraction of the γ-rays are registered by the detector. In INAA, the activity is dominated by 24Naduring the first week after irradiation. Afterwards, 46Sc, 59Fe and 60Co are the maincontributors. All these nuclides release high-energy γ-rays during decay, thus causing a highCompton background, in particular in the large-volume Ge detector.
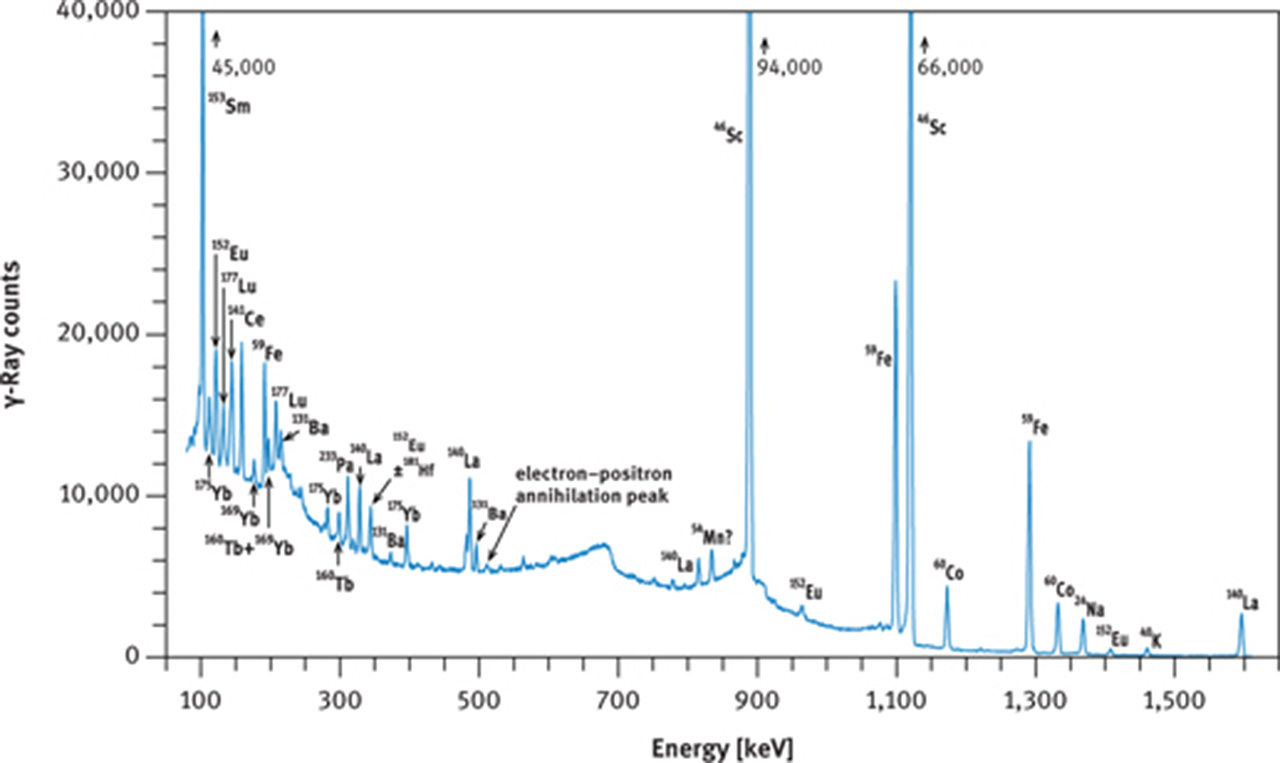
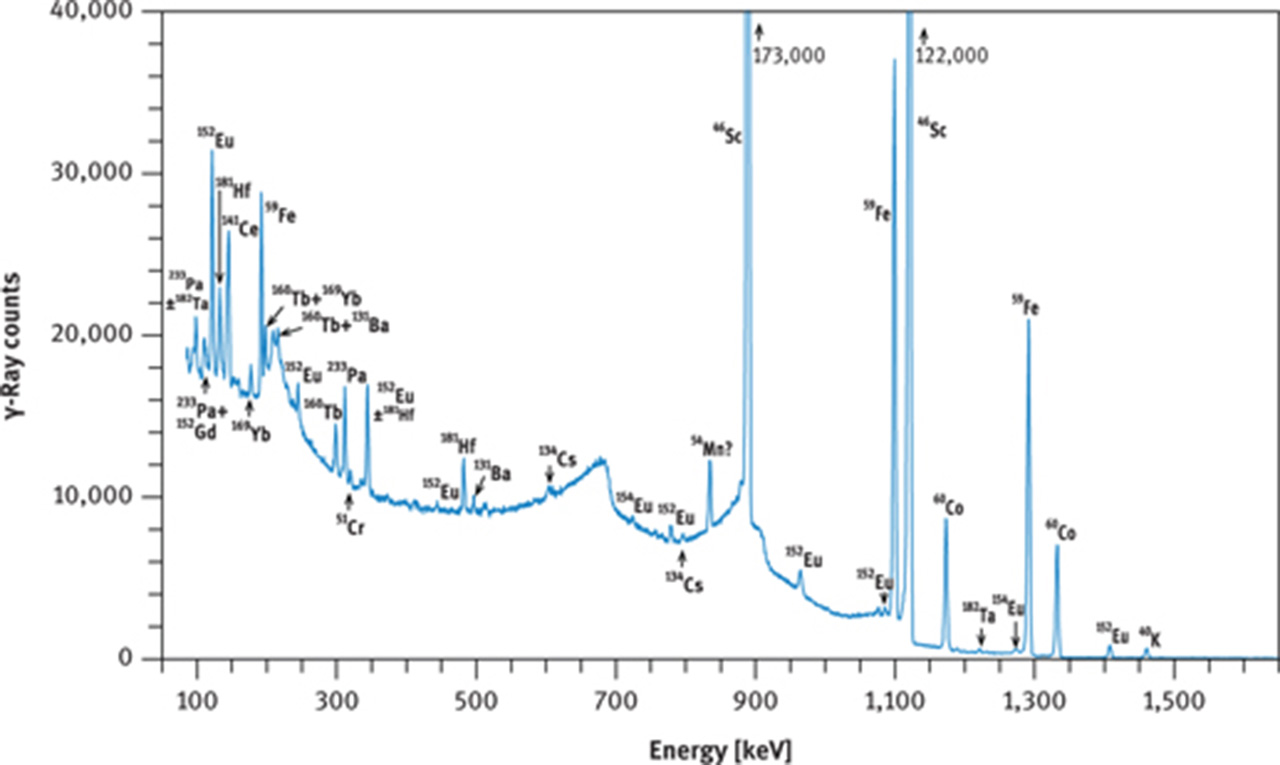
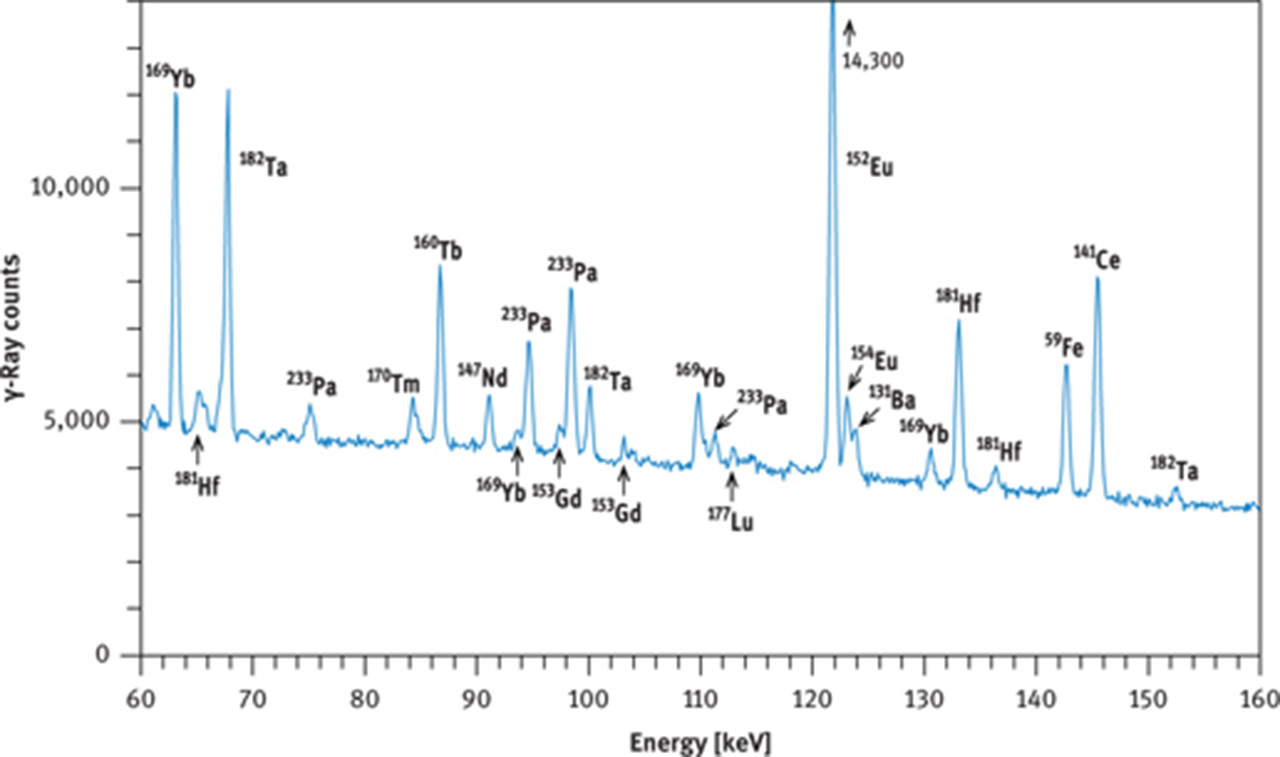
γ-Ray spectra of international reference rock basalt BCR-1. (a) Spectrum taken with a coaxial Ge(Li) detector about 8 days after end of irradiation, (b) spectrum taken with a coaxial Ge(Li) detector about 30 days after end of irradiation, (c) part of spectrum taken with a planar Ge detector about 28 days after end of irradiation. Irradiation conditions: neutron flux 5 × 1013 cm−2 s−1 for 12 h at the research reactor “DIDO” of the former “Kernforschungsanlage Jülich” (now “Forschungszentrum Jülich”) in September 1993. γ-Ray counting was performed at the former “Institut für Kernchemie”, University of Cologne. The dead time of the counting system was kept below 3 % by adjusting the distance between sample and detector. Counting times were 3 h (a), 4 h (b) and 10 h (c).
As the behaviour of the REE in nature is predictable and mainly a function of the differences in ionic radii and, in the case of Ce and Eu, of oxygen fugacity, the REE patterns of rocks and minerals can commonly be constructed from the elements accessible by INAA. Under reducing conditions, a portion of the Eu will be divalent, giving rise to Eu behaving differently from Sm or Gd, visible as a Eu “anomaly” in many rocks. The magnitude of this anomaly can only be interpolated between Sm and Tb as Gd cannot be measured precisely by INAA. Moreover, the 153Gd photopeak at 97.5 keV is interfered by the 98.44 keV photopeak of 233Pa (from the decay of 233Th, Figure 10(c)). For measuring Gd by INAA, it therefore is useful to let 233Pa decay for about half a year (7 half-lives of this isotope) – if time is not essential.
4.4 Radiochemical neutron activation analysis (RNAA) – a fast separation scheme
Radiochemical neutron activation involves the separation of the elements of interest from the matrix activity. At the time when the samples arrive at the laboratory, 1 or 2 days after the end of irradiation, geological and biological materials are highly radioactive. All chemical work, therefore, must be carried out minimizing the exposure of the operator to the radiation. This includes manipulating the samples behind protective shielding (usually made by bricks of lead, about 5 cm thick) and following a quick-and-dirty chemical procedure. As all chemicals that are used during digestion of the samples and separating the REE are inactive, there is little danger of introducing contamination, except through cross-contamination between samples. Prior to the development of the high-resolution Ge detectors, all REE had to be separated from one another which involved time- and labour-consuming extraction or ion-exchange techniques [35, 36]. With the advent of the coaxial Ge(Li) and planar Ge detectors, the chemical work was reduced to separate the REE as a group from the matrix. At the University of Cologne, we have applied the separation technique outlined in Figure 11 and described in more detail by Carl [37]. In many geological samples, 46Sc accounts for the main activity between about 1 week and 1 year after the end of irradiation. It is, therefore, indispensable to remove at least the major portion of 46Sc from the REE. We achieved this by precipitating Sc using phytic acid [38]. Chemical yields of the REE were typically between about 90 % and 95 % as determined from the analysis of international reference materials or by re-irradiation and γ-ray counting of samples. To our experience, two people working together can process about 20 samples in 10 h.
![Figure 11: Separation scheme for REE from silicate minerals and rocks (modified after [37]). Steps 4a and 6a should be included if samples with very low REE concentrations are processed.](/document/doi/10.1515/psr-2016-0062/asset/graphic/j_psr-2016-0062_fig_014.jpg)
Separation scheme for REE from silicate minerals and rocks (modified after [37]). Steps 4a and 6a should be included if samples with very low REE concentrations are processed.
By employing this separation scheme and irradiating ≈10−1 g of sample at a flux of 8 × 10¹³ n cm−2 s−1, we were able to analyse the REE in minerals from peridotites containing ppb levels of the REE only (Figure 12). Even sub-ppb levels are accessible for the most sensitive elements La, Sm, Eu, Yb and Lu. In contrast, by INAA, we would have detected only Eu, Yb and Lu in orthopyroxene and none of the REE in olivine.
![Figure 12: REE in olivines (Mg, Fe)2SiO4 and orthopyroxenes (Mg, Fe)2Si2O6 from peridotites (redrawn from data published in Ref. [39]). Peridotites are rocks from the Earth’s upper mantle brought to the surface as inclusions in basaltic volcanic rocks. REE were separated from the matrix (sample weights between 100 and 300 mg) according to the procedure outlined in Figure 11. CI-chondrite normalization values from Ref. [40]. The sample with the lowest REE concentration has REE abundances corresponding to detected quantities of approximately 1 ng for La, 1.5 ng for Ce, 0.7 ng for Nd and 0.5 ng for Sm. Even lower concentrations were observed in spinel (Mg, Fe)(Al, Cr)2O4, corresponding to detected quantities of ≈0.06 ng for La, 0.03 ng for Sm and 0.06 ng for Lu [39]. The patterns indicate crystal-chemical control of REE3+ incorporation into the lattice of olivine and orthoyroxene with the largest of the REE being most strongly excluded from incorporation. Higher than expected concentrations of the light REE in olivine are likely to be due to physical contamination, in particular fluid inclusions.](/document/doi/10.1515/psr-2016-0062/asset/graphic/j_psr-2016-0062_fig_015.jpg)
REE in olivines (Mg, Fe)2SiO4 and orthopyroxenes (Mg, Fe)2Si2O6 from peridotites (redrawn from data published in Ref. [39]). Peridotites are rocks from the Earth’s upper mantle brought to the surface as inclusions in basaltic volcanic rocks. REE were separated from the matrix (sample weights between 100 and 300 mg) according to the procedure outlined in Figure 11. CI-chondrite normalization values from Ref. [40]. The sample with the lowest REE concentration has REE abundances corresponding to detected quantities of approximately 1 ng for La, 1.5 ng for Ce, 0.7 ng for Nd and 0.5 ng for Sm. Even lower concentrations were observed in spinel (Mg, Fe)(Al, Cr)2O4, corresponding to detected quantities of ≈0.06 ng for La, 0.03 ng for Sm and 0.06 ng for Lu [39]. The patterns indicate crystal-chemical control of REE3+ incorporation into the lattice of olivine and orthoyroxene with the largest of the REE being most strongly excluded from incorporation. Higher than expected concentrations of the light REE in olivine are likely to be due to physical contamination, in particular fluid inclusions.
4.5 Data reduction and sources of error
Data reduction following γ-ray spectroscopy comprises calculation of the peak area and standard error. This procedure is comparable to the task encountered in energy-dispersive X-ray spectroscopy and is discussed in detail by Potts [3]. In most cases (La, Ce, Nd, Sm, Eu, Tb, Yb and Lu in INAA and all REE in RNAA), well-resolved γ-ray lines can be chosen to evaluate the net peak area by subtracting the interpolated background from the total peak area. Deconvolution of photopeaks is rarely required. As the 1σ-error is estimated from the square root of γ-ray counts of total peak as well as background, 1σ of the net peak area NPeak is calculated as
Although NAA is poor in interferences, NAA from competing reactions leading to the formation of the same nuclide, caution must be exercised when analysing Gd and Ho. “Second-order reactions” may severely enhance the signals of 153Gd and 166Ho [41, 42]. Such interferences arise during long irradiations and/or high neutron fluxes, when a radioactive nuclide
Second-order activation can be calculated from the Bateman–Rubinson equation [5, 43]:
where Nn(t) is the number of nuclides
The factors Ci are defined as
In the above example,
151Eu possesses a cross section of 3,150 b to form 152mEu. About three quarters of this nuclide decay with a half-life of 9.3 h into stable 152Gd (Table 1). Whereas 151Eu has a natural abundance of almost 50 %, the abundance of 152Gd is only 0.20 %. For a sample with a chondritic abundance ratio of Gd/Eu (≈ 3.5), irradiating a sample at a flux of 5 × 10¹³ n cm−2 s−1 for just 1 day enhances the total amount of 153Gd by more than 10 %. For an elemental Eu/Gd ratio of 1:1 the increase is about 50 % and a neutron flux of 1 × 10¹⁴ n cm−2 s−1 will almost double the 153Gd signal (Figure 13). Five days of irradiation at 5 × 10¹³ n cm−2 s−1 will more than double the 153Gd signal for a chondritic Eu/Gd ratio and increase it by a factor of 4 for a 1:1 ratio. A standard of pure Gd must be used to correct for this interference by counting 152Eu and 153Gd in standard and unknowns. Reducing the irradiation time to much less than one day or the neutron flux is not a good option in this case in view of the long half-life of 153Gd and, hence, its low activity (compare Figure 9).
![Figure 13: Interference from 151Eu on the 153Gd signal as a function of irradiation time and neutron flux as computed from eq. (10). 153Gd, activated from 152Gd indigenous to the sample, was calculated from eq. (3). The y-axis has been scaled to a 1:1 elemental Eu/Gd ratio. Most geological samples will have lower ratios, closer to the chondritic one (≈1/3.5, chondritic ratios are indicated by black broken lines). Green and red broken lines serve to illustrate the interference for irradiation times of 1 and 5 days, respectively. Calculations have been carried out employing the Bateman–Rubinson equation [5, 43], using isotopic abundances, activation cross sections and half-lives as given in Table 1. For equal concentrations of Eu and Gd in a sample, for example, 1 ppm, irradiating the sample for 1 day at a neutron flux of 1 × 10¹³ n cm−2 s−1 will increase the 153Gd signal by about 10 % whereas irradiation at a flux of 1 × 10¹⁴ n cm−2 s−1 will almost double the signal.](/document/doi/10.1515/psr-2016-0062/asset/graphic/j_psr-2016-0062_fig_016.jpg)
Interference from 151Eu on the 153Gd signal as a function of irradiation time and neutron flux as computed from eq. (10). 153Gd, activated from 152Gd indigenous to the sample, was calculated from eq. (3). The y-axis has been scaled to a 1:1 elemental Eu/Gd ratio. Most geological samples will have lower ratios, closer to the chondritic one (≈1/3.5, chondritic ratios are indicated by black broken lines). Green and red broken lines serve to illustrate the interference for irradiation times of 1 and 5 days, respectively. Calculations have been carried out employing the Bateman–Rubinson equation [5, 43], using isotopic abundances, activation cross sections and half-lives as given in Table 1. For equal concentrations of Eu and Gd in a sample, for example, 1 ppm, irradiating the sample for 1 day at a neutron flux of 1 × 10¹³ n cm−2 s−1 will increase the 153Gd signal by about 10 % whereas irradiation at a flux of 1 × 10¹⁴ n cm−2 s−1 will almost double the signal.
164Dy forms 165Dy by neutron capture with a cross section of 2,700 b which decays into stable 165Ho with a half-life of 2.35 h, thus increasing the concentration of Ho as a function of irradiation time and neutron flux in the reactor. 165Dy may also capture another neutron (σ = 3,500) to form 166Dy, which decays into 166Ho with a half-life of 81.5 h, about three times longer than the half-life of 166Ho. This has the consequence that the interference of Dy on the determination of the Ho content is not only dependent upon the neutron flux and duration of irradiation but also on the time when the decay of 166Ho is counted. The interference can only be kept small (<3 %) if the sample is irradiated for no longer than about 1 h and γ-ray counting is carried out within about three half-lives of 166Ho [42].
A second source of error arises from the presence of uranium in a sample if its concentration matches, or is even higher than, those of Ce and Nd (see also Section 3.1.1). In these cases fission of 235U by thermal neutrons produces fragments with masses within the range of the light REE (Figure 4). Particularly high, for our concern, are the fission yields Yi for masses 140 (6.268 %), 141 (5.837 %), 142 (5.796 %) and 147 (2.265 %). Initially, these nuclides have an excess number of neutrons, leading them to decay by β− emission into stable nuclides. The decay of nuclide 142 ends at stable 142Ce, thus shielding 142Pr from being affected by U fission (Figure 8). The decay of nuclide 140 is somewhat modulated by 140Ba due to its half-life of 12.75 d. As 140La is analysed within a few days after the end of irradiation and σ(n, γ) is much higher for 139La than for 140Ce and 147Nd, contribution from fission of 235U is expected to remain small. No long-lived nuclides, however, are encountered during decay of nuclides 141 and 147 until they reach 141Ce and 147Nd.
The activity ratio of 141Ce produced by fission of 235U relative to 141Ce produced by the (n, γ) reaction from 140Ce can be estimated from eq. (5):
The neutron flux Φ and the irradiation time, of course, are identical for uranium and cerium in the sample. The equation thus simplifies to
where c stands for concentrations, Ab for isotope abundances and NAv for Avogadro’s number. If concentrations of U and Ce are equal, this results in
For the contribution to 147Nd from fission of 235U in the case of equal concentrations the result is
Interferences of this magnitude can be corrected reasonably well by γ-counting of 239Np, 141Ce and 147Nd in uranium standards and samples, provided that concentrations of Ce, Nd and U are at least on the order of 101 ppm to allow γ-ray counting by INAA with small statistical errors. For most geological materials fission interference is much smaller. The averages concentrations of the continental crust are estimated at 1.3 ppm U, 43 ppm Ce and 20 ppm Nd [44]. The basalt standard BCR-1 contains only 1.7 ppm U compared to 53.7 ppm Ce and 28.7 ppm Nd [34]. In alkaline rocks such as syenites, however, uranium may become strongly enriched. For example, for the international standard syenite SY-2 a U concentration of 284 ppm is given, compared to 73 ppm Nd [45]. In NAA of this rock, the contribution from 235U fission to the 147Nd photopeak would match the contribution from 146Nd. Analysing the light REE in uranium ores, Gd in compounds of Eu, and Ho in compounds of Dy by NAA without pre-irradiation chemical separation would surely be a challenge.
5 Conclusion
NAA is an effective and sensitive tool for REE analysis. Its role is nowadays greatly diminished by the decommissioning of nuclear research reactors in parts of the world as well as by the development of competitive techniques, namely ICP-MS. NAA is a true multi-element technique capable of routinely determining the concentrations of some 15–20 elements in geological samples. In ICP-MS, great care must be exercised to ensure dissolution of all minerals in rocks using high-purity acids, in particular zircon, which may contain a significant portion of the heavy REE. Both INAA and RNAA are little susceptible to contamination because no pre-irradiation treatment of samples is necessary. On the other hand, NAA takes a long time to complete (1 month or more) due to the necessity of letting short-lived activities decay in order to decrease the background during γ-ray counting. Potential health risks of the analyst through exposure to γ- and β− radiation must also be considered as well as the requirements for disposing nuclear waste when selecting an analytical method for REE analysis.
Acknowledgements
This article is also available in: Golloch, Handbook of Rare Earth Elements. De Gruyter (2016), isbn 978–3–11–036523–8.
References
[1] Hevesy G, Levi H. The action of neutrons on the rare earth elements. Det Kgl Danske Videnskabernes Selskab, Mathematisk-fysiske Meddelelser 1936, XIV, 5, 1–34.10.1038/137185a0Suche in Google Scholar
[2] Hevesy G, Levi H. Action of slow neutrons on rare earth elements. Nature 1937, 137, 185.10.1038/137185a0Suche in Google Scholar
[3] Potts PJ. A Handbook of Silicate Rock Analysis. Glasgow, Blackie, 1992.10.1007/978-1-4615-3270-5Suche in Google Scholar
[4] Neutron Activation Analysis. http://www.naa-online.net/ (accessed: 26 November 2015).Suche in Google Scholar
[5] De Soete D, Gijbels R, Hoste J. Neutron Activation Analysis. London, John Wiley & Sons, 1972.Suche in Google Scholar
[6] Gladney ES, Curtis DB, Perrin DR. Determination of selected rare earth elements in 37 international geochemical reference materials by instrumental thermal neutron capture prompt gamma-ray spectrometry. Geostand Newsl 1985, 9, 25–30.10.1111/j.1751-908X.1985.tb00434.xSuche in Google Scholar
[7] Baer HW, Reidy JJ, Wiedenbeck ML. The decay of 140La to levels in 140Ce. Nucl Phys A 1968, 113, 33–56.10.1016/0375-9474(68)90880-4Suche in Google Scholar
[8] Simonits A, De Corte F, Hoste J. Single-comparator methods in reactor neutron activation analysis. J Radioanal Nucl Chem 1975, 24, 31–46.10.1007/BF02514380Suche in Google Scholar
[9] Moens L, et al. k0-measurements and related nuclear data compilation for (n, γ) reactor neutron activation analysis. J Radioanal Nucl Chem 1984, 82, 385–452.10.1007/BF02037061Suche in Google Scholar
[10] De Corte F. The standardization of standardless NAA. J Radioanal Nucl Chem 2001, 248, 13–20.10.1023/A:1010601403010Suche in Google Scholar
[11] Pfennig G, Klewe-Nebenius H, Seelmann-Eggebert W. Karlsruher Nuklidkarte (Chart of the Nuclides). Lage, Marktdienste Haberbeck, 1995.Suche in Google Scholar
[12] Ila P, Jagam P, Muecke GK. Multielement analysis of uraniferous rocks by INAA: Special reference to interferences due to uranium and fission of uranium. J Radioanal Chem 1983, 79, 215–32.10.1007/BF02518934Suche in Google Scholar
[13] International Atomic Energy Agency. (ed) Neutron Generators for Analytical Purposes. Vienna, International Atomic Energy Agency, 2012, 162.Suche in Google Scholar
[14] Reijonen J, et al. First PGAA and NAA experimental results from a compact high intensity D–D neutron generator. Nucl Instrum Methods Phys Res Sect A 2004, 522, 598–602.10.1016/j.nima.2003.11.397Suche in Google Scholar
[15] Bergaoui K, et al. Development of a new deuterium–deuterium (D–D) neutron generator for prompt gamma-ray neutron activation analysis. Appl Radiat Isot 2014, 94, 319–27.10.1016/j.apradiso.2014.09.004Suche in Google Scholar
[16] Bergaoui K, et al. Prompt gamma-ray neutron activation analysis of boron using Deuterium–Deuterium (D–D) neutron generator. J Radioanal Nucl Chem 2015, 303, 115–21.10.1007/s10967-014-3298-4Suche in Google Scholar
[17] Filby RH. Isotopic and nuclear analytical techniques in biological systems: A critical study. Part IX. Neutron activation analysis. Pure Appl Chem 1995, 67, 1929–41.10.1351/pac199567111929Suche in Google Scholar
[18] Řanda Z, Kučera J, Mizera J, Frána J. Comparison of the role of photon and neutron activation analyses for elemental characterization of geological, biological and environmental materials. J Radioanal Nucl Chem 2007, 271, 589–96.10.1007/s10967-007-0311-1Suche in Google Scholar
[19] NaI scintillation detector. http://www.horiba.com/uploads/media/RE09-18-098_03.pdf (accessed 5 August 2015).Suche in Google Scholar
[20] Haskin LA, Wildeman TR, Haskin MA. An accurate procedure for the determination of the rare earths by neutron activation. J Radioanal Chem 1968, 1, 337–48.10.1007/BF02513689Suche in Google Scholar
[21] Tavendale AJ, Ewan GT. A high resolution lithium-drift germanium gamma-ray spectrometer. Nucl Instrum Methods 1963, 25, 185–7.10.1016/0029-554X(63)90183-6Suche in Google Scholar
[22] Ewan GT, Tavendale AJ. Application of high resolution lithium-drift germanium gamma-ray spectrometers to high energy gamma-rays. Nucl Instrum Methods 1964, 26, 183–6.10.1016/0029-554X(64)90072-2Suche in Google Scholar
[23] Luke PN, Amman M, Tindall C, Lee JS. Recent developments in semiconductor gamma-ray detectors. J Radioanal Nucl Chem 2005, 264, 145–53.10.1007/s10967-005-0687-8Suche in Google Scholar
[24] Gamma ray spectrometry. http://www.cnstn.rnrt.tn/afra-ict/NAT/gamma/html/Gamma%20Spec%20V1.pdf (accessed 4 August 2015).Suche in Google Scholar
[25] Review of the physics of semiconductor detectors. http://www.ortec-online.com/download/Review of the Physics of Semiconductor Detectors.pdf (accessed 7 August 2015).Suche in Google Scholar
[26] Kossert K, Jörg G, Nähle O, Lierse v. Gostomski C. High-precision measurement of the half-life of 147Sm. Appl Radiat Isot 2009, 67, 1702–6.10.1016/j.apradiso.2009.03.013Suche in Google Scholar PubMed
[27] Scherer EE, Münker C, Mezger K. Calibration of the lutetium–hafnium clock. Science 2001, 293, 683–7.10.1126/science.1061372Suche in Google Scholar PubMed
[28] Tanimizu M. Geophysical determination of the 138La β− decay constant. Phys Rev C: Nucl Phys 2000, 62, 017601, 1–4.10.1103/PhysRevC.62.017601Suche in Google Scholar
[29] Erdtmann G, Soyka W. The gamma-ray lines of radionuclides, ordered by atomic and mass number. Part I. Z = 2 – 57 (Helium–Lanthanum). J Radioanal Nucl Chem 1975, 26, 375–495.10.1007/BF02524450Suche in Google Scholar
[30] Erdtmann G, Soyka W. The gamma-ray lines of radionuclides, ordered by atomic and mass number, Part II. Z = 58 – 100 (Cerium – Fermium). J Radioanal Nucl Chem 1975, 27, 137–286.10.1007/BF02517457Suche in Google Scholar
[31] The Lund/LBNL nuclear data search. http://nucleardata.nuclear.lu.se/toi/ (accessed 7 December 2015).Suche in Google Scholar
[32] Shotyk W, Krachler M, Chen B. Contamination of Canadian and European bottled waters with antimony from PET containers. J Environ Monit 2006, 8, 288–92.10.1039/b517844bSuche in Google Scholar
[33] De Corte F, et al. Recent advances in the k0-standardization of neutron activation analysis: extensions, applications, prospects. J Radioanal Nucl Chem 1993, 169, 125–58.10.1007/BF02046790Suche in Google Scholar
[34] Gladney ES, Burns CE, Roelandts I. 1982 compilation of elemental concentrations in eleven United States Geological Survey rock standards. Geostand Newsl 1983, 7, 3–226.Suche in Google Scholar
[35] Schmitt RA, Mosen AW, Suffredini CS, Lasch JE, Sharp RA, Olehy DA. Abundances of the rare-earth elements, lanthanum to lutetium, in chondritic meteorites. Nature 1960, 186, 863–6.10.1038/186863a0Suche in Google Scholar
[36] Haskin LA, Frey FA. Dispersed and not-so-rare earths. Science 1966, 152, 299–314.10.1126/science.152.3720.299Suche in Google Scholar
[37] Carl C. Neutronenaktivierungsanalytische Untersuchungen über die Verteilung der Seltenen Erden und anderer Spurenelemente in kohligen Chondriten und in metamorphen Gesteinen der Ostalpen. Universität zu Köln, 1979, 181.Suche in Google Scholar
[38] Beck G. Die scandiumspezifische Gruppe der Pyrophosphorsäuren. Mikrochemie 1951, 36–37, 790–2.10.1007/BF01460878Suche in Google Scholar
[39] Stosch H-G. Rare earth element partitioning between minerals from anhydrous spinel peridotite xenoliths. Geochim Cosmochim Acta 1982, 46, 793–811.10.1016/0016-7037(82)90031-XSuche in Google Scholar
[40] McDonough WF, Sun S-S. Composition of the earth. Chem Geol 1995, 120, 223–53.10.1016/0009-2541(94)00140-4Suche in Google Scholar
[41] Kubota M. Interferences by neutron induced second order nuclear reaction in activation analysis of rare earths. J Radioanal Chem 1977, 36, 565–76.10.1007/BF02517023Suche in Google Scholar
[42] Kramar U. The importance of second order activation in the determination of trace elements in geological samples by instrumental neutron activation analysis. Geochim Cosmochim Acta 1980, 44, 379–82.10.1016/0016-7037(80)90146-5Suche in Google Scholar
[43] Rubinson W. The equations of radioactive transformation in a neutron flux. J Chem Phys 1949, 17, 542–7.10.1063/1.1747317Suche in Google Scholar
[44] Rudnick RL, Gao S. Composition of the continental crust, in: Rudnick RL (ed.) The Crust. Oxford, Elsevier–Pergamon, 2005, 1–64.10.1016/B0-08-043751-6/03016-4Suche in Google Scholar
[45] Gladney ES, Roelandts I. 1988 compilation of elemental concentration data for CCRMP Reference Rock Samples SY-2, SY-3 and MRG-1. Geostand Newsl 1990, 14, 373–458.Suche in Google Scholar
© 2016 by Walter de Gruyter Berlin/Boston