
Do cell towers help increase vaccine uptake? Evidence from Côte d’Ivoire
-
Ouattara Zieh Moussa
 und
Kenji Takeuchi
und
Kenji Takeuchi

Abstract
Cell towers enable the dissemination and access to vaccine information through mobile networks. In developing regions where mobile device sharing is common, the benefits of cell tower connectivity extend beyond individual mobile device ownership. This study provides valuable insights into how access to these communication infrastructures affects vaccination coverage and empirically examines the extent to which it enhances vaccine uptake. Combining geocoded cell tower information with data from a nationally representative household survey in Côte d’Ivoire, we found that proximity to cell towers was associated with higher vaccine uptake. Every unit decrease in the distance to cell towers was associated with about two additional children vaccinated per 1,000 population. Using the instrumental variable to address endogeneity in cell tower distribution, the finding aligns with that obtained using OLS.
1 Introduction
Vaccination is an effective public health intervention to prevent disease and death. In Africa, around 20% of children fail to receive all basic vaccines, resulting in more than 30 million cases of vaccine-preventable diseases in children under five annually [1]. One of the principal obstacles to vaccination is the difficulty in providing information to parents, especially in rural areas with limited access to education [2]. According to Obi-Jeff et al. [3], the most common reason for non-vaccination is lack of knowledge about where, when, and why to vaccinate.
The rapid increase in mobile technology usage in recent decades has helped overcome obstacles to information access [4,5,6]. Mobile technology reduces information sharing time, facilitates knowledge transfer to less educated populations [7,8], and enhances the efficiency and use of healthcare services [8]. Moreover, it creates educational and economic opportunities and enables access to credit markets, which can lead to better health outcomes [9].
Despite the growing interest in the impact of mobile technology on health outcomes, most research has centered on SMS reminders and mobile phone ownership [10,11,12,13,14,15,16,17,18]. Nonetheless, since phone sharing is common, ownership alone may not accurately reflect access to and usage of mobile communication technology [19]. A systematic review and meta-analysis by Yunusa et al. [20] indicates that the evidence supporting the positive effect of mobile phone interventions on health outcomes is still limited. In addition, some studies linking mobile phone usage with socio-economic outcomes are susceptible to bias because of the existence of unobserved confounders [21].
The current study integrates geocoded cell tower information with childhood vaccination data and finds that closer proximity to cell towers is associated with higher vaccine uptake. To mitigate endogeneity, we build on previous studies and use lightning intensity as an instrumental variable (IV) [21]. The IV estimate aligns with the Ordinary Least Squares (OLS) coefficient, suggesting that proximity to cell phone towers enhances vaccine uptake.
This research provides multiple contributions to the existing body of literature. First, it adds to the existing research on the socio-economic impact of communication infrastructures by exploring their effect on vaccination coverage. Previous studies show that mobile network coverage fosters growth in the retail sector, increases employment, and decreases the prevalence of gender-biased social norms and early marriage [22,23,24]. Some studies have further documented the negative effects of communication infrastructures on property values, suggesting that an increase in distance to cell towers raises property prices [25,26,27]. Other researchers suggest that communication infrastructures facilitate the dissemination of information about ongoing conflicts to remote areas, thereby influencing the diffusion of conflicts [28,29].
Second, we add new insights to the literature regarding the impact of communication infrastructures on health outcomes. Although there are many compelling pathways (see Section 2.1) through which access to cell towers could help increase vaccination coverage, there is a lack of studies analyzing this relationship. An important body of literature has focused on the adverse health effects of communication infrastructures, suggesting that proximity to cell towers increases the likelihood of serious health problems such as cancer and muscular pain [30,31,32,33,34]. Ali et al. investigated the effect of proximity to cell towers on health outcomes and found that people living closer to the cell tower were more likely to have health issues [30]. Evidence from a literature review suggests that proximity to cell towers increases the risk of cancer, changes in biochemical parameters, and radiofrequency-related diseases [31]. Hamza et al. documented that individuals living close to cell towers are more likely to experience muscle pain, fatigue, and headache [32]. The existing literature on positive health effects remains limited, primarily concentrating on HIV testing and infant mortality [21,35].
The rest of this article is organized as follows. Section 2 provides an overview on how cell towers could affect vaccine uptake, the distribution of cell towers, and vaccine uptake in Côte d’Ivoire. Section 3 describes the data and methodology employed in this study. Section 4 presents the OLS results, and Section 5 gives the IV results. Section 6 discusses the results, and Section 7 concludes the study.
2 Background
This section provides an overview of the potential mechanisms through which cell towers could help improve vaccine uptake, cell tower distribution, and how Ivorian authorities have leveraged advances in mobile technology to enhance childhood vaccination coverage.
2.1 How could cell towers help improve vaccination coverage
Access to and sharing of information is an important way in which improved access to cell towers can enhance vaccine uptake [36]. Mobile networks enable the dissemination of information about vaccination campaigns, schedules, and locations through SMS, and many other digital platforms. While health authorities can leverage mobile networks to inform the public about the benefits and safety of vaccines, individuals can access vaccine-related information on the Internet, which has a positive impact on vaccination coverage [37].
Enhanced cell phone coverage facilitates appointment scheduling and the implementation of SMS reminders. Individuals can book their vaccination appointments online or via mobile apps, and automated SMS reminders can be sent to remind them of their appointments, reducing the risk of missed appointments. A systematic review by Currie et al. [38] suggests that SMS reminders are effective in improving childhood vaccination coverage.
In addition, mobile networks help overcome physical barriers to immunization access, as they minimize the need to travel long distances to access vaccination services by providing information on the nearest vaccination sites. Cell phone coverage facilitates real-time monitoring of vaccinators during immunization campaigns, enabling health authorities to identify uncovered areas and ensure better coverage [39,40]. It can help gather feedback from the public about their vaccination experiences, helping to improve services and address barriers.
Electricity supply is another way in which cell towers can impact vaccination rates. Vaccines necessitate a “cold chain,” a transportation and storage system that maintains the recommended temperature for vaccines, which is challenging for remote areas where electricity is often scarce. According to Energize the Chain (EtC),[1] each cell tower generates excess electricity, sufficient to sustain a refrigeration unit for storing vaccines. In 2013, refrigeration units powered by cell towers were used to preserve “cold chain” conditions for vaccines sent to rural areas, enabling the vaccination of 250,000 children in Zimbabwe [41].
2.2 Vaccine uptake and disease incidence in Côte d’Ivoire
The incidence of vaccine-preventable diseases is alarmingly high in Côte d’Ivoire, despite a gradual decline. Particularly, tuberculosis incidence fell from 367 cases per 100,000 inhabitants in 2000 to 128 in 2021 [42]. The disease remains highly endemic and is one of the leading causes of death among communicable diseases. In 2021, an estimated 35,000 individuals contracted tuberculosis, of whom 6,000 succumbed [43]. Although not as severe as tuberculosis, measles is the second most common vaccine-preventable disease. Over the past few decades, fluctuations in the number of reported measles cases have been observed. Measles-related incidents declined from around 600 in 2011 to 48 in 2013, remained below 100 until 2016, and then increased to 1,800 in 2021. The incidence of poliomyelitis has stagnated at 0 since 2013. As of 2021, the incidence of diphtheria, tetanus, and pertussis was 0, 29, and 10, respectively.
The country advises that all children be immunized with the four primary vaccines endorsed by the World Health Organization (WHO): BCG, measles, polio, and DTP. Of these vaccines, only DTP protects against three diseases, namely diphtheria, tetanus, and pertussis. Despite some improvement in the past years, vaccination rates have historically remained lower than the 90% target levels [44]. In 2021, while coverage for the first dose of measles vaccine was 68%, that for the third dose of DTP and polio vaccines was 76 and 73%, respectively. Unlike other vaccines, the coverage for the BCG vaccine increased significantly from 80% in 2015 to 93% in 2021, surpassing the target.
2.3 Network coverage and vaccination in Côte d’Ivoire
Until the early 2000s, only a few cities outside the economic capital had access to mobile telephone services. However, in the 2010s, the country experienced a significant expansion in network coverage, resulting in a sharp increase in mobile phone ownership. Approximately 81% of households owned at least one mobile phone [45]. As for the Internet, its penetration rate fluctuates around 38% since 2015 [46]. At a median speed of 9.37 Mbps, the average cost for 1 GB of mobile data is about 2.58 USD [47]. Figure 1 illustrates the distribution of cell towers across the country in 2015. It shows some disparities in coverage across the country during our study year.
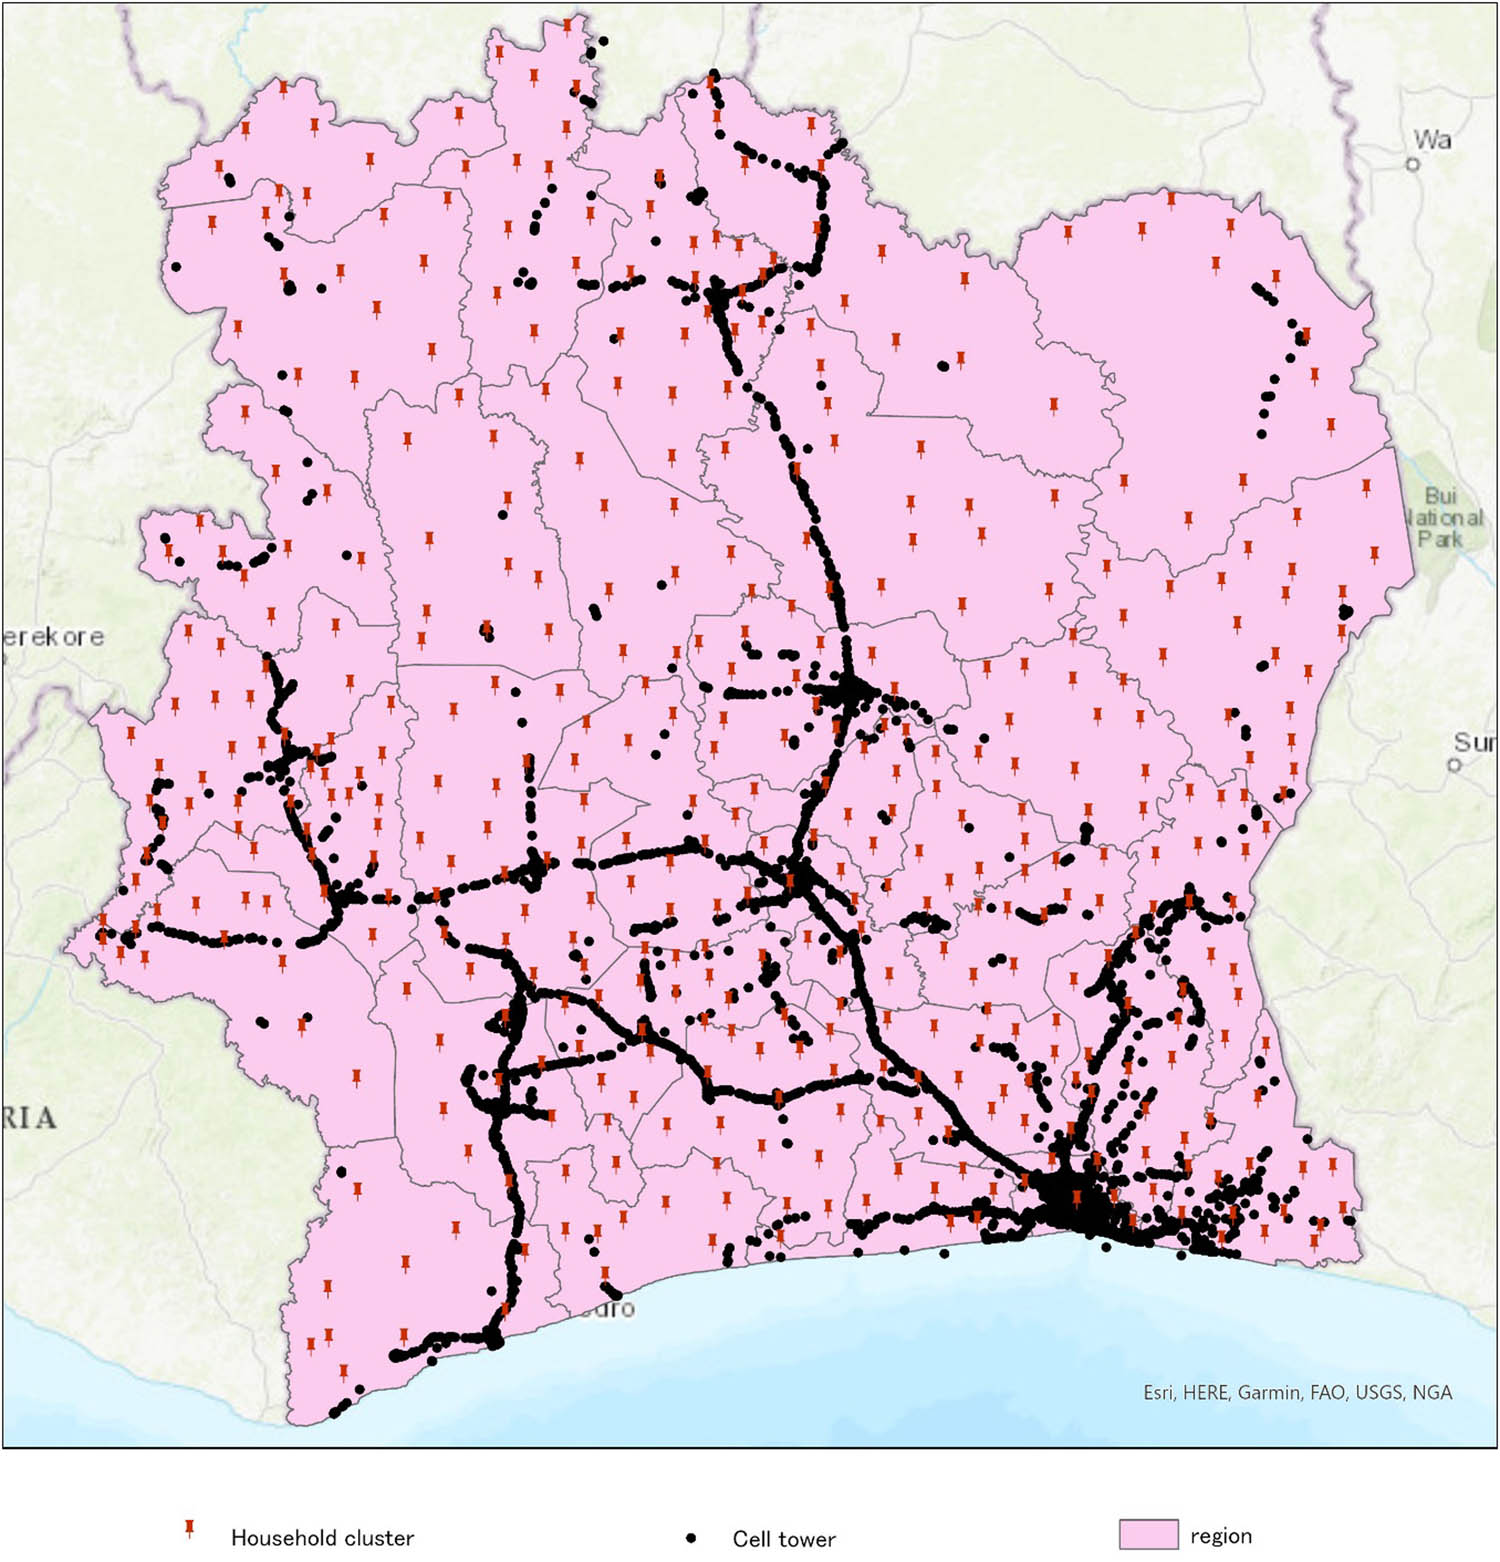
Distribution of cell towers in Côte d’Ivoire in 2015. Source: Author.
Over the past decades, Ivorian health authorities have leveraged advancements in mobile technology to enhance childhood vaccination rates. In 2011, the country launched its first vaccination reminder service, which involved sending voice and text messages to remind parents of vaccination dates and emphasize their importance. Mobile technology has also been utilized to facilitate communication during vaccination campaigns. For instance, the transparency of the measles vaccination campaign was enhanced through a mobile communication platform that allowed volunteers and families to report issues and obtain information [48]. Another notable example is the use of M vaccine, a mobile application that registers pregnant women and mothers of children under 2 years old, creates digital vaccination records and sends automatic voice reminders in French and local languages to ensure timely vaccinations. It also facilitates transitions from paper-based records to digital systems, allowing for more accurate and efficient tracking of vaccination data [49].
3 Data and methods
3.1 Data
We obtained data from multiple sources. The first data source was the 2015 Côte d’Ivoire Living Standards Survey (CILSS), a nationwide household survey that collects socio-demographic data. CILSS is the most recent household survey providing exhaustive information on both the vaccination status of children and the administrative units where households are located. Sub-prefectures are the smallest administrative unit and there are around 509 in the country. As shown in Figure 1, households are clustered by sub-prefectures across different regions.
Second, data on cell towers were drawn from OpencellID, the world’s largest open database providing comprehensive information on the global distribution of cell towers.[2] Our analysis primarily includes cell towers that were registered in the database up to 2015, i.e. the year the household survey was carried out. Since the survey data do not provide individual household locations to protect respondents’ privacy, we calculate the distance between household cluster centroids and the closest cell tower as a proxy for mobile network access. This same approach was used by Iacoella and Tirivayi when studying the effect of mobile connectivity on HIV testing [35]. Additionally, we calculated the number of cell towers per 10,000 inhabitants for all geographic clusters as an alternative indicator of mobile connectivity to check the robustness of our results (see Appendix Table A1). Moreover, the database does not report the date of construction for each tower but instead provides the date on which each tower’s information was added. As such, there may be a time lag between constructing a new tower and registering it into the database. Consequently, we also ascertain the robustness of our findings by using cell towers that were registered in the database up to 2016 to calculate the distance. The results are presented in Appendix (Table A1). We also check whether the distance to the cell towers and the number of cell towers per 10,000 inhabitants are good alternatives to each other and present the results in Table A2.
Third, we included data on health facilities, electricity, and road infrastructure to control for factors that can affect the use of mobile technology and access to vaccination. We utilized the spatial database of health facilities released by the World Health Organization (WHO) in 2019 to determine the number of health facilities per capita. We calculated the electricity grid per capita using data from Meta’s Electrical Distribution Grid Maps. Population data were sourced from the 2014 General Census of Population and Housing. Additionally, we computed the distance from each cluster centroid to the closest main road using data extracted from OpenStreetMap, released by the World Food Programme in 2017.
3.2 Econometric specification
To examine the impact of cell towers on vaccine uptake, we specify our empirical model as follows:
where Y icr is a dummy variable indicating if child i in cluster c within region r is fully vaccinated. Tower is our key explanatory variable and represents the distance from a household cluster location to the nearest cell tower. X icr is a vector of socio-economic control variables described in Table 1, and Z r is a vector of region fixed effects.
Descriptive statistics
| Variable | Obs | Mean | Std. Dev. | Min | Max |
|---|---|---|---|---|---|
| Vaccine uptake | |||||
| BCG | 8,124 | 0.85 | 0.36 | 0 | 1 |
| DTP | 7,954 | 0.80 | 0.40 | 0 | 1 |
| Polio | 8,237 | 0.87 | 0.33 | 0 | 1 |
| Measles | 7,978 | 0.77 | 0.42 | 0 | 1 |
| Distance to cell tower (km) | 9,170 | 20.35 | 28.26 | 0.05 | 195.73 |
| Population density | 9,170 | 637.51 | 1991.33 | 5.07 | 7947.84 |
| Hospital per 10,000 | 9,170 | 0.93 | 0.73 | 0 | 7.01 |
| Distance to the nearest road (km) | 9,170 | 7.05 | 8.22 | 0.01 | 44.21 |
| Electricity grid per 10,000 | 9,170 | 14.22 | 12.77 | 0 | 93.42 |
| Gender of household head | 9,170 | 0.84 | 0.36 | 0 | 1 |
| Parents living together | 9,170 | 0.91 | 0.29 | 0 | 1 |
| Household head age | 9,170 | 40.46 | 11.90 | 16 | 102 |
| Rural residence | 9,170 | 0.63 | 0.48 | 0 | 1 |
| Obs | % | ||||
| Income (tertile) | |||||
| Low | 3,069 | 33.47 | |||
| Middle | 3,050 | 33.26 | |||
| High | 3,051 | 33.27 | |||
| Household head education | |||||
| None | 6,088 | 66.95 | |||
| Primary | 1,446 | 15.90 | |||
| Secondary or higher | 1,560 | 17.15 |
While the inclusion of region fixed effects controls for unobserved factors that may differentially impact vaccine uptake across regions, it may not fully address endogeneity concern arising from the non-random placement of cell towers across household locations. If the choice of cell tower location is correlated with unobserved factors that affect vaccine uptake, our estimates could be biased. To tackle this issue, we use the maximal annual lightning strike intensity[3] as an IV. Previous studies using lightning strike as an IV suggest that it hinders the propagation of communication infrastructure and disrupts connectivity [21,51]. Manacorda and Tesei argue that electrostatic discharges during thunderstorms damage communication infrastructure and weaken network performance, thereby reducing the supply and demand for mobile phone services [51]. Consequently, areas with a higher incidence of lightning strikes may exhibit a lower rate of mobile technology adoption. This assumption is supported by the result of our first stage regression presented in Table 5. The key identification assumption is that our instrument influences the deployment of cell towers without impacting vaccine uptake. However, there may be potential indirect pathways through which lightning influences vaccination coverage. Indeed, lightning strikes could be correlated with the availability of other infrastructures or services such as electricity or healthcare logistics. To mitigate this issue, Manacorda and Tesei [51] included a range of locational control variables. We used a similar approach in our study and therefore controlled for variables such as the number electricity grids and hospitals per 10,000 inhabitants, as well as other variables presented in Table 1. Moreover, we conducted an additional analysis to check whether our instrument affects vaccine uptake only through its effect on access to cell towers. The signal strength of cell towers decreases as the distance increases. In our sample, the median distance to the closest cell tower was around 10.67 km. We considered areas within the median distance and those above it as areas of high and low connectivity, respectively. Then, we regressed vaccine uptake on our instrument separately for high and low connectivity areas, and the results are presented in Appendix (Table A3).
4 Results
Table 2 presents our OLS estimates from baseline specifications that include all the vaccines presented in Table 1. All estimates represent the absolute change in our outcome variable. Column 1 shows the estimated effect of mobile phone coverage on vaccine uptake, excluding control variables and fixed effects. The estimated coefficient is negative and statistically significant, suggesting that one unit decrease in the distance to towers increases the probability of a child being vaccinated by about 0.11%. In addition to the control variables described in Table 1, columns 2 and 3 incorporate spatial fixed effects, with column 3 also including vaccine fixed effects. The resulting estimates are similar, indicating that reducing the distance to cell towers by one unit increases the likelihood of a child being vaccinated by approximately 0.14%. This corresponds to approximately two additional children vaccinated per 1,000 inhabitants as the distance decreases by one unit. The results still suggest that proximity to cell towers increases the probability of being vaccinated when we analyze each vaccine separately (Table 3). Nonetheless, the estimated coefficient is the highest for the BCG vaccine, which is associated with the disease having the highest incidence.
Access to cell tower and vaccine uptake
| Vaccine uptake | |||
|---|---|---|---|
| Variables | (1) | (2) | (3) |
| Distance to cell tower | −0.0011*** | −0.0014*** | −0.0014*** |
| (0.0001) | (0.0002) | (0.0002) | |
| Control variables | No | Yes | Yes |
| Region fixed effects | No | Yes | Yes |
| Vaccine fixed effects | No | No | Yes |
| Observations | 32,293 | 32,021 | 32,021 |
| R-squared | 0.0067 | 0.0548 | 0.0659 |
Robust standard errors in parentheses.
***means p < 0.01, the coefficient is significant at the 1% level. **means p < 0.05, the coefficient is significant at the 5% level. *means p < 0.1, the coefficient is significant at the 10% level.
Heterogeneity among vaccines
| (1) | (2) | (3) | (4) | |
|---|---|---|---|---|
| Variables | BCG | DTP | Polio | Measles |
| Distance to cell tower | −0.0021*** | −0.0011*** | −0.0012*** | −0.0012*** |
| (0.0004) | (0.0004) | (0.0003) | (0.0004) | |
| Control variables | Yes | Yes | Yes | Yes |
| Region fixed effects | Yes | Yes | Yes | Yes |
| Observations | 8,056 | 7,886 | 8,169 | 7,910 |
| R-squared | 0.0983 | 0.0809 | 0.0484 | 0.0444 |
Robust standard errors in parentheses.
***means p < 0.01, the coefficient is significant at the 1% level. **means p < 0.05, the coefficient is significant at the 5% level. *means p < 0.1, the coefficient is significant at the 10% level.
We further analyzed the heterogeneities in the association between communication infrastructure access and vaccine uptake. We began by examining the differences between rural and urban residences, with the results presented in Column 1 of Table 4. Both the baseline effect and the coefficient for the interaction between distance to cell towers and rural residence are negative and significant. This indicates that reducing the distance to cell towers significantly increases the likelihood of a child being vaccinated, with a more pronounced effect in rural areas. We also explore differences between low-, middle-, and high-income groups, with high income being the baseline group. Compared with the high-income group, the probability of being vaccinated in the low-income group increases more significantly as the distance from cell towers decreases. However, the result does not indicate any difference between middle- and high-income groups.
Heterogeneity by socio-economic characteristics
| Vaccine uptake | ||
|---|---|---|
| Variables | (1) | (2) |
| Distance to cell tower | −0.0010*** | −0.0012*** |
| (0.0002) | (0.0002) | |
| Distance to cell tower × rural residence | −0.0006*** | |
| (0.0002) | ||
| Distance to cell tower × lower income | −0.0006*** | |
| (0.0002) | ||
| Distance to cell tower × middle income | −0.0000 | |
| (0.0002) | ||
| Control variables | Yes | Yes |
| Region fixed effects | Yes | Yes |
| Observations | 32,021 | 32,021 |
| R-squared | 0.0662 | 0.0664 |
Robust standard errors in parentheses.
***means p < 0.01, the coefficient is significant at the 1% level. **means p < 0.05, the coefficient is significant at the 5% level. *means p < 0.1, the coefficient is significant at the 10% level.
5 IV
As previously mentioned, the placement of cell towers is not random; it is influenced by various factors, some of which may correlate with unobserved variables affecting vaccine uptake. Therefore, our OLS estimates may be biased. To mitigate endogeneity issue, we use lightning strike intensity as an IV. The results of the first and second stages are displayed in Panels a and b of Table 5, respectively. The estimates from the first step indicate that higher lightning intensity is associated with increased distance to cell towers. Moreover, the F-statistic is above the threshold, suggesting that our instrument is not weak. In the second step, the IV estimates indicate that reducing the distance to cell towers increases vaccine uptake. Although the coefficient sign is consistent with the OLS estimate, when we exclude the control variables and fixed effects (column 1 of Table 5) the IV estimate is larger in absolute value than the OLS (column 1 of Table 2). However, after including the control variables and fixed effects, the IV estimate (column 2 of Table 5) is similar to the OLS estimates (columns 1 and 2 of Table 2). This may suggest that the inclusion of controls has helped reduce the bias related to potential indirect pathways through which our instrument could affect the outcome variable.
IV regression
| (1) | (2) | |
|---|---|---|
| Panel a: First stage | Distance to cell tower | |
| Lightning intensity | 41.4624*** | 35.5680*** |
| (1.1260) | (1.2140) | |
| F statistic | 1356.03 | 858.45 |
| Panel b: Second stage | Vaccine uptake | |
| Distance to cell tower | −0.0026*** | −0.0013* |
| (0.0004) | (0.0007) | |
| Control variables | No | Yes |
| Region fixed effects | No | Yes |
| Vaccine fixed effects | No | Yes |
| Observations | 32,293 | 32,021 |
Robust standard errors in parentheses.
***means p < 0.01, the coefficient is significant at the 1% level. **means p < 0.05, the coefficient is significant at the 5% level. *means p < 0.1, the coefficient is significant at the 10% level.
6 Discussion
In this study, we examined the association between access to cell towers and vaccine uptake. We primarily used the distance between household clusters and the closest cell tower to approximate mobile technology access. The results suggest that a decrease in the distance to cell tower increases the probability of a child being vaccinated. The results remained consistent when we used the number of cell towers per 10,000 inhabitants as an alternative proxy for mobile connectivity. These findings align with those of other studies exploring the relationship between communication facilities and health outcomes. According to Iacoella and Tirivayi, a unit decrease in distance from the closest cell tower is associated with 0.5% increase in the probability that women test for HIV [35]. Flückiger and Ludwig found that access to mobile phone coverage reduces childhood mortality risk by 0.9% [21]. The coefficient size in our study is smaller than that found in previous studies. The difference may arise from the fact that these studies employ different outcome variables and focus on multiple countries rather than a specific country in sub-Saharan Africa.
Other findings of interest relate to the heterogeneity analyses. We found that reducing the distance to cell towers increases the likelihood of a child being vaccinated, with a more pronounced effect in rural areas. Moreover, for the low-income group, the probability of being vaccinated increases more significantly as the distance from cell towers decreases than for the high-income group. However, the result does not show any difference between middle and high-income groups. These findings are in line with previous studies, which suggest that the effect of communication infrastructure is greater for people and areas with limited access to information and health services [21,23].
Our study has some limitations that need to be highlighted. First, although our findings suggest a relationship between access to cell towers and vaccine uptake, we are unable to empirically investigate the potential mechanisms due to data constraints. Instead, we discussed about the mechanisms building on previous studies. Second, household location details were unavailable; therefore, we calculated the distance from cluster centroids to the closest cell tower. However, our findings remain consistent when we used the number of cell towers per 10,000 inhabitants. Finally, the cell tower database did not provide construction date of cell towers but rather the date each tower was registered. Hence, there could be a lag between the construction and registration dates. We checked the robustness of our findings by using a sample of cell towers that were registered in the database up to one year after the household survey, and the results aligned with our main findings.
7 Conclusions
This study reveals that better access to mobile technology is associated with increased vaccine uptake, particularly among individuals with limited resources. In light of these findings, we recommend that policymakers collaborate with mobile network operators to deploy cell towers in areas that still lack or have poor connectivity. However, given that cell towers can have adverse health effects, network operators should optimize the distance between homes and cell towers so that they are beneficial without causing harm.
-
Funding information: Authors state no funding involved.
-
Author contributions: All authors have accepted responsibility for the entire content of this manuscript and consented to its submission to the journal, reviewed all the results and approved the final version of the manuscript. OZM: conceptualization, data curation, formal analysis, writing – original draft, methodology. KT: conceptualization, methodology, writing – review and editing.
-
Conflict of interest: Authors state no conflict of interest.
-
Data availability statement: Data from the Côte d’Ivoire Living Standards Survey (CILSS) and the population census can be accessed upon request from the National Institute of Statistics. All other datasets are freely available as open access.
Appendix
As discussed earlier, we calculated the number of cell towers per 10,000 inhabitants for each geographic cluster as an alternative proxy of mobile network access to check the robustness of our results. The estimated coefficient in column 1 of Table A1 suggests that a unit increase in the number of cell towers per 10,000 inhabitants is associated with an increase of 0.31% in the likelihood of a child being vaccinated. This finding aligns with that in column 3 of Table 2; however, the estimates may not be comparable as we used a different proxy of mobile network access.
Robustness checks
| Vaccine uptake | ||
|---|---|---|
| Variables | (1) | (2) |
| Number of cell towers per 10,000 inhabitants | 0.0031*** | |
| (0.0012) | ||
| Distance to cell tower | −0.0019*** | |
| (0.0002) | ||
| Control variables | Yes | Yes |
| Region fixed effects | Yes | Yes |
| Vaccine fixed effects | Yes | Yes |
| Observations | 32,021 | 32,021 |
| R-squared | 0.0635 | 0.0665 |
Robust standard errors in parentheses.
***means p < 0.01, the coefficient is significant at the 1% level. **means p < 0.05, the coefficient is significant at the 5% level. *means p < 0.1, the coefficient is significant at the 10% level.
Another concern relates to the fact that the database does not report the date of construction for each tower but instead provides the date on which each tower’s information was added. As such, there may be a time lag between constructing a new tower and registering it in the database. Thus, some cell towers built in 2015, particularly at the end of the year, may have been registered in the database in 2016. Consequently, we also ascertain the robustness of our findings by using cell towers that were registered in the database up to 2016 to calculate the distance. The result presented in column 3 of Table 2 is consistent with that in column 3 of Table 2. However, the estimated coefficient is higher in absolute value. This may be because by including towers registered in 2016, we have captured the effect of some towers built in 2015 and missing from the 2015 sample. It should be noted, however, that when using cell towers recorded in the database up to 2016, our final dataset would include cell towers that were actually built in 2016, one year after the household survey was conducted. This could also have an effect on the estimated coefficient size.
We also check whether the distance to the closest cell tower and the number of cell towers per 10,000 inhabitants are good alternatives to each other. We regress the number of cell towers per 10,000 inhabitants on the distance to the closest cell tower, and the results are presented in Table A2. The results suggest that there is a relationship between these two indicators. Specifically, an increase in the distance to the closest cell tower is associated with a decrease in the number of cell towers per 10,000 inhabitants.
Association between the distance and number of cell towers per 10,000 inhabitants
| Number of cell towers per 10,000 inhabitants | ||
|---|---|---|
| Variables | (1) | (2) |
| Distance to cell tower | −0.0532*** | −0.0404*** |
| (0.0009) | (0.0006) | |
| Region fixed effects | No | Yes |
| Observations | 36,680 | 36,680 |
| R-squared | 0.1369 | 0.8207 |
Robust standard errors in parentheses.
***means p < 0.01, the coefficient is significant at the 1% level. **means p < 0.05, the coefficient is significant at the 5% level. *means p < 0.1, the coefficient is significant at the 10% level.
Finally, we test whether our instrument affects vaccine uptake only through its impact on access to cell towers. To this end, since the signal strength on cell towers decreases as the distance increases, we consider areas within the median distance and those above it as areas of high and low connectivity, respectively. Then, we regress vaccine uptake on our instrument separately in high and low connectivity areas. The results shown in Table A3 indicate that lightning strikes incidence affects vaccine uptake only in areas of high connectivity. This may suggest that our instrument affects the vaccine uptake only through its impact on cell towers.
Association between lightning strikes and vaccine uptake
| Vaccine uptake | ||
|---|---|---|
| High connectivity | Low connectivity | |
| Variables | (1) | (2) |
| Lightning strikes | −0.1853*** | −0.0197 |
| (0.0530) | (0.0306) | |
| Control variables | Yes | Yes |
| Region fixed effects | Yes | Yes |
| Vaccine fixed effects | Yes | Yes |
| Observations | 16,194 | 15,827 |
| R-squared | 0.0593 | 0.0823 |
Robust standard errors in parentheses.
***means p < 0.01, the coefficient is significant at the 1% level. **means p < 0.05, the coefficient is significant at the 5% level. *means p < 0.1, the coefficient is significant at the 10% level.
References
[1] WHO. Business case for WHO immunization activities on the African continent. 2018. https://www.afro.who.int/health-topics/immunization.Suche in Google Scholar
[2] UNICEF. Providing life saving vaccine to children using mobile phones. 2018. https://www.unicef.org/wca/stories/providing-life-saving-vaccine-children-using-mobile-phones.Suche in Google Scholar
[3] Obi-Jeff C, Garcia C, Onuoha O, Adewumi F, David W, Bamiduro T, et al. Designing an SMS reminder intervention to improve vaccination uptake in Northern Nigeria: a qualitative study. BMC Health Serv Res. 2021;21:844.10.1186/s12913-021-06728-2Suche in Google Scholar PubMed PubMed Central
[4] Aker JC, Ksoll C, Lybbert TJ. Can mobile phones improve learning? Evidence from a field experiment in Niger. Am Econ J: Appl Econ. 2012;4:94–120.10.1257/app.4.4.94Suche in Google Scholar
[5] Asongu S, Boateng A, Akamavi RK. Mobile phone innovation and inclusive human development: Evidence from Sub-Saharan Africa. SSRN Scholarly Paper 2822103. Rochester, NY: Social Science Research Network. Epub ahead of print 7 March 2016. 10.2139/ssrn.2822103.Suche in Google Scholar
[6] Asongu SA, Nwachukwu JC. The mobile phone in the diffusion of knowledge for institutional quality in Sub-Saharan Africa. World Dev. 2016;86:133–47.10.1016/j.worlddev.2016.05.012Suche in Google Scholar
[7] Chib A. The Aceh Besar midwives with mobile phones project: Design and evaluation perspectives using the information and communication technologies for healthcare development model. J Comput-Mediat Commun. 2010;15:500–25.10.1111/j.1083-6101.2010.01515.xSuche in Google Scholar
[8] Agarwal S, Perry HB, Long L-A, Labrique AB. Evidence on feasibility and effective use of mHealth strategies by frontline health workers in developing countries: Systematic review. Trop Med Int Health. 2015;20:1003–14.10.1111/tmi.12525Suche in Google Scholar PubMed PubMed Central
[9] Aker JC, Mbiti IM. Mobile phones and economic development in Africa. J Economic Perspect. 2010;24:207–32.10.1257/jep.24.3.207Suche in Google Scholar
[10] Akamike IC, Okedo-Alex IN, Alo C, Agu AP, Uneke CJ, Ogbonnaya LU. Effect of mobile-phone messaging on patient and health-worker knowledge and adherence to the isoniazid preventive therapy guideline in HIV clinics in Southeast, Nigeria. BMC Infect Dis. 2021;21:1080.10.1186/s12879-021-06759-4Suche in Google Scholar PubMed PubMed Central
[11] Amankwaa I, Boateng D, Quansah DY, Akuoko CP, Evans C. Effectiveness of short message services and voice call interventions for antiretroviral therapy adherence and other outcomes: A systematic review and meta-analysis. PLoS One. 2018;13:0204091.10.1371/journal.pone.0204091Suche in Google Scholar PubMed PubMed Central
[12] Bangure D, Chirundu D, Gombe N, Marufu T, Mandozana G, Tshimanga M, et al. Effectiveness of short message services reminder on childhood immunization programme in Kadoma, Zimbabwe - a randomized controlled trial, 2013. BMC Public Health. 2015;15:137.10.1186/s12889-015-1470-6Suche in Google Scholar PubMed PubMed Central
[13] Brown VB, Oluwatosin OA, Akinyemi JO, Adeyemo AA. Effects of community health nurse-led intervention on childhood routine immunization completion in primary health care centers in Ibadan, Nigeria. J Community Health. 2016;41:265–73.10.1007/s10900-015-0092-3Suche in Google Scholar PubMed
[14] Greenleaf AR, Ahmed S, Moreau C, Guiella G, Choi Y. Cell phone ownership and modern contraceptive use in Burkina Faso: implications for research and interventions using mobile technology. Contraception. 2019;99:170–4.10.1016/j.contraception.2018.11.006Suche in Google Scholar PubMed PubMed Central
[15] Jadhav A, Weis J. Mobile phone ownership, text messages, and contraceptive use: Is there a digital revolution in family planning? Contraception. 2020;101:97–105.10.1016/j.contraception.2019.10.004Suche in Google Scholar PubMed
[16] LeFevre AE, Shah N, Bashingwa JJH, George AS, Mohan D. Does women’s mobile phone ownership matter for health? Evidence from 15 countries. BMJ Glob Health. 2020;5:e002524.10.1136/bmjgh-2020-002524Suche in Google Scholar PubMed PubMed Central
[17] Uddin MJ, Shamsuzzaman M, Horng L, Labrique A, Vasudevan L, Zeller K, et al. Use of mobile phones for improving vaccination coverage among children living in rural hard-to-reach areas and urban streets of Bangladesh. Vaccine. 2016;34:276–83.10.1016/j.vaccine.2015.11.024Suche in Google Scholar PubMed PubMed Central
[18] van Heerden A, Harris DM, van Rooyen H, Barnabas RV, Ramanathan N, Ngcobo N, et al. Perceived mHealth barriers and benefits for home-based HIV testing and counseling and other care: Qualitative findings from health officials, community health workers, and persons living with HIV in South Africa. Soc Sci Med. 2017;183:97–105.10.1016/j.socscimed.2017.04.046Suche in Google Scholar PubMed PubMed Central
[19] Hampshire K, Porter G, Owusu SA, Mariwah S, Abane A, Robson E, et al. Informal m-health: How are young people using mobile phones to bridge healthcare gaps in Sub-Saharan Africa? Soc Sci Med. 2015;142:90–9.10.1016/j.socscimed.2015.07.033Suche in Google Scholar PubMed
[20] Yunusa U, Garba SN, Umar AB, Idris SH, Bello UL, Abdulrashid I, et al. Mobile phone reminders for enhancing uptake, completeness and timeliness of routine childhood immunization in low and middle income countries: A systematic review and meta-analysis. Vaccine. 2021;39:209–21.10.1016/j.vaccine.2020.11.043Suche in Google Scholar PubMed
[21] Flückiger M, Ludwig M. Mobile phone coverage and infant mortality in sub-Saharan Africa. J Econ Behav Organ. 2023;211:462–85.10.1016/j.jebo.2023.05.013Suche in Google Scholar
[22] Aldashev A, Batkeyev B. Broadband infrastructure and economic growth in rural areas. Inf Econ Policy. 2021;57:100936.10.1016/j.infoecopol.2021.100936Suche in Google Scholar
[23] Klonner S, Nolen P. Does ICT benefit the poor? Evidence from South Africa. Ver Für Socialpolitik Res Comm Dev Econ Proc Ger Dev Econ Conf Hann. 2010. https://www.tips.org.za/research-archive/annual-forum-papers/2010/item/2869-does-ict-benefit-the-poor-evidence-from-south-africa.Suche in Google Scholar
[24] Viollaz M, Winkler H. Does the internet reduce gender gaps?: The case of Jordan. J Dev Stud. 2022;58:436–53. 10.1080/00220388.2021.1965127.Suche in Google Scholar
[25] Acharya A, Basu S, Hanink DM. Spatial hedonic regression analysis of the impact of cell towers on las vegas real estate market. Prof Geographer. 2022;74:715–26.10.1080/00330124.2022.2048866Suche in Google Scholar
[26] Locke SL, Blomquist GC. The cost of convenience: Estimating the impact of communication antennas on residential property values. Land Econ. 2016;92:131–47.10.3368/le.92.1.131Suche in Google Scholar
[27] Rajapaksa D, Athukorala W, Managi S, Neelawala P, Lee B, Hoang VN, et al. The impact of cell phone towers on house prices: evidence from Brisbane, Australia. Env Econ Policy Stud. 2018;20:211–24.10.1007/s10018-017-0190-9Suche in Google Scholar
[28] Ackermann K, Awaworyi Churchill S, Smyth R. Mobile phone coverage and violent conflict. J Econ Behav Organ. 2021;188:269–87.10.1016/j.jebo.2021.04.038Suche in Google Scholar
[29] Pierskalla JH, Hollenbach FM. Technology and collective action: The effect of cell phone coverage on political violence in Africa. Am Polit Sci Rev. 2013;107:207–24.10.1017/S0003055413000075Suche in Google Scholar
[30] Ali MT, Muhsen YR, Chisab RF, Abed SN. Evaluation study of radio frequency radiation effects from cell phone towers on human health. Radioelectron Commun Syst. 2021;64:155–64.10.3103/S0735272721030055Suche in Google Scholar
[31] Balmori A. Evidence for a health risk by RF on humans living around mobile phone base stations: From radiofrequency sickness to cancer. Env Res. 2022;214:113851.10.1016/j.envres.2022.113851Suche in Google Scholar PubMed
[32] Hamza ZM, Hussein KH, Albderi SA, Hussain HH, Obaid AK. Assessment of health effects of cell-phone towers radiation in Najaf on human beings. AIP Conf Proc. 2023;2776:020015. 10.1063/5.0138465.Suche in Google Scholar
[33] Hocking B, Gordon IR, Grain HL, Hatfield GE. Cancer incidence and mortality and proximity to TV towers. Med J Aust. 1996;165:601–5.10.5694/j.1326-5377.1996.tb138661.xSuche in Google Scholar PubMed
[34] Subhan F, Khan A, Ahmed S, Malik MN, Bakshah ST, Tahir S. Mobile antenna’s and its impact on human health. J Med Imaging Health Inform. 2018;8:1266–73.10.1166/jmihi.2018.2296Suche in Google Scholar
[35] Iacoella F, Tirivayi N. Mobile Phones and HIV Testing: Multicountry instrumental variable analysis from Sub-Saharan Africa. J Med Internet Res. 2024;26:e48794. 10.2196/48794.Suche in Google Scholar PubMed PubMed Central
[36] Jama A, Godoy-Ramirez K, Byström E, Burström B, Roth A, Lindstrand A, et al. Tailored intervention with peer-to-peer as a tool to promote childhood vaccination in migrants. Eur J Public Health. 2020;30:ckaa165.1253. 10.1093/eurpub/ckaa165.1253.Suche in Google Scholar
[37] Moussa OZ, Takeuchi K. Does searching online for vaccination information affect vaccination coverage? Evidence from Sub-Saharan African countries. Econ Hum Biol. 2022;47:101181.10.1016/j.ehb.2022.101181Suche in Google Scholar PubMed
[38] Currie GE, McLeod C, Waddington C, Snelling TL. SMS-based interventions for improving child and adolescent vaccine coverage and timeliness: a systematic review. BMC Public Health. 2024;24:1753.10.1186/s12889-024-18900-4Suche in Google Scholar PubMed PubMed Central
[39] Chandir S, Dharma VK, Siddiqi DA, Khan AJ. Feasibility of using global system for mobile communication (GSM)-based tracking for vaccinators to improve oral poliomyelitis vaccine campaign coverage in rural Pakistan. Vaccine. 2017;35:5037–42.10.1016/j.vaccine.2017.07.026Suche in Google Scholar PubMed
[40] Touray K, Mkanda P, Tegegn SG, Nsubuga P, Erbeto TB, Banda R, et al. Tracking vaccination teams during polio campaigns in Northern Nigeria by use of geographic information system technology: 2013–2015. J Infect Dis. 2016;213:S67–72.10.1093/infdis/jiv493Suche in Google Scholar PubMed PubMed Central
[41] YALI. Mobile phone towers: The answer to vaccine availability. Young African Leaders Initiative. https://yali.state.gov/mobile-phone-towers-the-answer-to-vaccine-availability/ (2014, accessed 5 September 2024).Suche in Google Scholar
[42] WHO. Tuberculosis incidence (per 100 000 population). datadot. https://data.who.int/indicators/i/13B4226/C288D13 (2024, accessed 2 July 2025).Suche in Google Scholar
[43] WHO. Data provided by countries to WHO and estimates of tuberculosis burden generated by WHO for the Global Tuberculosis Report. https://www.who.int/teams/global-tuberculosis-programme/data (2022, accessed 4 March 2023).Suche in Google Scholar
[44] WHO. Country disease outlook: Côte d’Ivoire. https://www.afro.who.int/sites/default/files/2023-08/CIV.pdf (2023).Suche in Google Scholar
[45] MICS. Final report on Cote d’Ivoire. https://mics.unicef.org/sites/mics/files/Cote%20d%27Ivoire%202016%20MICS_French.pdf (2016, accessed 12 September 2024).Suche in Google Scholar
[46] World Bank. Individuals using the Internet (% of population) - Cote d’Ivoire. World Bank Open Data. https://data.worldbank.org (2024, accessed 24 September 2024).Suche in Google Scholar
[47] DataReportal. Digital 2022: Côte D’Ivoire. DataReportal – Global Digital Insights, https://datareportal.com/reports/digital-2022-cote-divoire (2022, accessed 8 September 2024).Suche in Google Scholar
[48] UNICEF. Protéger les enfants avec des vaccins qui sauvent des vies avec l’aide de téléphones mobiles | UNICEF. https://www.unicef.org/cotedivoire/recits/prot%C3%A9ger-les-enfants-avec-des-vaccins-qui-sauvent-des-vies-avec-laide-de-t%C3%A9l%C3%A9phones-mobiles (2018, accessed 9 September 2024).Suche in Google Scholar
[49] GAVI. M-Vaccin: Mobile technology boosts vaccination in Côte d’Ivoire, https://www.gavi.org/vaccineswork/m-vaccin-mobile-technology-service-vaccination-cote-divoire (2023, accessed 10 September 2024).Suche in Google Scholar
[50] Kaplan JO, Lau KH-K. The WGLC global gridded monthly lightning stroke density and climatology [dataset]. PANGAEA. 2019. 10.1594/PANGAEA.904253.Suche in Google Scholar
[51] Manacorda M, Tesei A. Liberation technology: Mobile phones and political mobilization in Africa. Econometrica. 2020;88:533–67. 10.3982/ECTA14392.Suche in Google Scholar
© 2025 the author(s), published by De Gruyter
This work is licensed under the Creative Commons Attribution 4.0 International License.
Artikel in diesem Heft
- Research Articles
- Relationship between body mass index and quality of life, use of dietary and physical activity self-management strategies, and mental health in individuals with polycystic ovary syndrome
- Evaluating the challenges and opportunities for diabetes care policy in Nigeria
- Body mass index is associated with subjective workload and REM sleep timing in young healthy adults
- Prediction of hypoglycaemia in subjects with type 1 diabetes during physical activity
- Investigation by the Epworth Sleepiness Scale of daytime sleepiness in professional drivers during work hours
- Understanding public awareness of fall epidemiology in the United States: A national cross-sectional study
- Impact of Covid-19 stress on urban poor in Sylhet Division, Bangladesh: A perception-based assessment
- Impact of the COVID-19 pandemic on mental health, relationship satisfaction, and socioeconomic status: United States
- Psychological factors influencing oocyte donation: A study of Indian donors
- Cervical cancer in eastern Kenya (2018–2020): Impact of awareness and risk perception on screening practices
- Older LGBTQ+ and blockchain in healthcare: A value sensitive design perspective
- Trends and disparities in HPV vaccination among U.S. adolescents, 2018–2023
- Do cell towers help increase vaccine uptake? Evidence from Côte d’Ivoire
- In search of the world’s most popular painkiller: An infodemiological analysis of Google Trend statistics from 2004 to 2023
- Brain fog in chronic pain: A concept analysis of social media postings
- Association between multidimensional poverty intensity and maternal mortality ratio in Madagascar: Analysis of regional disparities
- A “disorder that exacerbates all other crises” or “a word we use to shut you up”? A critical policy analysis of NGOs’ discourses on COVID-19 misinformation
- Smartphone use and stroop performance in a university workforce: A survey-experiment
- Review Articles
- The management of body dysmorphic disorder in adolescents: A systematic literature review
- Navigating challenges and maximizing potential: Handling complications and constraints in minimally invasive surgery
- Examining the scarcity of oncology healthcare providers in cancer management: A case study of the Eastern Cape Province, South Africa
- Dietary strategies for irritable bowel syndrome: A narrative review of effectiveness, emerging dietary trends, and global variability
- The impact of intimate partner violence on victims’ work, health, and wellbeing in OECD countries (2014–2025): A descriptive systematic review
- Nutrition literacy in pregnant women: a systematic review
- Short Communications
- Experience of patients in Germany with the post-COVID-19 vaccination syndrome
- Five linguistic misrepresentations of Huntington’s disease
- Letter to the Editor
- PCOS self-management challenges transcend BMI: A call for equitable support strategies