
Micro-CT analysis of creased and folded multilayer cardboard
-
Camilla Persson
 ,
Patrik Karlsson
,
Patrik Karlsson

Abstract
Micro-CT analysis of experimentally creased and folded multilayer cardboards reveals insights into how the material deformation due to the creasing and folding process of cardboard impact the material concerning delaminations and position of broke particles. Delaminations were found in various locations and varied in size from just under a tenth of a millimeter to up to four times the thickness of the cardboard. The particles varied in size, ranging from a few micrometers to slightly larger than the cardboard thickness. Characteristic dimensions for the creased and folded cardboard were measured for selected cross sections. The differences in characteristic dimensions for the cross sections among the samples were typically a few hundredths of a millimeter. There are differences between cross-sections that are a few hundredths of a millimeter apart.
1 Introduction
The structure of creases and folds in multilayer cardboards is investigated. Variations in the structure along the crease line and properties of creased and folded cardboard are identified. The analysis utilizes computed tomography at a microscopic scale (1 μm) and bending moment measurements, a property frequently used to characterize folding (Niskanen 2012).
The entire production chain must be optimized for sustainable development, not just individual parts. A damaged package with discarded contents has a far greater environmental impact than the packaging alone (Williams and Wikström 2011; Singh et al. 2018). This highlights the importance of considering the entire product chain’s impact in each packaging application. Therefore, it is crucial to understand the converting processes, including the folding behavior, to ensure consistent performance across all instances.
Creasing and folding are critical processes in transforming cardboard into an intact package with high structural integrity. Cardboard, an anisotropic and inhomogeneous material, requires creasing to create an indentation that reduces its folding resistance (bending stiffness). The objective of the creasing is to make the cardboard behave like a hinge during folding, i.e., ensuring that the folded cardboard has in-plane strength and stiffness, remains intact and simultaneously provides a well-defined package form capable of withstanding mechanical loading when used. For instance, a significant portion of the compressive load on a package is supported by its corners (Grangård 1970; Marin et al. 2021; Ristinmaa et al. 2012).
The creasing and folding process involves deformation and damage mechanisms (Coffin and Nygårds 2017). The process has been investigated through numerical modeling and measurement, focusing on aspects such as creasing depth and the impact of the creasing matrix (Huang and Nygårds 2011; Huang et al. 2014; Nagasawa et al. 2003) and the shear strength in different layers (Nygårds et al. 2014). Recently, numerical simulation has modeled the creasing and folding of a package corner, revealing a complex interaction of delamination and self-contact (Robertsson et al. 2023).
Generally, fiber bonds are observed to break during creasing due to the shear stresses induced during the loading part of the creasing process, resulting in delamination. Delamination also occurs during the unloading part of the creasing process as the material relaxes and internal stresses redistribute (Nygårds et al. 2009). During folding, additional delaminations occur, and visible cavities are formed. The cavities result in characteristic impressions, visible as bulges, see Figure 1. Bending stiffness, a property frequently studied concerning creasing and folding, is often measured using various techniques to assess changes during the process (Coffin and Nygårds 2017).
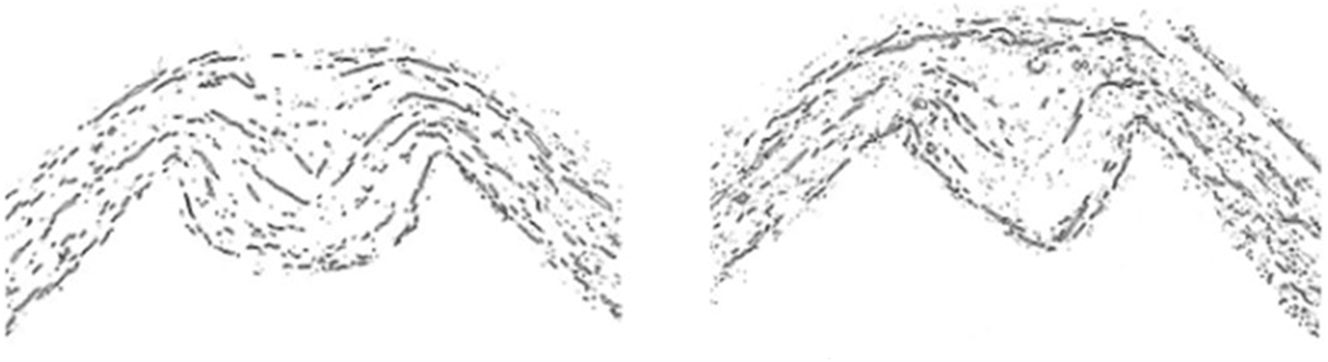
Example of cross-sections of creased and folded cardboard.
The structure of creased and folded cardboard is typically shown in cross-sections, such as SEM images. Variations include delamination symmetry, bulge skewness, shape, indentation groove visibility, and potential surface layer cracks (Persson et al. 2023). Symmetrical creases without in-plane cracks lead to desired folding results (Coffin and Nygårds 2017).
The creasing and folding process has been extensively studied to understand and optimize packaging and product chains. Studies typically investigate the structure of creased and folded cardboard, and different properties are evaluated based on the microscopic characteristics of selected cross-sections.
A problem that may arise if only single cross-sections are studied is that variations along the crease line are missed. Previous studies indicate that there is a variation in structure and behavior along the crease line (Coffin and Nygårds 2017), but the published literature on the variation is sparse.
The pupose of this study is to expand the published knowledge of the structure of creased and folded cardboard and its variation along the fold.
Computed tomography (CT) is a well-used method to obtain 3D images of materials (Maire and Withers 2014) and has been used to study cellulose based fiber material and cardboard in several previous studies of defects, fibers, pores, fluid transport and mechanical behavior (Du Roscoat et al. 2012; Johansson et al. 2022; Kaeppeler et al. 2022; Mark et al. 2012; Pacheco and Goyal 2011; Saxena et al. 2017; Viguié et al. 2011; Wallmeier et al. 2021).
This study uses computed tomography to investigate the 3D microstructure of creased and folded cardboard, aiming to visualize the fold along the entire crease line. This will reveal whether cross-sectional images in the area vary or remain consistent.
2 Materials and methods
The board used is a four-ply board. The stock (pulp slurry) has been sprayed out from the headbox onto a flat wire. Each ply has been formed separately and was then couched together. The board was manufactured at Iggesund Mill, Holmen Kartong. In this study, the cardboard is called KM1. It has a grammage of about 330 g/m2, a thickness of about 0,44 mm and is uncoated. The cardboard was creased in the laboratory in Iggesund with Marbach punch (Laborpresse) and crease-tested with their Lorentzen and Wettre (Creasability tester PTS) tools for crease sample analysis.
Creasing was done to a crease depth of the cardboard thickness, i.e., where the creasing ruler, a two-point ruler (0,7 mm), was in the upper edge line of the matrix (pertinax width 1,1 mm), as shown in Figure 2. The die was deep enough to avoid contact between the cardboard and the bottom of the die during creasing. The creases and folds are denoted according to Figure 3 relative to the directions of the cardboard.
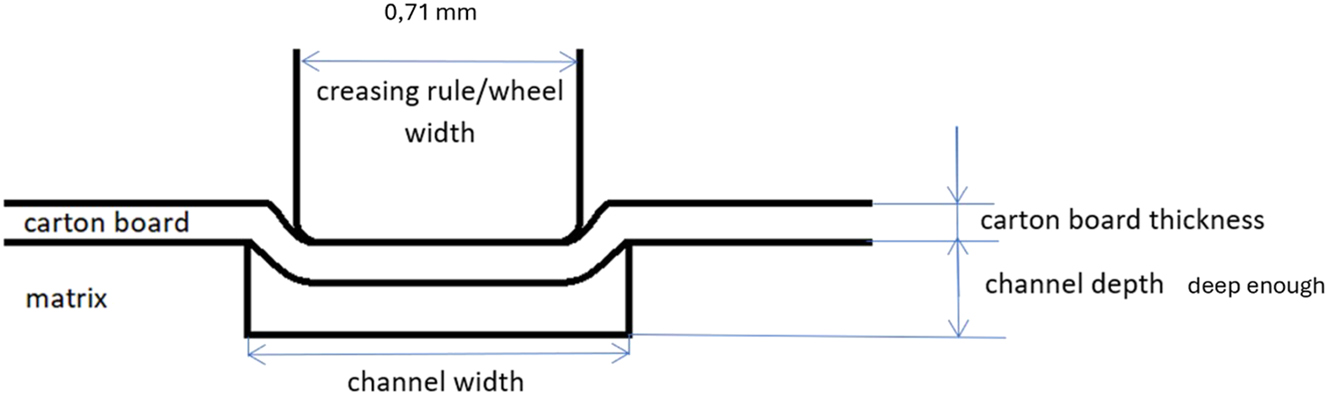
Schematic creasing device (not to scale).
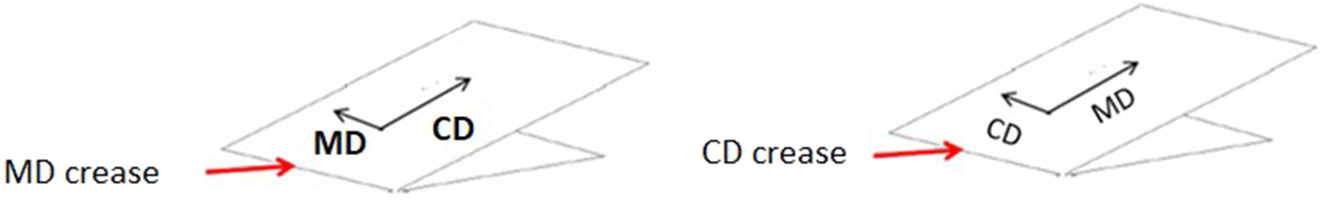
Crease-designations: Relative to the machine direction (MD) and transverse direction (CD) of the carton board.
After the creasing, bending measurements were carried out on creased samples at Iggesund Mill, where the sample is bent (90° per second) with the crease in the center of rotation at the same time as the reaction force is measured. The arm length of the used bending moment tester was 10 mm, the sample width was 37,5 mm and the sample length 75 mm. The samples were folded 90° towards the ridge. The bending moment curves show an average of five measurements. See Figure 4.
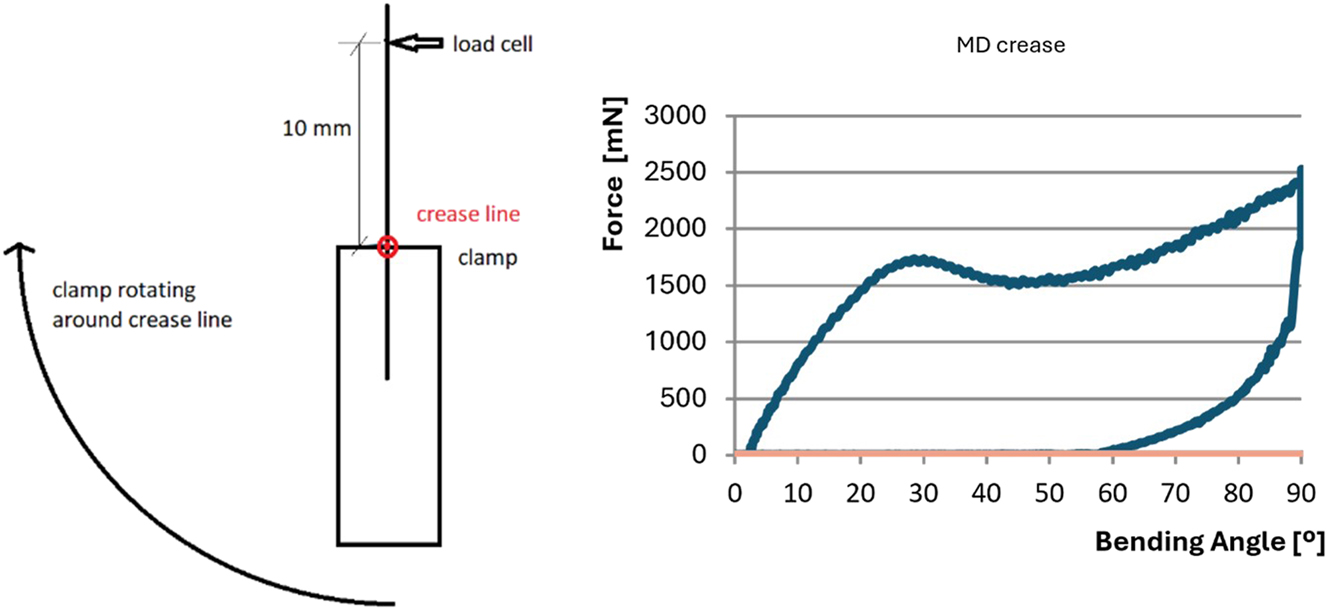
Bending moment measurement: Equipment (schematic left), example bending moment curve (right). After creasing, the cardboard has an indentation groove on the indentation side and a ridge on the other. The cardboard is bent towards the ridge. Sample width 37.5 mm and sample length 75 mm, crease line 37.5 mm from the edge in the middle of the sample. The sample is mounted with the crease line in the center of rotation.
The unfolded samples and the sample folded to 90° during bending measurement were analyzed with the help of µCT scanner Bruker Skyscan 1,272 when relaxed. The samples inserted into the CT scanner were cut with a scalpel to the dimensions of 7 × 34 mm and inserted into a sample holder, as shown in Figure 5; a directional display paper was used to keep track of the mounting side (the order of the samples). An electric current of 200 µA and acceleration voltage of 50 kV were used in the CT scans, and no filter was applied during scanning in the Bruker CT system. The scan resolution was set to 4,904 × 3,280, and the voxel size was approximately 2 µm. CT data was reconstructed using InstaRecon software, optimizing the data set concerning post-alignment correction, beam hardening, and ring artifacts. After scanning and reconstruction, the CT volume data was analyzed in the Volume Graphics VGStudio Max three software by utilizing cross-sectional viewing of scanned specimens. To ensure that no important raw data was filtered out, the CT-data analyzed in the present study was the unfiltered raw data and measurements were done manually in the VGStudio software cross-sectional views.
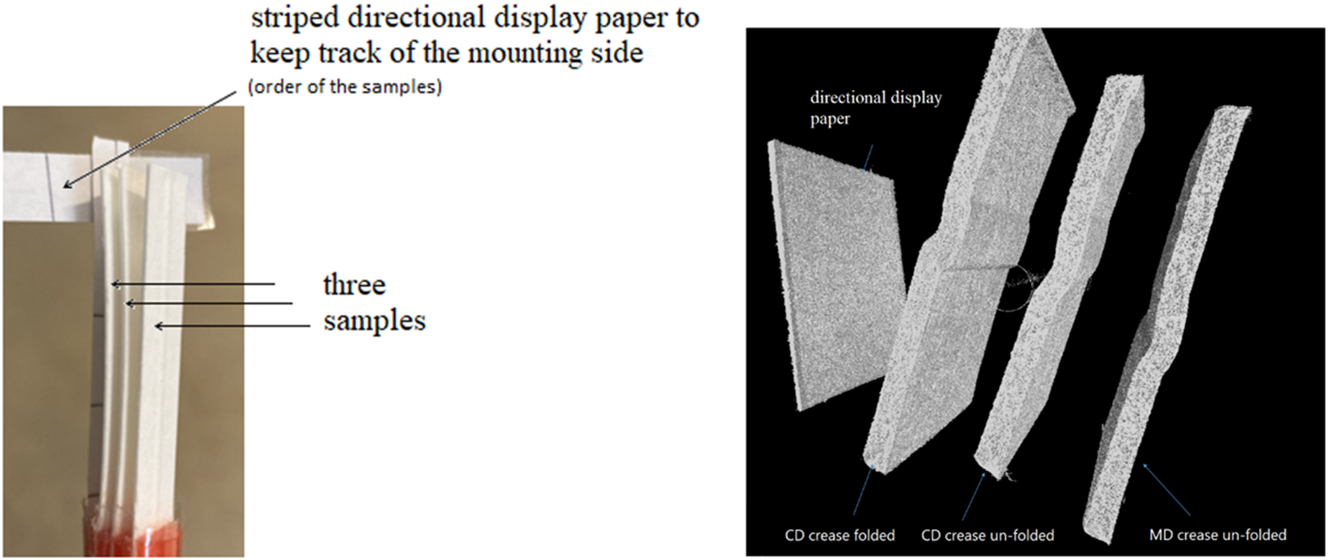
Test holder to the left; three samples have been mounted, as well as a piece of paper for directional guidance. 3D µCT scan to the right; the samples were assembled in order: Directional display paper, CD crease folded, CD crease un-folded, MD crease un-folded.
Three different types of sections were analyzed: cross-sections approximately perpendicular to the crease line (here designated TOP – usually those studied in SEM microscopes), cross-sections approximately parallel to the crease line (here designated FRONT), and cross-sections approximately in the thickness direction parallel to the plane of the cardboard (here designated RIGHT). An example of an intersection plane for the different cross-sections is illustrated in Figure 6.
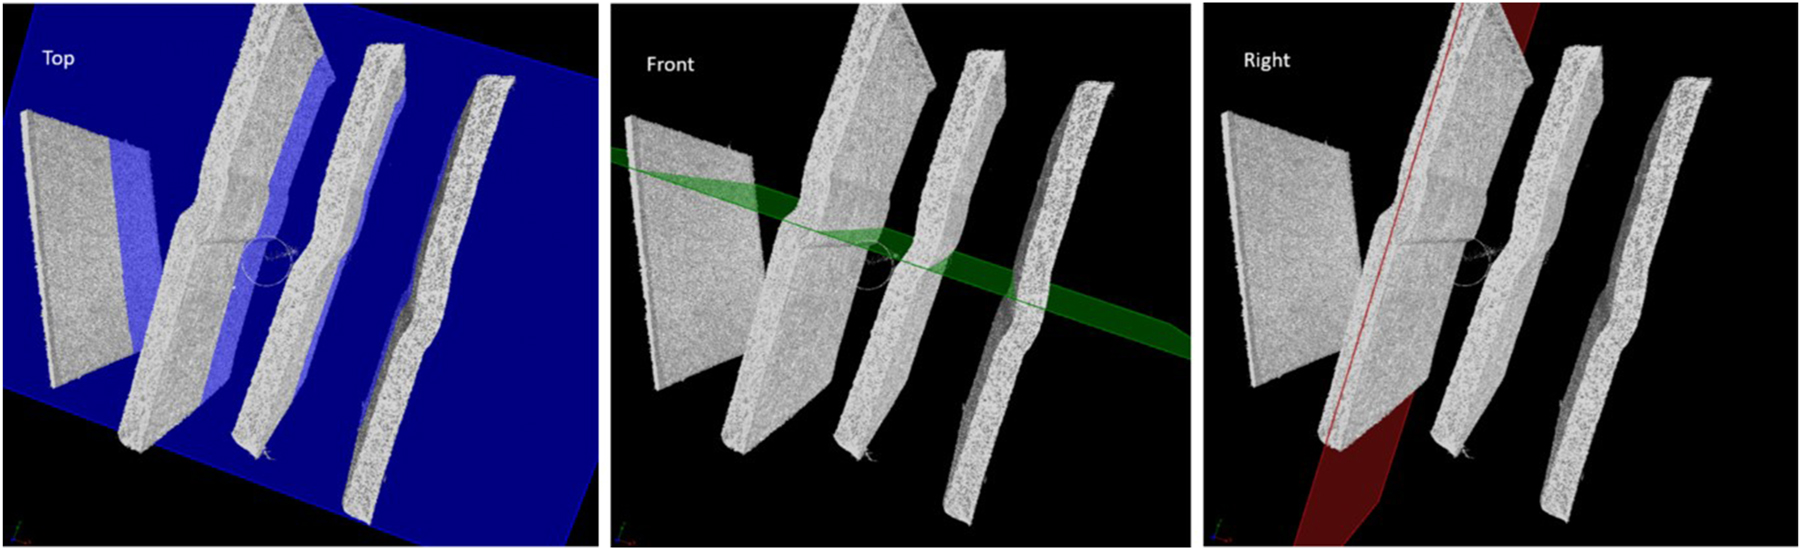
Example of planes for cross-sectional images illustrated in the 3D scan images. Illustration of how cross-sections perpendicular to the crease through the cardboard (TOP) were taken, cross-sections parallel to the crease through the cardboard (FRONT) and cross-sections parallel to the thickness direction (RIGHT) of the cardboard were taken.
For each type of cross-section a series of images spaced 0.02 mm apart were studied. The spacing distance was chosen to be able to capture interesting differences. Typical images of cross-sections were selected and are shown in the results. The images have been analyzed in terms of typical structure (dimensional variation), particles, and delaminations.
Figure 7 presents the dimensions measured for the cross-section TOP perpendicular to the crease line to characterize the crease and fold. Variations in the width of the cardboard and the length of particulates and delaminations have been studied in cross-sections parallel to the crease line (FRONT). Examples of cross-sections RIGHT are given to show what they look like. The measurements of the characteristic dimensions were performed in Adobe Photoshop (PS 2024) with the ruler tool (using Filters (Stylize, Trace Contour), zoomed 200 %, and with the help of guides).
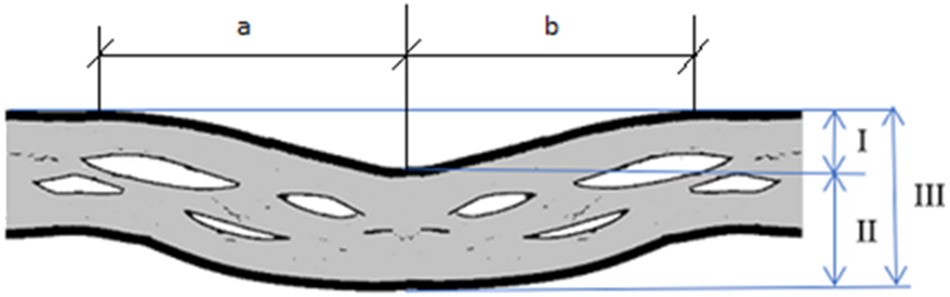
Measurement of crease geometry according to Persson et al. 2023. Supplemented with measurements a and b from the middle to the two edges, measurements a and b differ if the crease is asymmetrical.
3 Results and discussion
3.1 Bending momentum
The measured bending momentum for KM1 Holmen MD crease is 22mNm, and for KM1 Holmen CD, it is 30mNm. The results of all the bending momentum measurements are summarized in Table 1.
Results of bending momentum measurements.
| KM1 MD crease | KM1 CD crease | |||||
|---|---|---|---|---|---|---|
| Property | Mean | Std | CoV | Mean | Std | CoV |
| P&T crease momentum 90° (mNm) | 22.4 | 1.76 | 7.9 % | 30.4 | 2.9 | 9.4 % |
| P&T crease force F5° (mN) | 407.6 | 46.13 | 11.3 % | 627.9 | 96.3 | 15.3 % |
| P&T crease force F15° (mN) | 1,120.5 | 80.1 | 7.1 % | 1793.9 | 182.2 | 10.2 % |
| P&T crease maximum force, Fmax (mN) | 2,235.9 | 175.5 | 7.9 % | 3,071.5 | 251.1 | 8.2 % |
| P&T crease momentum 15 sek (mNm) | 13.2 | 1.34 | 10.1 % | 18.8 | 2.2 | 11.5 % |
| P&T crease angle maximum force (º) | 90.0 | 0.07 | 0.1 % | 89.2 | 1.2 | 1.3 % |
3.2 General structure of CT image of multilayer cardboard
A CT scan provides a three-dimensional image of the cardboard. The microstructure of the tested sample is generally shown in grayscale in CT images, such as Figure 8, which shows a TOP cross-sectional image of a creased board. What CT scans illustrate is density variations. High density corresponds to a bright area, and low density corresponds to a dark area.
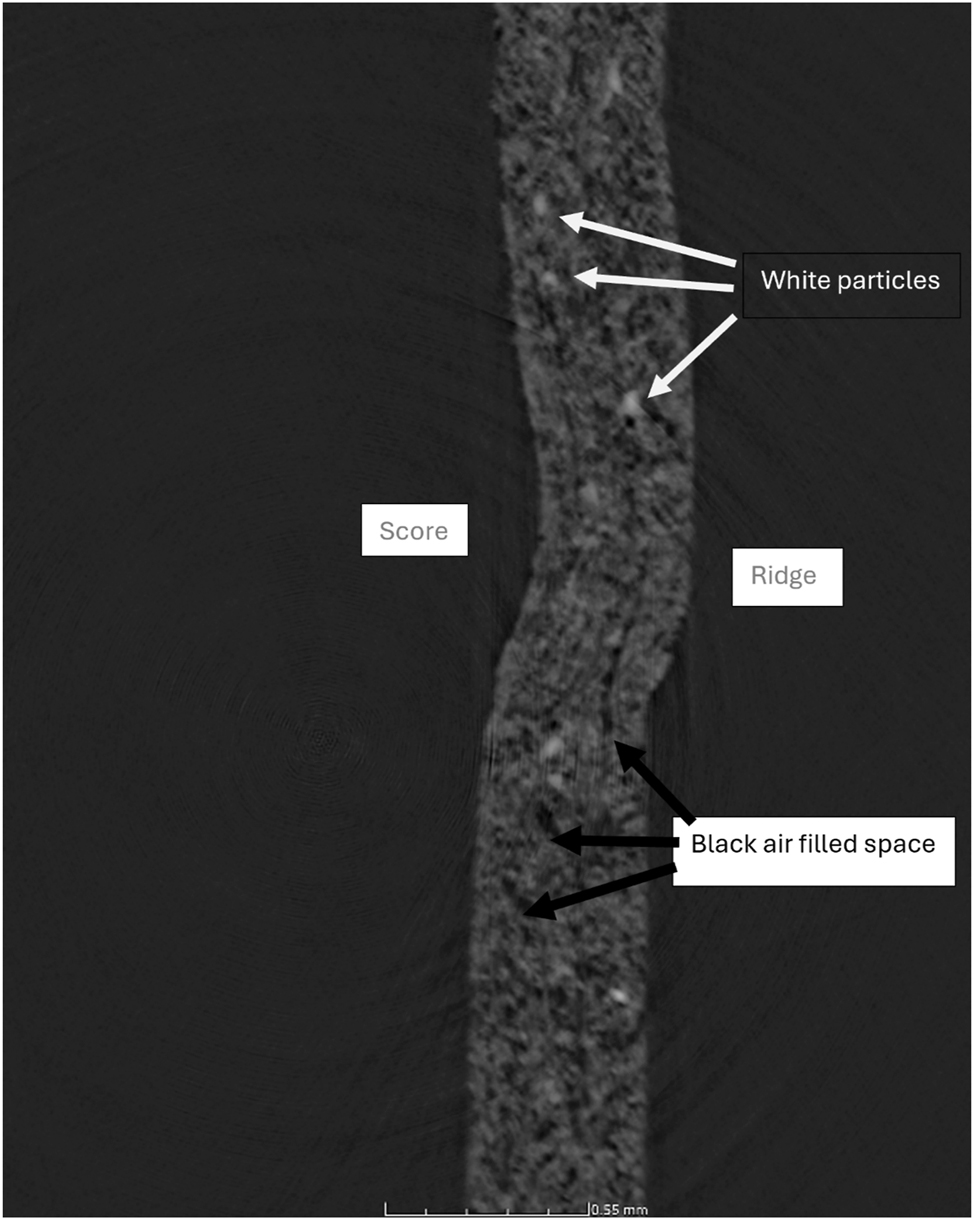
Creased board.
In the figures, the fibers are visible in light grey. The pores of the cardboard material is visible by the presence of darker areas in the board. Particles, that have a higher density than the cellulose fibers, appear brighter than the light grey.
Different aspects of the creased and folded cardboard are illustrated in the different types of cross-sections.
3.3 TOP – cross section perpendicular to the crease line
The crease line is visible as a score where the creasing ruler has hit and as a bead on the opposite side of the TOP cross-section perpendicular to the crease line, see Figure 8.
Figure 9 shows cross-sectional images perpendicular to the crease line (TOP) of both folded and unfolded boards, highlighting variations in local behavior at microscale distances. This figure includes four subfigures: 9a, 9b, 9c, and 9d, each containing images of the three cardboard samples mounted in the CT-holder. The images are denoted “CD folded,” “CD creased,” and “MD creased”, i.e., one sample creased in CD and folded and two samples only creased in the CD and MD directions. CT scanning for Figure 9b and c, and 9d were conducted at distances of 0.04 mm, 0.14 mm, and 0.16 mm along the crease line, respectively, relative to Figure 9a. The distances between the subfigures are small, approximately a few times the fiber thickness.
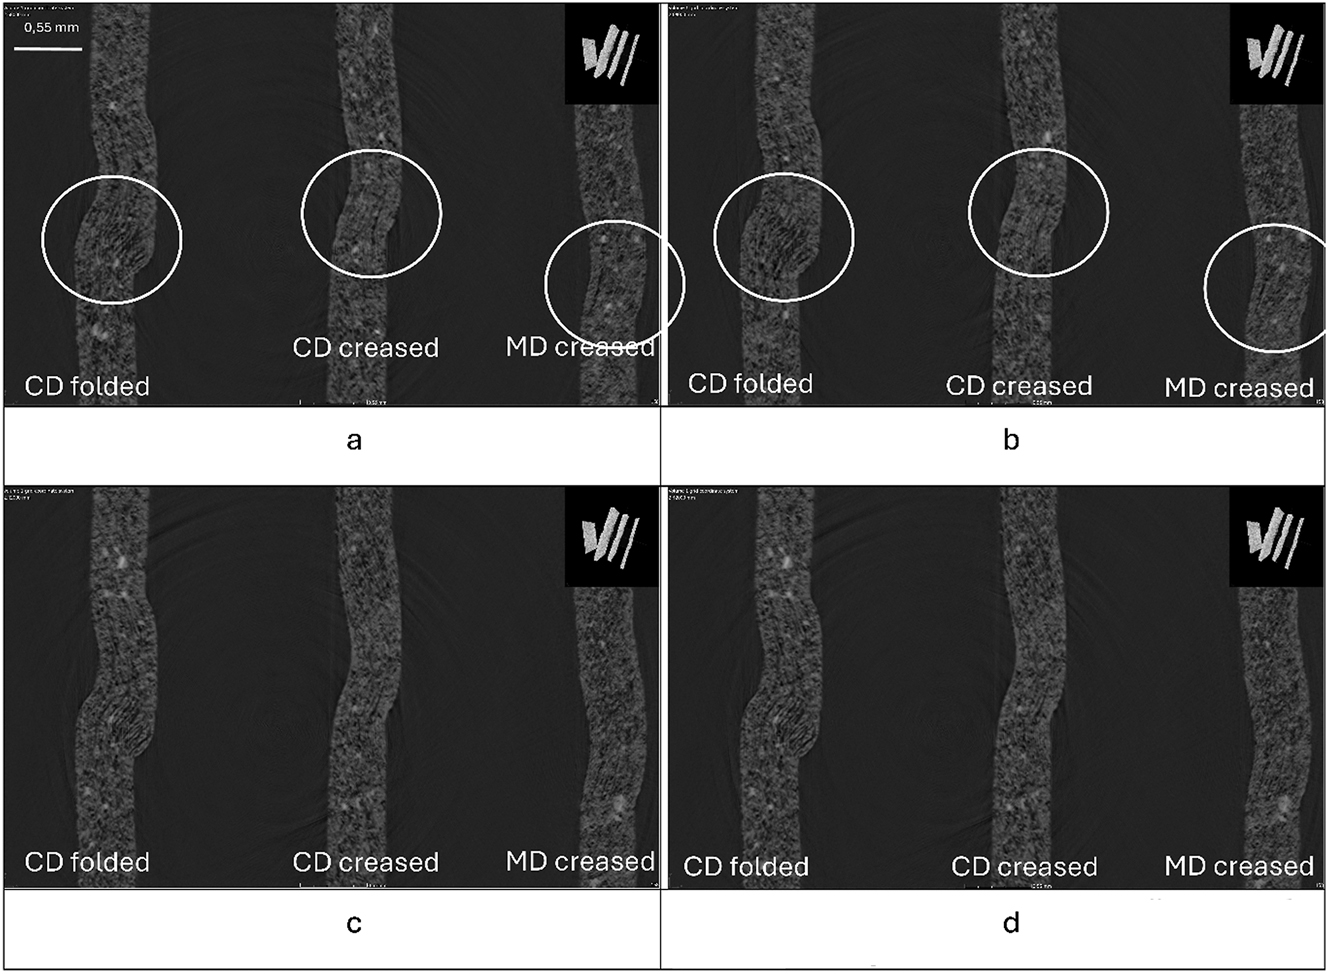
Cross-sectional TOP images for the creased and folded board samples. Same scale in all subfigures.
Visual differences between the creased images in Figure 9a and b are noticeable, particularly in the areas highlighted by white circles. Images 9a, 9c, and 9d appear more similar to each other than to the images in Figure 9b, with Figure 9c and d being perceived as very similar.
Figure 9c and d shows less delamination in the top layer for the folded sample, which appears less open compared to Figure 9b. The areas where visual differences between Figure 9a and b are noted have been circled. Cavities appear black in the images. For the folded sample, located on the far left of the subfigures, more open delaminations are visually evident in Figure 9b than in Figure 9a. The canted black lines at the edge of the bead within the marked circles are clearer or wider in Figure 9b.
For the creased unfolded CD sample in the middle of the images, Figure 9a shows slightly longer delamination at the bottom edge of the crease than Figure 9b, where the delamination appears more open. Additionally, in Figure 9b–a more pronounced delamination is visible at the top of the crease, evident inside the rings. For the creased unfolded MD sample, more open delamination is seen in Figure 9a compared to Figure 9b.
Characteristic dimensions I-III, as shown in Figure 7 for the folded and unfolded but creased cardboard, are listed in Table 2. The measurements vary by a few hundredths of a millimeter across different cross-sections along the crease line, with a minimum deviation of 0.01 mm and a maximum of 0.07 mm (or 20 %) of the measurement. Surface roughness differences are of the same magnitude, approximately 0.02 mm on each side, resulting in a total variation of ± 0.04 mm. If measurements were made against a smoothed “mean” line for the cardboard surface rather than a local intersection, the impact of surface roughness would be minimized. However, the values in Table 2 would not have been expected to change significantly. This study was based on measurements performed manually, but the values in Table 2 are considered accurate. Characteristic dimensions a-b, as depicted in Figure 7 for the folded and unfolded but creased board, are tabulated in Table 3. If the dimensions a and b differ, the fold or crease line is asymmetrical. The analysis shows that none of the samples studied are symmetrical, with an average difference of 0.3 mm between dimensions a and b in the images shown in Figure 9. The maximum difference measured is just under 1 mm.
Characteristic dimensions I-III for cross-sections of creased and folded cardboard. Average of five measurements, as well as minimum and maximum value measured.
| Measure [mm] | CD folded | CD creased | MD creased | |||||||||
|---|---|---|---|---|---|---|---|---|---|---|---|---|
| In cross- section | Top 0 mm | Top 0.04 mm | Top 0.14 mm | Top 0.16 mm | Top 0 mm | Top 0.04 mm |
Top 0.14 mm |
Top 0.16 mm |
Top 0 mm | Top 0.04 mm |
Top 0.14 mm |
Top 0.16 mm |
| I | 0.1653 | 0.1387 | 0.1559 | 0.1624 | 0.1435 | 0.1635 | 0.1568 | 0.1529 | 0.101 | 0.105 | 0.121 | 0.1209 |
| Min | 0.1639 | 0.1372 | 0.1546 | 0.1599 | 0.1435 | 0.1634 | 0.1555 | 0.1515 | 0.0996 | 0.1024 | 0.1209 | 0.1196 |
| Max | 0.1654 | 0.14 | 0.1572 | 0.1639 | 0.1462 | 0.1648 | 0.1568 | 0.1542 | 0.1023 | 0.1063 | 0.1223 | 0.1222 |
| II | 0.4679 | 0.4885 | 0.4795 | 0.4716 | 0.4146 | 0.4093 | 0.4146 | 0.4239 | 0.4292 | 0.4677 | 0.4797 | 0.4438 |
| Min | 0.4666 | 0.4871 | 0.4781 | 0.47 | 0.4146 | 0.408 | 0.4133 | 0.4226 | 0.4292 | 0.4664 | 0.4784 | 0.4438 |
| Max | 0.4681 | 0.491 | 0.4836 | 0.4742 | 0.4186 | 0.4093 | 0.4146 | 0.424 | 0.4306 | 0.469 | 0.481 | 0.4478 |
| III | 0.6304 | 0.6258 | 0.6366 | 0.6339 | 0.5621 | 0.5727 | 0.5701 | 0.5755 | 0.5316 | 0.5713 | 0.6019 | 0.5673 |
| Min | 0.6278 | 0.6245 | 0.6353 | 0.6326 | 0.5581 | 0.5727 | 0.5687 | 0.5742 | 0.5289 | 0.469 | 0.6006 | 0.566 |
| Max | 0.6306 | 0.6258 | 0.638 | 0.6351 | 0.5634 | 0.5741 | 0.5727 | 0.5755 | 0.5329 | 0.5726 | 0.6033 | 0.5687 |
Characteristic dimensions for cross-sections of creased and folded cardboard.
| Measure [mm] | CD folded | CD creased | MD creased | |||||||||
|---|---|---|---|---|---|---|---|---|---|---|---|---|
| In cross- section | Top 0 mm | Top 0.04 mm | Top 0.14 mm | Top 0.16 mm | Top 0 mm | Top 0.04 mm |
Top 0.14 mm |
Top 0.16 mm |
Top 0 mm | Top 0.04 mm |
Top 0.14 mm |
Top 0.16 mm |
| a | 0.89 | 0.74 | 0.94 | 1.46 | 1.09 | 0.95 | 0.99 | 0.96 | 0.71 | 0.77 | 1.21 | 1.11 |
| b | 0.64 | 0.50 | 0.52 | 0.47 | 0.72 | 0.67 | 0.74 | 0.78 | 0.55 | 0.60 | 0.91 | 0.52 |
| a/b [−] | 1.40 | 1.48 | 1.80 | 3.10 | 1.51 | 1.40 | 1.34 | 1.24 | 1.28 | 1.30 | 1.33 | 2.12 |
3.4 FRONT – cross section parallel to the crease line
Figure 10 presents cross-sectional FRONT images of the crease line for both folded and unfolded boards, as depicted in Figure 6. The CT images are labeled “CD folded,” “CD creased,” and “MD creased” in each subfigure from 10a to 10f. The cavities observed in the images, with lengths of 1.75 mm, 0.56 mm, and 0.32 mm along the board’s in-plane direction, are interpreted as longitudinal delamination lines. Generally, longitudinal delaminations are present in all creased samples across all plies. However, the concentration and distribution between the top and middle plies vary slightly between cross-sections.
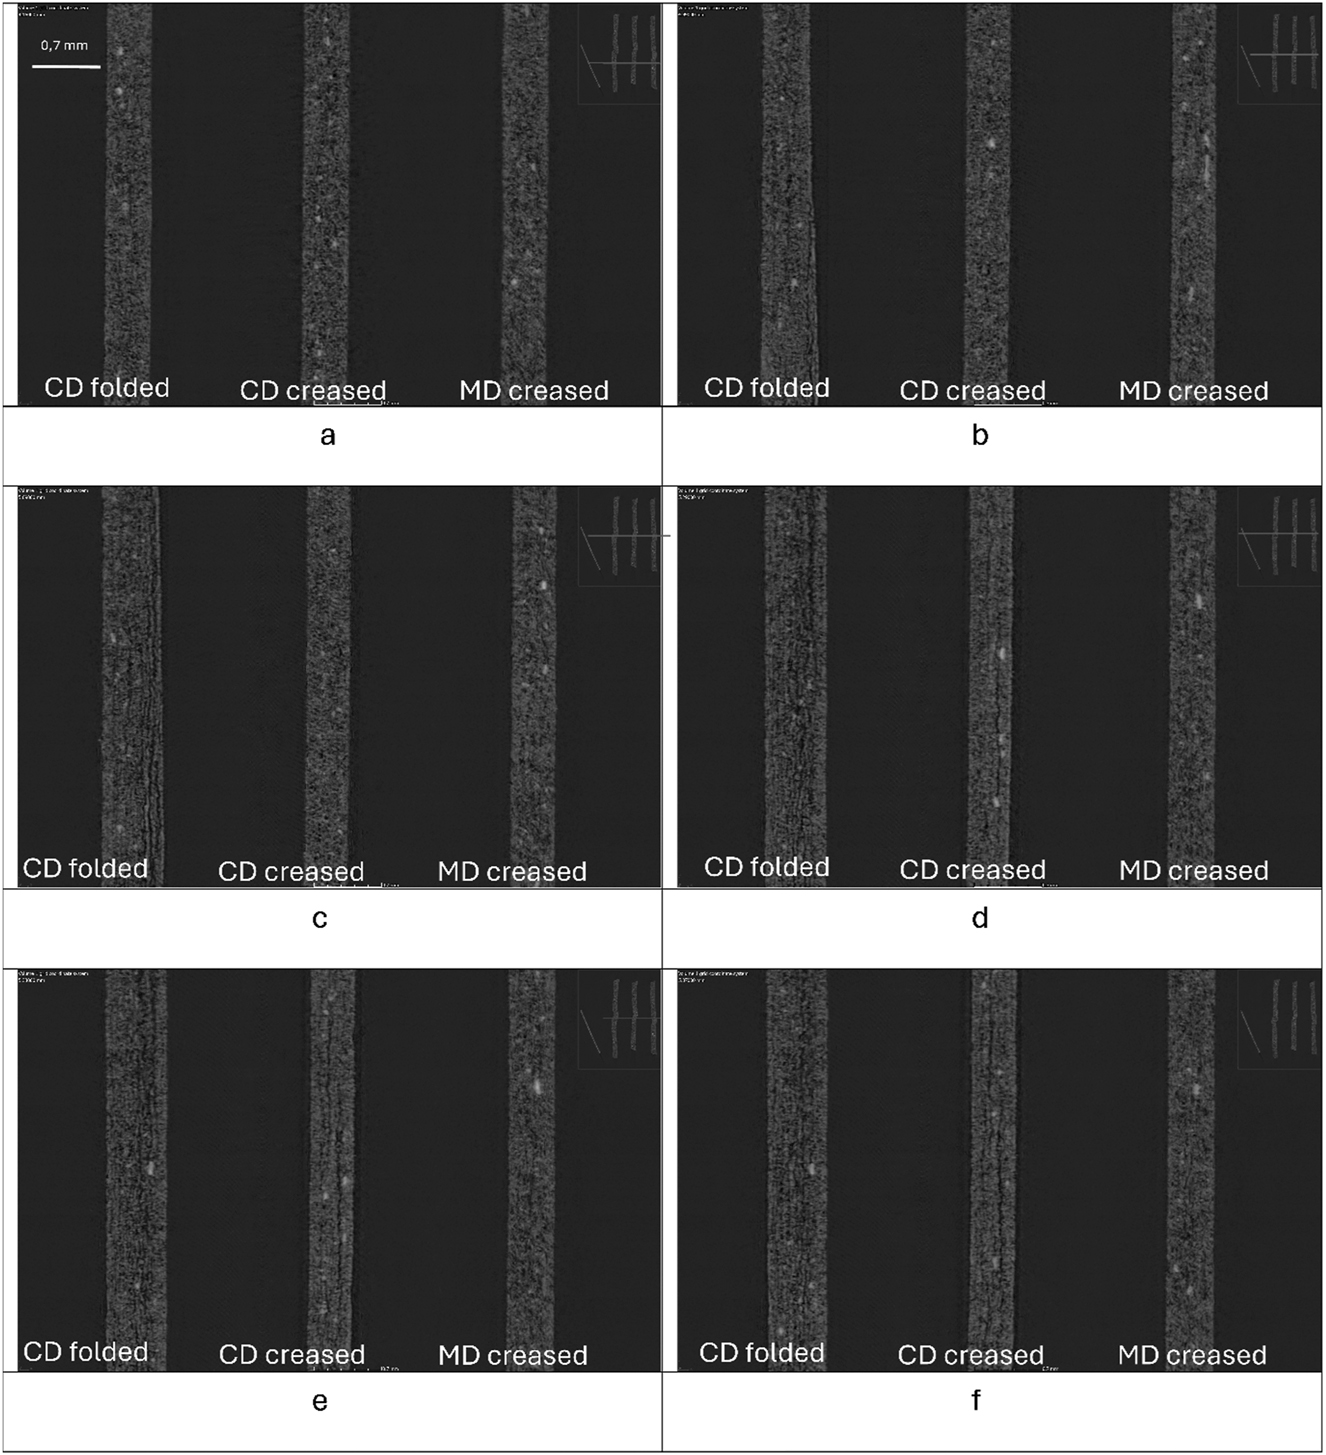
Cross-sectional FRONT images for the creased and folded board samples.
In Figure 10a, the sample images outside the creased area highlight some density variations in the cardboard and the presence of particles. Figure 10b displays the folded sample “CD folded” at its most delaminated point, where longitudinal delaminations are visible. Notably, as is visible in Figure 10a–f, a pronounced delamination does not run parallel to the outer surface but cuts diagonally through the material, indicating layer breaking. Longitudinal delaminations for the “CD creased” sample are only shown in Figure 10d–f, the other subfigures shows areas outside the creased region for this sample. However, for the “MD creased” sample, the delamination is at the center of the crease region in Figure 10b. As shown in the figures, more delamination lines become visible when the sample is folded, especially at the edge and bottom. The folded sample is also thicker than the creased samples.
Clear delamination lines are not visible in the “MD creased” sample, even when examining the crease line directly. There are, however, short, elongated structures in the longitudinal direction that highlight the crease line. Since the crease in the “MD creased” sample runs parallel to the machine direction, the fibers align with the direction of the crease. Consequently, greater pressure is typically required to achieve a noticeable effect in the MD direction due to the fiber orientation.
The delaminations vary across the cross-section, ranging in length from short (approximately 0.08 mm) to long (about 3–4 times the thickness of the cardboard). Measurements taken from the images in Figure 10 show that the thickness of the cardboard fluctuates by a few hundredths of a millimeter up to a few tenths of a millimeter (see Table 4).
Paper board thickness in FRONT images.
| CD folded | CD creased | MD creased | |
|---|---|---|---|
| Max | 0.68 | 0.50 | 0.51 |
| Min | 0.49 | 0.45 | 0.45 |
| Difference | 0.19 | 0.05 | 0.05 |
The variation observed in the TOP images in Figure 9 is mirrored in the FRONT images of Figure 10, where the extent of delamination changes along the crease line, either up or down in the image. Notably, more delamination is visible in the bottom layer compared to the rest of the board thickness.
3.5 RIGHT – cross section in the cardboard plane
Figure 11 presents examples of cross-sectional RIGHT images of the creased and folded cardboard, i.e. of the “CD folded” sample with the cross sectional planes cut out parallel to the plane depicted in Figure 6 to the right. In Figure 11, the fibers are visible as light ribbons in the RIGHT cross-sections. However, it is difficult to estimate fiber length from a single RIGHT cross-section, as the fiber may continue into or out-of-the plane without being visible. Figure 11 displays an RIGHT image sequence that progressively reveals different board views. Initially, only the un-creased board is visible on the left. In the subsequent images, the view extends to the right of the crease; finally, only the crease bulge is visible and a little of the cardboard to the left of the crease.
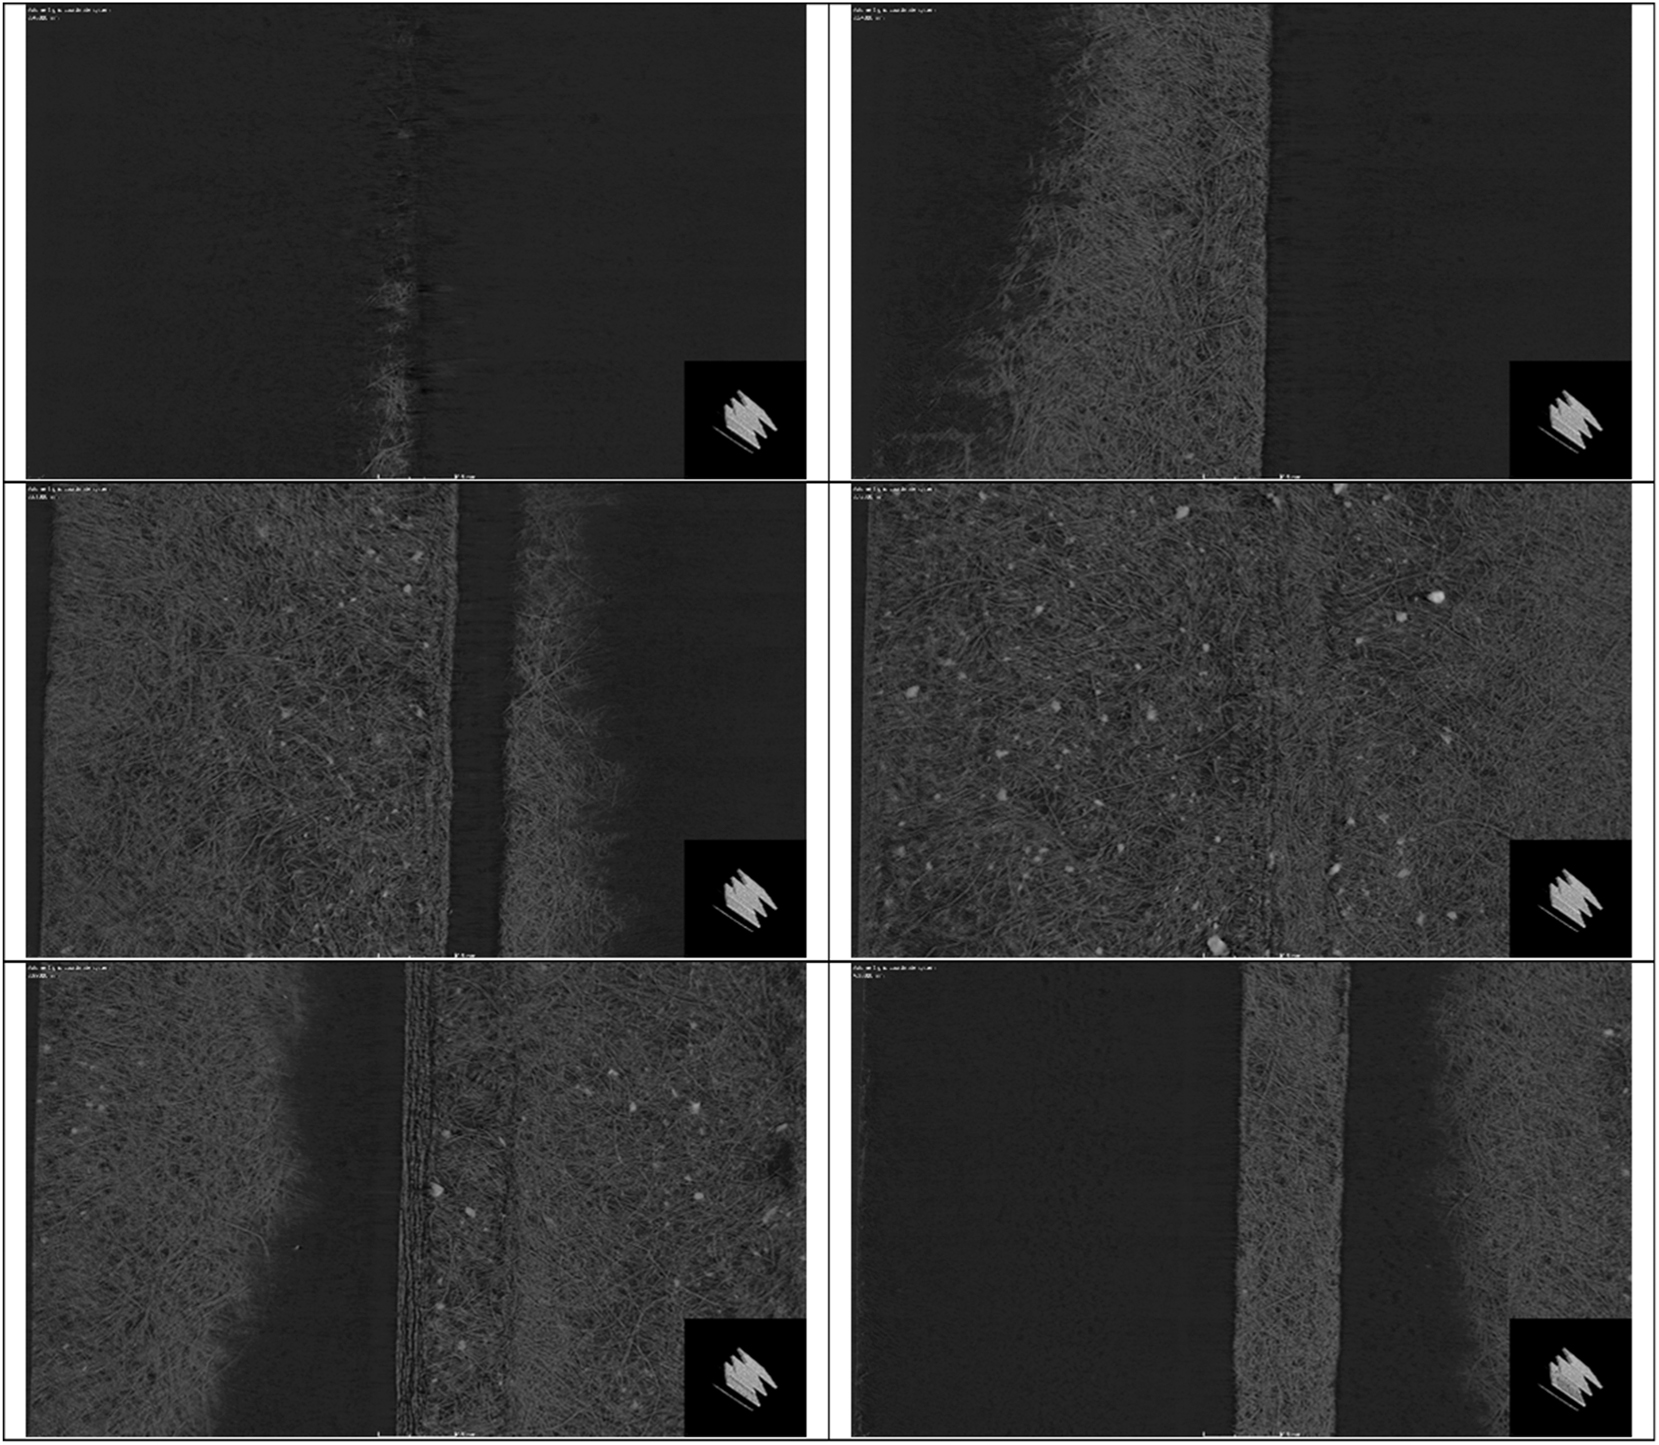
Example of cross-sectional RIGHT images.
3.6 Depth, extent, and location of particles
The images in Figure 9 show that broke particles can differ in images at a distance of 0.02 mm. The particles both exist and are not present in the vicinity of delamination. Figure 12 shows the extent of a broke particle from its beginning to its end, 0.32 mm away. In the first cross-section, the particle appears to be small, then larger, until it fades away again. Broke particles range from a few micrometers to sizes slightly larger than the cardboard thickness. Broke particles may orginate from filling particles, which are of similar sizes (du Roscoat et al. 2012).
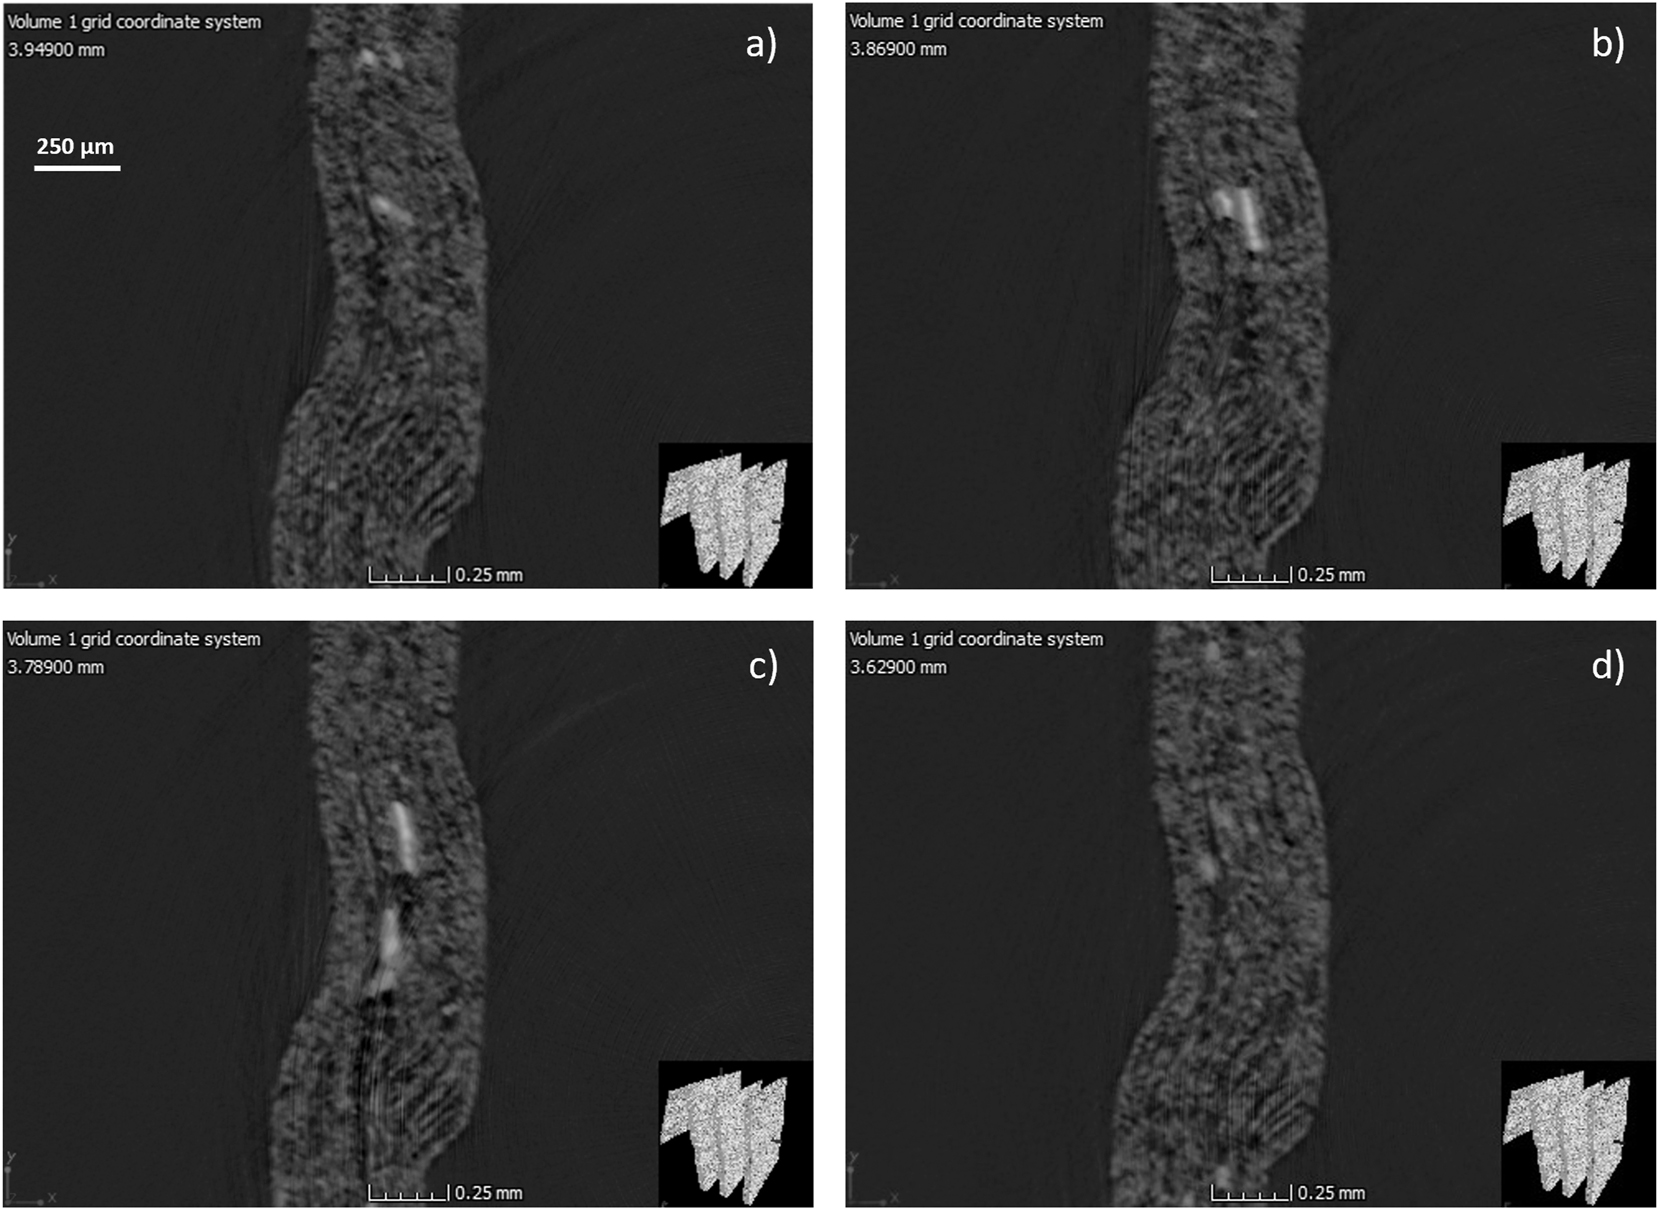
TOP-view cross-sectional images of a broke particle at different positions along the crease line: (a) Initial appearance, (b) 0.08 mm from (a), (c) 0.16 mm from (a), and (d) 0.32 mm from (a).
4 Conclusions
In the present study, micro-CT scanning was utilized to analyze the internal microstructure of creased and folded multilayer cardboard in three dimensions. The findings reveal substantial variation in delamination patterns and the presence of high-density broke particles along and across the crease line, even at very small spatial distances (as little as 0.02 mm). These structural differences underscore the limitations of relying solely on single cross-sectional images to evaluate crease and fold quality. Delaminations ranged from less than 0.1 mm to several times the board thickness and appeared in different layers and orientations. Similarly, broke particles varied significantly in size and were found in association with areas of delamination. It was found that CT is a powerful tool for material analysis of cardboard materials and the results highlight the importance of comprehensive 3D imaging, enabled by CT, when assessing the structural integrity of packaging. Detailed insights into the material structure are essential for optimizing material design and converting processes to ensure consistent performance in packaging applications.
Funding source: Knowledge foundation
Award Identifier / Grant number: 20220035
Acknowledgments
This work has been financed by the Knowledge foundation within the project Characterization of paperboard for creasing and folding (CPCF). The contributions by Holmen, Billerud and TetraPak are gratefully acknowledged.
-
Research ethics: Not applicable.
-
Informed consent: Not applicable.
-
Author contributions: Camilla, Christer and Patrik have done the analysis and interpretation of creased and folded samples both in CT and bending diagram, developed the method for CT scanning and image analysis and written the draft of the article. Hannes Vomhoff has contributed with material and experimental creasing and bending. Johan Tryding, Mikael Nygårds, Christophe Barbier, Hannes Vomhoff, Anders Biel and Ulf Stigh have contributed: with assistance in analysis and interpretation of CT images. with assistance in the development of the method to characterize the crease and fold with image analysis. to the writing of the article. The authors have accepted responsibility for the entire content of this manuscript and approved its submission.
-
Use of Large Language Models, AI and Machine Learning Tools: None declared.
-
Conflict of interest: The authors state no conflict of interest.
-
Research funding: Knowledge foundation reference number 20220035.
-
Data availability: All data analyzed during this study are included in this published article.
References
Coffin, D. and Nygårds, M. (2017). Creasing and folding, advances in pulp and paper research. In: Batchelor, W. and Söderberg, D. (Eds.).Trans. of the XVIth fund res symp. FRC, Manchester, Oxford, pp. 69–136.10.15376/frc.2017.1.69Suche in Google Scholar
du Roscoat, S.R., Bloch, J.F., and Caulet, P. (2012). A method to quantify the 3D microstructure of fibrous materials containing mineral fillers using X-ray microtomography: application to paper materials. J. Mater. Sci. 47: 6517–6521, https://doi.org/10.1007/s10853-012-6575-z.Suche in Google Scholar
Grangård, H. (1970). Compression of board cartons. 1. Correlation between actual tests and empirical equations. Sven. Papperstidning, Nord. Cellul. 73: 462.Suche in Google Scholar
Huang, H. and Nygårds, M. (2011). Numerical and experimental investigation of paperboard folding. Nordic Pulp Paper Res. J. 26: 452–467.10.3183/npprj-2011-26-04-p452-467Suche in Google Scholar
Huang, H., Hagman, A., and Nygårds, M. (2014). Quasi static analysis of creasing and folding for three paperboards. Mech. Mater. 69: 11–34, https://doi.org/10.1016/j.mechmat.2013.09.016.Suche in Google Scholar
Johansson, S., Engqvist, J., Tryding, J., and Hall, S.A. (2022). Microscale deformation mechanisms in paperboard during continuous tensile loading and 4D synchrotron X-ray tomography. Strain 58: e12414, https://doi.org/10.1111/str.12414.Suche in Google Scholar
Kaeppeler, U., Huenniger, J., and Engisch, L. (2022). Evaluation of measurement methods for compression, re-swelling and material thickness through the embossing process of cardboard. Adv. Print. Media Technol. XLVIII(VIII) – Session 4B: 85–100.Suche in Google Scholar
Maire, E. and Withers, P.J. (2014). Quantitative X-ray tomography. Int. Mater. Rev. 59: 1–43, https://doi.org/10.1179/1743280413Y.0000000023.Suche in Google Scholar
Marin, G., Srinivasa, P., Nygårds, M., and Östlund, S. (2021). Experimental and finite element simulated box compression tests on paperboard packages at different moisture levels. Packag. Technol. Sci. 34: 229–243, https://doi.org/10.1002/pts.2554.Suche in Google Scholar
Mark, A., Berce, A., Sandborg, R., Edelvik, F., Glatt, E., Rief, S., Wiegmann, A., Fredlund, M., Amini, J., Rentzhog, M., et al.. (2012). Multi-scale simulation of paperboard edge wicking using a fiber-resolving virtual paper model. Tappi J. 11: 9–14.10.32964/TJ11.6.9Suche in Google Scholar
Nagasawa, S., Endo, R., Fukuzawa, Y., Uchino, S., and Katayama, I. (2003). Effect of crease depth and crease deviation on folding deformation characteristics of coated paperboard. J. Mater. Process. Technol. 140: 157–162, https://doi.org/10.1016/S0924-0136(03)00825-2.Suche in Google Scholar
Niskanen, K. (2012). Mechanics of paper products. De Gruyter, Berlin, Boston.Suche in Google Scholar
Nygårds, M., Just, M. and Tryding, J. (2009). Experimental and numerical studies of creasing of paperboard, Int. J. Solids Struct. 46: 11–12.10.1016/j.ijsolstr.2009.02.014Suche in Google Scholar
Nygårds, M., Bhattacharya, A., and Krishnan, S.V.R. (2014). Optimizing shear strength profiles in paperboard for better crease formation. Nordic Pulp Paper Res. J. 29: 510–520, https://doi.org/10.3183/npprj-2014-29-03-p510-520.Suche in Google Scholar
Pacheco, M. and Goyal, D. (2011) Detection and characterization of defects in microelectronic packages and boards by means of high-resolution X-ray computed tomography (CT). In: Proceedings IEEE 61st electronic components and technology conference (ECTC). Lake Buena Vista, FL, USA, pp. 1263–1268.10.1109/ECTC.2011.5898673Suche in Google Scholar
Persson, C., Eriksson, H., and Korin, C. (2023). The influence of creases on carton board package behavior during point loading. Nordic Pulp Paper Res. J. 38: 491–499, https://doi.org/10.1515/npprj-2023-0021.Suche in Google Scholar
Ristinmaa, M., Ottosen, N.S., and Korin, C. (2012). Analytical prediction of package collapse loads - basic considerations. Nordic Pulp Paper Res. J. 27: 806–813, https://doi.org/10.3183/npprj-2012-27-04-p806-813.Suche in Google Scholar
Robertsson, K., Jacobsson, E., Wallin, M., Borgqvist, E., Ristinmaa, M., and Tryding, J. (2023). A continuum damage model for creasing and folding of paperboard. Packag. Technol. Sci. 36: 1037–1050, https://doi.org/10.1002/pts.2774.Suche in Google Scholar
Saxena, P., Bissacco, G., Stolfi, A., and Chiffre, L.D. (2017). Characterizing green fiber bottle prototypes using computed tomography. In: Proceedings of 7th Conference on industrial computed tomography. iCT2017, Leuven, Belgium.Suche in Google Scholar
Singh, S., Kumar, J., and Rao, P.V.M. (2018). Environmental impact assessment framework for product packaging. Manag. Environ. Qual. 29: 499–515, https://doi.org/10.1108/meq-10-2017-0105.Suche in Google Scholar
Viguié, J., Dumont, P.J.J., Mauret, E., du Roscoat, S.R., Vacher, P., Desloges, I., and Bloch, J.-F. (2011). Analysis of the hygroexpansion of a lignocellulosic fibrous material by digital correlation of images obtained by X-ray synchrotron microtomography: application to a folding box board. J. Mater. Sci. 46: 4756–4769, https://doi.org/10.1007/s10853-011-5386-y.Suche in Google Scholar
Wallmeier, M., Barbier, C., Beckmann, F., Brandberg, A., Holmqvist, C., Kulachenko, A., Moosmann, J., Östlund, S., and Pettersson, T. (2021). Phenomenological analysis of constrained in-plane compression of paperboard using micro-computed tomography Imaging. Nordic Pulp & Paper Res J 36: 491–502, https://doi.org/10.1515/npprj-2020-0092.Suche in Google Scholar
Williams, H. and Wikström, F. (2011). Environmental impact of packaging and food losses in a life cycle perspective: a comparative analysis of five food items. J. Clean. Prod. 19: 43–48.10.1016/j.jclepro.2010.08.008Suche in Google Scholar
© 2025 the author(s), published by De Gruyter, Berlin/Boston
This work is licensed under the Creative Commons Attribution 4.0 International License.
Artikel in diesem Heft
- Frontmatter
- Bleaching
- A new strategy for biological enzyme bleaching: combined effects of laccase, xylanase, and mannanase in the bleaching of softwood kraft pulp – a synergistic effect of enzymes
- Mechanical Pulping
- Characterization of the low consistency pulp refining conducted by the plates with different bar-groove width ratios
- Paper Technology
- On the influence of macro-scale stress variations on the dynamic dewatering of water-saturated polymer fibre networks
- Effects of dispersion hydrophobized MgO nanoparticles in low polarity solvent on aged paper
- Preparation and properties of effective low-cost composite filler for bible paper
- Paper Physics
- Normal and shear delamination of paperboards
- Micro-CT analysis of creased and folded multilayer cardboard
- Paper Chemistry
- Preparation of MgO/CaCO3 nanocomposites and their deacidification properties for paper documents
- Effects of sequential plasma modification and alkali treatment applied to cellulose fibers on the properties of the paper
- Coating
- Production of nano silver and nano silica coated paper to be used in active packaging
- Insights into bibliometric review for natural coatings for paper-based food packaging: trends, perspectives, and future directions
- RSM optimization of spray-coating parameters to enhance paper strength using cellulose nanocrystals extracted from young coconut husks
- Chemical Technology/Modifications
- NSSC pulp treatment with the Fenton reaction: fiber modification for reduced energy consumption in papermaking
- Other
- Fenton degradation of biologically pre-treated pulp and paper effluent using zero-valent iron from commercial steel wool
- Corrigendum
- Corrigendum to: Preparation and synthesis of water-soluble chitosan derivative incorporated in ultrasonic-assistant wheat straw paper for antibacterial food-packaging