A passive wireless sensor signal anti-interference method based on RFID
-
Xueli Guo
 ,
Feng Zheng
,
Feng Zheng

Abstract
The study proposes an anti-interference method based on Radio Frequency Identification (RFID) technology to solve the shortcomings of current wireless passive sensors on signal reception strength and anti-interference capability. The new method improves the signal recognition capability of RFID technology by introducing the blind equalization algorithm, and further enhances the security and anti-interference effect through frequency authentication technology. The results showed that the designed method significantly improved the anti-interference performance and transmission distance of the sensor signal, and had better stability and reliability than that of the traditional method. This designed method has significant practical significance in fields such as Industrial Internet of Things and smart cities. It can effectively improve the accuracy and reliability of sensor data, enhancing the efficiency and safety of the entire system, and laying a foundation for achieving more intelligent and efficient wireless communication systems and Internet of Things applications.
1 Introduction
Radio Frequency Identification (RFID) technology has gained widespread adoption in sensor signal transmission due to its low cost, wireless communication, and long-distance collection performance [1]. However, in practical applications, wireless passive sensors are susceptible to Electromagnetic Interference (EMI), multipath effects, and environmental noise, leading to signal distortion, reduced data accuracy, and compromised system reliability [2], 3]. These challenges are particularly critical in Industrial Internet of Things (IIoT) scenarios, where sensor stability directly impacts operational efficiency and safety [4]. Existing anti-interference methods, such as spatial filtering and spread spectrum techniques, often struggle to balance signal throughput and robustness in complex environments. For example, wavelet denoising and entropy energy models have shown limited adaptability to dynamic interference [5], 6].
Therefore, this study aims to develop a new anti-interference method based on RFID technology, which will bring new progress to industries and others. A method combining a blind equalization algorithm model based on RFID technology with a frequency recognition model is innovatively proposed. The new method adopts blind equalization algorithm to enhance signal recognition and anti-interference ability, thereby improving the safety and anti-interference effect of frequency recognition. By optimizing the signal processing flow, the new method can not only effectively reduce the impact of multipath effect and EMI on the signal, but also further enhance the security and anti-interference capability of the signal through frequency authentication technology. Compared with the traditional method, the anti-interference performance of this method in the complex electromagnetic environment is significantly improved. Meanwhile, the signal reception distance and data transmission efficiency are significantly improved. The research is divided into six main structural sections. Section 1 details the important role of wireless passive sensors in current technology and the challenges posed by insufficient signal reception strength and interference problems. Section 2 reviews and summarizes the current research progress in the field of wireless sensor signal immunity. Section 3 details the proposed RFID-based signal immunity approach for wireless passive sensors. Section 4 demonstrates the experimental design of the method. Section 5 discusses the experimental results in depth. Section 6 summarizes the main findings and emphasizes the contribution of the designed method to improving the anti-interference performance of wireless passive sensor signals.
2 Related works
Sensors often experience signal interference in complex electromagnetic environments. Therefore, how to improve the signal reception of sensors has become a current research hotspot. Many experts have conducted abundant studies in this area. Liu Qiang et al. proposed several fast interrogation techniques, including intensity demodulation, orthogonal phase demodulation, and absolute cavity length demodulation, to solve the low-precision fiber Fabry–Perot (F-P) interferometer sensors in dynamic measurements. The research results indicated that these methods could improve the measurement accuracy and speed of dynamic F-P sensors, which had broad application prospects [7]. However, most of these studies focus on a single signal processing link and fail to fully consider the multi-factor interference in complex environments. In this study, the anti-interference performance is further improved by improving the blind equalization algorithm and combining it the with frequency authentication technology, especially in cases with complex multipath effects and EMI.
Fan Yanping et al. proposed an anti-interference technology for passive wireless surface acoustic wave sensors to address the co-channel interference during operation. The wavelet denoising method was used to denoise the response of surface acoustic wave resonators. The entropy energy model was used to extract the signal envelope. Then, the K-means was used to classify two-dimensional points to distinguish between surface acoustic wave response and sine wave interference. The experimental results showed that the proposed method could clearly distinguish between surface acoustic wave response and co-channel interference signals, and improve the stability of surface acoustic wave sensors [8]. However, these methods still have limitations when dealing with complex electromagnetic environments. In this study, the combination of the frequency authentication technology and the blind equalization algorithm not only improves the anti-interference ability of the signal, but also further optimizes the signal feature extraction and authentication process through machine learning methods.
However, further research is necessary on the anti-interference application of RFID technology. Wang L et al. discussed an RFID anti-collision method based on Independent Component Analysis (ICA) algorithm to solve the low throughput in traditional algorithms. A method combining label grouping with blind separation algorithm and constrained Non-negative Matrix Factorization (NMF) was proposed to solve the multi-label mixing. The research results indicated that RFID technology could improve the throughput of traditional algorithms [9]. Although this method can improve signal throughput, further exploration should be adopted to determine its applicability. Gul O M et al. proposed an enhanced driven deep learning method to analyze unique transmitter fingerprints and determine the legitimacy of user devices or transmitters to ensure the security of IIoT. The experimental results indicated that RF fingerprint recognition performance was promising when training data was enhanced in a fine-grained manner with specific waveforms. The accuracy of RF recognition could be improved to 97.84 %, with an accuracy of 87.94 % [10]. Although research has improved the security of the Internet of Things (IoT), it only analyzes IIoT, and how to strengthen the security of the IoT in different industries should be further explored. Wang L et al. proposed an RFID anti-collision method based on ICA algorithm, while Gul O M et al. analyzed RF fingerprints through a deep learning method to ensure the security of IIoT. Although these studies have improved the performance of RFID systems, most of them have focused on a single anti-interference technique and failed to fully consider the synergistic effects of multiple techniques. In this study, the anti-interference performance and signal reception distance of RFID systems are significantly improved by combining the blind equalization algorithm with the frequency authentication technology, especially in complex IIoT environments. Liu G et al. proposed an intelligent strain monitoring system based on RFID technology to overcome the cumbersome and high cost problems of traditional wired strain sensors in the condition assessment of large engineering structures. The research results showed that the system incorporated different RFID strain sensing technologies, including passive, active, semi-passive, etc. This has brought new progress to structural health monitoring and systematically outlined for the first time a series of RFID strain sensing technologies developed in this field in recent years [11]. Liu G et al. found that although sensors have achieved strain monitoring, their application effectiveness in complex IIoT still needs further exploration. Ran S C et al. proposed a crack monitoring method based on RFID technology to ensure the safety of large structures and extend their service life. The results showed that the method systematically summarized the crack monitoring based on chipless RFID, passive RFID, and ultra-high frequency RFID technologies in recent years. The application of concrete and metal materials was introduced in detail, providing technical support and theoretical basis for crack monitoring [12]. Although the research conducted by Ran S C et al. can monitor and analyze cracks, the signal anti-interference ability for the IIoT still needs to be further explored.
In summary, in the research on anti-interference analysis of sensor signals, most experts adopt different anti-interference methods for research. However, many methods have some problems, such as insufficient anti-interference ability and unclear denoising. Therefore, to improve the anti-interference ability of sensors, a method for wireless passive sensor signal anti-interference based on RFID technology is proposed, which has made significant progress in both theory and practice by combining blind equalization algorithm and frequency authentication technology. In theory, the improved blind equalization algorithm significantly improves anti-interference performance by optimizing the signal attenuation model, while introducing machine learning methods into the multidimensional signal processing framework enhances the intelligence of signal processing. In practice, the anti-interference ability of this method reaches 96 %, significantly better than traditional methods. The signal reception distance is also greatly increased. It can still maintain a low error rate under complex modulation schemes, making it widely applicable.
3 Methods
This section mainly analyzes the research method. RFID technology and blind equalization algorithms are used to enhance the signal reception and anti-interference ability of sensors. Then, the frequency identification technology is used to improve the security and anti-interference effect of signal recognition. Blind equalization algorithm aims to optimize signal processing by compensating for distortions caused by multipath effects and EMI. It enhances the signal quality without requiring prior knowledge of the transmitted signal, allowing it to adapt to different channel conditions. Frequency authentication technology ensures the security and integrity of sensor signals by verifying the authenticity of the signal source. It helps to differentiate between real sensor signals and interfering signals, thereby reducing the impact of interference and improving the reliability of data transmission. The operation sequence and data flow of the blind equalization algorithm and the frequency authentication within the RFID framework are shown in Figure 1.
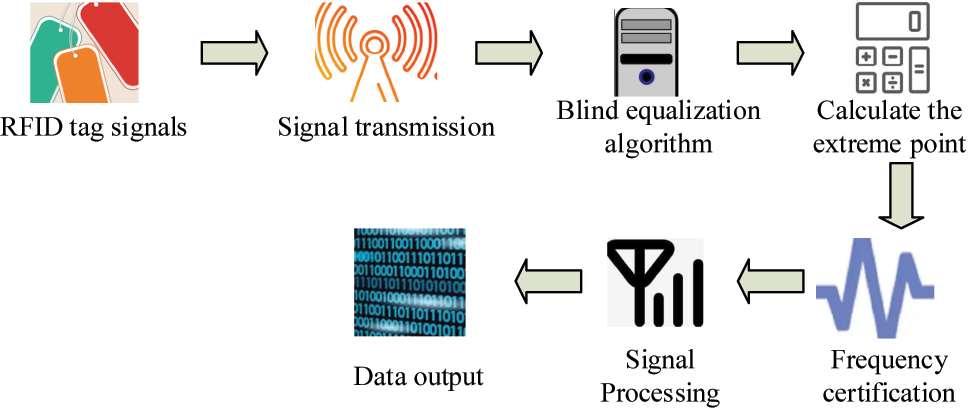
Sequential flow of operations for blind equalization algorithm and frequency authentication.
In Figure 1, the blind equalization algorithm and frequency authentication operate in the order of data streams within the RFID framework, where the RFID tag first sends data to the reader through a wireless signal. Secondly, the received signal is first processed by the blind equalization algorithm. The blind equalization algorithm optimizes the signal processing by calculating the minimum extreme point of the system and reduces the impact of multipath effects and EMI on the signal. The signal processed by the blind equalization algorithm enters the frequency authentication stage. Frequency authentication technology distinguishes between real signals and interference signals by verifying the frequency characteristics of the signal, which further enhances the security and anti-interference capability of the signal. Finally, the frequency-authenticated signal is finally transmitted to the data processing module for decoding and analyzing to obtain the sensor data.
3.1 The anti-interference method for sensor signals based on RFID technology
RFID is a wireless communication technology that identifies and tracks tags attached to items through radio waves. The RFID can quickly read data without the need for connecting antennas between tags and readers. This makes RFID a highly effective automatic recognition and data capture technology [13]. The basic framework of RFID is shown in Figure 2.
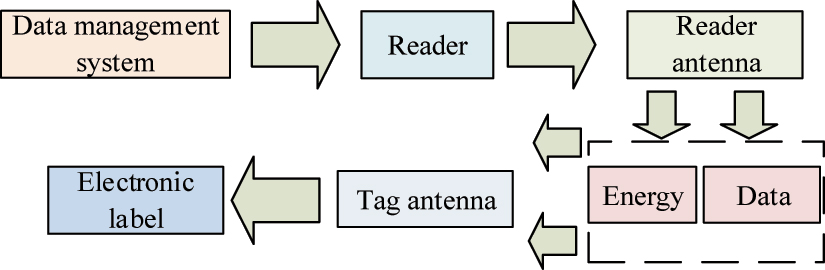
Basic framework of RFID. Note: Figure 2 shows the core components of an RFID system, including signal data management, signal data reading, and electronic labels. This diagram can analyze signal data through the network and transmit the data to the electronic label through antennas, which is the foundation for understanding how RFID technology operates.
In Figure 2, RFID technology consists of three main parts: signal data management, signal data reading, and electronic labels. The signal data are analyzed by the reader through the network, and then transmitted to the electronic label through the reader’s antenna [14], 15]. The general RFID system is divided into active and passive types. Passive generally refers to the system being able to independently read and write energy without providing signal transmission process. Passive is analyzed. When analyzing infinite passive sensor signals, passive systems are selected. Passive systems are also divided into inductive coupling and electromagnetic coupling [16], 17]. The RFID system with inductive coupling is shown in Figure 3.
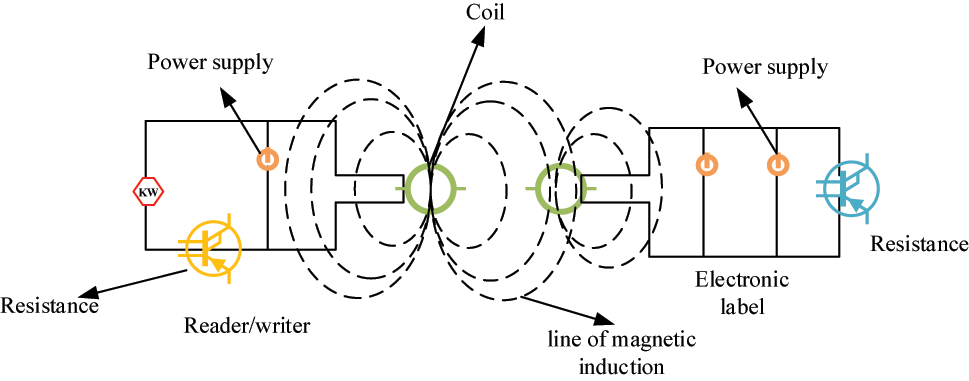
The RFID system with inductive coupling. Note: Figure 3 illustrates the workflow of the RFID system with inductive coupling, which involves generating a magnetic field through a power supply, converting the magnetic signal into an electrical signal through magnetic induction, and finally transmitting it to an electronic label. This helps to understand the energy transfer and signal conversion in RFID systems.
In the system shown in Figure 3, the RFID reader can first generate a magnetic field through the power supply, and then increase this induction method through magnetic induction. Afterwards, the magnetic signal is converted into an electrical signal through magnetic induction and transmitted to the electronic label. During this process, modulation is carried out according to relatively ordered signal control and phase frequency, which transforms the frequency of the entire system into a load that can be added. Usually, the system working in this way can achieve more efficient processing results. The reflection modulation system is shown in Figure 4.
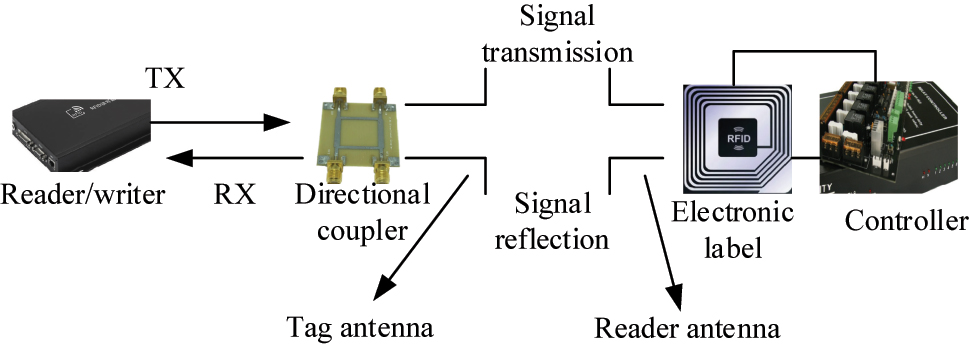
Reflection modulation system. Note: Figure 4 illustrates the modulated RFID system and explains the reflection, scattering, and diffraction phenomena encountered by wireless passive sensors when propagating in air, as well as how these phenomena affect signal propagation and reception.
The modulated RFID system shown in Figure 4 consists of components such as a reader, directional coupler, signal transmission, electronic label, and antenna. The signal transmission process of the passive RFID system is achieved through signal transmission of different components. When wireless passive sensors propagate in the air, they usually encounter three situations: reflection, scattering, and diffraction, which not only include large-scale signal propagation, but also small-scale signal fading and transmission. In signal propagation, interval code interference may occur due to the frequency and scattering of the signal, as shown in equation (1) [18].
In equation (1),
In equation (2),
In equation (3),
In equation (4), e(n) represents the size of the error signal. The other parameters are the same as the above expression. The algorithm obtained from the error data is shown in equation (5).
In equation (5), W(n) represents the transverse filter signal. μ represents the step size factor. Y(n) represents the input signal. The other parameters are the same as above. By calculating the convergence, the anti-interference ability of the current algorithm is analyzed, as shown in equation (6).
In equation (6),
In equation (7), k represents the size of the new variable. L represents the size of the interference signal. When the L value is large enough, the entire equation can be approximately transformed into equation (8).
The parameter expression in equation (8) is the same as the above equation. Finally, equation (3) is combined with equation (8) to obtain the final expression, as shown in equation (9).
The parameter expression in equation (9) is the same as the above equation. When the sequence output by the algorithm comes from the same nonlinear function, the entire process can be satisfied by the blind equalization algorithm. The anti-interference ability of the sensor signal can be enhanced by calculating the minimum extremum. Meanwhile, sensor identity signal authentication is also a way to improve the anti-interference ability of sensor signals.
In RFID systems, signals may be affected by multipath effects and EMI during transmission, resulting in signal distortion. The blind equalization algorithm achieves signal anti-interference through signal reception, signal pre-processing, signal equalization, and signal identification to extract useful information. The mathematical model and processing flow of the blind equalization algorithm are described in Equations (1)– (9), respectively. This includes parameters such as the impulse response of the signal, output noise, transmission sequence signal, and how the equalization process is optimized through sampling, error calculation, and algorithm convergence. The blind equalization algorithm is able to adaptively adjust its parameters to changes in channel conditions. Meanwhile, based on the blind equalization algorithm, the new method significantly improves the anti-interference capability of the RFID system and achieves higher anti-interference performance, which is especially important for the application of RFID systems in IIoT.
3.2 RFID-based sensor signal frequency authentication and recognition
By incorporating frequency authentication and data recognition, the anti-interference effect of current sensors and the security of signal data can be improved. In wireless signal transmission and reception of sensors, device reception authentication is a means to ensure the security of sensor wireless signals [20], 21]. Nowadays, wireless signals are frequent. Excessive and redundant signal information can easily cause sensor failure or even reception errors. Therefore, incorporating RFID identity authentication and recognition technology into the signal transmission process of sensors can effectively improve the usage time and signal reception effect of passive wireless sensors. The digital signal transmission framework of wireless passive sensors is shown in Figure 5.
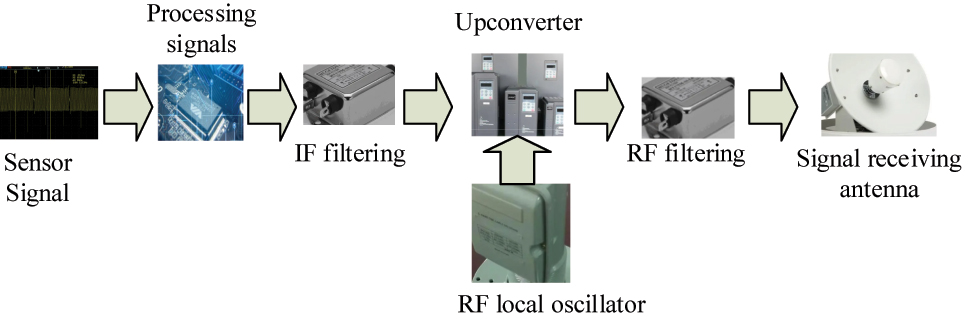
Wireless passive sensor digital signal transmission framework. Note: Figure 5 illustrates the process of transmitting wireless passive sensor signals from the signal processing interface at the sensor front-end to the RF front-end, which is crucial for understanding the digital signal processing of sensor signals.
In Figure 5, after the wireless passive sensor signal is transmitted, it first needs to be transmitted to the radio frequency front-end through the signal processing interface of the sensor front-end, including some signal transmission structures such as data model converter, IF filter converter, frequency conversion structure device, and RF filter converter. After amplifying and processing the signal, the digital signal is converted into a high-frequency signal. Finally, the signal is transmitted out through the antenna device. When authenticating sensor frequency signals, there are four steps involved: signal acquisition, signal preprocessing, signal feature extraction, and signal authentication. The signals emitted by the machine are collected, followed by normalization and noise reduction for preprocessing analysis. Machine learning methods are used to extract and validate features of signals through email and unsupervised methods. Finally, the signal reception analysis is completed. The signal extraction process framework is shown in Figure 6.
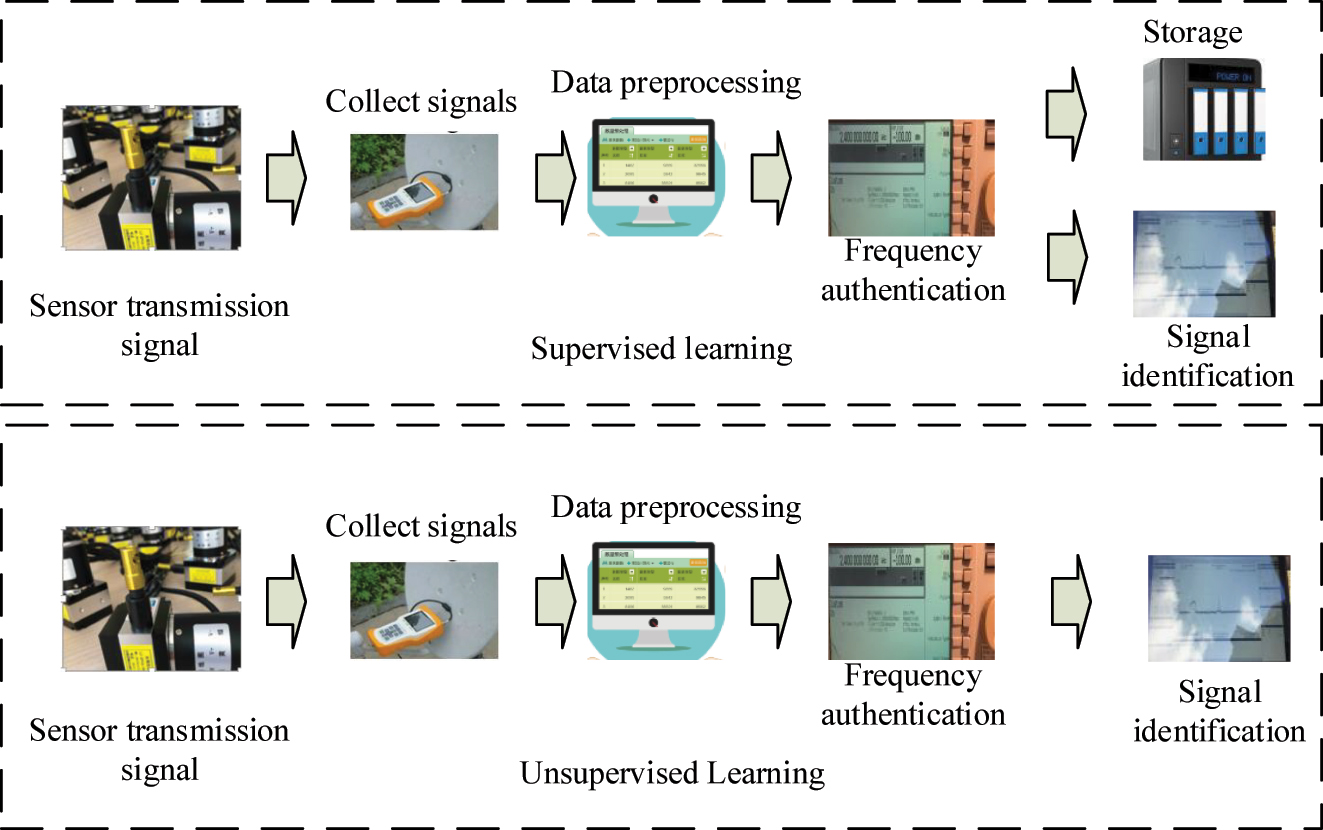
Framework of signal extraction process. Note: Figure 6 illustrates the application of machine learning in receiving machine signals. This framework improves the security performance and anti-interference ability of current signals through supervised learning and frequency authentication of RF signals.
In Figure 6, the supervised learning radio frequency authentication block diagram in receiving machine signals has an additional sensor identity authentication and recognition function compared with the unsupervised block diagram, mainly to enhance the signal protection and security of the sensor. Two frameworks enhance the security performance and anti-interference ability of the current signal through supervised learning and frequency authentication of radio frequency signals. To test the signal recognition performance, during the testing phase of sensor devices, a classifier is used to test and classify different sensor signals and devices. The identified data in the sample is defined, as shown in equation (10).
In equation (10), i represents the number of samples to be tested. The equipment probability is recorded, as displayed in equation (11) [22].
In equation (11), p i represents the probability of sample occurrence. By calculating the information entropy, the data entropy value of the test sample can be obtained, as presented in equation (12).
In equation (12), H represents the entropy value. The other parameters are the same as the above. The total entropy change after increasing the data sample collection is shown in equation (13).
In equation (13), E represents the change in mean entropy. x represents the number of test samples. The other parameters are the same as the above. By analyzing the differences in different samples, the mean entropy of some unknown sensor signals can be obtained, thereby determining the appropriate threshold change for the current signal information and achieving frequency authentication and data encryption for multiple types of wireless passive sensors. Therefore, a wireless passive sensor with machine learning is proposed to enhance the safety and reliability of sensor signals through frequency modulation. Figure 7 shows the testing and training process of frequency data.
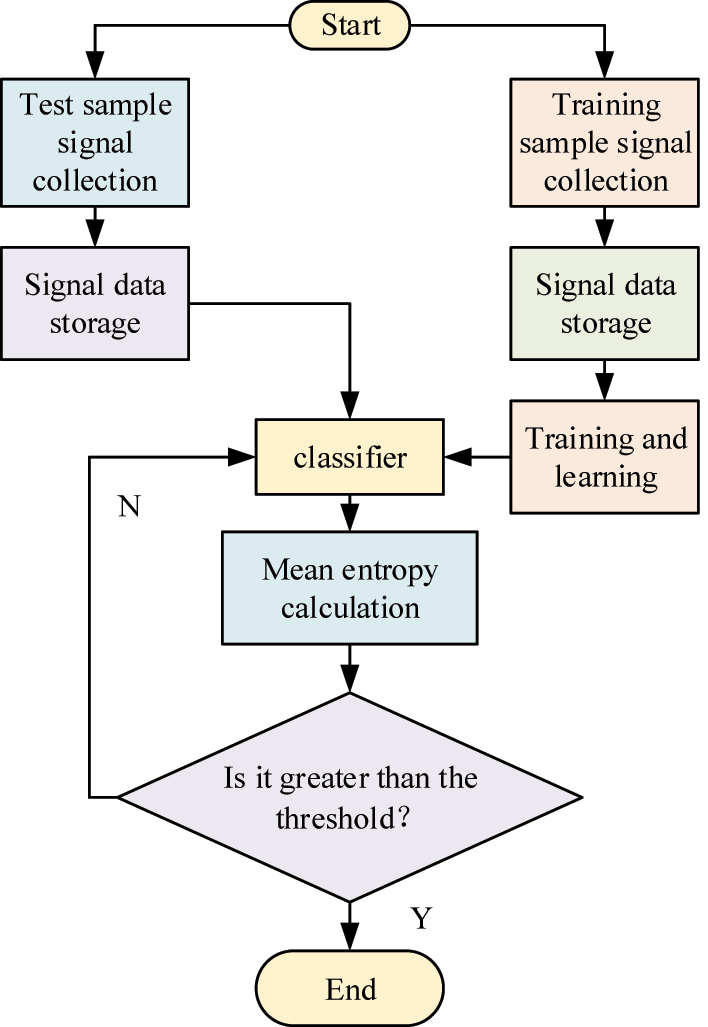
Data testing and training process. Note: Figure 7 illustrates the process of collecting, storing, and training sensor signal data during the analysis and encryption of frequency data. How to input them into the classifier and calculate the mean entropy to determine if they are greater than the current threshold is a key step in evaluating and optimizing sensor signal recognition performance.
In Figure 7, when encrypting frequency data, the signal data of the sensor is first collected. Then, the data information is stored. Unlike the testing signal, the training signal data is added to the training learning. The data signals obtained from the testing and training samples are input into the classifier. The mean entropy is calculated to determine whether the mean entropy is greater than the current threshold. If it is, the current mean entropy is output. If it is not, the iteration of the trained data samples is increased by 1 and the mean is retrained until both are greater than the threshold. Figure 8 shows the frequency authentication and recognition process.
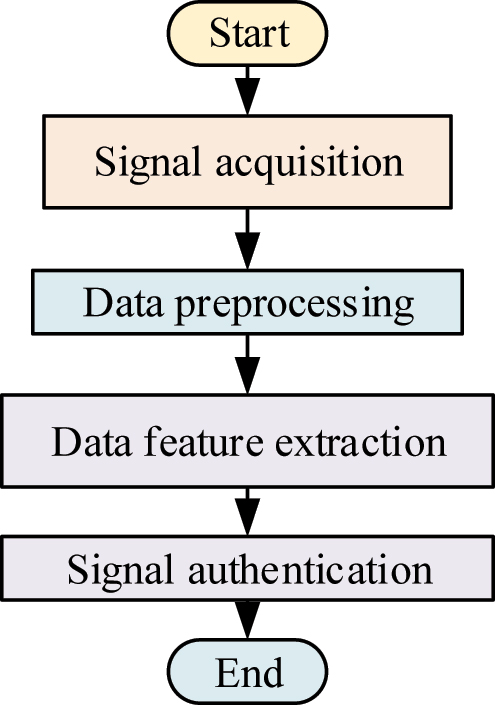
Frequency authentication and identification.
From Figure 8, in frequency authentication and recognition, firstly, the signal data and signals emitted by the machine are collected and the raw signal data are captured from wireless passive sensors. Next, the collected signals are normalized and denoised. Then, the machine learning method is used to extract features from the signals. Finally, the extracted features are used for signal authentication.
4 Results
This section mainly conducts simulation verification on the anti-interference method. Firstly, the anti-interference ability of the proposed method is analyzed to verify the feasibility and anti-interference performance. Then, the various performance aspects of the current methods are discussed through comparative experiments.
4.1 Result analysis of the anti-interference method
To test the anti-interference ability of wireless passive sensors that currently incorporate frequency authentication and blind equalization algorithm, the input signal of the sensor is modulated using Binary Phase Shift Keying (BPSK) and 16-Quadrature Amplitude Modulation (16QAM). The Signal-to-Noise Ratio (SNR) is 20 dB, the class of the filter is 10, the fading mode of the channel is Reyleigh, and the fading factor is selected as K = 5. The SNR is the ratio of signal power to background noise power, and the higher the SNR, the stronger the anti-interference ability of the model. The error rate represents the ratio of the number of received error bits to the total number of transmitted bits during data transmission. The lower the error rate, the more accurate the data transmission. Throughput refers to the amount of data successfully transmitted by a system per unit of time, with higher throughput indicating higher data transmission efficiency. The SNR is set to 20 dB to simulate a communication environment with EMI from a device. BPSK uses two different phases to represent binary data, which is suitable for scenarios where signal quality requirements are not particularly high. 16QAM is a type of signal that can transmit more data within the same bandwidth, but also has higher requirements for signal quality. The hardware used for the experiment includes a high-performance RFID reader and a customized wireless passive sensor tag. The experimental environment simulates a typical IIoT scenario, which contains a variety of potential sources of interference, such as EMI and multipath effects. The SNR is set to 20 dB. Meanwhile, the output power is set to 500 kW. Two modulation schemes in simulation are used to evaluate the performance of modulation schemes with different complexities and data transmission efficiencies in RFID systems. The step size is 0.0006. The simulated signal runs are 6,000 points. 6,000 signal points are representative samples randomly selected from a larger population, which can reasonably estimate the population characteristics. For statistical testing and model validation, if the effect size is large or the signal in the data is strong, even if the sample size is not large, sufficient statistical power may still be achieved. Meanwhile, small datasets can be used to preliminarily validate the feasibility and potential effectiveness of the designed method, providing a foundation for subsequent large-scale experiments. In the early stages of algorithm development, using small datasets allows for rapid iteration and adjustment, which helps optimize algorithm parameters. The dataset is divided into two signal datasets, each with 3,000 signal points. The simulation results are shown in Figure 9.

Error rates of readers with different modulation methods for two datasets.
In Figure 9(a) and (b), on dataset 1, the error rate decreases monotonically with the increase of SNR and shows stable convergence. From Figure 9(a) and (c), the BPSK modulation method on dataset 1 has better model convergence, smoother curves, and less curve bending. The error rate decreases with the increase of SNR, showing an overall downward trend. The smooth curve variation indicates good model convergence and stable overall performance. Meanwhile, in Figure 9(c) and (d), on dataset 2, the error rate remains low, indicating excellent performance under complex modulations. Therefore, dataset 2 performs relatively well. To select a better number of readers in the RFID system, a collision rate comparison is performed for different distances and reader quantities, as shown in Figure 10.
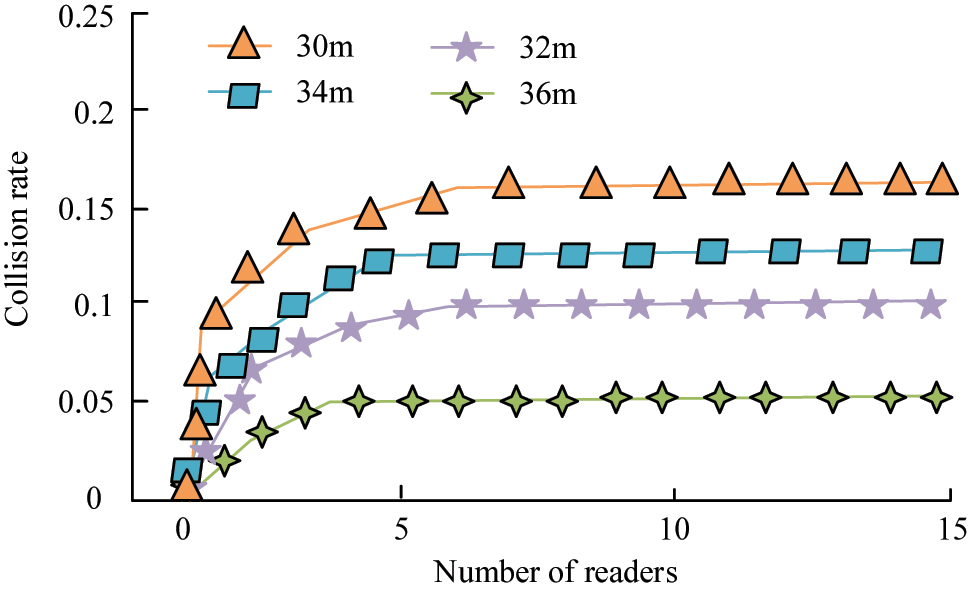
Comparison of the number and number of readers.
In Figure 10, the collision rate represents the conflict changes in the signal reception of the current reader in the system. If the collision rate is high, the overall reception will be weaker. Therefore, the collision rate changed differently for different reader distances under the same number of readers. The collision rate showed an increasing trend with the increase of the reader, and then tended to stabilize. However, the collision rate of readers at different distances varied in their stable state. The collision rate of the reader at 30 m was stable at 0.16. At 32 m, the collision rate at steady state was 0.13. The collision rate of the reader varied at different distances in a stable state, indicating that the distance of the reader has a significant impact on system performance. At 34 m, the reader obtained a collision rate of 0.1. At 36 m, the collision rate when the reader was stable was 0.4. When the reader was approximately 5, the collision rate for almost all distances was in a stable state. From this, the collision rate of the overall system is stable when the reader is selected as 5. This indicates that the overall performance of the system is stable when the number of readers is 5. The experimental simulation process is carried out when the distance is selected as 36 m. To test the impact of adding a new interference algorithm on RFID readers, the signal strength of RFID readers before and after adding the model is compared, as shown in Figure 11.
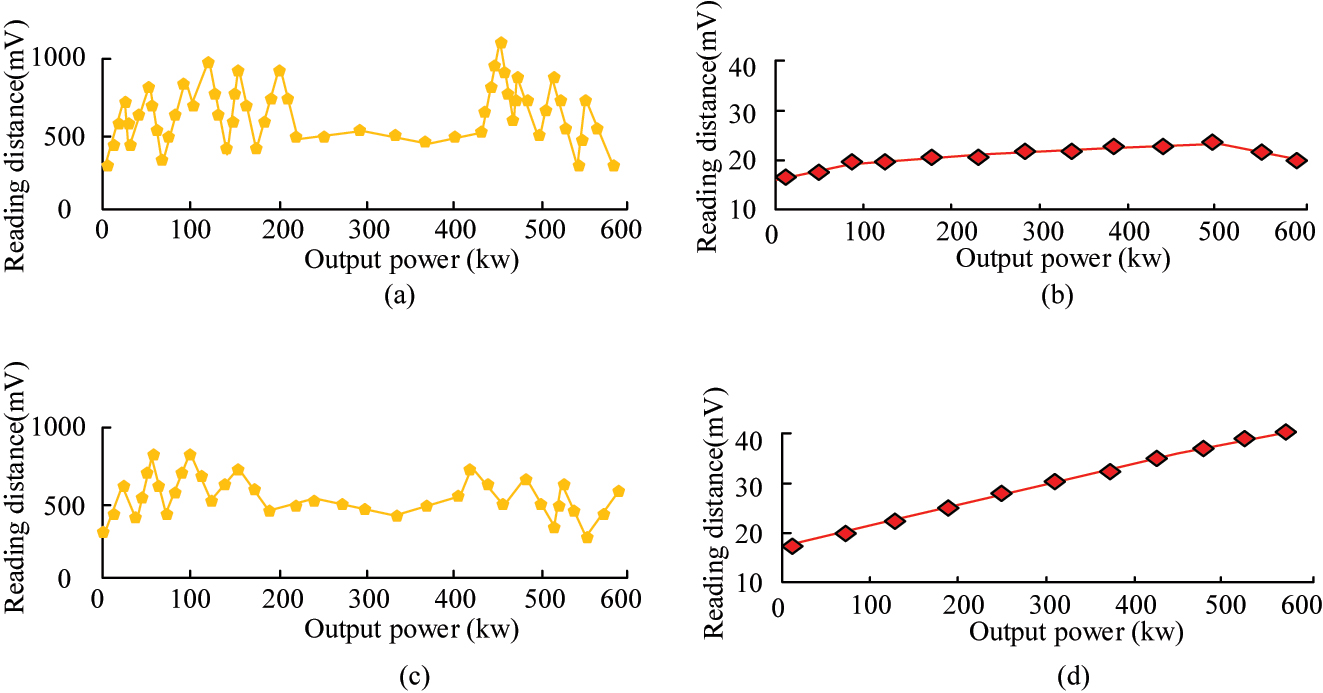
Comparison of signal interference before and after method addition. (a) Reading distance before adding algorithm model. (b) Reading distance before adding algorithm model. (c) Reading distance after adding algorithm model. (d) Reading distance after adding algorithm model.
In Figure 11(a) and (b), before the anti-interference method was added, the distance between the reading signal and the received signal of the overall RFID reader/writer was relatively short. The overall reading distance increased with the increase of output power. It first increased and then tended to a stable state. When the output power reached 500 kw, there was also a downward trend in signal reception. The approximate signal reception distance in a stable state was 20 m. Therefore, the overall transmission and reception of sensor signals are at a relatively low level on signal interference, indicating that the distance between signal transmission and reception is limited without interference algorithms. According to Figure 11(c) and (d), after adding anti-interference methods, there was a slight change in the interference distance, but the overall interference distance and trend did not change much. The reading distance had significant changes. Firstly, the curve trend showed an overall upward trend, from the initial receiving reading distance of about 8 to 40. The reading distance continued to increase. Therefore, when using this method to incorporate RFID technology for anti-interference, its anti-interference performance was greatly improved. The signal reception of the sensor was better. This indicates that the proposed method significantly improves the receiving distance and anti-interference performance of sensor signals. This may be attributed to the effective compensation of multipath effects and EMI by the blind equalization algorithm, as well as the enhancement of signal security and interference immunity by the frequency authentication technology. In IIoT, the effective compensation can extend the coverage of the sensor network and reduce data loss. In intelligent transport systems, this enhancement can also optimize traffic signal control and reduce congestion. Due to the interference on the signal, it changed the throughput of the current model. Therefore, when testing the anti-interference ability, the throughput change of the research method is compared with several common methods such as Spatial Filtering (SF), Spread Spectrum Techniques (SST), Adaptive Array Algorithms (AAA), and Waveform Design (WD). The SF and SST are set to explore the data parameter settings using the same method. The SNR is 20 dB, the signal modulation is BPSK, and the interference model is Rayleigh fading. A specific high-pass filter is used. A high throughput rate indicates that the model has stronger anti-interference ability, as shown in Figure 12.
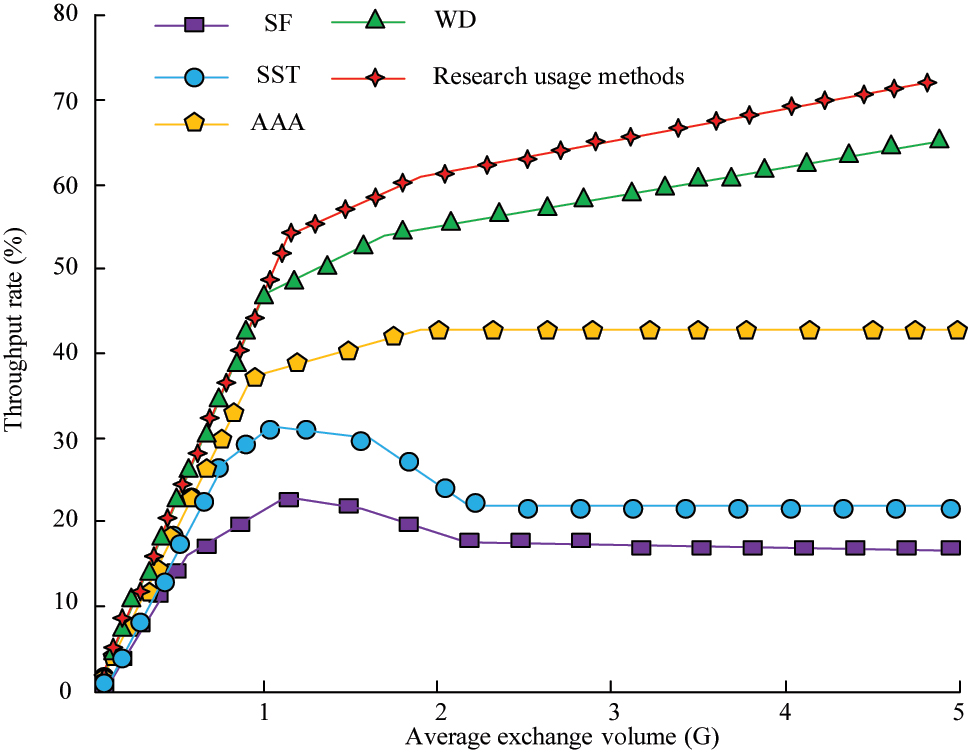
Comparison of throughput rates of different methods.
In Figure 12, as the exchange volume of signal data increased, the throughput of SF and SST first increased and then showed a downward trend. When the exchange volume was 1, both models showed a downward trend in throughput, and then tended to a relatively stable state. At this time, the throughput of SF was stable at 18 %, and the SST was stable at 22 %. The change of AAA, WD, and the research model were basically consistent. In the initial stage of increasing exchange volume, the throughput showed a rapid growth trend, and then the growth trend relatively decreased. From the change, the throughput value of the research method was higher, at a throughput rate of over 70 %. From this, the proposed method has the best throughput performance, resulting in a better anti-interference effect. The proposed method outperforms other methods on throughput, indicating its stronger anti-interference ability and higher data transmission efficiency. The blind equalization algorithm added to the research method can effectively handle the distortion of the received signal and compensate for multipath effects and EMI, thereby improving signal quality and reducing error rates. Meanwhile, this method improves the security and anti-interference ability of sensor signals through frequency authentication technology, reduces signal conflicts and interference, and enhances the signal transmission reliability. By complementing each other, the anti-interference performance and data transmission efficiency of the system have been jointly improved, achieving higher throughput.
4.2 Anti-interference analysis based on frequency authentication
To test the anti-interference ability and overall effect of the added frequency authentication on sensor signals, the changes in sensor signals are compared. The conventional method is compared with the sensor signal changes when only blind equalization algorithm, frequency authentication, and the combination of the two. The signal band changes are shown in Figure 13.
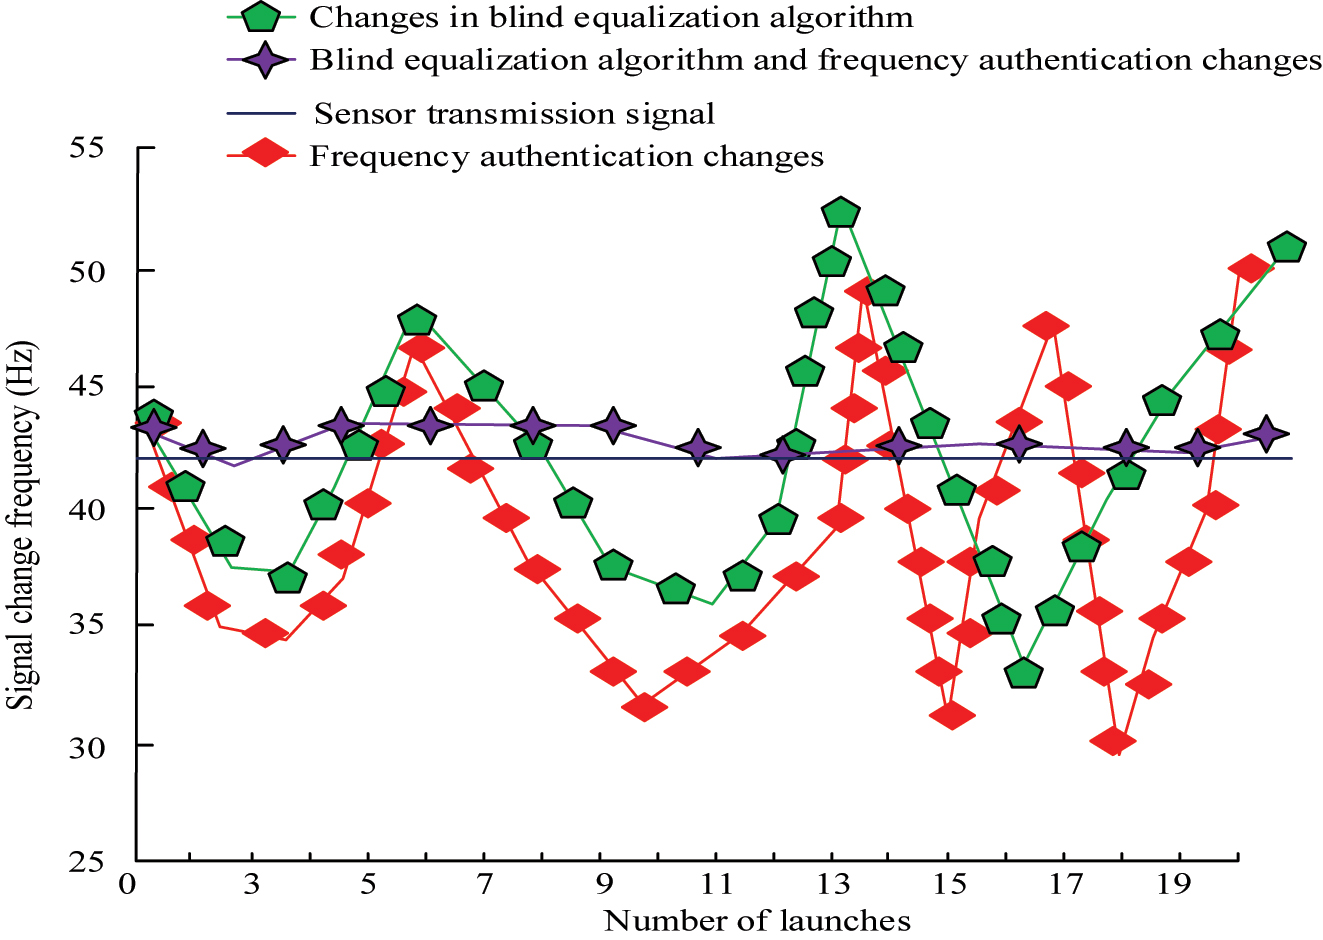
Comparison of sensor signal changes after adding different methods.
In Figure 13, a normal sensor signal usually changed in a frequency band after being emitted, but the frequency changed after being disturbed. The overall signal frequency of the image with only frequency authentication was relatively high, but within the frequency range of the sensor. The overall frequency change after only adding the blind equalization model was relatively small compared with when only adding frequency authentication. After adding two methods separately, the frequency change of the signal was the same as that of the interfered sensor signal. After adding two methods, the anti-interference ability of sensor signal transmission was better than that of adding only one method. To compare the differences in anti-interference ability of current methods for wireless passive sensors, the above methods are compared. The results are shown in Table 1. Frequency difference refers to the deviation between the actual frequency and the ideal frequency of a sensor signal after interference. This value reflects the degree to which interference affects the frequency stability of the signal. A small frequency difference indicates that the signal is less affected by interference and the system has stronger anti-interference ability.
Comparison of sensor signal recognition using different methods.
| Method model | Identification signal frequency average (Hz) | Average frequency of sensor signal (Hz) | Frequency difference (Hz) | Anti-interference ability (%) |
|---|---|---|---|---|
| SF | 23 | 50 | 26 | 46 |
| SST | 31 | 50 | 19 | 62 |
| AAA | 36 | 50 | 14 | 72 |
| WD | 37 | 50 | 13 | 76 |
| Frequency authentication | 36 | 50 | 14 | 74 |
| Blind equalization algorithm | 56 | 50 | 6 | 88 |
| Research method | 52 | 50 | 2 | 96 |
In Table 1, the anti-interference ability of the sensor signal varied with different methods. The best anti-interference ability of the research method was 96 %, followed by the model with the blind equalization method, which reached 88 %. Compared with other methods, the anti-interference ability of the research method was 50 % higher than that of SF, 34 % higher than that of SST, 24 % higher than that of AAA, 20 % higher than that of WD, 8 % higher than that of blind equalization model alone, and 22 % higher than that of frequency authentication model alone. The anti-interference ability of the research method is better. The hypothesis testing is conducted. H0: There is no significant difference between the new method and the existing method on this indicator. H1: The new method is superior to the existing method on this indicator. The results are obtained through validation, as shown in Table 2.
Comparison of hypothesis validation results.
| Indicator | Method | Average value | 95 % Confidence interval | Hypothesis test result (compared with the proposed method) |
|---|---|---|---|---|
| Bit error rate (BER) | Research method | 0.02 | [0.01, 0.03] | / |
| SF | 0.06 | [0.05, 0.07] | P < 0.001 | |
| SST | 0.05 | [0.04, 0.06] | p < 0.001 | |
| AAA | 0.04 | [0.03, 0.05] | p < 0.001 | |
| WD | 0.03 | [0.02, 0.04] | p < 0.001 | |
| Throughput (%) | Research method | 75 | [72, 78] | / |
| SF | 18 | [17, 19] | p < 0.001 | |
| SST | 22 | [21, 23] | p < 0.001 | |
| AAA | 69 | [68, 70] | p < 0.001 | |
| WD | 71 | [70, 72] | p < 0.001 | |
| Signal reception distance (m) | Research method | 40 | [38, 42] | / |
| SF | 20 | [18, 22] | p < 0.001 | |
| SST | 22 | [20, 24] | p < 0.001 | |
| AAA | 24 | [22, 26] | p < 0.001 | |
| WD | 26 | [24, 28] | p < 0.001 |
From Table 2, there was no statistically significant difference (p < 0.001) in BER, throughput, and signal reception distance among different methods, indicating that H0 was invalid and H1 was valid. This indicates that the new method has better test results.
5 Discussion
In automated production lines, sensors are used to monitor machine performance and environmental conditions. The anti-interference methods used in research can improve the accuracy and reliability of sensor data and reduce misoperation and downtime. RFID technology is crucial in tracking goods and inventory management. Anti-interference methods can ensure more reliable tag reading in complex industrial environments, improving the efficiency and transparency of the supply chain. By monitoring the health status of devices in real-time, sensors can help predict potential faults. Anti-interference technology ensures the stability and accuracy of monitoring data, thereby improving the efficiency of maintenance work.
In intelligent transportation systems, sensors are used to collect traffic flow and vehicle speed data. Anti-interference methods can improve the accuracy of data, help optimize traffic signal control, and reduce congestion. Sensor networks can also be used to monitor environmental pollutants and emergency situations. Anti-interference methods ensure the reliability of sensor data in critical situations and improves the efficiency of emergency response. In the smart grid, sensors are used to monitor energy consumption and distribution status. Anti-interference methods can improve data stability and help achieve more efficient energy allocation and demand response.
To explore the anti-interference performance of wireless passive sensor signals in multi-channel environments, such as urban canyons or industrial areas, subsequent research can analyze the effects of multipath effects and signal overlap on sensor signals, and optimize blind equalization algorithms and frequency authentication techniques to adapt to these complex environments. In high-density areas of commercial centers or heavily trafficked roads, the anti-interference ability of sensor signals should be evaluated and optimized. Therefore, in subsequent research, how to effectively manage conflicts and interference of RFID tags in signal intensive environments can be analyzed to improve signal recognition accuracy and overall system throughput.
Wireless passive sensors typically rely on battery power, and integrating more complex anti-interference algorithms may increase the computational burden, which in turn increases energy consumption and affects sensor lifetime and maintenance frequency. Implementing blind equalization algorithms may require higher performance processors or dedicated hardware, which may increase the cost and complexity of the sensor. The computational complexity of blind equalization algorithms may lead to processing delays, especially in applications with large data volumes or high real-time requirements. These limitations and constraints may have a significant impact on the practical deployment and effectiveness of the proposed method. Therefore, future research needs to consider these factors comprehensively to ensure the feasibility and effectiveness of the new method in the real-world. Although the proposed RFID-based wireless passive sensor signal immunity method showed a 96 % improvement in immunity in simulation, this result is based on a finite variable simulation environment and may not fully reflect the complexity of the real environment. Simulated environments tend to be more idealized and cannot cover the variable conditions, equipment differences, and dynamic sources of interference in real environments, and deviate from reality. The interference factors such as EMI and multipath effects in real environments may be more complex, coupled with practical deployment issues such as hardware constraints, power requirements, and computing resources, which may affect the performance of the method. Therefore, the study also requires field tests and pilot projects to collect performance data in different environments and conditions, and long-term performance monitoring.
Although the method performs well in simulated environments, in real-world deployments, environmental conditions may have an additional impact on signal transmission. For example, in extreme weather conditions, signal transmission and reception may be disturbed. This method is mainly optimized for wireless passive sensors, but for other types of sensors, appropriate tuning and validation may be required. For example, active sensors usually require higher signal processing capabilities and more complex communication protocols, and the algorithm may need to be adapted to suit their characteristics. To ensure the effectiveness in different environments, future research will include testing in various real-world environments. For example, in industrial workshops, EMI and mechanical vibrations may have an impact on signal transmission. The method can be further extended to other types of sensors. The algorithm parameters can be adjusted to adapt to different sensor types and application scenarios. For example, for temperature sensors, the algorithm may need to be optimized for the effect of temperature changes on signal transmission. To address the hardware and energy consumption challenges, future research will focus on algorithm optimization and hardware design.
6 Conclusions
In response to the insufficient anti-interference ability of current wireless passive sensor signals, frequency authentication and blind equalization algorithm were added to traditional RFID technology to improve its security and anti-interference ability. Firstly, the anti-interference performance of the blind equalization algorithm was analyzed. Then, frequency authentication was added to enhance the anti-interference ability of sensor signals and enhance the security of signal reception. Finally, the performance and feasibility of the current method were verified through virtual simulation experiments. The research results indicated that the BPSK modulation method had a decreasing error rate on dataset 1. The 16QAM modulation method performed better on dataset 2 with a relatively low error rate. When readers are 5 and the distance selection was 36 m, the collision rate of the system was stable. Before introducing anti-interference methods, the signal transmission and reception distance of RFID readers and writers were relatively short. However, after introducing anti-interference methods, the anti-interference performance was significantly improved. The sensor signal reception distance was also increased. When the output power reached 500 kw during signal transmission, there was a downward trend in signal reception. In a stable state, the approximate signal reception distance was 20 m. Meanwhile, the throughput rate of the research method should be maintained at over 70 %. The anti-interference ability should ideally reach 96 %. The anti-interference ability of the research method was 50 % higher than that of SF, 34 % higher than that of SST, 24 % higher than that of AAA, 20 % higher than that of WD, 8 % higher than that of adding only blind equalization model, and 22 % higher than that of adding only frequency authentication model. The method used in this study has better anti-interference ability. Although this study has achieved many results, further improvement is conducted. The data model used in the study is relatively small. Therefore, further analysis will be conducted on more and larger data models. In current research, simulating the environment may not fully capture all environmental factors in the real-world, such as temperature, humidity, physical obstacles, etc., which may affect the transmission and reception of sensor signals. Meanwhile, the actual equipment used may differ from the equipment assumed in the simulation, which may affect the actual effectiveness of anti-interference methods. The actual system may be more complex than the simulated environment, involving more variables and uncertainties, which may affect the effectiveness of the method. Therefore, in future research, a series of experiments should be designed to test the performance of anti-interference methods under different environments and conditions. Firstly, the sensor data are collected from the actual environment. Secondly, the performance of the anti-interference method is evaluated using the actual data. Finally, case studies are conducted in specific industrial or urban environments to evaluate the practical application effectiveness of the method. Due to various factors such as environmental conditions, equipment differences, and actual operations that may cause model deviations in actual simulation environments, the research is mainly conducted in simulation environments. The study also has limitations, such as the small dataset size and a simulated environment that does not fully reflect the complexity of the real-world. Therefore, future work will expand the dataset size and conduct real-world testing to analyze the impact of environmental factors on signals. Meanwhile, it will be tested in multi-channel and high-density areas while optimizing hardware and energy consumption to further improve the method and promote its wider application in fields such as IIoT, smart cities, and intelligent transportation.
-
Funding information: Authors state no funding involved.
-
Author contributions: Xueli Guo: Study design, data collection, statistical analysis, visualization, writing, and revision of the original draft. Jie Wang: Conceptualization, data curation, formal analysis, funding acquisition, investigation, methodology, resources, software, supervision, visualization, writing-original draft, writing-review & editing. Feng Zheng: Resources, software, supervision, writing-review & editing. Jianbo Zhang: Resources, software, supervision, writing-review & editing. Haijun Wang: Data collection, statistical analysis, visualization, and revised the manuscript. Jingang Yao: Data collection, statistical analysis, visualization, and revised the manuscript. The final draft was verified by all authors before submission. All authors have accepted responsibility for the entire content of this manuscript and approved its submission.
-
Conflict of interest: Authors state no conflict of interest.
-
Data availability statement: All data generated or analysed during this study are included in this published article.
Abbreviations
- AAA
-
Adaptive array algorithms
- BER
-
Bit error rate
- BPSK
-
Binary phase shift keying
- EMI
-
Electromagnetic interference
- IIoT
-
Industrial internet of things
- IoT
-
Internet of things
- QAM
-
Quadrature amplitude modulation
- RFID
-
Radio frequency identification
- SF
-
Spatial filtering
- SNR
-
Signal-to-noise ratio
- SST
-
Spread spectrum techniques
- WD
-
Waveform design
References
1. Ali, Z, Perret, E, Barbot, N, Siragusa, R, Hely, D, Bernier, M, et al.. Authentication using metallic inkjet-printed chipless RFID tags. IEEE Trans Antennas Propag 2020;68:4137–42. https://doi.org/10.1109/tap.2019.2948740.Suche in Google Scholar
2. Wu, J, Su, Z, Qin, L, Ma, C, Wang, L, Li, X. Explore the role of dapagliflozin in regulating the klf4-ndrg2 signaling pathway during the development and progression of colon cancer. Int J Life Sci Study 2024;5.Suche in Google Scholar
3. Zhu, X. Complex event detection for commodity distribution Internet of Things model incorporating radio frequency identification and Wireless Sensor Network. Future Gener Comput Syst 2021;125:100–11. https://doi.org/10.1016/j.future.2021.06.024.Suche in Google Scholar
4. Behera, SK, Karmakar, NC. Wearable chipless radio-frequency identification tags for biomedical applications: a review [antenna applications corner]. IEEE Antennas Propag Mag 2020;62:94–104. https://doi.org/10.1109/map.2020.2983978.Suche in Google Scholar
5. Jiang, E, Chen, R, Zhu, D, Liu, W, Pitiya, R. Static-shift suppression and anti-interference signal processing for CSAMT based on Guided Image Filtering. Prog Earthquake Res 2022;2:44–55. https://doi.org/10.1016/j.eqrea.2022.100117.Suche in Google Scholar
6. Chen, C. Evaluation and countermeasures for urban quality improvement in Shandong province: an analysis based on entropy weight method and TOPSIS method. Adv Ind Eng Manag 2023;12.Suche in Google Scholar
7. Liu, Q, Peng, W. Fast interrogation of dynamic low-finesse Fabry–Perot interferometers: a review. Microw Opt Technol Lett 2021;63:2279–91. https://doi.org/10.1002/mop.32922.Suche in Google Scholar
8. Fan, Y, Liu, Y, Qi, H, Liu, F, Ji, X. Anti-interference technology of surface acoustic wave sensor based on K-means clustering algorithm. IEEE Sens J 2021;21:8998–9007. https://doi.org/10.1109/jsen.2021.3052957.Suche in Google Scholar
9. Wang, L, Luo, Z, Guo, R, Li, Y. A review of tags anti-collision identification methods used in RFID technology. Electronics 2023;12:3644. https://doi.org/10.3390/electronics12173644.Suche in Google Scholar
10. Gul, OM, Kulhandjian, M, Kantarci, B, Touazi, A, Ellement, C, D’amours, C. Secure industrial IoT systems via RF fingerprinting under impaired channels with interference and noise. IEEE Access 2023;11:26289–307. https://doi.org/10.1109/access.2023.3257266.Suche in Google Scholar
11. Liu, G, Wang, QA, Jiao, G, Dang, P, Nie, G, Liu, Z, et al.. Review of wireless RFID strain sensing technology in structural health monitoring. Sensors 2023;23:6925. https://doi.org/10.3390/s23156925.Suche in Google Scholar PubMed PubMed Central
12. Ran, SC, Wang, QA, Wang, JF, Ni, YQ, Guo, ZX, Luo, Y. A concise state-of-the-art review of crack monitoring enabled by RFID technology. Appl Sci 2024;14:3213. https://doi.org/10.3390/app14083213.Suche in Google Scholar
13. Song, C, Wu, Z. A loop antenna array with an enlarged near-field interrogation zone for UHF RFID near-field and far-field applications. IEEE Antennas Wirel Propag Lett 2022;21:1985–9. https://doi.org/10.1109/lawp.2022.3187340.Suche in Google Scholar
14. Li, J, Wu, H, Zeng, Y. Recovery of collided RFID tags with frequency drift on physical layer. J Autom 2020;7:1593–603. https://doi.org/10.1109/jas.2019.1911720.Suche in Google Scholar
15. Kineber, AF, Oke, AE, Ali, AH, Dosumu, O, Fakunle, K, Olanrewaju, OI. Critical application areas of radio frequency identification (RFID) technology for sustainable construction in developing countries: the case of Nigeria. J Eng Des Technol 2023;21:197–8.Suche in Google Scholar
16. Zhao, Y, Dai, L, He, Z, Wang, L, Cao, J. Impedancemetric NO2 sensor based on CoCrFeO4 sensing electrode and La9.4Ba0.6Si5.9W0.1O26.8 electrolyte with phase angle as response signals. J Electrochem Soc 2020;167:1–6. https://doi.org/10.1149/1945-7111/ab736a.Suche in Google Scholar
17. Tan, X, Yu, H, Liang, B, Han, M, Ge, S, Zhang, L, et al.. A target-driven self-feedback paper-based photoelectrochemical sensing platform for ultrasensitive detection of ochratoxin A with an In2S3/WO3 heterojunction structure. Anal Chem 2022;94:1705–12. https://doi.org/10.1021/acs.analchem.1c04259.Suche in Google Scholar PubMed
18. Pertila, P, Fagerlund, E, Huttunen, A, Myllyla, V. Online own voice detection for a multi-channel multi-sensor in-ear device. IEEE Sens J 2021;21:27686–97. https://doi.org/10.1109/jsen.2021.3122936.Suche in Google Scholar
19. Li, Y, Li, H, Fei, J, Chang, L, Ma, J. Composite fault diagnosis method of EMU traction motor speed sensor considering harmonic interference. Int J Heavy Veh Syst 2022;29:424–39. https://doi.org/10.1504/ijhvs.2022.127812.Suche in Google Scholar
20. Zhang, Z, Mao, X, Zhou, K, Yuan, H. Collaborative sensing-based parking tracking system with wireless magnetic sensor network. IEEE Sens J 2020;20:4859–67. https://doi.org/10.1109/jsen.2020.2965560.Suche in Google Scholar
21. Cao, P, Wang, H, Zhou, K, Ni, X. A novel motion noise suppression method for SQUID sensor based on VME. IEEE Sens J 2021;21:27840–7. https://doi.org/10.1109/jsen.2021.3125387.Suche in Google Scholar
22. Dornelas, RS, Lima, DA. Correlation filters in machine learning algorithms to select demographic and individual features for autism spectrum disorder diagnosis. J Data Sci Intell Syst 2023;3:7–9.10.47852/bonviewJDSIS32021027Suche in Google Scholar
© 2026 the author(s), published by De Gruyter, Berlin/Boston
This work is licensed under the Creative Commons Attribution 4.0 International License.
Artikel in diesem Heft
- Research Articles
- The dynamics of prey–predator model with global warming on carrying capacity and wind flow on predation
- Analysis of traffic density dynamics under varied noise conditions using data-driven partial differential equations
- Soliton, stability, multistability, and diverse tools for identifying chaos in a nonlinear model with two modified methods
- An efficient recurrent neural network based confusion component construction and its application in protection of saliency in digital information
- SI Nonlinear Analysis and Design of Communication Networks for IoT Appl.APC
- A passive wireless sensor signal anti-interference method based on RFID
- SI: Advances in Nonlinear Dynamics and Control APC
- Application of backpropagation neural network algorithm in e-commerce customer churn prediction