
Linked Employer–Employee Data from XING and the Mannheim Enterprise Panel
-
Patrick Breithaupt
 ,
Hanna Hottenrott
,
Hanna Hottenrott

Abstract
The availability of social media data is growing and represents a new data source for economic research. This paper presents a detailed study on the use of data from a career-oriented social networking platform. The employment data are exported from user profiles and linked to the Mannheim Enterprise Panel (MUP). The linked employer–employee (LEE) data consist of 14 million employments for 1.5 million employers and describes around 9 million employee flows. Plausibility checks confirm that career-oriented social networking data contain valuable information about employments and employee flows. Using such platform data provides opportunities for research on employee mobility, networks, and local ecosystems’ role in economic performance at the employer and the regional level.
1 Introduction
The growing use of social media provides new sources of data for research purposes, i.e. linked-employer–employee data. Prominent examples of such sources are career-oriented social media platforms like LinkedIn or XING.[1] Career-oriented platforms are a natural candidate for the generation of large-scale employment indicators as these platforms, through network effects, attract many actors. There are incentives on both the users’ and providers’ sides to grow the platform through collecting and assembling data. Successful platforms are therefore a rich source of data on actors active on them. In the case of the career-oriented platform XING, they are, on the one hand, employees or job seekers and, on the other hand, employers such as firms, research institutes, or public administration.
The data available on such platforms allow for identifying employer–employee relationships over time and space, hence tracking individuals’ mobility from one employment to another. Importantly, the employment types listed on such platforms are not limited to those with social security contributions but also capture unpaid, freelance, and entrepreneurial activities, typically unobserved in administrative employer–employee data. Further, the employment and employee mobility data are available immediately after adding them to the user profile. Thus, there is no time lag in data provision, as is typically the case with administrative data. However, outdated information from the platform may also be part of the data. Administrative data are often subject to stringent legal requirements and may, for example, not be linked to all types of third-party data.
Measuring networks between employers through labour mobility is vital in innovation research (Balsvik 2011; Görg and Strobl 2005; Hottenrott and Lopes-Bento 2016). However, such networks are typically constructed from linked administrative employer–employee data (Collet and Hedström 2013; Kaiser, Kongsted, and Rønde 2015; Maliranta, Mohnen, and Rouvinen 2009), patent data, i.e. measuring inventor mobility (Rahko 2017; Somaya, Williamson, and Lorinkova 2008; van der Wouden and Rigby 2021), or data on scientific publications, i.e. capturing author mobility (Edler, Fier, and Heide 2011; Franzoni, Scellato, and Stephan 2014). In this study, we show that social network data are a valuable data source for exploring employee flows between employers. Exploring network data is valuable for many research applications, particularly for research on the performance of employers or regions (Giuliani 2011; Ozman 2009; Schilling and Phelps 2007). The approach has the potential to augment or replace data collected via surveys. While survey data are generally not well suited for mapping networks due to incomplete coverage and non-response, combining networks generated from a big-data source with survey data enriches the data portfolio and hence the scope of addressable research questions.
The data preparation consists of multiple consecutive steps: First, we disambiguate employers listed in publicly accessible employment data. We link and classify employers using the names and addresses (including private employers, research institutes, public administration, (non-)governmental institutions, etc.), to identify these employers in the Mannheim Enterprise Panel (MUP) and other data sources such as the Mannheim Innovation Panel (MIP). The total number of available employments is about 46 million but about two-thirds of the employments are not considered because of a restriction on high-quality matches with the MUP and a limitation on data from publicly accessible user profiles. We create a Linked Employer–Employee (LEE) data set by matching around 1.5 million employers to 14 million publicly accessible employments. Second, we calculate employee flows using the matched employments. We create an employee flow for each employee moving from one employer to another leading to 9 million flows between employers or into/out of employment, e.g. students entering the labour market or retirements out of the labour market. The database contains high-quality employment, employer, and employee flow data.
We analyse the employments with regard to their experience, discipline, career stage, and type. The matched employers are investigated regarding their size, age, industry, and region. For both employments and employers, the distributions of these characteristics are plausible. Furthermore, we test the validity of the flow data by analysing the career level, employment discipline, employment type, employer size, employer industry, and employer region before and after the employment change. E.g. most employees switch employments within a discipline and typically move upwards on the career ladder. The remainder of the paper is structured as follows: Section 2 presents the data processing, Section 3 describes the data sets, and Section 4 discusses the findings and concludes.
2 Data Processing
For our data analysis, we connect two data sources: First, we use data from the social and professional network XING. It provides detailed information on users – mostly professionals – who create profiles on the platform primarily for professional networking. The profiles comprise personal, employment-related data and data about the employer. The data access was granted in close cooperation with the platform provider New Work SE.[2] Second, we use data from the Mannheim Enterprise Panel (MUP), which provides data about the population of registered businesses in Germany.[3] The data are maintained in collaboration with Creditreform, Germany’s largest credit rating agency (Bersch et al. 2014). The MUP provides employer-level data that, besides others, contains addresses, employee counts, and founding dates. We combine both data sources, i.e. we link the XING employment data to employer data from the MUP. The remainder of this section describes the data processing of employers and employments (Section 2.1), and the employee flows (Section 2.2).
2.1 Employers and Employments
In the first step, employer and user employment data are exported from the data warehouse of XING. This involves about 1.9 M employers, whereby not every observation has to be a valid or active employer. These observations are not directly excluded, as we are also interested in historical data. XING users have deposited about 46 M employment data points. About one-third of the employments are linked to the XING employer database which is an internal database by XING that lists employers. The employment data are partly maintained by the users and include the employer name, employer URL, industry, employment type, career level, and field of activity (discipline). Some of the fields are optional, e.g. the employer URL. Thus, we also export employment data points with unclear quality. XING’s employer data show specific features: First, the employer database is not standardised or linked to a uniform database like the MUP. Second, outdated, duplicate or invalid/fake employers are listed. For example, insolvent or non-active employers. Third, operating sites, subsidiaries, and employer groups can have their own XING profiles. Fourth, some employers are not from Germany or the DACH region (Germany, Austria, Switzerland). To provide examples of the difference between valid German and available employers: The employer-level country data on XING is available for around 1.1 M employers, and, of these, 450 K have entered a country other than Germany. About 650 K of the 1.9 M employers have an invalid employer name, e.g. names consist exclusively of dots.
The data preparation consists of two consecutive steps. First, the employers (1.9 M) and employments (46 M) need to be linked to the Mannheim Enterprise Panel (MUP). This is done with the SearchEngine tool (Doherr 2023) developed by Thorsten Doherr. The linking relies on the text fields ‘employer name’ or ‘employer URL’, if available. Employer profiles and employment data are separately linked with the tool, as their quality is different. We assume that the data from the employer profiles have a higher quality than the employment data. As a result, we receive candidates from the Mannheim Enterprise Panel for the XING employer profiles and employers mentioned in employments on XING. Each candidate has a unique identifier called ‘crefo’ that represents the employer identifier of the MUP. There are 86 million candidates for the employment data points based on the employer name and 12 million based on the URL. Furthermore, about 187 thousand employer profiles are linked to MUP employers. Second, the MUP candidates for the employments are enriched with additional employer-level data like exit dates, if available. Some outliers are removed, e.g. implausible data like employments before 1900 and after 2020 (after the data export), leading to a subset of 44 million employments. Then, we apply the ‘group-crefo’, which combines affiliated employers within the MUP, e.g. subsidiaries. Lastly, binary indicators are created, which, for example, indicate if a ‘crefo’ exists in the Markus database.[4]
Next, a five-step heuristic is used to select the best candidate from the MUP for each employment data point (see Table 1). As a result, about 21 million employments are matched to the MUP. Thus, the matching rate is about 47 %. However, we deliberately extracted fewer matches than possible to ensure higher quality, as there is a trade-off between the observation count and data quality of the matches. For legal reasons, all employments from users without a public profile must be removed. We export a list of all publicly available user profiles (privacy setting) to ensure that we use only publicly accessible employments as this is a legal requirement by New Work SE. Public employments can be viewed and saved by every visitor of XING. Each employment data point has a user reference, which is used to remove non-public data. Around 31 million of 46 million employment data points are publicly available. This reduces the number of disambiguated employments to 14 million. We do not delete the unmatched employments of users with public profiles but assign an artificial employer identifier based on the employer name.
Processing steps for employment data.
| Step | Description | Data |
|---|---|---|
| 1 | Concatenate match candidates (MUP) for employments based on URLs and employer names. | Input: 86 million + 12 million = 98 million candidates. |
| 2 | Drop duplicates based on unique XING ‘employment id’ and ‘crefo’; select unambiguous matches. | 11 million matches are selected and 83 million are left. |
| 3 | Use candidates with ‘exist’ or ‘missing’ exit status and select unambiguous matches. | 6 million matches are selected and 58 million are left. |
| 4 | Use candidates existent in ‘markus’ data base and select unambiguous matches. | 2 million matches are selected and 38 million are left. |
| 5 | Use candidates with highest fuzzy-matching score (employer name) and select unambiguous matches. | 1 million matches are selected and 28 million are left. |
| 6 | Concatenate with disambiguated employer profile matches. Prefer employer profile matches. | 21 million employment matches. |
| 7 | Select matches for a subset of public employments. | Result: 14 million employment matches (i.e. the employer listed in employment is linked to the MUP). |
-
Multi-stage selection of the best employment matches to the Mannheim Enterprise Panel (MUP).
The employer data consists of three types: Employers only identified in XING, employers only identified in the MUP and employers identified in both databases. In the following step, we are only interested in employers listed in public employments linked to the MUP or non-matched employers (XING). For the subsequent statistical analyses, we only use the matched employers. About 1.5 million unique employers have been successfully linked to the MUP. The number refers to the matched employers listed in XING employments because we do not count employers with a profile but are not mentioned in at least one employment. Furthermore, employers with an artificial identifier are not counted as well. In the MUP, some variables have missing values. The missing rates for the variables of the matched employers are: Founding date (14 %), district id (4 %), legal form (
2.2 Flows
Employee flows between employers are extracted from the employment data on XING. For this, we select the employment data of users with a public profile and define a flow as the switch between two successive employments. Temporal breaks between employments, such as unemployment, are ignored. For example, if an individual was unemployed for three years between two employments, then a flow between the employment before and after unemployment exists in the data set. We create an employer identifier (‘missing’) for the initial entry and final exit, e.g. for employment starters or retired individuals. Furthermore, only user profiles that list at least two employments are used. The described process leads to about 21 M flows for the matched and unmatched employments. Flows extracted from matched employments comprise about 9 M observations, where 7 M observations are flows between employers (see Table 2). Each flow entails the year of the employment change and the old and new employment characteristics.
Flow extraction steps.
| Step | Description | Data |
|---|---|---|
| 1. | Start with all employments. | 46 million raw employments are exported from the data warehouse. |
| 2. | Keep employments of users with at least two entries. | 34 million employments are selected from the user profiles. |
| 3. | Keep employments of users with public profiles. | 23 M employments: 14 million are matched; 10 million employments have artificial identifiers. Numbers do not sum up, due to rounding errors. |
| 4. | Extract flows from employments. | 21 million flows are retrieved from employments. The flow data includes first employment entrances and last employment exits (modelled as sink nodes). |
| 5. | Extract matched flows. | 9 million flows between matched employers (incl. sink nodes). 7 million flows model employment changes between two matched employers (excl. sink nodes). |
-
Input data, Employment and employer data.
3 Data Description
Next, we describe the following data sets: employees and employments (Section 3.1), employers (Section 3.2), and employee flows (Section 3.3).
3.1 Employees and Their Employments
Figure 1 shows selected characteristics of the platform users. The analyses intend to improve our understanding of the users active on the platform XING. We restrict the analysis to subsets of the data: employments have to be publicly available, matched to the MUP, and the respective characteristic, e.g. the career stage, needs to be available. The most recent employment per user is utilised for the discipline, career stage, and employment type analyses. For the analysis of the user experience, the oldest employment per user is considered. Our findings suggest: First, most employees have between zero and 19 years of professional experience. Few users have more than 39 years of professional experience as German employees must work for 35 or 45 years to be considered long-term or very long-term insured to receive their full pensions. Primarily, highly educated employees are present on XING, who often start their careers later and, thus, work for fewer years overall. Second, the disciplines Sales, Administration, and IT & Data have the most employees. Surprisingly, few employees are working in Production, R&D, and Finance. There may be a certain bias because the respective employees rarely use the platform (e.g. for Production). Third, most employees have professional experience but no managerial position. Managing directors and directors are found least often. Fourth, the majority of the employees work full-time. Civil servants and unpaid workers are by far the least frequent. Overall, we can conclude that the XING data are not representative of German employees.
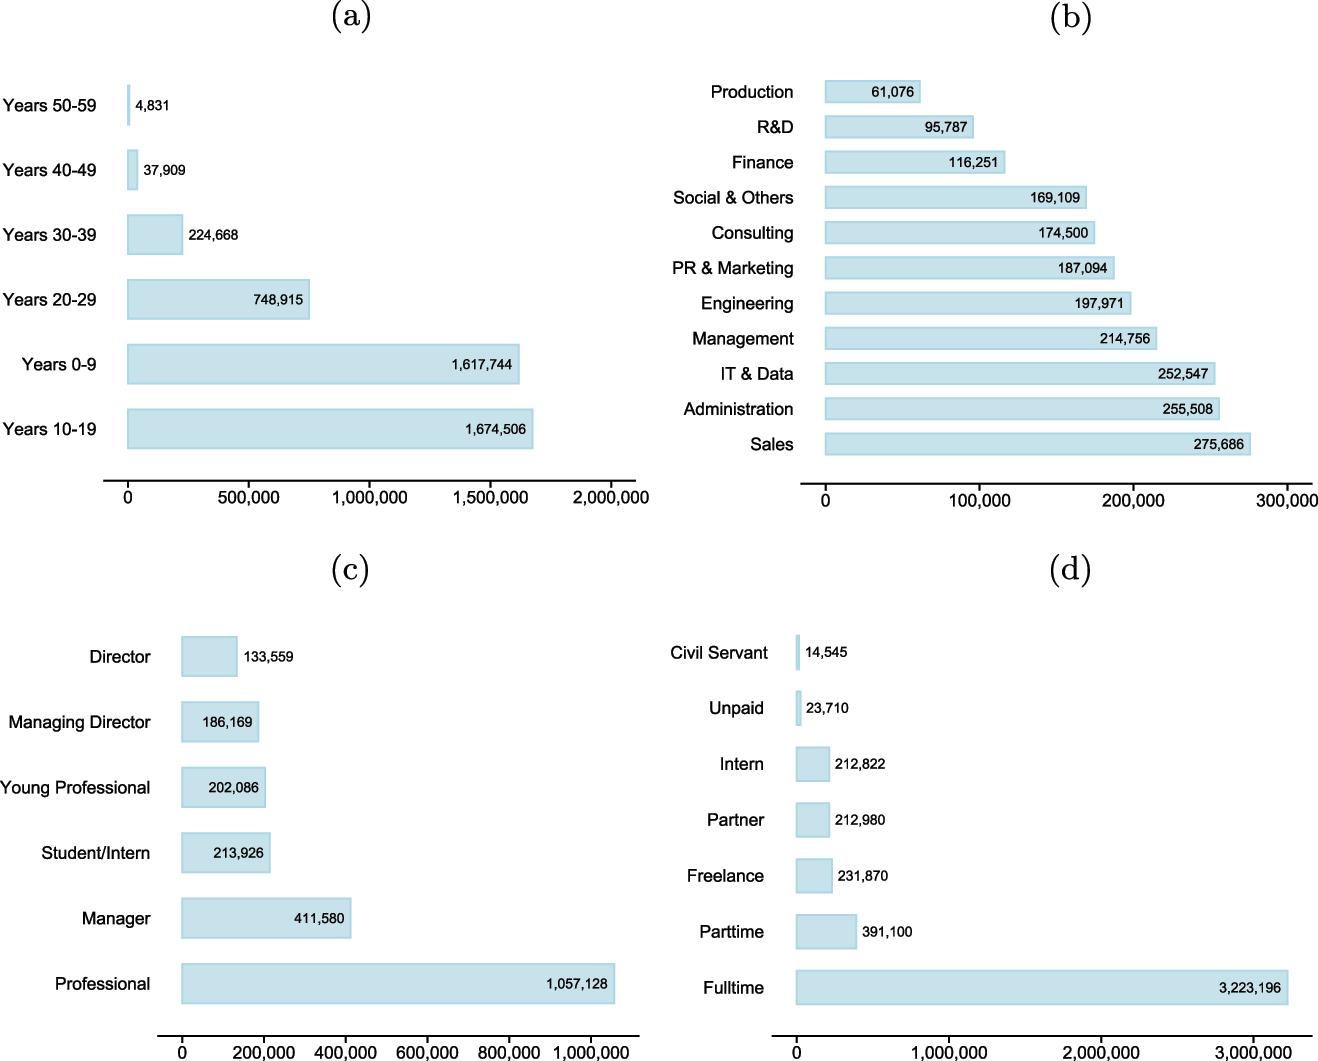
XING users with respect to employment characteristics. Note: (a): per experience class; (b): per discipline; (c): per career stage; (d): per employment type. For the analyses, only matched employments from publicly accessible user profiles are used. Source: TUM and ZEW based on XING data. Own illustration.
Figure 2 shows the number of employments by employer size, region, industry, and founding period. First, small employers (
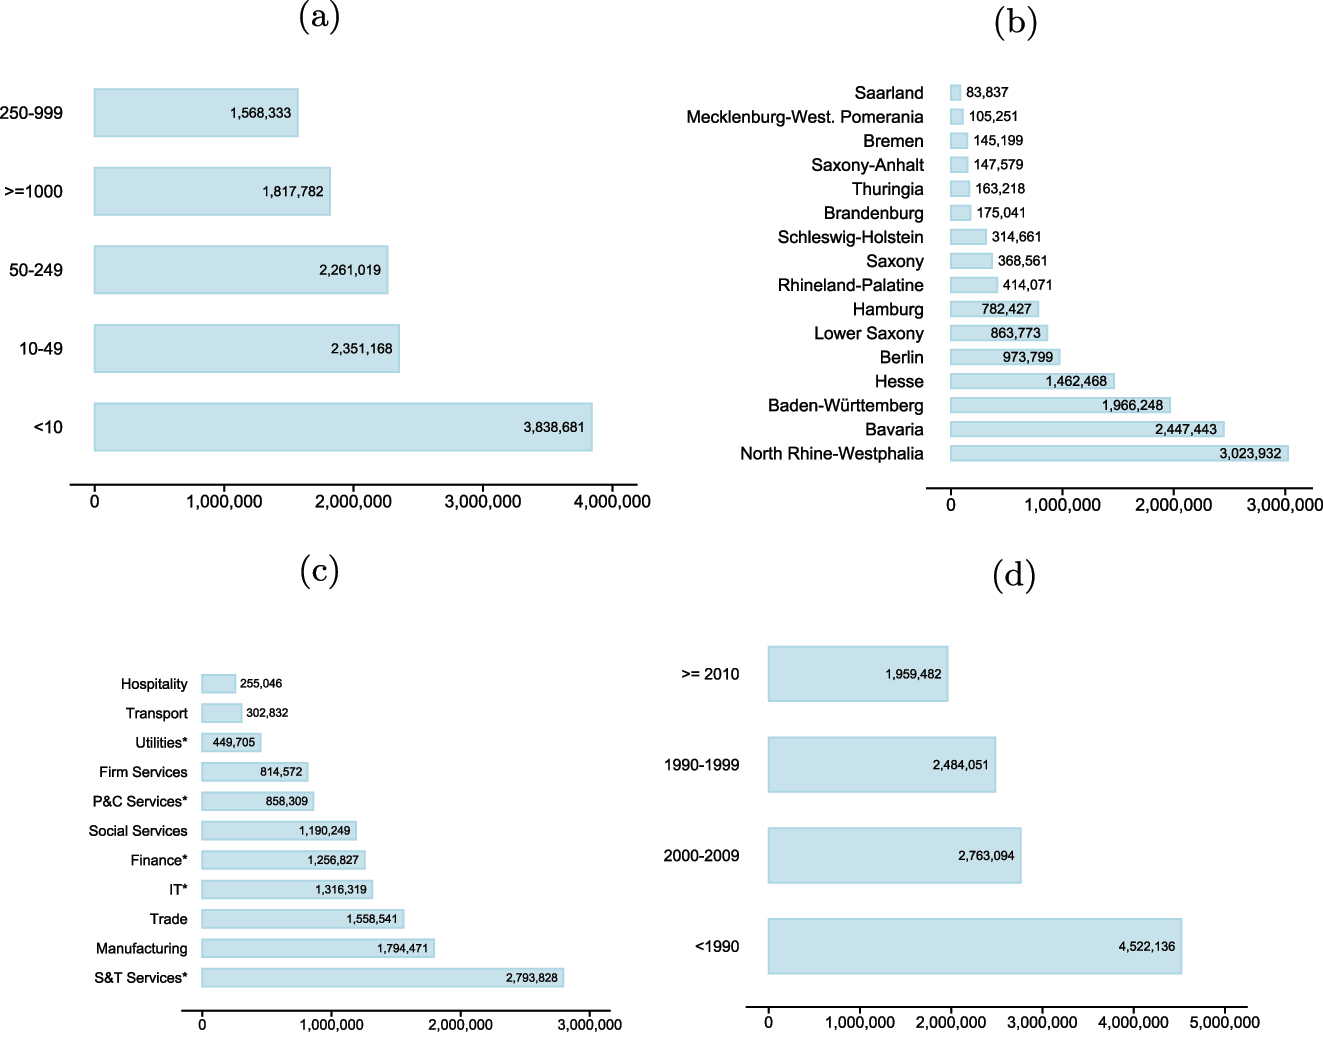
Employment counts (XING) with respect to median employer size (top left), region (top right), employer industry (bottom left), and employer founding year (bottom right). Only matched and public employments are used. Source: TUM and ZEW based on data from XING and MUP. Own illustration.
3.2 Employers
Figure 3 shows selected MUP characteristics for the matched XING employers. The employers are extracted from the XING employments that were matched to the MUP. The XING employer data set cannot be compared directly with the total stock of German employers in the MUP. E.g. the XING data contain employers that are no longer economically active. Our findings suggest: First, most employers on XING have less than 10 employees, and only a few employers have at least 250 employees. Second, most employers are found in the industry Freelance, Scientific and Technical Services (69–75); the fewest employers are in the industry transport (49–53). The numbers in parentheses are the two-digit NACE codes.[6] Third, most employers are founded in ‘2000–2009’ or ‘2010 & later’; there is a small decrease in the number of founded employers ‘before 2000’. Fourth, most employers are located in the German regions of North Rhine-Westphalia, Bavaria, and Baden-Württemberg (in the former territory of West Germany). The fewest are located in Mecklenburg-Western Pomerania, Bremen, and Saarland. Many regions of the former German Democratic Republic (GDR) are in the lower half of the ranking, illustrating an east-west divide. The cities of Berlin and Hamburg are in the midfield of the ranking. In summary, the XING employer data seem plausible and, with some limitations, representative of Germany.
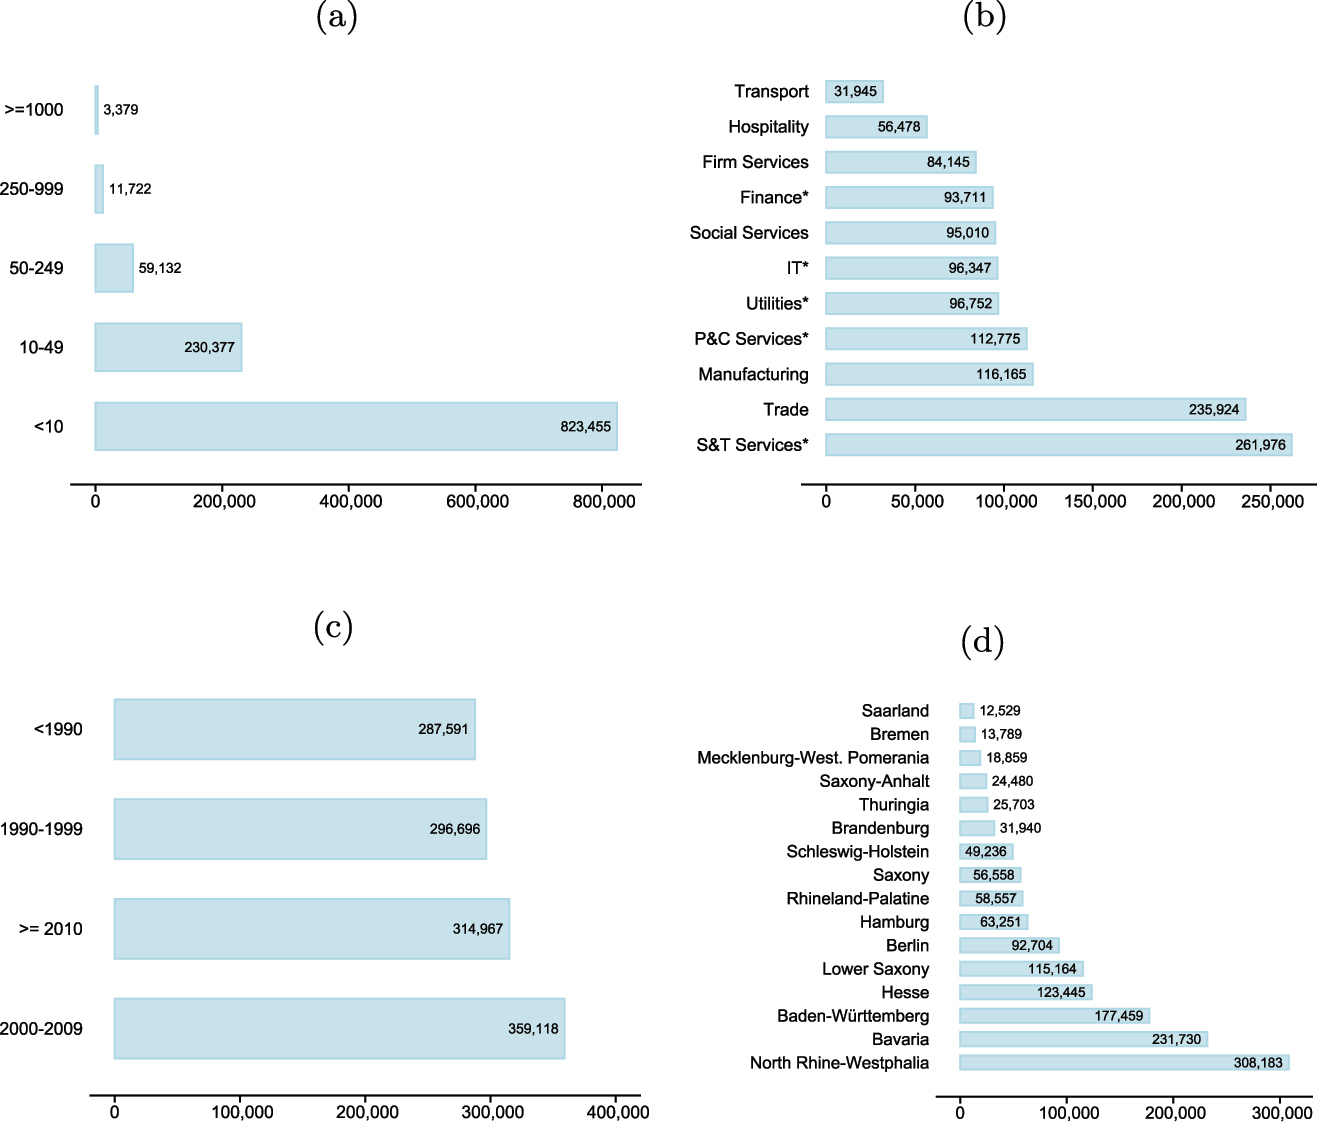
Number of XING employers with respect to MUP characteristics; based on matched employers. Note: (a): per median employer size group; (b): per industry; (c): per founding year group; (d): per German region. Source: TUM and ZEW based on XING and MUP data. Own illustration.
3.3 Employee Flows
Figure 4 shows the employee flows of XING users by their employment characteristics, i.e. career level, discipline, employment type, employer size, industry, and region. First, we analyse the flows between employers with respect to career levels. Most users transfer out of employments with professional experience. Users usually switch employments within an experience class or into a higher experience class, e.g. from young professional to professional. Employees rarely reduce their experience level. For example, if an employee is moving into a new industry. Second, we analyse the flows between employers for employment disciplines. Most users switch employments within their discipline. However, we find flows for all discipline combinations. Third, we analyse the flows between employers by their employment type. Here, we find a deviating pattern: Many of the employment types show a flow into the ‘Full-time’ class.
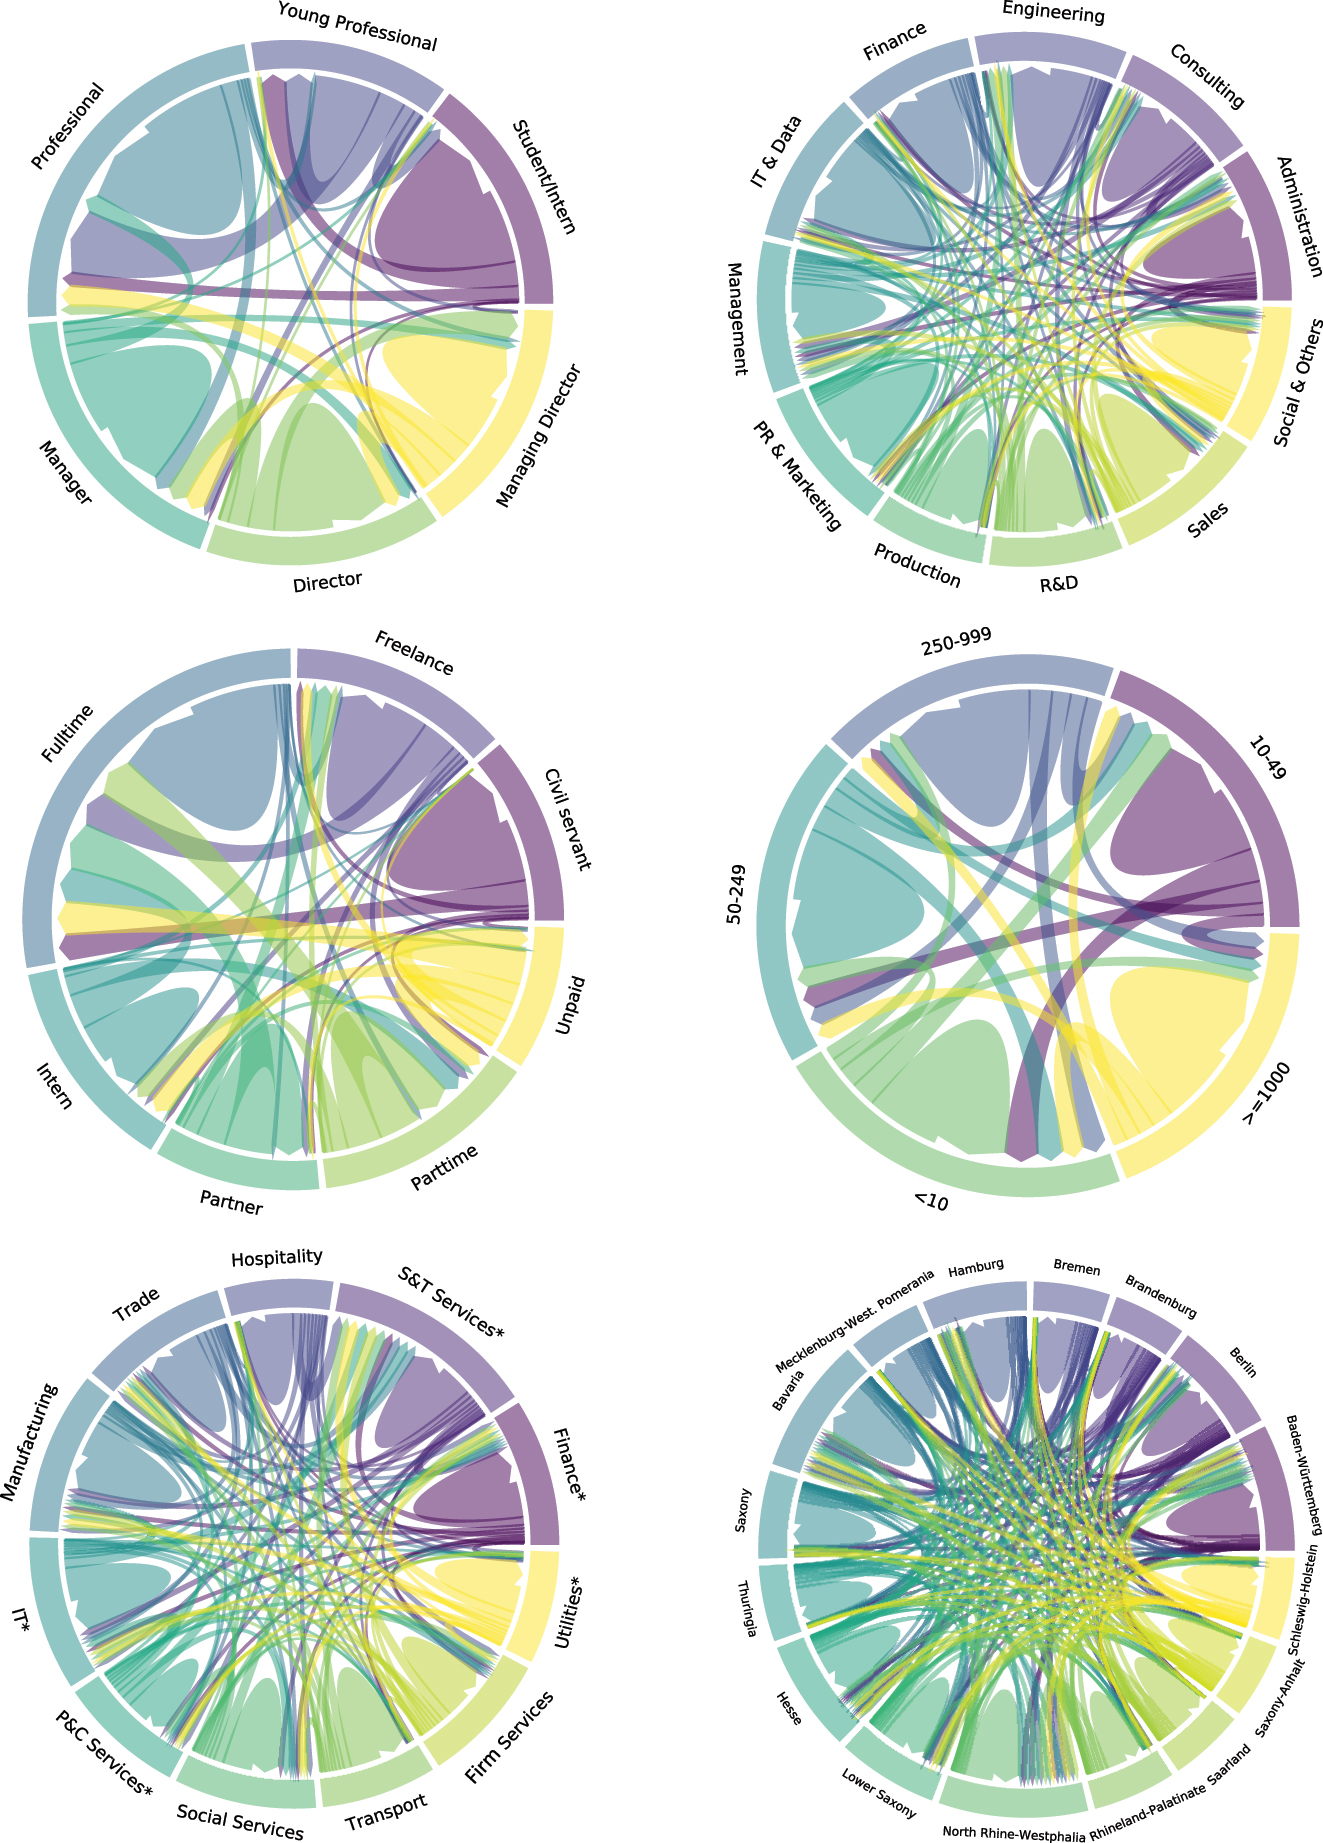
Employee flows as chord diagrams. Top left: Career levels. Top right: employment discipline, middle left: employment type, middle right: employer size, bottom left: employer industry, bottom right: Employer region. Flows are based on matched employments from public user profiles. Source: TUM and ZEW based on XING and MUP data. Own illustration.
Further validity checks show that civil servants move only occasionally into unpaid employments, and young professionals rarely move into (managing) director positions. Fourth, many flows occur within the same employer size class, and relatively few flows are found for employment changes to large-sized employers. Fifth, many employees are moving within industries. However, employers in the Freelance, Scientific and Technical Services (69–75) industry receive substantial inflows from all other industries. Sixth, the majority of employees change employers within their region. However, the regions of Bavaria, North Rhine-Westphalia, and Baden-Württemberg have substantial inflows from all other regions.
4 Conclusions
The availability of social media data creates new opportunities for empirical economic research. This paper presents a detailed exploration of using data from the career-oriented social networking platform XING. We obtain employment data from public user profiles and link them to the Mannheim Enterprise Panel (MUP). The novel link creates a unique platform-based LEE data set that allows tracking employee flows between employers. The data set comprises about 14 million employments for 1.5 million disambiguated employers. The matched employment data are used to extract 9 million employee flows.
We check the plausibility of the data set and show that career-oriented social networking data contain meaningful and valuable data about employments, employers, and employee flows. A further possibility for validation is a comparison with LEE data from official data sources. Notably, the coverage of our data goes beyond paid employment by including, for example, freelance work and some entrepreneurial activities. For the analysis of networks, the coverage is sufficiently high, and network measures can be derived for employers that are neither active in patenting nor engaged in larger, visible alliances. Nevertheless, using such data for research purposes should be done with care.
Platforms like XING and LinkedIn may have some biases concerning their users. For example, older employees, employees without training, and employees from specific industries, such as household services, are less frequently represented. Linked employer–employee data from official sources provide a better overview of these employment relationships, e.g. the IAB data from the Federal Employment Agency,[7] even though this also comes with other restrictions. Furthermore, self-employed workers may not be correctly matched in our data set because they could not be linked to a MUP employer. In principle, however, it is possible to recognise these employments and treat them automatically. Furthermore, we only use publicly available data from the platform XING to comply with the users’ desire to keep their data non-public. As a result, we might create biased data as, for example, specific user groups are more concerned about their privacy, e.g. employees in the fields of law and IT. Unfortunately, investigating this hypothesis in more detail is not straightforward. Also, some users do not update their profiles frequently, which creates the impression that an employee has been with the employer longer than is the case. Another way this can happen is if a user changes platforms and instead maintains his LinkedIn profile. However, our platform-based approach has a multitude of advantages. The data are subject to fewer legal constraints, can be updated regularly, and are publicly accessible.
We want to highlight that employers on XING and MUP are linked using fuzzy string matching (Doherr 2023). However, our method is not error-free. The matching approach can be further improved, for example, by adjusting the parameters or using different matching methods. There is a discrepancy in the unit of observation: On XING, employer sites are often listed and linked to employments. The MUP, however, consists of employers that are legally independent entities. Therefore, a link of multiple employer sites to one employer is necessary. Employee flows do not consider many exceptional cases, e.g. concurrent employments are not modelled. Time gaps between employments are, so far, not considered. They might be modeled with separate nodes representing unemployment.
In conclusion, despite these challenges, we are able to link a large share of employers due to careful disambiguation of employer names, URLs, and profiles. The plausibility checks suggest that the resulting data have no major shortcomings. Hence, the new database provides opportunities for being used in subsequent research on the role of employee mobility, networks, and local ecosystems for economic performance both at the employer and the regional level. The micro-nature of the data allows, for example, the calculation of indicators on the level of the network nodes, i.e. employers. These include centrality measures for employers and aggregate measures for network characteristics at the regional level. Data availability over time further facilitates analyses of the network’s development and the drivers of these changes.
Access to data: The data described in this article can be accessed via the Research Data Centre of ZEW. Data access is restricted to on-site access at ZEW’s safe centre in Mannheim, based on a data usage contract between the data user and ZEW. For more details on the data, see (Breithaupt et al. 2023).
Funding source: Bundesministerium für Bildung und Forschung
Award Identifier / Grant number: 16IFI006
Award Identifier / Grant number: 16IFI105
-
Research funding: This work was funded by Bundesministerium für Bildung und Forschung (nos. 16IFI006, 16IFI105).
References
Balsvik, R. 2011. “Is Labor Mobility a Channel for Spillovers from Multinationals? Evidence from Norwegian Manufacturing.” The Review of Economics and Statistics 93 (1): 285–97. https://doi.org/10.1162/rest_a_00061.Suche in Google Scholar
Bersch, J., S. Gottschalk, B. Müller, and M. Niefert. 2014. The Mannheim Enterprise Panel (MUP) and Firm Statistics for Germany, ZEW Discussion Paper No. 14-104. Mannheim: ZEW - Leibniz Centre for European Economic Research.10.2139/ssrn.2548385Suche in Google Scholar
Breithaupt, P., H. Hottenrott, C. Rammer, and K. Römer. 2023. Mapping Employee Mobility and Employer Networks Using Professional Network Data, ZEW Discussion Paper No. 23-041. Mannheim: ZEW - Leibniz Centre for European Economic Research.10.2139/ssrn.4625849Suche in Google Scholar
Collet, F., and P. Hedström. 2013. “Old Friends and New Acquaintances: Tie Formation Mechanisms in an Interorganizational Network Generated by Employee Mobility.” Social Networks 35 (3): 288–99. https://doi.org/10.1016/j.socnet.2013.02.005.Suche in Google Scholar
Doherr, T. 2023. The Search Engine: A Holistic Approach to Matching (2023), ZEW Discussion Paper No. 23-001. Mannheim: ZEW - Leibniz Centre for European Economic Research.Suche in Google Scholar
Edler, J., H. Fier, and C. Grimpe Heide. 2011. “International Scientist Mobility and the Locus of Knowledge and Technology Transfer.” Research Policy 40 (6): 791–805. https://doi.org/10.1016/j.respol.2011.03.003.Suche in Google Scholar
Franzoni, C., G. Scellato, and P. Stephan. 2014. “The Mover’s Advantage: The Superior Performance of Migrant Scientists.” Economics Letters 122 (1): 89–93. https://doi.org/10.1016/j.econlet.2013.10.040.Suche in Google Scholar
Giuliani, E. 2011. “Networks of Innovation.” In Handbook of Regional Innovation and Growth, Chapter 12, edited by P. Cooke, B. Asheim, R. Boschma, R. Martin, D. Schwartz, and F. Tödtling. Northampton, Cheltenham: Edward Elgar Publishing.Suche in Google Scholar
Görg, H., and E. Strobl. 2005. “Spillovers from Foreign Firms through Worker Mobility: An Empirical Investigation.” The Scandinavian Journal of Economics 107 (4): 693–709s. https://doi.org/10.1111/j.1467-9442.2005.00427.x.Suche in Google Scholar
Hottenrott, H., and C. Lopes-Bento. 2016. “R&D Partnerships and Innovation Performance: Can There Be Too Much of a Good Thing?” Journal of Product Innovation Management 33 (6): 773–94. https://doi.org/10.1111/jpim.12311.Suche in Google Scholar
Kaiser, U., H. C. Kongsted, and T. Rønde. 2015. “Does the Mobility of R&D Labor Increase Innovation?” Journal of Economic Behavior and Organization 110: 91–105, https://doi.org/10.1016/j.jebo.2014.12.012.Suche in Google Scholar
Maliranta, M., P. Mohnen, and P. Rouvinen. 2009. “Is Inter-Firm Labor Mobility a Channel of Knowledge Spillovers? Evidence from a Linked Employer–Employee Panel.” Industrial and Corporate Change 18 (6): 1161–91. https://doi.org/10.1093/icc/dtp031.Suche in Google Scholar
Ozman, M. 2009. “Inter-Firm Networks and Innovation: a Survey of Literature.” Economics of Innovation and New Technology 18 (1): 39–67. https://doi.org/10.1080/10438590701660095.Suche in Google Scholar
Rahko, J. 2017. “Knowledge Spillovers Through Inventor Mobility: the Effect on Firm-Level Patenting.” The Journal of Technology Transfer 42 (3): 585–614. https://doi.org/10.1007/s10961-016-9494-3.Suche in Google Scholar
Schilling, M. A., and C. C. Phelps. 2007. “Interfirm Collaboration Networks: The Impact of Large-Scale Network Structure on Firm Innovation.” Management Science 53 (7): 1113–26. https://doi.org/10.1287/mnsc.1060.0624.Suche in Google Scholar
Somaya, D., I. O. Williamson, and N. Lorinkova. 2008. “Gone but Not Lost: The Different Performance Impacts of Employee Mobility Between Cooperators versus Competitors.” Academy of Management Journal 51 (5): 936–53. https://doi.org/10.5465/amj.2008.34789660.Suche in Google Scholar
van der Wouden, F., and D. L. Rigby. 2021. “Inventor Mobility and Productivity: A Long-Run Perspective.” Industry and Innovation 28 (6): 677–703.10.1080/13662716.2020.1789451Suche in Google Scholar
© 2024 the author(s), published by De Gruyter, Berlin/Boston
This work is licensed under the Creative Commons Attribution 4.0 International License.
Artikel in diesem Heft
- Frontmatter
- Original Articles
- Payment Habits during Covid-19: Evidence from High-Frequency Transaction Data
- Unintended Consequences of the 2015 Refugee Surge on Residential Building Permits in Germany
- Under Debate
- A Carbon Wealth Tax: Modelling, Empirics, and Policy
- Comment to “A Proposal for a Carbon Wealth Tax: Modelling, Empirics, and Policy” (DOI https://doi.org/10.1515/jbnst-2024-0078) by Willi Semmler and José Pedro Bastos Neves
- Comment to “A Proposal for a Carbon Wealth Tax: Modelling, Empirics, and Policy” (DOI https://doi.org/10.1515/jbnst-2024-0078) by Willi Semmler and José Pedro Bastos Neves
- Reply to the Comments by Hans-Helmut Kotz and Friedrich Heinemann to “A Proposal for a Carbon Wealth Tax: Modelling, Empirics, and Policy” (DOI https://doi.org/10.1515/jbnst-2024-0078)
- Data Observer
- Linked Employer–Employee Data from XING and the Mannheim Enterprise Panel
- Data on Repeated Offerings in the German Housing Market Based on RWI-GEO-RED
- Miscellaneous
- Annual Reviewer Acknowledgement