The WBdigital Database: A Digital Repository for the Historical DIW-Wochenbericht, 1928–1968
-
Marcus Schöps
 ,
Enrico Wedekind
,
Enrico Wedekind

Abstract
Economic and social scientists are increasingly interested in historical data, but many relevant sources are still available in analog form, limiting accessibility and research potential. This article introduces the WBdigital database, which aims to improve this situation. The database provides digital access to the DIW Wochenbericht (1928–1968), including its economic texts and time series data covering both German and international perspectives. These research data offer an ideal framework for investigating important research questions related to historical contexts and current economic challenges. Thus, we hope that the WBdigital database will be a valuable tool for researchers interested in economic history.
1 Introduction
Economists and social scientists are increasingly turning to historical research to analyze long-term economic developments, evaluate economic theories, and gain a deeper understanding of the past.[1] While digitization and modern computing have expanded access to historical data and the tools to analyze it, many relevant historical data sources remain in analog form, limiting their scientific utility and leaving significant research potential untapped (Hesse 2017).
This article describes the development and content of the WBdigital database, a project aimed at expanding access to digitized data for historical research in economics and other social sciences. The WBdigital database is the result of the project “Wochenbericht digital in Wort und Zahl – Digitale Bereitstellung der DIW-Wochenberichtsinhalte 1928 bis 1968 (WBdigital).”[2] The objective was to provide digital access to the extensive data contained in the historical DIW Wochenbericht (WB). Up to 1968, the WB offers a comprehensive and detailed account of the German and international economy, covering key economic episodes of the inter-war and post-war periods through ongoing analyses, reports, and economic data (Fremdling and Stäglin 2008).
The paper is structured as follows: First, we provide a brief description of the WB and project background. This is followed by an outline of our innovative approach to digitization. Next, we present an overview of the structure, content, and accessibility of the database. Finally, future research perspectives and possibilities for further development are discussed.
2 Data Source and Project Background
The WBdigital database is based exclusively on the historical issues of the WB, published by the German Institute for Economic Research (DIW Berlin) between 1928 and 1968.[3] Since 1928, the WB has provided regular coverage of current economic issues and contributed the Institute’s research findings to the public debate.[4] Prior to 1968, the WB typically consisted of two to three articles in which the Institute briefly presented its economic, market, country, or sector analyses. Moreover, the WB was frequently accompanied by thematically structured statistical overviews (the so-called Zahlenübersichten, ZU), which provided detailed and comprehensive information on the domestic and foreign state of the economy based on a multitude of indicators. These indicators encompass a wide range of economic and financial data, including production, construction, employment, monetary aggregates, prices, securities markets, foreign trade, transport, and public finances.[5]
The consistent and detailed coverage of economic developments, along with the quality of the economic data, makes the WB a valuable resource for historical economic and social research (Buchheim 2003, 2008; Dimsdale, Horsewood, and Van Riel 2004; Fremdling 2010; Ritschl 1992; Spoerer 1997).[6] However, its analog format has significantly hindered widespread use due to the extensive research and data collection efforts required. In response to numerous user requests, DIW Berlin’s Research Infrastructure Department aimed to remove these access barriers and make the WB and its data permanently accessible and usable via a digital portal in line with the FAIR principles.[7] In addition to full-text digitization and indexing, the project focused on the ZU and their economic data. Using a novel technical approach, the printed data tables of the ZU were digitized in a largely automated process and processed into long, consistent time series within thematically structured datasets.
3 Digitization
This section outlines the process of converting the printed volumes of the WB into digitized and processable research data. We began by digitizing all volumes from 1928 to 1968, supplementing any low-quality volumes in the DIW library with loans from other libraries.[8] In total, 10,900 pages were scanned. We then used commercial OCR software (ABBYY FineReader) to extract data from the digital copies. While OCR recognition of texts was highly successful, the ZU presented a greater challenge due to its complex tabular structure. The hierarchical structure with multiple headers and columns was more complex than conventional tables, and the inclusion of footnotes and non-numeric cell entries, such as quotation marks, added further complications to recognition and transcription (see Figure 1).

Excerpt from an original scan of the Zahlenübersicht C (issue no. 19 of the DIW Wochenbericht 1959). Only 8 of 90 lines are shown.
To address these challenges, we combined machine learning models with a knowledge-based approach to automatically transcribe data from the ZU. First, we used the open-source OCR tool PaddleOCR to recognize the numbers and text entries in each table cell, reconstructing the rows and columns.[9] The large number of entries, small distances between cells, and occasional optical distortions made it difficult to assign coordinates accurately. To solve these issues, we employed the DBSCAN local clustering algorithm to map individual table cells to neighboring ones.[10] The lines separating columns were additionally detected using a U-Net deep learning architecture. Finally, heuristics were applied to validate the transcription for each row and column. This approach achieved an overall accuracy rate of 99.8 %, indicating a high precision in identifying rows and columns. However, the remaining 0.2 % error rate suggests that approximately 14 % of the ZU may contain at least one incorrectly recognized row or column, meaning that the structure of 86 % of the ZU was correctly identified.
In a second step, we transcribed the table cells of each ZU using OCR software. For numerical entries, we replaced PaddleOCR’s transcription with Guppy, a self-developed open-source OCR tool specifically designed to recognize numbers, which significantly reduced the error rate. To validate the transcriptions, we compared them with subsequent transcriptions of the same issue, leveraging the regular publication frequency (weekly, monthly, quarterly). Successive ZUs usually differ only in the outer columns, with the left-hand column being replaced by a new column on the right-hand side. This redundancy allowed us to calculate a majority vote for each cell’s transcription. Identical numerical entries in two or three transcriptions indicate high confidence, while discrepancies indicate low confidence, which is highlighted by colors. Consequently, the co-editors only needed to manually check the colored table cells using our table editor, KIETA (Kempf, Krug, and Puppe 2023), which also displays an image section of the original scan next to the OCR transcription to facilitate manual review (see Figure 2).

Editor KIETA for post-correction of the automatic transcription displays an image section for each cell, with the OCR-transcribed figures or text below it for easy correction by clicking. Cells marked in color indicate low confidence and require manual checking. Footnotes are marked in purple. The results can be saved and exported in various formats.
The post-correction of a ZU with approximately 900 automatically transcribed numerical entries took only 5–10 min with KIETA, achieving an error rate of 1.3 %, mainly due to footnote characters and incorrectly cut table cells. Excluding these errors, the OCR error rate drops to 0.1 %. For the transcription of textual table cells within a ZU, we used the PaddleOCR model with automatic post-correction based on a dictionary of typical text snippets. KIETA also offers export to various formats such as .csv resp. Excel (see Figure 3) or .html, which were used for further processing and import into the database.

Export from KIETA as a .csv file. The cell containing a footnote is highlighted in purple.
To create long and consistent time series from the ZU, we aggregated the transcripts and their variables over time, following a source-oriented approach to create a digital surrogate of the original (Harvey and Press 1996).[11] This task was complicated by methodological and definitional changes over time, such as index revisions, territorial changes, and variations in measurement and currency units. Additionally, the ZU content was dynamic, with variables being added or removed over time. To address these challenges, we manually checked all ZUs for transformations affecting time series consistency and documented them.[12] Using this documentation, we segmented the aggregates of each individual variables into long, consistent time series based on standardized definitions and methods.[13]
4 The WBdigital Database
To present and provide access to the research data digitized and obtained from the WB, we created the WBdigital database. This database is freely accessible at https://wbdigital.diw.de, with a user interface available in both German and English.[14] The various sections of the database are described in more detail below.
4.1 Wochenberichte (Weekly Reports)
This section contains 35 volumes of the WB published between 1928 and 1968, including 1,542 issues and 3,451 articles, all of which can be viewed and downloaded as digital copies.[15] Full-text search is available using OCR recognition. Users can search WB and their articles by title, year of publication, or topic (Figure 4).[16] For topic searches, keywords from the WB volumes have been mapped to the bilingual STW Thesaurus for Economics, extending search options with numerous German and English entries from the STW and concordances to other controlled vocabularies, such as the German Integrated Authority File (GND).[17]
Initially, a string match was performed using a Python script to compare entries in the keyword directories with preferred terms and synonym references in the STW. Based on this string comparison, intellectual mapping at the semantic level was carried out. Most entries in the keyword directories were mapped to one or more STW subject headings and linked to their persistent IDs. In several cases, alternative search entries or entirely new concept records were added to the thesaurus. For geographic locations below the state level, as well as for corporations and treaties, keyword entries were linked to corresponding GND entries to provide additional alternative search options. Time entries and brackets, such as those with formal descriptions, could not be mapped to the STW but can be searched using the full-text search.

The topic search includes both the entries from the keyword indexes listed in the Thema (WB + STW) column and the subject headings from the STW, including concordances to other vocabularies. DIW Wochenbericht articles with the German keyword entry “Landwirtschaft” can be found with the English search entry “agriculture”, among others.
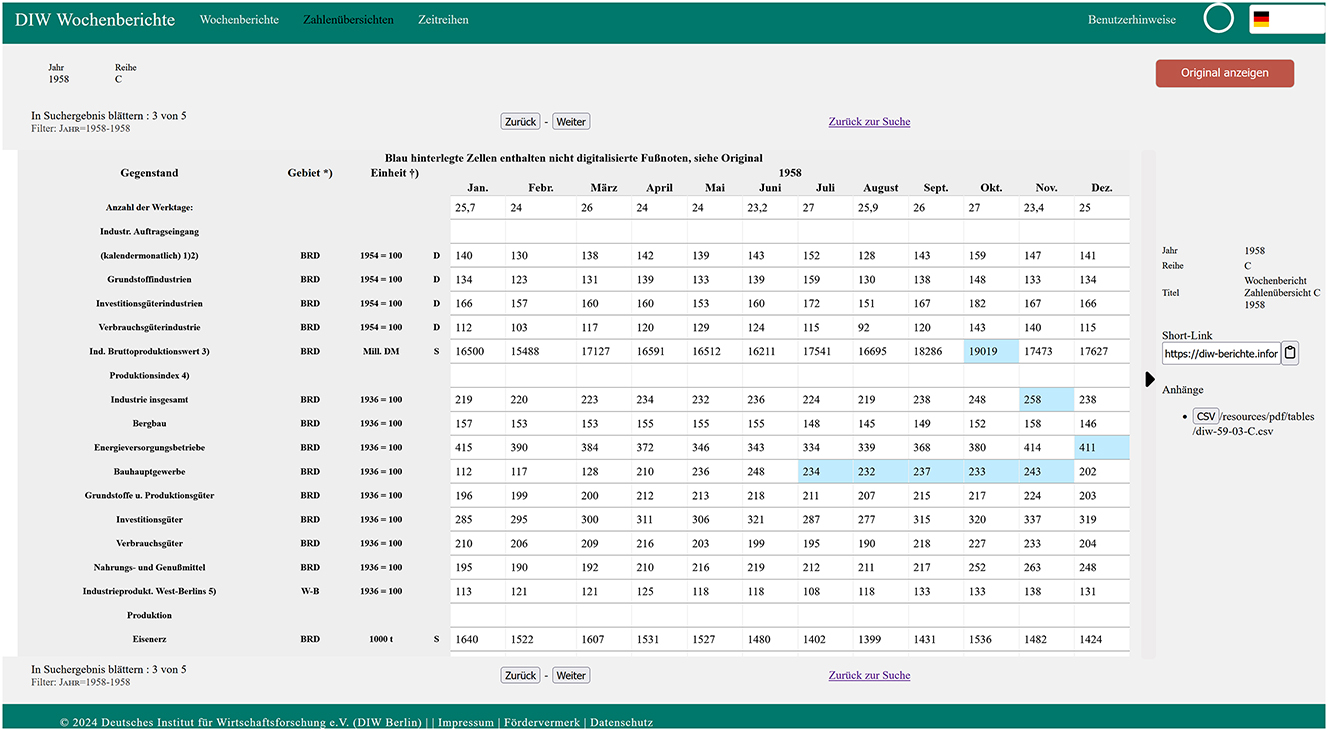
Presentation of a scrollable transcript of a ZU, based on Figure 1 in the web interface of the DIW-viewer. The four header columns, typically consistent for tables of the same type, were added. Figures with blue background color contain footnotes. Their meaning can be checked by clicking the button “original anzeigen” (show original). Download is available in CSV format.
4.2 Zahlenübersichten (Statistical Overviews)
This section contains transcripts of the various ZU series (A, B, C, D, E, F, Berlin, and Mitteldeutschland) produced during the digitization process (Figure 5). These transcripts provide an initial annual perspective on the ZU data and can be searched by variable, year, ZU series, and full text. The transcripts can be viewed in detail and downloaded in CSV format.
Please note that the transcripts display only the variables and their numerical values, not the footnotes from the original documents. However, footnotes are marked in the transcripts (by numbers or color highlighting) and can be checked through the linked original documents. Researchers merging data from different transcripts of the same series should be aware that definitional and methodological changes between years may affect the consistency of the data. In general, it is highly recommended to refer to the original sources when working with data from the transcripts.
4.3 Zeitreihen (Time Series)
The time series section of our database includes all digitized and processed time series from the ZU, which regularly accompanied the WB. It features around 2,500 mostly disaggregated, consistent macroeconomic and macro-financial series, covering various periods from 1926 to 1968. These series are organized into 16 datasets that reflect the thematic and historical structure of the ZU (see Table 1) and can be accessed and downloaded via the database.
Thematic and temporal coverage of the time series datasets.
| Dataset | Topics | Interwar coverage | Postwar coverage |
|---|---|---|---|
| Wochenzahlen | General economic data (weekly frequency) | X | X |
| Monatszahlen | General economic data (monthly frequency) | X | |
| A | Prices, interest rates, securities markets, central banking, private banking, credits, government finances, wages | X | X |
| B | Foreign trade, domestic trade, transportation | X | X |
| C | Production, consumption | X | X |
| D | Labor market, employment | X | X |
| E | General economic data for the USA, Great Britain, France, Italy, Poland (up to 1939), Netherlands, Switzerland | X | X |
| F | General economic data for the USSR, Bulgaria, Poland, Czechoslovakia, Romania, Hungary, Yugoslavia | X | |
| Berlin | General economic data for West-Berlin | X | |
| Mitteldeutschland | General economic data for the German Democratic Republic (including East-Berlin) | X |
Each dataset is supported by an index table that facilitates quick and easy data searches. The index table provides information about the variables listed in a dataset, including time series frequency, time span, unit of measurement, author’s notes, and references to the ZU used to create the time series. Additionally, each time series in an index table is assigned a code linked to the actual data section, simplifying navigation between information and data sections within a dataset.[18]
Due to the suspension of the WB during the war and the immediate post-war years, no data is available for this period. Consequently, most datasets are divided into interwar and postwar periods. The datasets primarily cover Germany, including comprehensive coverage for West Berlin and the GDR, but also include some data for other countries (see Table 1).
Most time series are available at monthly and, to a lesser extent, quarterly frequencies. Additionally, based on the ZU series of the “Wochenzahlen” (weekly figures) published from 1928 to 1961, we digitized a significant number of high-frequency weekly time series for various economic areas, primarily covering Germany, but also including data for Great Britain and the United States. Weekly time series are rare in historical economic research today, yet they allow for more detailed and sophisticated analysis that less frequent data may obscure. Thus, the higher granularity of weekly time series can provide new insights into short-term reactions of economic and financial markets, such as responses to crises, policy changes, sectoral dynamics, consumer behavior shifts, and financial market volatility.
To ensure long-term usability for various research interests, each dataset is accompanied by data documentation. This documentation, also accessible through the database, provides descriptive information on the data and the preparation process, as well as historical context for many variables, including explanations of survey and calculation methods (and their revisions), historical terminology, units of measurement, and currencies.
5 Conclusions
The historical WB (1928–1968) is an impressive collection of economic information. The digital processing of these records has significantly facilitated access to this important source for historical research in economics and social sciences, while also expanding the availability of historical economic data. The digitized data encompass pivotal periods in German and international economic history, providing a framework for investigating significant research questions relevant to understanding both historical contexts and current economic, political, and social challenges.
Historical economic texts on German and international economic developments are now available in full text, searchable using various criteria in both German and English. OCR recognition not only enables full-text search but also allows further processing using digital methods such as text mining, providing new impetus for the application of these approaches in economics and economic history.
Additionally, long and consistent time series were digitized from the regularly attached ZU, significantly enhancing the availability of macroeconomic and macro-financial data for the interwar and postwar periods. A source-oriented approach ensures these data are broadly applicable, supporting comparative analyses, long-term trend investigations, studies on political and economic interactions, international trade relations, and the effects of economic policies. In particular, the provision of weekly time series opens new possibilities for long-term macroeconomic and economic historical research.
From a technical perspective, an innovative approach has been developed for the time- and cost-efficient digitization and transcription of large volumes of printed data from complex table formats. This approach is expected to benefit future digitization projects, making more relevant historical data sources digitally accessible.[19]
WBdigital represents an important first step by DIW Berlin’s Research Infrastructure Department in providing digital access to historical research data. In the future, further relevant data sources from DIW Berlin’s historical archives, such as the Vierteljahrshefte zur Konjunkturforschung, may also be digitized, thereby creating a comprehensive and permanent digital infrastructure for historical economic data at DIW Berlin.
Funding source: Deutsche Forschungsgemeinschaft
Award Identifier / Grant number: 491276359
Acknowledgements
We would like to express our gratitude to Ute Figgel-Dietrich, Katharina Zschuppe, Holger Piper, Thomas Pilger, Erfan Rasoul Zadegan, and Paul Kirch for their valuable assistance.
References
Abramitzky, Ran. 2015. Economics and the Modern Economic Historian. 21636. NBER Working Papers. Cambridge: National Bureau of Economic Research.10.3386/w21636Suche in Google Scholar
Buchheim, Christoph. 2003. “Die Erholung von Der Weltwirtschaftskrise 1932/33 in Deutschland.” Jahrbuch Für Wirtschaftsgeschichte/Economic History Yearbook 44 (1). https://doi.org/10.1524/jbwg.2003.44.1.13.Suche in Google Scholar
Buchheim, Christoph. 2008. “Das NS-Regime Und Die Überwindung Der Weltwirtschaftskrise in Deutschland.” Vierteljahrshefte Für Zeitgeschichte 56 (3): 381–414. https://doi.org/10.1524/vfzg.2008.0017.Suche in Google Scholar
Cantoni, Davide, and Noam Yuchtman. 2021. “Historical Natural Experiments: Bridging Economics and Economic History.” In The Handbook of Historical Economics, 213–41. London, San Diego, Cambridge, Oxford: Elsevier.10.1016/B978-0-12-815874-6.00016-2Suche in Google Scholar
Costache, Brindusa, Kalina Dimitrova, and Sophia, M. Lazaretou. 2015. “South-Eastern European Monetary and Economic Statistics from the Nineteenth Century to WWII.” eabh Papers 15-02. The European Association for Banking and Financial History (EABH).Suche in Google Scholar
Dimsdale, Nicholas, Nicholas Horsewood, and Arthur Van, Riel. 2004. “Real Wages and Unemployment in Weimar Germany.” Oxford Economic and Social History Working Papers 056. Oxford: University of Oxford, Department of Economics.Suche in Google Scholar
Fremdling, Rainer. 2010. “German Agricultural Employment, Production and Labour Productivity: A New Benchmark for 1936 and a Note on Hoffmann’s Tales.” Jahrbuch Für Wirtschaftsgeschichte/Economic History Yearbook 51 (1): 215–28. https://doi.org/10.1524/jbwg.2010.51.1.215.Suche in Google Scholar
Fremdling, Rainer, and Reiner Stäglin. 2008. “Profund, Präzise, Pünktlich: 80 Jahre Wochenbericht Spiegeln Die Deutsche Wirtschaftsgeschichte.” DIW-Wochenbericht 75 (14): 168–74.Suche in Google Scholar
Harvey, Charles, and Jon Press. 1996. Databases in Historical Research. London: Macmillan Education UK.10.1007/978-1-349-24392-1Suche in Google Scholar
Hesse, Jan-Otmar. 2017. “Verborgene Schätze der Wirtschaftsgeschichte.” Fazit – Das Wirtschaftsblog (blog). https://blogs.faz.net/fazit/2017/11/23/nicht-geborgene-schaetze-der-wirtschaftsgeschichte-9379/#comments (accessed November 23, 2017).Suche in Google Scholar
Kempf, Sebastian, Markus Krug, and Frank Puppe. 2023. “KIETA: Key-Insight Extraction from Scientific Tables.” Applied Intelligence 53 (8): 9513–30. https://doi.org/10.1007/s10489-022-03957-8.Suche in Google Scholar
Krengel, Rolf. 1986. Das Deutsche Institut Für Wirtschaftsforschung (Institut Für Konjunkturforschung), 1925–79. Berlin: Duncker & Humblot.10.3790/978-3-428-46074-8Suche in Google Scholar
Nunn, Nathan. 2009. “The Importance of History for Economic Development.” Annual Review of Economics 1 (1): 65–92. https://doi.org/10.1146/annurev.economics.050708.143336.Suche in Google Scholar
Ritschl, Albrecht. 1992. “Über Die Höhe Und Struktur der Gesamtwirtschaftlichen Investitionen in Deutschland 1935–38.” Vierteljahrschrift Für Sozial- Und Wirtschaftsgeschichte 79 (2): 156–76.Suche in Google Scholar
Spoerer, M. 1997. “Weimar’s Investment and Growth Record in Intertemporal and International Perspective.” European Review of Economic History 1 (3): 271–97. https://doi.org/10.1017/S1361491697000130.Suche in Google Scholar
Tooze, J. Adam. 2001. Statistics and the German State, 1900–1945: The Making of Modern Economic Knowledge. Cambridge Studies in Modern Economic History 9. Cambridge: Cambridge University Press.Suche in Google Scholar
Tooze, J. Adam. 2017. “Wirtschaftsstatistik Im Reichswirtschaftsministerium, in Seinem Statistischen Reichsamt Und Im Institut Für Konjunkturforschung.” In Wirtschaftspolitik in Deutschland 1917–1990. 1st ed. 361–420. Boston: Walter de Gruyter.10.1515/9783110465266-007Suche in Google Scholar
© 2024 the author(s), published by De Gruyter, Berlin/Boston
This work is licensed under the Creative Commons Attribution 4.0 International License.
Artikel in diesem Heft
- Frontmatter
- Editorial
- Editorial – Special Issue on “Central Bank Digital Currency”
- Special Issue Articles
- Public Use and Distribution of Retail CBDC: An Evidence from Thailand’s Retail CBDC Pilot Program
- Simulating the Adoption of a Retail CBDC
- CBDC and the Banking System
- Banking Crises Under a Central Bank Digital Currency (CBDC)
- Monetary Policy Transmission, Central Bank Digital Currency, and Bank Market Power
- Data Observer
- The WBdigital Database: A Digital Repository for the Historical DIW-Wochenbericht, 1928–1968
- The IZA/Fable Swipe Consumption Index