Public Use and Distribution of Retail CBDC: An Evidence from Thailand’s Retail CBDC Pilot Program
-
Nuntapun Bhensook
 und
Pakaporn Tohwisessuk
und
Pakaporn Tohwisessuk

Abstract
This paper analyzes the public use of Retail Central Bank Digital Currency (rCBDC) during a pilot program in Thailand. For the first time, it utilizes detailed transactional data, including demographic information of users from a real-world rCBDC pilot. The study empirically examines the behavior of financial service providers (FSPs), individual users, and merchant users in adopting rCBDC for retail payments. The analysis also explores demographic factors and the impact of reward mechanisms on the adoption of rCBDC. Additionally, the paper assesses the effectiveness of a hybrid rCBDC architecture for distributing rCBDC through network topology and empirical analysis. Findings indicate that FSPs manage their rCBDC holdings and liquidity by adjusting redemptions but do not adjust issuances in response to retail payments. Retail users, on the other hand, tend to use rCBDC as a payment method, with usage positively correlated with user age and reward incentives. Regarding the distribution of rCBDC, the network topology analysis indicates that the hybrid architecture tested in this pilot creates a less connected network. rCBDC is distributed sparsely and slowly within the network, relying heavily on a few key FSPs. This suggests the current distribution model is limited in effectiveness and could be improved. These findings provide policy insights, recommending an increase in the number of FSPs in the system, enabling a wider range of business models for FSPs, and introducing new rCBDC use cases across more FSPs, along with targeted measures to enhance rCBDC adoption.
1 Introduction
Central banks have been heavily involved in the research and development of Central Bank Digital Currencies (CBDCs). According to a 2023 BIS survey, 93 % of central banks are engaged in CBDC projects at various stages of development. The motivations driving these efforts differ based on country-specific contexts and objectives, such as preserving financial stability, promoting financial inclusion, and enhancing payment efficiency and security. However, as CBDC development is still in its early stages, only a small number of central banks have undertaken real-value CBDC pilots or full-scale launches. Most existing research on CBDC, especially retail CBDC (rCBDC), has focused primarily on theoretical frameworks. There is a scarcity of empirical studies that examine real-world rCBDC pilots, particularly those involving public use, user behavior related to rCBDC adoption, and the distribution of rCBDC. Addressing these gaps with empirical data would contribute significantly to both academic discussions and policy decisions, shedding light on design choices and mechanisms that could encourage user adoption and improve the efficiency of rCBDC distribution.
Thus, this study addresses a gap in existing research by providing an empirical analysis of the key considerations in public usage and distribution of retail CBDC (rCBDC), based on the rCBDC pilot conducted in Thailand. The Bank of Thailand developed and carried out a real-value transaction pilot test on rCBDC from late-2022 to September 2023. The pilot involved a wide range of participants, including individual users, merchants, financial service providers (FSPs), and the Central Bank of Thailand. The distribution model in the pilot was based on a hybrid CBDC architecture, where the CBDC is issued as a direct claim on the central bank, while financial service providers handle payments and facilitate the distribution of rCBDC. The scope of rCBDC usage in this pilot included top-ups, withdrawals, payments, and transfers conducted using rCBDC.
To contribute to the empirical study of rCBDC, this paper utilizes a dataset obtained from the rCBDC operating system, covering the entire pilot test period. For the first time, this comprehensive dataset allows us to analyze public use of rCBDC across different player types, transaction types, and throughout the duration of the pilot. It provides valuable empirical insights into user and financial service provider (FSP) behavior, rCBDC adoption, and distribution within the hybrid rCBDC architecture. The dataset has two unique features: (1) Coverage – it includes all players and transactions involved in the rCBDC system, spanning the full duration of the pilot, and (2) Granularity – it contains transaction-level data, categorized by player types and demographic attributes.
This work makes several important contributions to the existing research. First, it is the first paper to empirically and comprehensively analyze rCBDC, including rCBDC usage, player behavior, and demographic attributes of users in relation to rCBDC adoption. While most existing research on rCBDC is primarily theoretical, this study provides real-world empirical insights. Second, it is the first to examine the network topology and conduct an empirical analysis of rCBDC networks, addressing key questions about the effectiveness of the hybrid CBDC architecture in terms of distribution, the extent of rCBDC usage, and the systemic characteristics of the network. Additionally, this paper offers a discussion on network analysis of a new payment system based on the rCBDC pilot, contrasting with existing research, which mainly focuses on traditional payment systems.
Taken together, these analyses aim to address key questions regarding the public use of rCBDC, including the extent of its usage, player behavior and adoption patterns, and the distribution of rCBDC. By addressing these issues, the study contributes to academic and policy discussions on the design choices and mechanisms that could promote user adoption and improve the efficiency of rCBDC distribution.
Our findings can be summarized as follows. First, we document the diverse behavior of different players in relation to rCBDC usage during the pilot. For financial service providers (FSPs), we observe that they manage rCBDC holdings and liquidity through their redemptions but not adjusting issuance in response to retail payment transactions. A possible explanation for this is that FSPs may initially issue rCBDC with a high holding balance to cushion against future demand uncertainty. They then gradually adjust their rCBDC holdings by redeeming rCBDC based on the retail transaction activities observed in the previous period.
From the user perspective, we find that rCBDC is used across various transaction types, including Peer-to-Peer, Business-to-Consumer, and Business-to-Business. However, users primarily adopt rCBDC as an additional means of payment for daily consumption, rather than as a store of value. We also provide evidence that the decision to top-up rCBDC is influenced by previous demand for withdrawal and payment. While transfer of rCBDC in the prior period does not cause any types of transaction involving rCBDC. Additionally, we observe that rCBDC payment behavior is closely linked to the demographic attributes of individual users. Furthermore, we find that a reward program has a positive effect on the adoption of rCBDC.
Second, we provide evidence of the effectiveness of a hybrid rCBDC architecture in terms of rCBDC distribution, usage extent, and systemic characteristics within the network by examining the network topology of rCBDC. Our findings indicate that the hybrid rCBDC architecture employed in this pilot setting leads to a less connected network, where rCBDC is sparsely and slowly distributed, heavily relying on a few key financial service providers (FSPs) for distribution. Additionally, the rCBDC network appears to follow a scale-free structure, meaning that most users engage in transactions with a small number of others, while a few FSPs manage transactions with a large number of users due to their intermediary role.
Within the rCBDC network, several clusters are identified, broadly classified by the different FSPs that have transactional relationships with those clusters. Closer inspection reveals that subclusters are also formed based on the nature of payment transactions (on-us and off-us payment transactions[1]). Nodes that are close to a particular node can transact with one another within a limited scope. Taken together, these results suggest that the usage and distribution of rCBDC have room for improvement. The study also informs policy considerations aimed at increasing the number of FSPs in the system, enabling a wider range of business models for FSPs, and introducing new rCBDC use cases across more FSPs, along with targeted measures to boost rCBDC adoption.
1.1 Related Literature
This paper contributes to several strands of existing literature by providing an empirical and comprehensive analysis of the behavior of users and financial service providers (FSPs) in relation to rCBDC usage, adoption, and distribution under a hybrid rCBDC architecture for the first time. First, existing works have predominantly focused on theoretical analyses of rCBDC, particularly regarding its implications for monetary transmission mechanisms, financial stability, financial inclusion, and liquidity risk (e.g. Ahnert et al. 2023; Chucherd et al. 2021; Das et al. 2023; Infante et al. 2023; Tan 2023). In contrast, empirical analyses of rCBDC concerning public usage, adoption, and distribution remain scarce, largely due to the limited number of countries that have launched rCBDC for public use. Despite these limitations, some research has been conducted using survey methods to examine user adoption of rCBDC, as well as user behavior influenced by demographic attributes and other determinants (e.g. Bijlsma et al. 2021; Choi, Kim, and Kim 2023; Hu, Wu, and Yang 2022; Kiff et al. 2020; Kosse and Mattei 2023; Morales-Resendiz et al. 2021; Xia, Gao, and Zhang 2023).
Adding to these studies, we utilize transactional data from the rCBDC pilot in Thailand to investigate the behavior of different players in relation to rCBDC usage, adoption, and the effects of demographic and reward factors on rCBDC utilization, employing a simple OLS estimation. Furthermore, we examine the intertemporal relationships between heterogeneous types of transactions using VAR frameworks. By analyzing the behavior of players involved in rCBDC payments, this paper contributes to the growing body of literature that primarily focuses on traditional payment methods (e.g. cash and electronic payments). For instance, Schmidt (2014) analyzes consumer behavior in using cash and digital payments in Germany through payment survey data. Similarly, Caddy (2019) conducted a consumer payments survey in Australia to explore the payment behaviors of retail users. In contrast to these survey-based studies, we leverage recorded transactional payment data from rCBDC, providing real insights into player behavior and intertemporal relationships.
Second, our paper contributes to previous studies by using transactional data from the rCBDC pilot in Thailand to examine network topology and conduct an empirical analysis of the network within the context of the hybrid rCBDC architecture, which is documented by Auer and Böhme (2020) as the preferred model among rCBDC architectures. In a hybrid rCBDC architecture, the central bank acts as the issuer while the private sector serves as the distributor. This study addresses important research gaps by empirically evaluating the effectiveness of this specific rCBDC architecture in terms of distribution efficiency, the extent of rCBDC usage among users, and the systemic characteristics of the network. Existing research suggests that a hybrid rCBDC architecture can facilitate efficient distribution and operational management (e.g. Alfonso, Kamin, and Zampolli 2023; Lee, Shin, and Zheng 2023; World Bank Group 2021). However, most of these studies provide only conceptual evaluations with limited empirical evidence. Additionally, our research contributes to the network analysis of retail payments, as existing literature primarily focuses on the network topology of large-value and interbank payment flows in countries such as the United States, the UK, Canada, and Austria (e.g. Becher, Millard, and Soramäki 2008; Boss et al. 2008; Embree and Roberts 2009; Soramäki et al. 2007). To examine the network topology and conduct an empirical analysis of the rCBDC payment network using transactional data, we build on the network study conducted by Civilize and Ananchotikul (2018), who utilized similar transactional data in the context of foreign exchange.
This paper is structured as follows: Section 2 briefly outlines the scope of the rCBDC pilot program in Thailand, introduces the dataset, and provides descriptive statistics of transactions within the rCBDC ecosystem. Section 3 presents the empirical framework and examines the intertemporal relationships among different transaction types, as well as players’ behavior and adoption of rCBDC. Section 4 analyzes the network topology and conducts an empirical study of the rCBDC network. Finally, Section 5 concludes with a discussion and offers policy recommendations.
2 rCBDC Pilot Program and Data
2.1 rCBDC (rCBDC) Pilot Program
The Bank of Thailand (BOT) initiated the rCBDC pilot program in 2022 and successfully completed the pilot test in 2023. The primary objective was to assess the capabilities of the rCBDC infrastructure for retail payments intended for public use and to support the development of innovations in the financial sector, such as payment programmability. The rCBDC pilot program is based on a hybrid rCBDC architecture, where the central bank serves as the sole issuer and verifier of rCBDC transactions, while financial service providers (FSPs) play a vital role in distributing rCBDC and managing users’ wallets. Users can top up their rCBDC accounts to make payments to merchants and transfer funds to one another. Additionally, they can redeem rCBDC for deposits via mobile banking. The pilot test, which involved real-value transactions, spanned from February 2023 to September 2023 and included three FSPs: two commercial banks and one non-bank entity. In total, 4,128 individual users and 144 merchant users participated in the pilot program. Those individuals’ users and merchants are selected by their respective FSPs. The tested payment transactions included retail transfers among individuals (Peer-to-Peer), retail payments to merchants for purchasing goods and services (Business-to-Consumer), and retail payments between merchants for acquiring raw materials (Business-to-Business). Further details on the retail CBDC pilot program can be found in the “Retail CBDC Pilot Program – Conclusion Report” by the Bank of Thailand (2024).
2.2 Transactional Data from the rCBDC Pilot
We utilize a transactional dataset that tracks the frequency and value of rCBDC transactions in Thailand across various participants, including the central bank, financial service providers (FSPs), merchants, and individual users. These transactions encompass issuance, redemption, top-ups, withdrawals, payments, and transfers, covering the entire duration of the rCBDC pilot from February 2023 to September 2023. The dataset also includes demographic attributes for individual users, such as age and gender. Additionally, the pilot program was broadly divided into two periods based on the rewards provided.
To obtain this dataset, we extracted data from the rCBDC operating system managed by the Bank of Thailand (BOT). This dataset contributes to the existing study of rCBDC in three key aspects: First, it includes all executed real-value rCBDC transactions in Thailand – such as issuance, redemption, top-ups, withdrawals, payments, and transfers – providing a holistic perspective of the rCBDC ecosystem. Second, the dataset contains transaction-level details that are disaggregated by different types of participants, including the central bank, financial service providers (FSPs) (i.e. commercial banks and non-banks), merchants, and individual users, along with demographic attributes. This adds a more granular perspective to the analysis. Third, based on the real-value transactions from the pilot test, the data represents rCBDC transactions among different players and across various transaction types in retail payments, specifically: (1) Peer-to-Peer transactions among individual users, (2) Business-to-Consumer transactions between users and merchants, and (3) Business-to-Business transactions among merchants. Collectively, this dataset will be utilized to study rCBDC in a comprehensive manner.
To investigate the intertemporal relationships among different transaction types related to rCBDC, we construct aggregated values for the following transaction types: issuance, redemption, top-up, withdrawal, payment, and transfer. We aggregate the transaction values on both a daily and weekly basis to analyze various time horizons for wholesale transactions (i.e. issuance and redemption) and retail transactions (i.e. top-up, withdrawal, transfer, and payment).
For each transaction type j, we calculate aggregated measures for period k (both daily and weekly) by summing the values across all transactions i.
where
To examine the behavior of individual users and their demographic attributes in relation to the adoption of rCBDC usage, we construct aggregated values for CBDC transfers and payments for each individual user. This is done by summing the transaction values of transfers and payments for each user over the entire duration of the pilot testing.
For each transaction type j, we construct the aggregated value for each individual user i over the entire duration of the pilot testing.
where
2.3 Descriptive Statistics
Table 1 provides an overview of the participants in the rCBDC pilot, categorized by different types of players, including the central bank, commercial banks, non-banks, individual users, and merchants.
Overview of player types in the rCBDC pilot.
| Player types | Number of players | Number of wallets |
|---|---|---|
| Central bank | 1 | 6 |
| Financial service providers Commercial banks Non-bank |
3 2 1 |
3 2 1 |
| Individual users | 4,128 | 4,166 |
| Merchant users | 144 | 140 |
-
This table provides an overview of the player types in the rCBDC ecosystem, including central banks, financial service providers (FSPs), individuals, and merchants. It reports the total number of players across these categories for the sample period from February 6, 2023, to September 8, 2023.
In the pilot setting (Table 1), three financial service providers (FSPs) were selected for inclusion in the rCBDC pilot, comprising two commercial banks and one non-bank. A total of 4,128 whitelisted individuals participated in the pilot. However, a total number of individual user wallet was at 4,166 as some individual users may hold multiple wallets with different FSPs. Additionally, 144 merchants were onboarded to the rCBDC pilot to sell goods and services using rCBDC. In contrast, the number of merchant user wallets was 140, since some small merchant users do not register as business entities and are simply individuals selling goods and services. These merchants typically use individual user wallets for two purposes: receiving payment for their sales in their role as merchants and making payments and transfers in their role as individuals.
In the pilot test, there were two categories of transactions: wholesale and retail. Wholesale transactions refer to those conducted between the central bank and financial service providers (FSPs), including the issuance and redemption of rCBDC. In contrast, retail transactions involve individuals and merchants and include top-ups, withdrawals, transfers, and payments using rCBDC (Table 2). For wholesale transactions, the total amount of rCBDC issued and redeemed was 2.16 million THB (62,645.01 USD) throughout the pilot period. This was necessary to ensure that the net balance of rCBDC was zero at the end of the pilot. On average, the issuance amount per transaction was 196,363.60 THB (5,695 USD), while the redemption amount was 154,285.70 THB (4,474.64 USD). This indicates that FSPs were more active in conducting redemptions, with 14 redemption transactions compared to 11 issuance transactions. In comparison, the total amount of retail transactions was roughly twice that of wholesale transactions. Among retail transactions, the total top-ups and withdrawals of rCBDC amounted to 3.85 million THB (111,795.88 USD) and 3.96 million THB (114,775.29 USD), respectively. Meanwhile, total payments and transfers made by individuals and merchants were 1.72 million THB (49,819 USD) and 2.77 million THB (80,340.31 USD), respectively, summing to a total of 4.49 million THB (130,159.31 USD).
Summary statistics of transactions across different types of transactions in the rCBDC pilot.
| Issuance | Redemption | Top-up | Withdrawal | Transfer | Payment | |
|---|---|---|---|---|---|---|
| Obs. | 11 | 14 | 16,184 | 7,640 | 1,156 | 44,134 |
| Sum | 2,160,000.00 (62,645.01) | 2,160,000.00 (62,645.01) | 3,854,722.00 (111,795.88) | 3,957,452.00 (114,775.29) | 1,717,759.00 (49,819.00) | 2,770,134.00 (80,340.31) |
| Mean | 196,363.60 (5,695.00) | 154,285.70 (4,474.64) | 238.18 (6.91) | 517.99 (15.02) | 148.58 (4.31) | 62.77 (1.82) |
| Median | 100,000.00 (2,900.23) | 47,048.18 (1,364.51) | 100.00 (2.90) | 100.00 (2.90) | 50.00 (1.45) | 50.00 (1.45) |
| Min. | 10,000.00 (290.02) | 1,000.00 (29.00) | 0.01 (0.00) | 0.01 (0.00) | 0.01 (0.00) | 0.01 (0.00) |
| Max. | 500,000.00 (14,501.16) | 1,183,111.00 (34,312.96) | 20,000.00 (580.05) | 100,000.00 (2,900.23) | 96,416.00 (2,796.29) | 8,700.00 (252.32) |
| Std. Dev. | 169,839.50 (4,925.74) | 312,711.40 (9,069.36) | 434.48 (12.60) | 3,316.41 (96.18) | 1,027.47 (29.80) | 97.53 (2.83) |
| Skewness | 2.53 | 2.82 | 19.01 | 21.23 | 73.62 | 26.03 |
| Kurtosis | 0.94 | 9.75 | 651.82 | 525.79 | 6,702.84 | 1,638.57 |
-
This table presents summary statistics for transactions across various types in the rCBDC system, including issuance, redemption, top-up, withdrawal, transfer, and payment. It includes the total number of observations, the sum, mean (and median), minimum, maximum, standard deviation, skewness, and kurtosis. Values are displayed in Thai Baht (THB) and US Dollars (USD), with USD values shown in parentheses. The sample period spans from February 6, 2023, to September 8, 2023.
The implied velocity of rCBDC is approximately 2.07, calculated by dividing the total issuance by the total amount of transfers and payments. This velocity is relatively low compared to the velocity of M1, which was 5.9 in 2021. The observed low velocity of rCBDC can be attributed to the limited scope of its usage. For instance, rCBDC can only be used during operating hours from 6 AM to 10 PM and exclusively with pre-determined merchants that participated in the rCBDC pilot. On average, individuals and merchants withdrew 518 THB (15.02 USD) per transaction, which is twice the average value of top-ups, recorded at 238 THB (6.91 USD) per transaction. In terms of usage, individuals primarily employed rCBDC as a means of payment for everyday consumption. This is reflected in the total number of transactions, which reached 44,134, with an average payment amount of 62.77 THB (1.82 USD) – approximately the cost of a meal or drink in Thailand. Similarly, the median payment value was 50 THB (1.45 USD, which aligns with the average cost of a meal of or drink, often priced at round numbers. In this pilot, most merchants were restaurants and coffee shops, where individual users could make payments using rCBDC. In contrast, the average transfer amount per transaction was 148.58 THB (4.31 USD), with a total of 11,561 transactions recorded during the entire testing period.
From a time-series perspective (Table 3), there were 182 transacting days covering the sample period from February 6, 2023, to September 8, 2023. For wholesale transactions, the average daily amounts for issuance and redemption were 11,868.13 THB (344.20 USD). In terms of retail transactions, the average daily amounts for top-ups and withdrawals were approximately 21,179.79 THB (614.26 USD) and 21,744.24 THB (630.63 USD), respectively. Meanwhile, the average amounts for transfers and payments were 9,438.24 THB (273.73 USD) and 15,220.52 THB (441.43 USD), respectively. A preliminary analysis of the correlations among different types of rCBDC transactions is provided in Table 4. We observe a strong positive contemporaneous relationship between top-ups and payments, as well as between top-ups and transfers. Similarly, a strong positive relationship exists between transfers and payments. These findings suggest that individuals and merchants are more likely to use rCBDC as a means of payment rather than as a store of value. Further investigation will be conducted in the empirical analysis.
Summary statistics of daily measures of different types of transactions in the rCBDC pilot.
| Issuance | Redemption | Top-up | Withdrawal | Transfer | Payment | |
|---|---|---|---|---|---|---|
| Obs. | 182 | 182 | 182 | 182 | 182 | 182 |
| Sum | 2,160,000.00 (62,645.01) | 2,160,000.00 (62,645.01) | 3,854,722.00 (111,795.88) | 3,957,452.00 (114,775.29) | 1,717,759.00 (49,819.00) | 2,770,134.00 (80,340.31) |
| Mean | 11,868.13 (344.20) | 11,868.13 (344.20) | 21,179.79 (614.26) | 21,744.24 (630.63) | 9,438.24 (273.73) | 15,220.52 (441.43) |
| Median | 0.00 (0.00) | 0.00 (0.00) | 4,520.01 (131.09) | 5,444.50 (157.90) | 2,031.90 (58.93) | 1,016.85 (29.49) |
| Min. | 0.00 (0.00) | 0.00 (0.00) | 0.00 (0.00) | 0.00 (0.00) | 0.00 (0.00) | 0.00 (0.00) |
| Max. | 50,000.00 (1,450.12) | 1,557,904.00 (45,182.83) | 151,639.00 (4,397.88) | 237,622.30 (6,891.60) | 126,343.00 (3,664.24) | 78,220.03 (2,268.56) |
| Std. Dev. | 68,000.85 (1,972.18) | 116,745.10 (3,385.88) | 29,400.16 (852.67) | 37,241.85 (1,080.10) | 14,219.38 (412.40) | 22,440.33 (650.82) |
| Skewness | 6.44 | 12.89 | 1.69 | 3.04 | 3.61 | 1.25 |
| Kurtosis | 45.01 | 170.90 | 5.97 | 14.07 | 26.76 | 3.13 |
-
This table provides summary statistics of daily measures for various types of transactions in the rCBDC pilot, including issuance, redemption, top-up, withdrawal, transfer, and payment. The reported metrics include total observations, sum, mean (and median), minimum, maximum, standard deviation, skewness, and kurtosis. Values are presented in Thai Baht (THB) and US Dollars (USD), with USD values indicated in parentheses. The sample period extends from February 6, 2023, to September 8, 2023.
Correlation across different types of transactions by value in rCBDC.
| Issuance | Redemption | Top-up | Withdrawal | Transfer | Payment | |
|---|---|---|---|---|---|---|
| Issuance | 1.00 | |||||
| Redemption | −0.02 | 1.00 | ||||
| Top-up | −0.05 | 0.18 | 1.00 | |||
| Withdrawal | 0.00 | −0.04 | 0.41 | 1.00 | ||
| Transfer | −0.04 | 0.02 | 0.72 | 0.58 | 1.00 | |
| Payment | −0.04 | −0.03 | 0.88 | 0.52 | 0.75 | 1.00 |
-
This table presents pairwise correlations among various types of transactions in the rCBDC system, based on daily measures: issuance, redemption, top-up, withdrawal, transfer, and payment. The total number of observations for each pair is also reported. The sample period covers February 6, 2023, to September 8, 2023.
These analyses aim to address important questions regarding the public use of rCBDC, including the extent of its usage, players’ behaviors and adoption patterns, and the distribution mechanisms in place. By exploring these issues, we contribute to academic and policy discussions about design choices and mechanisms that could promote user adoption and enhance the efficiency of rCBDC distribution.
Regarding the demographic characteristics of individual users participating in the rCBDC pilot, we summarize the number of users categorized by gender and age groups, using data from the two commercial banks, as non-banks do not collect demographic information. As shown in Table 5, there were 2,347 females and 1,472 males involved in the rCBDC pilot. The age group of 35–44 years had the highest representation, comprising 36.95 % of the total individual users, while those aged 65 and above accounted for only 0.26 % of the total individual users.
Demographic characteristics of individual users in the rCBDC pilot.
| Characteristics | Frequency | Percentage (%) |
|---|---|---|
| Gender | ||
| Female | 2,347 | 61.46 |
| Male | 1,472 | 38.54 |
| Age | ||
| 18–24 | 45 | 1.18 |
| 25–34 | 783 | 20.50 |
| 35–44 | 1,411 | 36.95 |
| 45–54 | 1,236 | 32.36 |
| 55–64 | 334 | 8.75 |
| 65 or above | 10 | 0.26 |
-
This table presents the number and proportion of individual users categorized by demographic characteristics, including gender and age group. The sample includes only individual users who have wallet accounts with commercial banks. The data covers the period from February 6, 2023, to September 8, 2023.
3 Empirical Analysis
3.1 Intertemporal Analysis of Behavior and Relationships Among Players
To examine the behavior and relationships among different types of players involved in rCBDC, we apply a vector autoregression (VAR) model, proposed by Stock and Watson 2001. We also conduct Granger causality tests. These methods enable us to analyze the intertemporal relationships among various transactions executed by different players during the rCBDC pilot. Specifically, we investigate the lag-lead relationships between wholesale transactions related to financial service providers (FSPs), such as issuance and redemption, and retail transactions involving individual users and merchants. Additionally, we explore the relationships among retail transactions, including top-ups, withdrawals, transfers, and payments.
3.1.1 VAR Setup for all Types of Transactions Involving rCBDC
To analyze the intertemporal relationships among variables related to rCBDC transactions, we assess the connections among different types of rCBDC transactions – specifically issuance, redemption, top-up, withdrawal, transfer, and payment – by their value in Thai Baht (THB) on a weekly basis. This analysis is conducted within a vector autoregression (VAR) framework, where.
With the transactions aggregated by type, the VAR specification can be expressed as follows:
We estimate the VAR model, which includes all rCBDC transactions represented in y t , a 6 × 1 vector at week t, where yt-j are lagged variables up to p lags.
The VAR estimations are summarized in Table 6, while the results of the Granger causality tests are presented in Table 7. For selecting the lags used in the VAR regression, we employ the Bayesian Information Criterion (BIC) as the determining criterion.
VAR estimation of all types of transactions involving rCBDC.
| Issuance t | Redemption t | |
|---|---|---|
|
Issuance
t-1
Issuance t-2 Issuance t-3 Issuance t-4 |
2.04 (1.57) 3.44 (1.21) 2.42 (1.42) 2.66 (1.98) |
0.59a (2.31) 2.01 (3.57) 0.64 (1.90) 1.40b (5.28) |
|
Redemption
t-1
Redemption t-2 Redemption t-3 Redemption t-4 |
−2.07 (−1.68) 0.90 (0.83) −3.89a (−2.94) −3.34 (−2.42) |
−0.67 (−2.73) −1.04b (−4.89) −1.27b (−4.86) −1.49b (−5.43) |
| Top-upt-1 Top-upt-2 Top-upt-3 Top-upt-4 |
−1.32 (−2.09) −1.82 (−0.46) −4.65 (−2.42) −9.97 (−1.72) |
−1.18b (−9.48) −2.55b (−3.25) −0.23 (−0.60) −5.73b (−4.98) |
|
Withdrawal
t-1
Withdrawal t-2 Withdrawal t-3 Withdrawal t-4 |
−2.94 (−0.86) 16.81a (2.79) −0.99 (−0.36) −13.17 (−1.38) |
1.98a (2.91) 5.84b (4.89) 1.98a (3.67) −7.50a (−3.97) |
|
Transfer
t-1
Transfer t-2 Transfer t-3 Transfer t-4 |
−2.06 (−2.05) −27.03 (−2.21) −1.09 (−0.42) 11.79 (1.40) |
−3.41c (−17.12) −10.25b (−4.23) −3.34b (−6.53) 8.21b (4.93) |
|
Payment
t-1
Payment t-2 Payment t-3 Payment t-4 |
3.64a (3.48) −3.72 (−0.67) 1.23 (0.39) 29.05 (1.36) |
0.74a (3.57) 0.73 (0.67) −2.76b (−4.38) 14.52b (3.44) |
-
This table presents the regression lagged coefficients from the VAR estimation of all types of transactions involving rCBDC. The VAR regression includes four lags, as determined by the Bayesian information criterion. The numbers in parentheses indicate t-statistics. The VAR estimates are based on weekly aggregated data covering the sample period from February 6, 2023, to September 8, 2023. Significance levels are indicated by a, b, and c for 10 %, 5 %, and 1 %, respectively.
VAR-based Granger Causality analysis of all types of transactions involving rCBDC.
| Restricted regressors | Dependent variables | |
|---|---|---|
| Issuance | Redemption | |
| Issuance | – | 55.75b |
| Redemption | 7.69 | – |
| Top-up | 10.54a | 46.21b |
| Withdrawal | 17.52a | 486.73c |
| Payment | 14.86a | 39.15b |
| Transfer | 5.71 | 151.69c |
-
This table presents the F-values of the Wald statistics from the Granger causality test based on the VAR estimation in Table 6. The dependent variables have been selectively reported in this table. The sample period is from February 6, 2023, to September 8, 2023. Significance levels are indicated by a, b, and c for 10 %, 5 %, and 1 %, respectively.
Table 6 presents the VAR estimations of the intertemporal relationships among various types of rCBDC transactions, shedding light on the behavior of financial service providers (FSPs) in managing rCBDC holdings and liquidity. Specifically, there is limited evidence that rCBDC issuance is significantly influenced by other transactions at any of the included lags (such as redemption, top-up, withdrawal, payment, and transfer). In contrast, rCBDC redemption is significantly influenced by other retail transactions across different lags, indicating that FSPs adjust their redemptions based on prior retail transactions. These findings suggest that while FSPs do not adjust their issuance of rCBDC according to past retail transactions, they do gradually adjust their rCBDC holdings through redemption in response to retail transactions. Specifically, the redemption of rCBDC is positively predicted by lagged top-up transactions, indicating that an increase in demand for top-ups leads FSPs to reduce their redemption amounts. Conversely, if the demand for withdrawals increases, FSPs respond by increasing the amount of redemption to convert rCBDC into deposits for their users. Additionally, we find that redemption is significantly and negatively affected by rCBDC transfers. When FSPs observe a high value of retail transactions, they tend to reduce the amount of redemption to accommodate the demand for transfers. A possible explanation for this behaviour is that FSPs may issue rCBDC upfront with a high holding balance to cushion against future demand uncertainty. They then gradually adjust their rCBDC holdings through redemptions based on previous retail transaction activities. Lastly, we observe no strong evidence regarding the relationship between redemption transactions conducted by FSPs and payments made by individual users.
Table 7 presents the VAR-based Granger causality results, highlighting the significance of intertemporal relationships among various types of rCBDC transactions. The findings support the VAR estimations, showing that redemption is significantly predicted by the lags of all retail transactions, particularly withdrawals and transfers. In contrast, there is no significant relationship between issuance and the lags of any retail transactions.
3.1.2 VAR Setup for Retail Transactions Involving rCBDC
We also examine the intertemporal relationships among various rCBDC transactions – including top-ups, withdrawals, transfers, and payments – by their value in THB on a daily basis within a VAR framework, where.
By aggregating transactions by type, the VAR specification can be expressed as follows:
We estimate a VAR model that includes all types of rCBDC transactions. Here y t is a 4 × 1 vector at day t, and yt-j represents the lagged variables up to p lags.
The VAR estimations are summarized in Table 8, while the results of the Granger causality tests are presented in Table 9. The selection of lags used in the VAR regression is determined based on the Bayesian Information Criterion (BIC).
VAR estimation of retail transactions involving rCBDC.
|
|
|
|
|
|
|---|---|---|---|---|
|
|
0.49c (3.84) | −0.16 (−0.89) | 0.11 (1.65) | 0.20b (2.44) |
|
|
−0.21c (−2.99) | 0.10 (1.01) | −0.10c(−2.95) | −0.18c (−3.95) |
|
|
−0.22 (−1.08) | 0.24 (0.83) | 0.00 (−0.05) | −0.13 (−1.01) |
|
|
0.44b (2.52) | 0.88c (3.58) | 0.30c (3.30) | 0.69c (6.03) |
-
This table presents the regression lagged coefficients from the VAR estimation of retail transactions involving rCBDC. The VAR regression includes one lags, as determined by the Bayesian information criterion. The numbers in parentheses indicate t-statistics. The VAR estimates are based on daily aggregated data covering the sample period from February 6, 2023, to September 8, 2023. Significance levels are denoted by a, b, and c for 10 %, 5 %, and 1 %, respectively.
VAR-based Granger causality for retail transactions involving rCBDC.
| Restricted regressors | Dependent variables | |||
|---|---|---|---|---|
| Top-up | Withdrawal | Transfer | Payment | |
| Top-up | – | 0.78 | 2.73 | 5.93b |
| Withdrawal | 8.93c | – | 8.71c | 15.59c |
| Transfer | 1.16 | 0.68 | – | 1.01 |
| Payment | 6.32b | 12.81c | 17.79c | – |
-
This table presents the F-values of the Wald statistics from the Granger-causality test based on the VAR estimation shown in Table 8. The dependent variables selected for this analysis are reported in the table. The sample period covers February 6, 2023, to September 8, 2023. Significance levels are indicated by a, b, and c for 10 %, 5 %, and 1 %, respectively.
Table 8 presents the VAR estimations of the intertemporal relationships among all rCBDC transactions, providing insights into the behavior of individual users and merchants in utilizing rCBDC. The findings align with the hypothesis that rCBDC is primarily used as a means of payment rather than a store of value, as holding rCBDC does not offer incentives (e.g. interest rates or other financial services) compared to traditional deposits. Specifically, individuals and merchants are likely to increase the amount of rCBDC they top up in their wallets when there is a higher demand for payments from the previous day. Conversely, the amount of rCBDC used for payments tends to rise in response to increased top-ups in prior days. Additionally, we observe that users are inclined to withdraw more from their wallets following payments received the previous day, indicating a tendency not to store rCBDC but rather to withdraw it for deposits in interest-earning accounts.
On the other hand, we find no evidence supporting a significant relationship between all rCBDC transactions and lagged transfers, as the transfer of rCBDC does not impact the total amount of rCBDC in circulation. Consequently, the aggregated demand for top-ups and withdrawals remains unaffected.
Table 9 shows the results of the VAR-based Granger causality tests, highlighting the significance of intertemporal relationships among all types of rCBDC transactions. The results confirm that top-ups and withdrawals of rCBDC are significantly influenced by lagged payments, while they are not significantly influenced by lagged transfers.
3.2 Analysis of User Behavior, Demographics and Adoption of rCBDC
To gain empirical insights into the public use of rCBDC, we analyze users’ spending and saving behaviors, examine the relationship between users’ demographic attributes and their rCBDC usage, and investigate the effects of incentive schemes on rCBDC adoption. Summary statistics and regression analysis are presented to support this assessment.
3.2.1 User Behavior Regarding rCBDC
Understanding user behavior and preferences regarding rCBDC is crucial for formulating effective policies and designing the rCBDC for public use. Therefore, we empirically investigate spending and saving behaviors related to rCBDC, focusing on usage by different transaction types and the value of transactions across various transactions. This analysis is detailed in Tables 10 and 11.
Summary statistics of business transaction types in the rCBDC pilot.
| Peer-to-peer | Business-to-consumer | Business-to-business | |
|---|---|---|---|
| Obs. | 12,356 | 42,802 | 1,522 |
| Sum | 1,283,655 (37,229) | 2,720,494 (78,901) | 812,302 (23,559) |
| Mean | 103.89 (3.01) | 63.56 (1.84) | 533.71 (15.48) |
| Median | 50 (1.45) | 50 (1.45) | 305 (8.85) |
| Min. | 0.01 (0.00) | 0.01 (0.00) | 0.01 (0.00) |
| Max. | 20,000 (580.05) | 13,536 (392.58) | 96,416 (2,796.29) |
| Std. Dev. | 423.32 (12.28) | 120.89 (3.51) | 2,596.38 (75.30) |
| Skewness | 28.84 | 48.11 | 33.46 |
| Kurtosis | 1,161.47 | 4,387.21 | 1,225.29 |
-
This table presents summary statistics for the value amounts of different business transaction types in the rCBDC system, including peer-to-peer, business-to-consumer, and business-to-business transactions. The reported statistics include total observations, sum, mean (and median), minimum, maximum, standard deviation, skewness, and kurtosis. The sample period is from February 6, 2023, to September 8, 2023.
Time duration of transactions occurrence across different types of transactions in the rCBDC pilot.
| Issuance | Redemption | Top-up | Withdrawal | Transfer (payer) | Transfer (payee) | Payment (payer) | Payment (payee) | |||||||
|---|---|---|---|---|---|---|---|---|---|---|---|---|---|---|
| Merchants | Individuals | Merchants | Individuals | Merchants | Individuals | Merchants | Individuals | Merchants | Individuals | Merchants | Individuals | |||
| Mean | 45.87 | 57.18 | 6.67 | 8.61 | 3.63 | 1.85 | 1.85 | 5.47 | 0.43 | 1.38 | 6.07 | 2.68 | 0.26 | 0.73 |
| Median | 35.00 | 28.00 | 9.00 | 5.00 | 1.00 | 1.00 | 1.00 | 1.00 | 0.00 | 0.00 | 1.00 | 1.00 | 0.00 | 0.00 |
| Min. | 7.00 | 7.00 | 0.00 | 0.00 | 0.00 | 0.00 | 0.00 | 0.00 | 0.00 | 0.00 | 0.00 | 0.00 | 0.00 | 0.00 |
| Max. | 94.00 | 209.00 | 34.00 | 181.00 | 143.00 | 53.00 | 53.00 | 162.00 | 93.00 | 187.00 | 57.00 | 105.00 | 60.00 | 106.00 |
| Std. Dev. | 38.76 | 73.86 | 13.60 | 13.12 | 7.19 | 2.56 | 2.56 | 10.86 | 3.52 | 7.21 | 13.22 | 5.65 | 1.21 | 2.77 |
| Skewness | 0.29 | 1.47 | 1.67 | 3.89 | 8.10 | 9.26 | 9.26 | 4.77 | 17.82 | 17.82 | 3.04 | 5.45 | 16.88 | 21.86 |
| Kurtosis | 1.33 | 3.42 | 3.97 | 26.86 | 198.29 | 141.05 | 141.05 | 35.70 | 386.02 | 386.02 | 11.21 | 49.23 | 535.39 | 724.85 |
-
This table presents the duration in days of transaction occurrences across different types of rCBDC transactions based on daily data. The transaction types include issuance, redemption, top-up, withdrawal, transfer, and payment. The reported statistics include the mean (and median), minimum, maximum, standard deviation, skewness, and kurtosis. The sample period covers February 6, 2023, to September 8, 2023.
In this section, we summarize the usage of rCBDC by users, categorized by transaction types, to provide insights into user behavior regarding rCBDC (see Table 10). Our findings indicate that the majority of rCBDC transactions in the pilot program are business-to-consumer (B2C) transactions. In other words, rCBDC is primarily used as a means of payment for individuals purchasing goods from merchants, with the highest number of transactions at 42,802 and a total value of 2.72 million THB (78,901 USD). The average transaction value is approximately 63.56 THB (1.84 USD), which aligns with the price of a meal or drink. In contrast, business-to-business (B2B) transactions using rCBDC are relatively low, with only 1,522 transactions totaling 812,302 THB (23,559 USD). However, these transactions have a higher average value of 533.71 THB (15.48 USD) each, suggesting that merchants may use rCBDC to purchase raw materials and supplies for production. Peer-to-peer (P2P) transactions with rCBDC show moderate activity in terms of the number of transactions, total value, and average value. This indicates that users may be transferring value to one another via rCBDC to settle debts.
Additionally, we summarize the time duration between transactions across different types of transactions in Table 11. Our analysis reveals that, among retail transactions, individuals and merchants tend to withdraw funds more frequently than they top up their rCBDC balances. Specifically, individuals and merchants typically top up their rCBDC every 5 days and 9 days, respectively, while withdrawals occur with a 1-day gap. Notably, individual users make payments and transfers more frequently, also with a 1-day gap between these transactions. This consistent pattern indicates that users primarily utilize rCBDC as a means of payment rather than as a store of value. Users maintain sufficient rCBDC balances in their wallets to facilitate daily payments and transfers, topping up their accounts weekly to ensure they have enough funds for their transactions. The frequent top-ups suggest that users may be reluctant to hold large amounts of rCBDC in their wallets, likely due to the absence of interest on rCBDC balances.
3.2.2 User Demographic Attributes and Their Impact on rCBDC Usage
In this section, we investigate the impact of demographic attributes on individual usage of rCBDC. This analysis aims to provide insights that can inform policy design and mechanisms to enhance user adoption of rCBDC. Specifically, we assess the relationship between transfers and payments made using rCBDC by individual users, considering demographic factors such as gender and age. To evaluate these relationships, we employ cross-sectional regression using ordinary least squares (OLS) estimation with heteroskedasticity-robust standard errors. We estimate the relationship between the monetary value of transfers and payments and the demographic attributes of age and gender. The OLS specifications are organized separately for transfers and payment in a cross-sectional setting, where the values for each individual user are aggregated over the entire sample period. In the equation, age i represents each individual user’s age, while gender i is a binary variable that takes a value of 1 if the individual user is female, and i denotes each individual user. The sample is limited to those users who have wallets with commercial banks, as demographic attributes are only available for these users and not for those with non-bank FSP wallets. The equation is expressed as follows:
Table 12 displays the OLS estimations of the value of transfers and payments made using rCBDC, considering age and gender as factors for individual users. The results provide important empirical evidence regarding the influence of demographic characteristics on the use of rCBDC. The findings suggest that the age of individual users is significantly and positively associated with the value of rCBDC usage. In other words, older individuals tend to use rCBDC more frequently for payments and transfers than younger users. However, there is no evidence to suggest that gender significantly affects rCBDC usage. These results highlight the need for policy measures promoting rCBDC adoption to target specific demographic groups, particularly by age. Additionally, in Table 13, the results consistently show that individuals aged between 55 and 64 had the highest average value of payments, at 1,603.60 THB (46.51 USD) and 1,004.49 THB (29.13 USD). Similarly, users aged 45–64 demonstrated the highest value of transfers, at 610.02 THB (17.69 USD) and 645.23 THB (18.71 USD).
OLS estimation of the value of transfer and payment by rCBDC and demographic factors.
| Dependent variables | ||
|---|---|---|
| Transfer | Payment | |
| Age | 12.68b (3.28) | 29.14c (9.88) |
| Gender | −18.78 (−0.16) | 104.39b (1.95) |
| Constant | −68.79 (163.14) | −393.01c (−2.99) |
| Obs | 1,801 | 2,907 |
|
|
0.00 | 0.04 |
-
This table presents the cross-sectional regression coefficients from the OLS estimation of the value of transfers and payments made by individual users using rCBDC, considering the users’ demographic attributes. The values are aggregated over the entire sample period from February 6, 2023, to September 8, 2023. Individual users’ sample included in the estimation is limited to only users who have wallet with commercial banks. The OLS regression is conducted using heteroskedasticity-robust standard errors. Numbers in parentheses indicate t-statistics, and significance levels are marked at 10 %, 5 %, and 1 % with a, b, and c respectively.
Individual users’ value of transfer and payment by genders and ages in the rCBDC pilot.
| Gender | Transfer | Payment | ||
|---|---|---|---|---|
| Female | Male | Female | Male | |
| Age | ||||
| 18–24 | 175.40 (5.09) | 88.11 (2.56) | 399.13 (11.58) | 453.46 (13.15) |
| 25–34 | 167.59 (4.86) | 383.09 (11.11) | 550.78 (15.97) | 619.23 (17.96) |
| 35–44 | 636.75 (18.47) | 428.45 (12.43) | 785.55 (22.78) | 844.07 (24.48) |
| 45–54 | 399.94 (11.60) | 610.02 (17.69) | 1,214.78 (35.23) | 958.30 (27.79) |
| 55–64 | 645.23 (18.71) | 410.54 (11.91) | 1,603.60 (46.51) | 1,004.49 (29.13) |
| 65 or above | – | 307.00 (8.90) | 307.14 (8.91) | 627.20 (18.19) |
-
This table presents the average value of transfers and payments made by individual users using rCBDC, categorized by gender and age group. The values are displayed in Thai Baht (THB) and US Dollars (USD), with the USD values shown in parentheses. The sample period covers February 6, 2023, to September 8, 2023.
3.2.3 User’s Adoption of rCBDC
In this section, we aim to provide empirical insights into the factors affecting the adoption of rCBDC, particularly focusing on the effect of reward or incentive schemes on rCBDC usage. This analysis is crucial for understanding how to formulate measures that can increase the adoption of rCBDC. To do so, we conduct statistical tests to determine whether the incentive schemes significantly influence the adoption of rCBDC by using Welch’s t-test. The Welch’s t-test provides a robust assessment when there are unequal variances between two sub-sample. We divide the sample into two sub-samples: one covering the period when rewards were offered (from 6 February to 21 May 2023) and the other for the period when no rewards were offered (from 22 May to 31 August 2023). The rewards were provided to individual users based on the frequency and value of their rCBDC transactions. Specifically, at the end of each month during the reward period, rCBDC was topped up to the wallets of the three individual users with the highest frequency of payment and transfer transactions, as well as those with the highest value of transactions for that month.
Table 14 reports the results of the Welch t-test, which examines the difference in the average daily transaction frequency and value between the period when rewards were offered and the period when they were not. The study finds a positive effect of rewards on the adoption of rCBDC in terms of both transaction frequency and value. Specifically, the average number of daily rCBDC transactions during the reward-offered period was 1.64, compared to 1.33 during the non-reward period. Similarly, the average value of daily rCBDC transactions was higher during the reward period, at 133.15 THB (3.28 USD), compared to 76.45 THB (2.22 USD) during the non-reward period. These results suggest that incentive mechanisms can increase the adoption of rCBDC, both in terms of transaction frequency and value, during the pilot period. This finding provides useful insights for policymakers in designing future rCBDC adoption strategies. However, due to the limited duration of the pilot, the long-term effects of such reward mechanisms were not examined and remain an open question.
Comparisons of daily average transaction frequency and values between period with and without reward offered in the rCBDC pilot.
| Dependent variables | Daily transaction frequency | Daily transaction value | ||
|---|---|---|---|---|
| Mean | SD | Mean | SD | |
| Period with reward offered | 1.64 | 1.24 | 113.15 (3.28) | 344.26 (9.98) |
| Period without reward offered | 1.33 | 1.23 | 76.45 (2.22) | 300.38 (8.71) |
| Welch t-test | t = −10.283c | t = −4.37c | ||
-
This table reports the differences in the average frequency and average value of transfers and payments made by individual users using rCBDC between periods with rewards offered and periods without rewards. The sample period with rewards is from February 6 to May 21, 2023, while the period without rewards is from May 22 to August 31, 2023. The table includes the mean, standard deviation, and Welch t-test statistics for the differences in means between the two periods. Values are presented in Thai Baht (THB) and US Dollars (USD), with USD values shown in parentheses. Significance levels are indicated at 10 %, 5 %, and 1 % with a, b, and c respectively.
4 Network Analysis of rCBDC Pilot in Thailand
In this section, we evaluate the effectiveness of rCBDC distribution within a hybrid rCBDC architecture model by analyzing the network structure observed during the rCBDC pilot in Thailand. This evaluation is based on two primary empirical studies. First, we present the network topology of the rCBDC pilot, examining the overall structure and clustering patterns in both aggregated and categorized transactions. This analysis helps identify how rCBDC circulates among different participants, such as individual users, merchants, and financial service providers (FSPs). Second, we conduct an empirical network analysis of the rCBDC pilot by investigating node-level and network-level measures. These findings provide valuable insights into the hybrid rCBDC architecture, including its effectiveness in rCBDC distribution and the extent of its use among participants.
4.1 Network Topology of the rCBDC Pilot
To analyze the network topology of the rCBDC pilot, we use a graphical representation based on the transactional dataset from Thailand’s rCBDC pilot. The comprehensive dataset, which includes detailed information on both payers and payees for each transaction, allows us to thoroughly examine the relationships among the participants in the rCBDC network.
In this network representation, there are two main components: nodes and edges. Each node represents a unique user’s wallet, while each edge represents the bilateral relationship between two wallets based on the types of transactions. Specifically, all transactions between the same counterparties are aggregated into a single observation for each type of transaction over the entire duration of the rCBDC pilot.
Figure 1 illustrates the network topology of the rCBDC pilot in Thailand. It presents all participants involved in the pilot, with bilateral relationships aggregated across different transaction types. The rCBDC pilot network comprises 4,315 nodes, each representing a unique wallet belonging to various types of players. Additionally, there are 26,286 edges, indicating the bilateral relationships between these wallets. In this payment system, which categorizes transactions into wholesale and retail, players’ nodes can freely connect within the same category. As noted in Table 1, the number of players and wallets is equivalent, allowing us to refer to them interchangeably as player nodes for simplicity. For instance, in the retail domain, individual users’ nodes and merchants’ nodes are interconnected for transfers and payments using rCBDC. These nodes also connect to FSPs’ nodes for top-ups and withdrawals. Conversely, in the wholesale domain, FSPs’ nodes are interconnected with each other and also connect to the central bank’s node for the issuance and redemption of rCBDC.
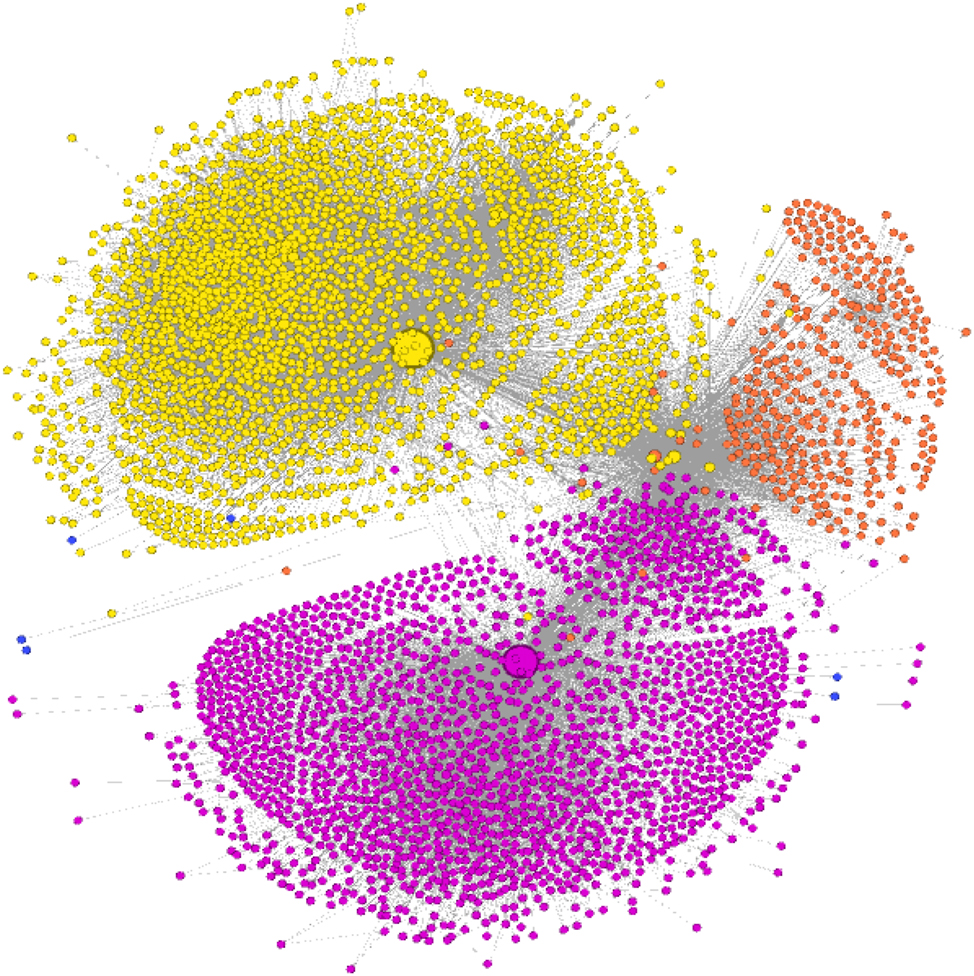
Network topology of rCBDC pilot in Thailand (aggregated transaction). This figure displays network topology of rCBDC pilot in Thailand by aggregating all types of transactions: wholesale and retail transactions. Each node represents a unique wallet and different color corresponding to node indicates different FSPs and Central bank who open and operate that wallet (3 FSPs and 1 Central banks, represented by dark blue). Node size is proportional to degree measures compared among involved wallets (i.e. the number of edges incident on that node). Each edge represents a bilateral relationship between two wallets, with edge width proportional to the number of transactions compared among involved edges. The sample period is 6 February 2023 to 8 September 2023.
By constructing the network topology using the Fruchterman–Reingold algorithm, we can analyze the structure and relationships among players’ nodes in the rCBDC network as follows: (1) Proximity of Nodes: Nodes that are located closer together are likely to have stronger connections – both direct (e.g. a player conducting transactions with another through transfers and payments) and indirect (e.g. two players transacting with a particular FSP tend to be situated closely). (2) Centrality of Nodes: The proximity of a player’s node to the center of the network indicates its level of connectivity. A player’s node that engages in transactions with multiple other nodes is likely to be positioned toward the center, while a node that interacts with fewer players will tend to be located toward the outer edges of the network. To further investigate the network topology of rCBDC, the following key features of the network are discussed.
4.1.1 Two-Tiered Structure
In payment system networks, a tiered structure of wholesale and retail payments is commonly referenced. Similarly, the rCBDC system exhibits a two-tier structure, often referred to as a hybrid rCBDC architecture, which consists of a wholesale layer and a retail layer, as illustrated in Figure 2.

Network topology of rCBDC pilot in Thailand (categorized transaction: wholesale and retail transactions). (A) Wholesale Transactions, (B) Retail Transactions. This figure displays network topology of rCBDC pilot in Thailand, broadly categorized of transactions: wholesale and retail transactions. Each node represents a unique wallet and different color corresponding to node indicates different FSPs and Central bank who open and operate that wallet (3 FSPs and 1 Central banks, represented by dark blue). Node size is proportional to degree measures compared among involved wallets (i.e. the number of edges incident on that node). Each edge represents a bilateral relationship between two wallets, with edge width proportional to the number of transactions compared among involved edges. The sample period is 6 February 2023 to 8 September 2023.
For wholesale payments (Panel A), transactions occur among financial service providers (FSPs) and between FSPs and the central bank, which operates the high-value payment infrastructure. In contrast, retail payments (Panel B) involve transactions between individual users and merchants. In this two-tier system, FSPs play a crucial role by bridging the wholesale and retail layers. They facilitate the issuance and redemption of rCBDC from the central bank, distributing it to retail users, and provide wallet services for making payments and transfers. Empirically, the significance of FSPs in the rCBDC system is highlighted by their larger size (indicated by a greater number of edges connected to FSP nodes) and their central positioning within both the wholesale and retail layers.
4.1.2 Clusters
Figure 2 also reveals the presence of several clusters within the rCBDC network. These clusters are differentiated by the various financial service providers (FSPs) that offer wallet and payment services, as indicated by the three different colors representing the players’ nodes associated with each FSP. Furthermore, the clusters highlight a key characteristic of payment transactions: the distinction between on-us and off-us transactions. Specifically, clusters located toward the outer edges of the network are more likely to represent on-us transactions, while those situated closer to the center tend to indicate off-us transactions. This is reflected in the density of edges connecting players’ nodes with different FSPs. In essence, the inner clusters consist of players’ nodes that conduct transfers and payments with nodes associated with various service providers. Empirically, we observe that transactions within the rCBDC system are predominantly on-us, contrasting with traditional payment systems where off-us transactions are more prevalent.
4.1.3 Topological Across Different Types of Transactions
To further analyze the rCBDC network by transaction types, we divide it into two subnetworks (Figure 2): the subnetwork for wholesale transactions (Panel A) and the subnetwork for retail transactions (Panel B). The wholesale subnetwork encompasses the issuance and redemption of rCBDC conducted by financial service providers (FSPs), while the retail subnetwork includes top-ups, withdrawals, payments, and transfers performed by retail users. Panel A illustrates the subnetwork of wholesale transactions within the rCBDC system, comprising nine nodes (0.21 % of the total nodes in the aggregated network) and six edges (0.02 % of the total edges). Each FSP node connects to two central bank nodes (represented as dark blue nodes), indicated by two directed edges. This signifies that FSPs engage in the issuance (receiving rCBDC) and redemption (returning rCBDC) of rCBDC with the central bank. Furthermore, the subnetwork displays several separate clusters corresponding to each FSP, suggesting a lack of bilateral relationships among FSPs in wholesale transactions.
On the retail side, Panel B presents the subnetwork of retail transactions within the rCBDC system, which consists of 4,310 nodes (99.88 % of the total nodes in the aggregated network) and 26,280 edges (99.98 % of the total edges). The dominance of transactions and bilateral connections within the retail domain highlights that the rCBDC pilot primarily serves retail transactions. Additionally, the subnetwork reveals several distinct clusters associated with each FSP. A closer examination of these clusters indicates that most retail users tend to conduct transactions primarily with one another within the same FSP, as evidenced by the proximity of their nodes within the same cluster while remaining separated from nodes in other clusters.
4.2 Network Analysis of the rCBDC Pilot
While the previous section focused on the graphical representation and network topology of the rCBDC pilot, this subsection delves deeper into key measures that underpin the network and their corresponding distributions. This empirical analysis aims to substantiate the network topology and provide insights into the assessment of the hybrid CBDC architecture. The analysis includes both node-level measures and network-level measures.
4.2.1 Node-level Measures in the rCBDC Network
To empirically analyze the properties of nodes in the rCBDC network and their implications for the role of financial service providers (FSPs) and their interactions with retail users in a hybrid rCBDC setting, we present two key node-level measures: node degree and node centrality (Figure 3).
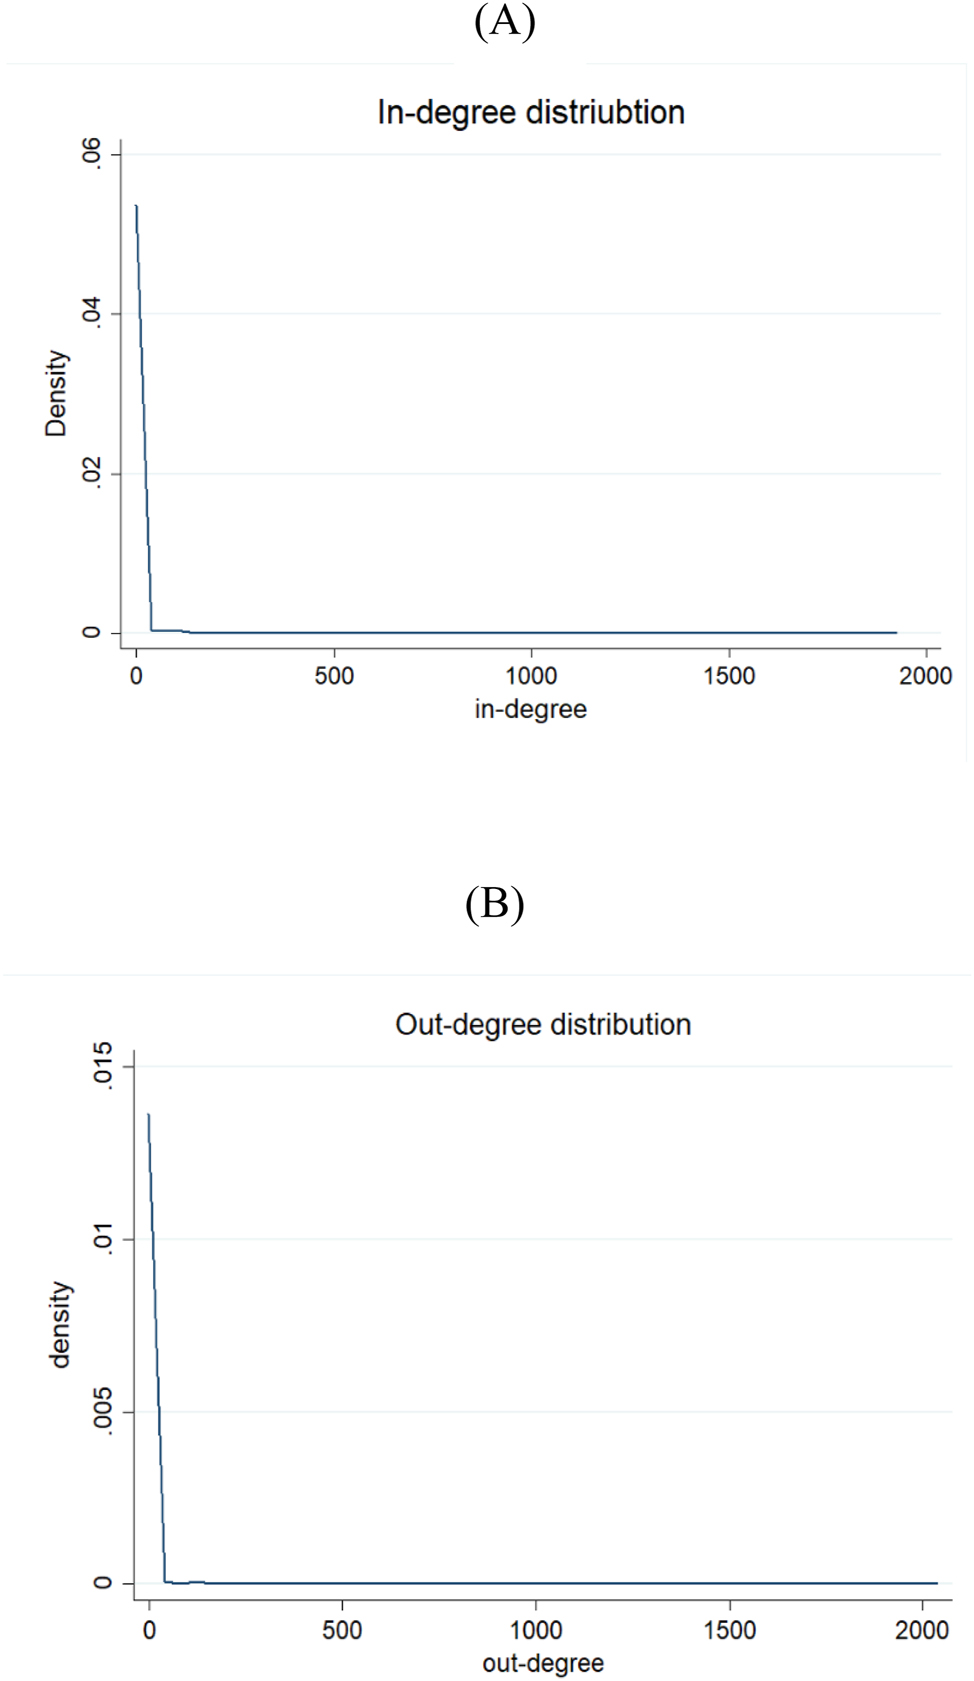
Empirical distributions of in-degree and out-degree corresponding to players’ wallets from rCBDC pilot in Thailand. (A) In-degree, (B) Out-degree. This figure displays empirical distributions of in-degree and out-degree corresponding to players’ wallets from rCBDC pilot in Thailand. In-degree is the number of incoming edges toward a particular node. Out-degree is the number of outgoing edges from a particular node. The empirical distributions of in-degree and out-degree is estimated using Epanechnikov kernel density, with bandwidth equal to one, which are estimated on aggregated data covering sample period of 6 February 2023 to 8 September 2023.
4.2.2 Node Degree
To assess the importance of each node in the rCBDC network, we estimate the node degree, which indicates a particular player’s connectivity to other nodes within the network. Node degree provides insight into the extent of transactions between players using rCBDC. For the directed rCBDC network, we present empirical distributions of players’ node degrees using nonparametric kernel density estimation, as shown in Figure 3. The empirical distributions are divided into two measures: in-degree (Panel A), which represents the number of incoming transactional relationships to a player’s node, and out-degree (Panel B), which reflects the number of outgoing transactional relationships from that node. Our findings indicate that the rCBDC network exhibits characteristics of a scale-free network, as the distributions of in-degree and out-degree follow a power law. This is illustrated by the downward-sloping nature of the distributions, suggesting that most player nodes engage in transactions with only a few other nodes (resulting in low in-degree and low out-degree), while a select few nodes transact with many others (resulting in high in-degree and high out-degree). In essence, retail users tend to engage in limited transactions with others, whereas FSPs conduct transactions with a larger number of retail users due to their broader business scope.
4.2.3 Node Centrality
In addition to node degree, node centrality is a key focus in network literature as it provides valuable insights into various aspects of the network, including transmission capabilities, reliance on specific nodes, and overall robustness. To assess the significance of particular player nodes in the rCBDC network regarding the transmission of rCBDC and reliance on specific players, we estimate two common measures of network centrality: eigenvector centrality (which indicates the extent to which a node is connected to other central nodes) and betweenness centrality (which measures how often a node lies on the shortest path between other nodes), as shown in Table 15. The results consistently reveal that the player nodes of FSPs rank highest in both eigenvector centrality and betweenness centrality. Their eigenvector centrality scores are 1.00 and 0.68, while their betweenness centrality scores are 0.73 and 0.60. This suggests that FSPs play a critical role in managing and distributing rCBDC to retail users within the network, highlighting their systemic importance.
Centrality rankings of players’ wallets from the rCBDC pilot.
| Eigenvector centrality measure | Betweenness centrality measure | ||
|---|---|---|---|
| Players’ wallets | Value | Players’ wallets | Value |
| FSP-A | 1.00 | FSP-A | 0.73 |
| FSP-B | 0.68 | FSP-B | 0.60 |
| Merchant of FSP-A | 0.35 | Merchant of FSP-A | 0.10 |
| Merchant of FSP-A | 0.27 | FSP-C | 0.09 |
| Merchant of FSP-A | 0.24 | Merchant of FSP-B | 0.07 |
-
This table reports the measures of eigenvector centrality and betweenness centrality for the players’ wallet nodes. The top five wallet nodes for each measure are highlighted. Eigenvector centrality indicates that nodes connected to many other central nodes are considered more important. The eigenvector centrality measure for a player’s node i is calculated as follows:
The results from the node-level measures indicate that, within the hybrid rCBDC framework, FSPs play a crucial role in distributing rCBDC to individual users and providing customer service. A failure in this role could have systemic repercussions for the entire rCBDC network. Consequently, implementing policies to increase the number of FSPs in the hybrid rCBDC system could help mitigate concentration risks associated with over-reliance on a small number of FSPs, thereby enhancing the system’s resilience.
4.2.4 Network-Level Measures
To thoroughly evaluate the rCBDC network and assess the effectiveness of the hybrid rCBDC model – including its distribution and the interrelationships among customers – we conduct an empirical analysis of network-level measures. Specifically, we estimate three common metrics that characterize the network as a whole: density, average clustering coefficient, and modularity (Table 16).
Network-level measures of the rCBDC pilot.
| Measures | Value |
|---|---|
| Graph density | 0.001 |
| Average clustering coefficient | 0.242 |
| Modularity | 0.529 |
-
The table presents the network-level measures of the rCBDC pilot in Thailand. It includes graph density, average clustering coefficient, and modularity. Graph density is defined as the ratio of the actual number of edges present in the graph to the maximum possible number of edges. Average clustering coefficient reflects the average ratio of the number of edges among the nodes to the maximum number of edges possible in the neighborhood of each node. Modularity measures the strength of division within the network into distinct communities. These measures are calculated using aggregated data from the sample period of February 6, 2023, to September 8, 2023.
4.2.5 Density
To understand the characteristics of a network, density is a crucial metric. In the rCBDC network, the density measure reflects the number of transactional relationships between players’ nodes. This metric provides insight into the distribution of rCBDC within the network. According to Table 16, the density of the rCBDC network is estimated at only 0.001, indicating that it is a sparsely connected network. This suggests that, under the hybrid rCBDC pilot setting, the distribution of rCBDC is limited and not widely utilized within the system. Consequently, there is potential for introducing new intermediaries to facilitate the acquisition and redistribution of rCBDC, as well as for developing new business models or use cases that encourage broader adoption among FSPs and users.
4.2.6 Average Clustering Coefficient
In analyzing the structure of a network, the clustering coefficient is a key measure that indicates the degree to which nodes tend to form clusters. This coefficient helps us understand how players transact with each other using rCBDC during the pilot. Our analysis reveals an average clustering coefficient of 0.242 for the rCBDC network, which is moderately low. This suggests the presence of small clusters surrounding individual nodes, meaning that players connected to a particular node tend to transact with one another but within a limited scope. This finding indicates that the use of rCBDC among users is still restricted, pointing to opportunities for enhancing business use cases related to rCBDC transfers to encourage broader usage. Another important structural property of the network is modularity, which measures the strength of the division of the network into subclusters. This measure provides insight into how players transact with one another in the rCBDC pilot. Our estimation of modularity for the rCBDC network yields a value of 0.529, indicating a moderate level of modularity. This suggests that there are multiple subclusters with dense connections among players within each cluster, but sparse relationships between nodes in different clusters. In other words, retail users frequently conduct transactions with one another within the same clusters of FSPs (referred to as on-us transactions) but seldom engage in transactions with users in different clusters (off-us transactions).
5 Conclusions
This paper utilizes transactional data from the rCBDC pilot in Thailand to examine rCBDC usage, the behavior of participants involved in rCBDC, and the intertemporal relationships between various types of transactions. Additionally, it analyzes the network topology and empirical structure of the rCBDC to evaluate the effectiveness of rCBDC distribution within a hybrid architecture model.
In terms of rCBDC usage and management, FSPs manage and adjust rCBDC holdings and liquidity through its redemption. They typically conduct rCBDC issuance transaction upfront to meet future demand of rCBDC and adopt adaptive strategies by adjusting their rCBDC holding through redemption based on retail transactions observed in the previous period. On the retail side, users primarily utilize rCBDC as a means of payment rather than a store of value. They manage their rCBDC holdings to fulfill payment demands. From the user perspective, rCBDC is employed in various business transaction types, including Peer-to-Peer, Business-to-Consumer, and Business-to-Business transactions, with Business-to-Consumer transactions yielding the highest value in the pilot. Transaction duration analysis indicates that users maintain sufficient rCBDC balances in their wallets for daily payments and transfers, topping up weekly to ensure adequate funds. Overall, this suggests that users predominantly view rCBDC as a payment tool rather than a store of value. Additionally, our findings reveal a strong association between rCBDC usage and individual users’ demographic attributes. Importantly, we document a positive effect of reward programs on the adoption of rCBDC.
Regarding the distribution of rCBDC, our study of the rCBDC network indicates a two-tier structure, also known as a hybrid rCBDC architecture, comprising both a wholesale layer and a retail layer. In this framework, FSPs play a crucial role in bridging the two layers by managing the issuance and redemption of rCBDC from the central bank and distributing it to retail users for payments and transfers. The network reveals several clusters, which are primarily categorized based on the different FSPs involved in transactional relationships within those clusters. A closer examination shows that subclusters emerge, reflecting the nature of payment transactions, such as on-us and off-us transactions. Furthermore, the rCBDC network exhibits characteristics of a scale-free network. This means that while most retail users engage in transactions with a limited number of other users, a few FSPs facilitate transactions with a larger number of retail users, highlighting their role as intermediaries in connecting many participants.
Additionally, the results from the empirical network analysis indicate that the rCBDC network, operating under a hybrid architecture in pilot settings, is a less connected network. This means that the distribution of CBDC is sparse and slow across the network. Furthermore, we observe a systemic reliance on a few key FSPs for CBDC distribution. Collectively, these findings suggest that, within this hybrid architecture and pilot setting, the effectiveness of distributing CBDC for widespread use in the system is limited, resulting in restricted usage of rCBDC among users.
These results provide valuable insights for policymakers and central banks regarding the design of rCBDC and strategies to enhance its adoption in the future. For instance, when designing pilot programs, policymakers might consider increasing the number of FSPs within the rCBDC system to improve the efficiency of distributing CBDC and make it more accessible to individual users. Additionally, enabling a broader range of business models for FSPs and introducing new use cases could facilitate the use of rCBDC across a larger number of FSPs and users. Such measures would ultimately promote greater adoption of rCBDC.
References
Ahnert, T., P. Hoffmann, A. Leonello, and D. Porcellacchia. 2023. “Central Bank Digital Currency and Financial Stability.” ECB Working Paper 2783, https://doi.org/10.2866/671223.Suche in Google Scholar
Alfonso, V., S. Kamin, and F. Zampolli. 2023. “Central Bank Digital Currencies (CBDCs) in Latin America and the Caribbean.” BIS Working Papers 989.Suche in Google Scholar
Ananchotikul, N., and B. Civilize. 2018. “A Microscopic View of Thailand’s Foreign Exchange Market: Players, Activities, and Networks.” Bank of Thailand Discussion Paper.Suche in Google Scholar
Auer, R., and R. Böhme 2020. “The Technology of Retail Central Bank Digital Currency.” BIS Quarterly Review.Suche in Google Scholar
Bank of Thailand. 2024. “Retail CBDC Pilot Program - Conclusion Report.”Suche in Google Scholar
Becher, C., S. Millard, and K. Soramäki. 2008. “The Network Topology of CHAPS Sterling.” Bank of England Working Paper.10.2139/ssrn.1319277Suche in Google Scholar
Bijlsma, M., C. van der Cruijsen, N. Jonke, and J. Reijerink. 2021. “What Triggers Consumer Adoption of CBDC?” DNB Working Paper 709. https://doi.org/10.2139/ssrn.3836440.Suche in Google Scholar
Boss, M., G. Krenn., V. Metz., C. Puhr., and S. W. Schmitz. 2008. “Systemically Important Accounts, Network Topology and Contagion in ARTIS.” OENB Financial Stability Report.Suche in Google Scholar
Caddy, J., L. Delaney, and C. Fisher. 2020. “Consumer Payment Behavior In Australia: Evidence from the 2019 Consumer Payments Survey.” Reserve Bank of Australia Research Discussion Paper.Suche in Google Scholar
Choi, S., Y. S. Kim, B. Kim, and O. Kwon. 2023. “Central Bank Digital Currency and Privacy: A Randomized Survey Experiment.” In BIS Working Papers 989.10.2139/ssrn.4204110Suche in Google Scholar
Chucherd, T., C. Mek-yong, N. Nookhwun, P. Nuntnarumit, and N. Piyakarnchana. 2021. “Monetary and Financial Perspectives on RCBDC in the Thai Context.” In Bank of Thailand Discussion Paper.Suche in Google Scholar
Das, M., T. Mancini Griffoli, F. Nakamura, J. Otten, G. Soderberg, J. Sole, and B. Tan. 2023. Implications of Central Bank Digital Currencies for Monetary Policy Transmission. IMF Fintech Note, Vol. 10. Washington, DC: IMF.10.5089/9798400252792.063Suche in Google Scholar
Embree, L., and T. Roberts. 2009. “Network Analysis and Canada’s Large Value Transfer System.” Bank of Canada Discussion Paper.Suche in Google Scholar
Hu, Q., G. Wu, and J. Yang. 2022. “Research on Factors Affecting People’s Intention to Use Digital Currency: Empirical Evidence from China.” Journal Frontiers in Psychology 13: 928735. https://doi.org/10.3389/fpsyg.2022.928735.Suche in Google Scholar
Infante, S., Kim, K., A. Orlik, A. F. Silva, and R. J. Tetlow. 2023. “Retail Central Bank Digital Currencies: Implications for Banking and Financial Stability.” Finance and Economics Discussion Series. https://doi.org/10.17016/feds.2023.072.Suche in Google Scholar
Kiff, J. Alwazir, S. Davidovic, A. Farias, A. Khan, T. Khiaonarong, M. Malaika, et al.. 2020. “A Survey of Research on Retail Central Bank Digital Currency.” IMF Working Paper. https://doi.org/10.5089/9781513547787.001.Suche in Google Scholar
Kosse, A., and I. Mattei. 2023. “Making Headway – Results of the 2022 BIS Survey on Central Bank Digital Currencies and Crypto.”, Vol. 136. BIS Papers.Suche in Google Scholar
Lee, D. K. C., C. M. Shin, and J. Zheng. 2023. “Asian CBDCs on the Rise: An In-Depth Analysis of Developments and Implications.” Quantitative Finance and Economics 7 (4): 665–96. https://doi.org/10.3934/qfe.2023032.Suche in Google Scholar
Morales-Resendiz, R., J. Ponce, P. Picardo, A. Velasco, B. Chen, L. Sanz, and G. Guiborg, et al.. 2021. “Implementing a rCBDC: Lessons Learned and Key Insights.” Latin American Journal of Central Banking 2 (1).10.1016/j.latcb.2021.100022Suche in Google Scholar
Schmidt, T. 2014. “Consumers’ Recording Behavior in Payment Diaries – Empirical Evidence from Germany.” In Survey Methods: Insights from the Field.Suche in Google Scholar
Soramäki, M. L. Bech, J. Arnold, R. J. Glass, and W. E. Beyeler. 2007. “The Topology of Interbank Payment Flows.” Physica A 379: 317–33. https://doi.org/10.1016/j.physa.2006.11.093.Suche in Google Scholar
Stock, J. H., and M. W. Watson. 2001. “Vector Autoregressions.” The Journal of Economic Perspectives 15 (4): 101–15. https://doi.org/10.1257/jep.15.4.101.Suche in Google Scholar
Tan, B. J. 2023. “Central Bank Digital Currency and Financial Inclusion.” IMF Working Paper. https://doi.org/10.5089/9798400238277.001.Suche in Google Scholar
World Bank Group. 2021. “Central Bank Digital Currency.” Background Technical Note.Suche in Google Scholar
Xia, Y. Gao, and J. Z. Zhang. 2023. “Understanding the Adoption Context of China’s Digital Currency Electronic Payment.” Financial Innovation 9 (63): 2–27. https://doi.org/10.1186/s40854-023-00467-5.Suche in Google Scholar
© 2025 the author(s), published by De Gruyter, Berlin/Boston
This work is licensed under the Creative Commons Attribution 4.0 International License.
Artikel in diesem Heft
- Frontmatter
- Editorial
- Editorial – Special Issue on “Central Bank Digital Currency”
- Special Issue Articles
- Public Use and Distribution of Retail CBDC: An Evidence from Thailand’s Retail CBDC Pilot Program
- Simulating the Adoption of a Retail CBDC
- CBDC and the Banking System
- Banking Crises Under a Central Bank Digital Currency (CBDC)
- Monetary Policy Transmission, Central Bank Digital Currency, and Bank Market Power
- Data Observer
- The WBdigital Database: A Digital Repository for the Historical DIW-Wochenbericht, 1928–1968
- The IZA/Fable Swipe Consumption Index