Effects of Cu Distribution on Solidification Microstructure in Transition Layer of Cu/Al Composite Ingot Prepared by Casting Aluminum Method
-
Shuying Chen
 ,
Guowei Chang
,
Guowei Chang

Abstract
In this study, a Cu/Al composite ingot was prepared by casting aluminum method, and the effects of the Cu concentration distribution in the transition layer on the solidification microstructure were examined during the recombination process of solid Cu and liquid Al. The results show that the Cu content is about 60 % at the Cu/Al binding interface in the transition layer, while the Cu concentration first drops sharply and then decreases slowly in the direction away from the pure Cu. The concentration gradient of Cu reaches 1 %/μm close to the Cu/Al binding surface. The Cu distribution in the transition layer does not change the microstructure species, but changes the proportions of various microstructures. The smaller the Cu concentration gradient is, the less the proportion of the hypoeutectic microstructure in transition layer is.
Introduction
The copper resources are scarce, and the high price limits its wide application in the communications and electric conduction industries. Copper cladding aluminum (CCA) composite as a perfect substitution for pure copper has attracted broad attention. First, it was used as conductor material in Germany. Subsequently, Europe, America, other developed countries and China began to study and apply the CCA composite one after another [1, 2].
The CCA composite preparation requires metallurgical bonding between Cu and Al. Preparation methods are divided into two parts to achieve metallurgical bonding: before plastic working and after plastic working [3, 4, 5].
When the liquid Al contacts with the solid Cu, the Cu atoms on the solid Cu surface can melt quickly into the Al liquid and form the Cu/Al transition layer between the solid Cu and the liquid Al. The transition layer binds the Cu and Al together after the solidification to complete the metallurgical bonding process between the two materials. The CCA composites are usually prepared in this manner [6, 7, 8], though researchers have provided several different methods for preparing the CCA composites. The effects of temperature, time, cooling mode, heat treatment and high magnetic field on the formation of the transition layer of the CCA composite and its microstructure and mechanical properties have been investigated by previous researchers [9, 10, 11, 12, 13, 14, 15, 16, 17, 18, 19], which provides a solid foundation for controlling the recombination process effectively in practice. However, the relationship between the Cu concentration distribution and solidification microstructure in the transition layer has not yet been studied extensively, however. In this study, a Cu/Al composite ingot was prepared by casting aluminum method and the influence of Cu concentration distribution on the resulting solidification microstructure in the transition layer was investigated.
Experimental methods
Purities of the Al and Cu used in the experiment were 99.90 %. The aluminum ingot was first placed in a clay graphite crucible and melted with a resistance furnace. The liquid Al was degassed and refined with C2Cl6 after reaching the set temperature (20 ℃ higher than the pouring temperature) and held for 20 min. The crucible containing the liquid Al was removed and the material was poured into the experimental device (Figure 1) once its temperature dropped to 780 ℃. Before pouring, the surface of the Cu plate was buffed with sandpapers to remove the oxide skin, and then the Cu plate was placed on the experimental device, meanwhile Argon was introduced to the casting mold to protect the internal surface of the plate and avoid oxidation during pouring the liquid Al. The temperature of the liquid Al was maintained by spreading insulation covering agent on the surface of the liquid. The outside surface of the Cu plate was cooled by the water injection. The time from pouring to the forced cooling was either 60 s or 110 s. An Axiovert 200 MAT metallographic microscope and SN300 electron microscope were used to observe the microstructure and to conduct energy spectrum analysis.

Fundamentals schematic plan of preparing Cu-Al composite casting using pouring aluminum: (1) covering agent for thermal retardation; (2) Al liquid; (3) casting mold; (4) thermal couple; (5) copper plate; (6) cooler.
Experimental results and analysis
Copper distribution in the transition layer
Figure 2 shows the line scanning results of Cu and Al in the transition layer of the Cu/Al composite ingot prepared according to the above procedure with 60 s holding time. At the interface of the solid Cu and liquid Al, the Cu content is the highest and the Al content is the lowest, yet the Cu content decreases gradually and the Al content increases gradually away from the interface. Actual measurement results of the Cu content by the energy spectrum analysis signed with “+” in the solidification microstructure are shown in Figure 3. The Cu content is about 60 % (mass%, the following are the same) at the Cu/Al interface, then decreases to 5 % within 300 μm away from the interface, and then decreases to 0 % from 300 μm to 750 μm away from the interface. The Cu concentration gradient near the binding surface of Cu and Al reaches 1 %/μm.
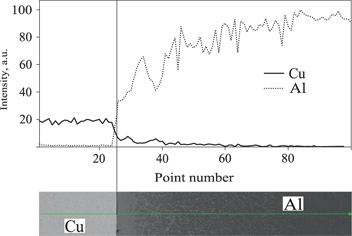
Line scanning results of Cu and Al in the transition layer.
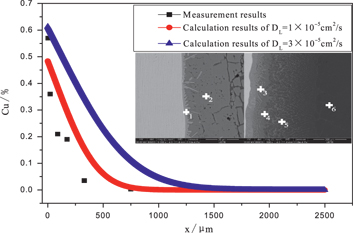
Actual measurement results and calculation results of the Cu content.
Solidification microstructure in the transition layer
The solidification microstructure of the transition layer is shown in Figure 4. Three kinds of microstructures are observed in the transition layer: the hypoeutectic microstructure close to the pure Al side, the eutectic microstructure in the middle of the transition layer and the hypereutectic microstructure close to the pure Cu side. A thin layer γ exists between the pure Cu and the transition layer. According to the literature [5], the β phases and γ phases shown in Figure 4 are CuAl2 and Cu9Al4, respectively, so there are four microstructures in the transition layer of the Cu/Al composite ingot in total: α + eutectic (α + CuAl2), eutectic (α + CuAl2), CuAl2 + eutectic (α + CuAl2) and Cu9Al4.
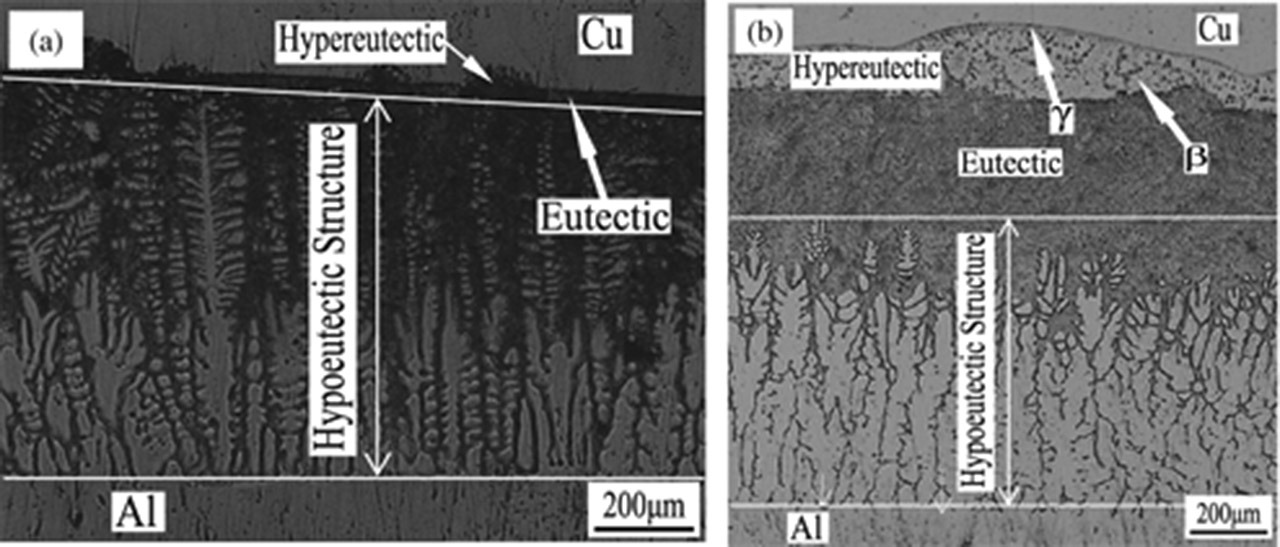
Metallograph of the solidification microstructure in the transition layer: (a) holding for 60 s; (b) holding for 110 s.
Relationship between the Cu distribution and solidification microstructures
The alloy in the transition layer is Al-Cu alloy. The hypoeutectic component is close to pure Al side and the hypereutectic component is close to pure Cu side. The pouring temperature and time from pouring to the forced cooling affect the Cu distribution. Because the liquidus temperature of the Al-Cu alloy in the transition layer is lower than the melting temperature of pure Al, the outer surface of the Cu plate will naturally cool from pouring to the forced cooling. The cooling rate is relatively low and the temperature gradient in the melt is lower. It can be confirmed from Figure 5 that the pure Al is first solidified during the solidification. The Cu atoms in the transition layer continue to diffuse from the pure Cu side to the transition layer after the pure Al solidifies, which causes the Cu concentration gradient to decrease gradually, as shown in Figure 5(a). At the same time, the eutectic composition of the Al-Cu alloy in the transition layer moves gradually to the pure Al side. The longer the time form pouring to the forced cooling, the closer to the pure Al side the eutectic composition and the thinner the α + eutectic (α + CuAl2), as shown in Figure 5(c) and 5(d).
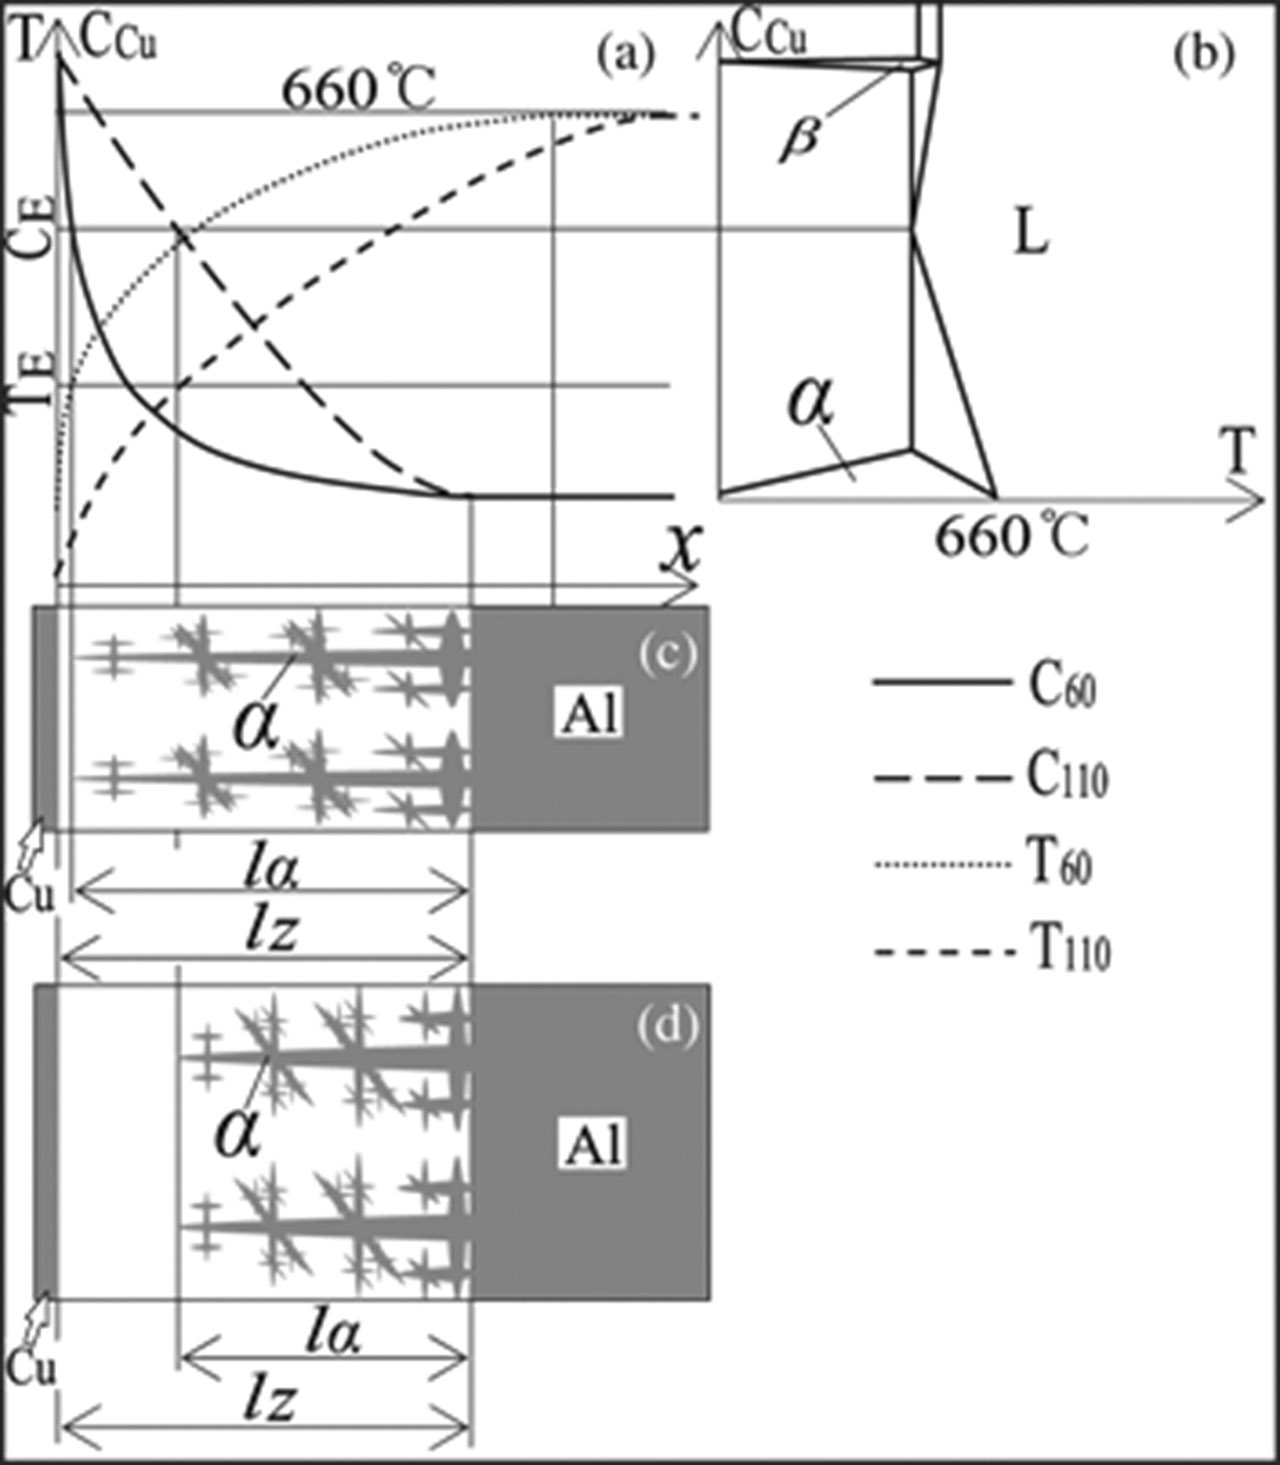
Schematic diagram of the solidification process in the transition layer: (a) Concentration and temperature distribution; (b) Phase diagram of Al-Cu alloy; (c) Solidification process at 60 s after pouring; (d) Solidification process at 110 s after pouring.
The component changes in the transition layer do not affect the microstructure species, but affect the proportions of all kinds of microstructures. The larger the Cu concentration gradient in the transition layer, the larger the lα/lz value. It can be concluded that the lower the pouring temperature, the shorter the time from pouring to the forced cooling, the stronger the forced cooling intensity, thus the thinner the total thickness of the transition layer and the larger lα/lz value. The proportion of each microstructure to the total thickness in the transition layer is shown in Figure 6. The change of lα/lz value is in agreement with the above analysis. At the same pouring temperature, the values of l(α+β)/lz and lβ+(α+β)/lz increase with prolonging time from pouring to the forced cooling, while the lγ/lz value barely changes.
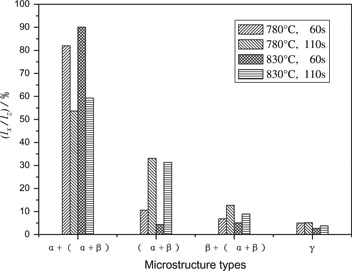
Proportion of the thickness of every kind of structure to the total thickness of transition layer lx – the thickness of every kind of structure; lγ/lz –10 times of the actual value.
Theoretical calculation of Cu distribution
The Cu atoms are dissolved into the molten Al at speed of vd to form the Al-Cu alloy. The dissolved Cu atoms first accumulate at the interface between the solid Cu and the liquid Al, and then enter the liquid Al by Cu atoms diffusion and liquid Al flow. The distribution state of the Cu atoms is shown in Figure 7. Ignoring the flow, and the dissolved Cu atoms enter the molten Al only by diffusion, the following equation represents this process:
where DL is the diffusion coefficient of Cu atoms in the molten Al, C is the Cu concentration, x is the distance away from the pure Cu, and t is the time.
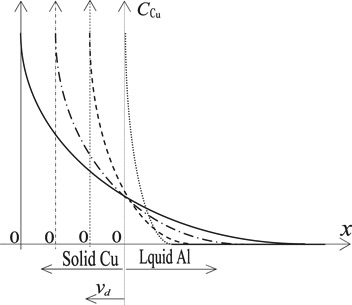
Schematic diagram of the concentration distribution of Cu in the molten aluminum after the Cu dissolution vd -the dissolution rate of Cu; x- the distance.
In Eq. (1), when t = 0,
If the Cu5Al is formed, the
The boundary conditions in Eq. (1) are as follows:
Results of a previous study [20] show that the dissolution rate of solid Cu has an average value of 3.6 μm/s when the contact time of Cu and Al is 60 s. The diffusion coefficient DL of Cu in molten Al is 1~3 × 10⁻⁵ cm2/s.
The calculation results of the Cu distribution are shown in Figure 8. The dissolved Cu atoms first accumulate at the interface of solid Cu and liquid Al, so the Cu concentration is higher close to the interface between solid Cu and liquid Al. Cu atoms diffusion and liquid Al flow result in the gradual decrease of the Cu concentration with increasing the distance to the interface. The calculated distribution trend of Cu in the molten Al is consistent with the actual measurement results (Figure 2), and the distribution according to qualitative analysis (Figure 5).
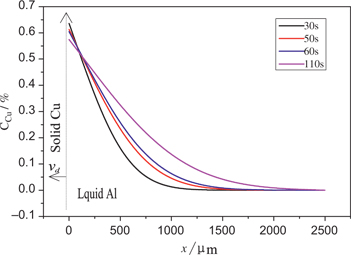
Calculation results of Cu concentration distribution in the transition layer.
The calculation results of the Cu concentration shown in Figure 3 when the diffusion coefficient DL equals to 1 × 10⁻⁵ cm2/s or 3 × 10⁻⁵ cm2/s are closer to the actual measurement results when the diffusion coefficient DL is 1 × 10⁻⁵ cm2/s, though the diffusion coefficient DL is generally 3 × 10⁻⁵ cm2/s [18]. It is analyzed that the diffusion direction of the Cu in the transition is upwards, when the method shown in Figure 1 is adopted to prepare the Cu/Al composite, so the diffusion rate cuts down owing to the gravity affect. More accurate calculation results can be achieved if diffusion coefficient of the Cu in the molten Al is appropriate.
Conclusions
The most notable conclusions of this study can be summarized as follows.
The Cu content is about 60 % at the Cu/Al binding interface in the transition layer when preparing the Cu/Al composite ingot by casting aluminum method. The Cu concentration drops sharply and decreases slowly in the direction away from pure Cu, and the Cu concentration gradient reaches 1 %/μm close to the Cu/Al binding interface.
The solidification microstructures in the transition layer of the Cu/Al composite ingot consist of α+ eutectic (α + CuAl2), (α + CuAl2) and CuAl2+eutectic(α+CuAl2). The microstructure between the pure Cu and the transition layer is Cu9Al4 phase formed by the diffusion of Al atoms towards the Cu. The Cu distribution in the transition layer does not change the microstructure species, but affect the proportion of each kind of microstructure. The lower the Cu concentration gradient is, the smaller the proportion of the hypoeutectic microstructure in the transition layer.
The theoretical calculation results of Cu concentration distribution in the transition layer are consistent with the actual measurement results in this study.
Funding statement: This study was financially supported by the Growth Plan for Outstanding Young Scholars in Colleges and Universities of Liaoning Province (No. LJQ2014062), the Outstanding Innovation Team in Colleges and Universities of Education Department of Liaoning Province (No. 2007T078).
References
[1] A. Gibson, Wire J. Int., 41 (2008) 142–148.Suche in Google Scholar
[2] D.C. Ko, S.K. Lee and B.M. Kimc, J. Mater. Process. Technol., 186 (2007) 22–26.10.1016/j.jmatprotec.2006.11.131Suche in Google Scholar
[3] H. Liang, Z.Y. Xue, C.J. Wu et al., Acta Metall. Sin. (Engl. Lett.), 23 (2010) 206–214.Suche in Google Scholar
[4] M.S. Mohebbi and A. Akbarzadeh, Int. J. Adv. Manuf. Technol., 54 (2011) 1043–1055.10.1007/s00170-010-3016-5Suche in Google Scholar
[5] H. Paul, L.L.S.D. Ska and M. Pramowski, Metall. Mater. Trans. A, 44 (2013) 3836–3851.10.1007/s11661-013-1703-1Suche in Google Scholar
[6] J.T. Luo, S.J. Zhao and C.X. Zhang, J. Cent. South Univ. Technol., 18 (2011) 1013–1017.10.1007/s11771-011-0796-1Suche in Google Scholar
[7] Y.J. Su, X.H. Liu, H.Y. Huang, C.J. Wu, X.F. Liu and J.X. Xie, Metall. Mater. Trans. B, 42 (2011) 104–113.10.1007/s11663-010-9449-2Suche in Google Scholar
[8] Y.J. Su, X.H. Liu, H.Y. Huang, X.F. Liu and J.X. Xie, Metall. Mater. Trans. A, 42 (2011) 4088–4099.10.1007/s11661-011-0785-xSuche in Google Scholar
[9] E. Hug and N. Bellido, Mater. Sci. Eng. A, 528 (2011) 7103–7106.10.1016/j.msea.2011.05.077Suche in Google Scholar
[10] W. Xie, T. Yamaguchi and K. Nishio, J. Japan Inst. Metals, 75 (2011) 166–172. (In Japanese).10.2320/jinstmet.75.166Suche in Google Scholar
[11] R. Uscinowicz, Compos. Part B, 55 (2013) 96–108.10.1016/j.compositesb.2013.06.002Suche in Google Scholar
[12] I.K. Kim and S.I. Hong, Mater. Design, 57 (2014) 625–631.10.1016/j.matdes.2014.01.054Suche in Google Scholar
[13] X.B. Li, G.Y. Zu and P. Wang, Trans. Nonferrous Metals Soc. China, 25 (2015) 36–45.10.1016/S1003-6326(15)63576-2Suche in Google Scholar
[14] L.Y. Sheng, F. Yang, T.F. Xi, C. Lai and H.Q. Ye, Compos. Part B, 42 (2011) 1468–1473.10.1016/j.compositesb.2011.04.045Suche in Google Scholar
[15] B. Xu, W.P. Tong, C.Z. Liu, H. Zhang, L. Zuo and J.C. He, J. Mater. Sci. Technol., 27 (2011) 856–860.10.1016/S1005-0302(11)60155-2Suche in Google Scholar
[16] K. Meguro, M. O and M. Kajihara, J. Mater. Sci., 47 (2012) 4955–4964.10.1007/s10853-012-6370-xSuche in Google Scholar
[17] I.K. Kim and S.I. Hong, Mater. Design, 47 (2013) 590–598.10.1016/j.matdes.2012.12.070Suche in Google Scholar
[18] V. Yousefi Mehr, M.R. Toroghinejad and A. Rezaeian, Mater. Design, 53 (2014) 174–181.10.1016/j.matdes.2013.06.028Suche in Google Scholar
[19] J.M. Jung, J.G. Kim, M.I. Latypov and H.S. Kim, Mater. Design, 82 (2015) 28–36.10.1016/j.matdes.2015.05.025Suche in Google Scholar
[20] W. Kurz and D.J. Fisher, Fundamentals of Solidification, Trans Tech Publications, Aedermannsdorf (1998) 240.10.4028/www.scientific.net/RC.35Suche in Google Scholar
© 2017 Walter de Gruyter GmbH, Berlin/Boston
This article is distributed under the terms of the Creative Commons Attribution Non-Commercial License, which permits unrestricted non-commercial use, distribution, and reproduction in any medium, provided the original work is properly cited.
Artikel in diesem Heft
- Frontmatter
- Research Articles
- Calculation of the Spontaneous Polarization and the Dielectric Constant for the Ferroelectric N(CH3)4HSO4 Using the Mean Field Model
- Structural Properties of Molten CaO–SiO2–P2O5–FeO System
- Direct Acid Leaching of Vanadium from Stone Coal
- Effects of Cu Distribution on Solidification Microstructure in Transition Layer of Cu/Al Composite Ingot Prepared by Casting Aluminum Method
- Plasma Methods of Obtainment of Multifunctional Composite Materials, Dispersion-Hardened by Nanoparticles
- Microstructure and Diffusion Behaviors of the Diffusion Bonded Mg/Al Joint
- Phosphorus Segregation in Meta-Rapidly Solidified Carbon Steels
- Effects of Temperature and Strain Rate on Tensile Deformation Behavior of 9Cr-0.5Mo-1.8W-VNb Ferritic Heat-Resistant Steel
- Zn1–xCdxO Microtubes: Synthesis and Optical Properties Using Direct Microwave Irradiation
- Oxidation Kinetics and Spallation Model of Oxide Scale during Cooling Process of Low Carbon Microalloyed Steel
- Effect of Cr2O3 Pickup on Dissolution of Lime in Converter Slag