Oxidation Kinetics and Spallation Model of Oxide Scale during Cooling Process of Low Carbon Microalloyed Steel
-
 ,
,

Abstract
The spallation behavior of oxide scale on the surface of low carbon microalloyed steel (510L) is investigated during the laminar cooling of hot rolling strip. Surface, cross-section morphology and phase composition of oxide scale in different laminar cooling rate are observed by scanning electron microscopy (SEM) and X-Ray Diffraction (XRD). Moreover, a spallation mathematic model is established based on empirical formula to predict the critical thickness of oxide scale and the test of high temperature oxidation kinetics at different temperatures between 500 °C to 900 °C provides oxidation rate constant for the model calculation. The results of heat-treatment test and model calculation reveal that laminar cooling rate plays an important role in controlling the thickness of oxide scale and suppressing spallation behavior.
Introduction
The dimensional precision and mechanical properties of the hot rolling strip have been well controlled by use of accurate operating equipment such as Automatic Generation Control (AGC), Automatic Width Control (AWC), Short Stroke Control (SSC) and Crown Variable Control (CVC). In addition, with the competition between the iron and steel enterprises, the surface quality demand of hot rolling strip has been gradually enhanced. The spallation phenomenon of oxide scale is the major defects for the surface quality of hot rolling strip. Therefore, how to repress spallation on the surface of hot rolling strip is a significant problem of the iron and steel enterprises.
The complex high temperature oxidation behavior of iron and alloys in air and pure oxygen was well investigated [1, 2, 3, 4, 5, 6]. The oxide scale formed on iron and mild steel in air at high temperature, which composed of three layers: hematite (Fe2O3), magnetite (Fe3O4) and wustite (FeO). The innermost layer is wustite which contains 90 % of the oxide scale at hot rolling temperature range. Magnetite takes up 8–9 % of the oxide scale. Hematite forms the external layer of the scale and takes up only 1–2 % of it. This three-layer structure is not stable due to oxide/substrate stress at the lower temperatures in coiling stage, which induced the structures transformation of oxide scale at different parts of the strip. Different mechanisms for the spallation failures which resulted from the stress in the interface of oxide/substrate have been preferred as possible explanations. Therefore, the effect of coiling temperature, grain-refined and cooling rate on microstructure and micro-texture evolutions of oxide scale has been investigated in recent years [7, 8, 9, 10, 11, 12]. One of the most influential factors is that the controlling of cooling temperature and cooling rate in cooling section. Chen and Yuen [13] studied the transformation law of wustite (FeO) of low carbon steel during continuous cooling process and compared oxidation behavior of low carbon and ultra-low carbon steels at 700–950 ℃ in air. The oxidation kinetics of low carbon and ultra-low carbon steels followed the parabolic law at different temperatures; moreover, the parabolic rate constants from “parabolic zones” were used to distinguish the oxidation behavior of the specimens. The research of the effect of cooling rate on a microalloyed low carbon steel by Yu and Jiang [10] shows that the adhesion and structure of oxide scale could been enhanced by controlling cooling rates.
There are many influence factors for the stress in the interface of oxide/substrate. While, the main source of oxide/substrate interface stress is the wustite decomposition in cooling process. In the cooling process, the oxygen concentration and the migration of iron ions have been changed which led to magnetite particles is the result of pro-eutectoid precipitation from oxygen-rich wustite [14, 15]. Pilling and Bedworth assumed that oxidation was controlled by migration of oxygen ions and the stress within the oxide layer was due to the difference in volume caused by deformation of the ionic lattice.This criterion can be used to compute the stress between hematite and magnetite when oxygen was the migrating species, whereas the stress cannot be observed between the steel and wustite or between wustite and magnetite when iron was the diffusing species [16, 17].
In this present work, the high temperature oxidation behavior of the low-carbon microalloyed steel for automotive frame is investigated. A spallation model of the oxide scales during laminar cooling process was established using empirical formula; the model can be used to accurately predict the critical thickness for spallation. Moreover, the effect of cooling rate on spallation behavior of oxide scale in laminar cooling has been investigated by the thermal-mechanical simulator (MMS-300). Scanning electron microscope (SEM) and X-ray diffraction (XRD) were employed to study the development of morphology and phase structure of oxide scale at three different cooling rates in laminar cooling section.
Experimental
Materials and oxidation test
Material selected in this paper is hot rolled low-carbon microalloyed steel for automotive frame (510L). The chemical compositions of the test specimens with thickness of about 2.5 mm are shown in Table 1. In order to fit into the high temperature oxidation test in the furnace chamber of thermogravimetric analyzer (TGA), the steel specimens measuring 10 mm × 8 mm × 2.5 mm are machined out of hot rolling strip. All of the broad faces on the specimens are polished by SiC papers of 1,200 mesh to surface roughness of 2.0 μm. The specimens are cleaned in acetone using ultrasonic agitation and then store in a desiccator before the test. In the isothermal oxidation test, a specimen is heated in an argon atmosphere at rate of 60 °C/min until it reach the target temperature of 500–900 °C. The dry air with a flow rate of 50 mL/min is introduced into the TGA chamber to conduct the 9 h oxidation test when the temperature reaches target temperature. After the test, the TGA chamber is cooled to room temperature at a rate of 90 °C/min.
The chemical composition of 510L steel.
| Elements | C | Si | Mn | P | S | Nb |
|---|---|---|---|---|---|---|
| Wt % | 0.08–0.13 | ≤0.15 | 1.20–1.45 | ≤0.020 | ≤0.010 | 0.015–0.025 |
Thermal simulation test
Thermal simulation rectangle specimens of 6 mm thickness, 150 mm length and 40 mm width are machined from the hot-rolling strip and the chemical compositions of the specimens are tabulated in Table 1. In order to ensure that same surface condition during heat-treatment, the surface roughness of specimens is polished to 2.0 μm by M7120D grinder. A computerized MMS-300 thermal-mechanical simulator is used to conduct the simulation heat-treatment tests with different cooling rates at the industrial laminar cooling process. The heat-treatment tests of 510L are carried out at the temperature range from 850 °C to 550 °C. It should be noted that the oxidation time is based on the industrial hot rolling process. The total time for the laminar cooling process is 15 sec measured by a steel factory. Therefore, the time is ensured consistency in the stage of simulation laminar cooling process which uses different cooling rates. The following procedure is used for each heat-treatment test: (1) the temperature value of heat-treatment test is recorded by a thermocouple which is spot-welded to the longitudinal center of specimen. (2) the specimen is heated to 1,000 °C at a rate of 20 °C/s in order to obtain the start hot rolling temperature under vacuum, and then hold for 20 sec; (3) the specimen is cooled to the finish hot rolling temperature (850 °C) at a rate of 10 °C/s and pumped in air; (4) the specimen is cooled from 850 °C to 550 °C at three different rates ((a) cooling rate from 850 °C to 600 °C at 50 °C/s and then from 600 °C to 550 °C at 5 °C/s; (b) cooling rate from 850 °C to 550 °C at 20 °C/s; (c) cooling rate from 850 °C to 800 °C at 5 °C/s and then from 800 °C to 550 °C at 50 °C/s;); (5) the specimen is cooled to room temperature by quenching. This schematic illustration of the heat-treatment schedule is illustrated schematically in Figure 1.
Microstructural characterization is carried out on the interface by cutting from the specimen after heat treatment. The specimens for scanning electron microscope (SEM) are chemical etched for 10 sec using 0.1 % HCl. Brooke X-ray diffraction (XRD) with Cu Kα radiation is used to detect the phase composition of the specimens after oxidation.
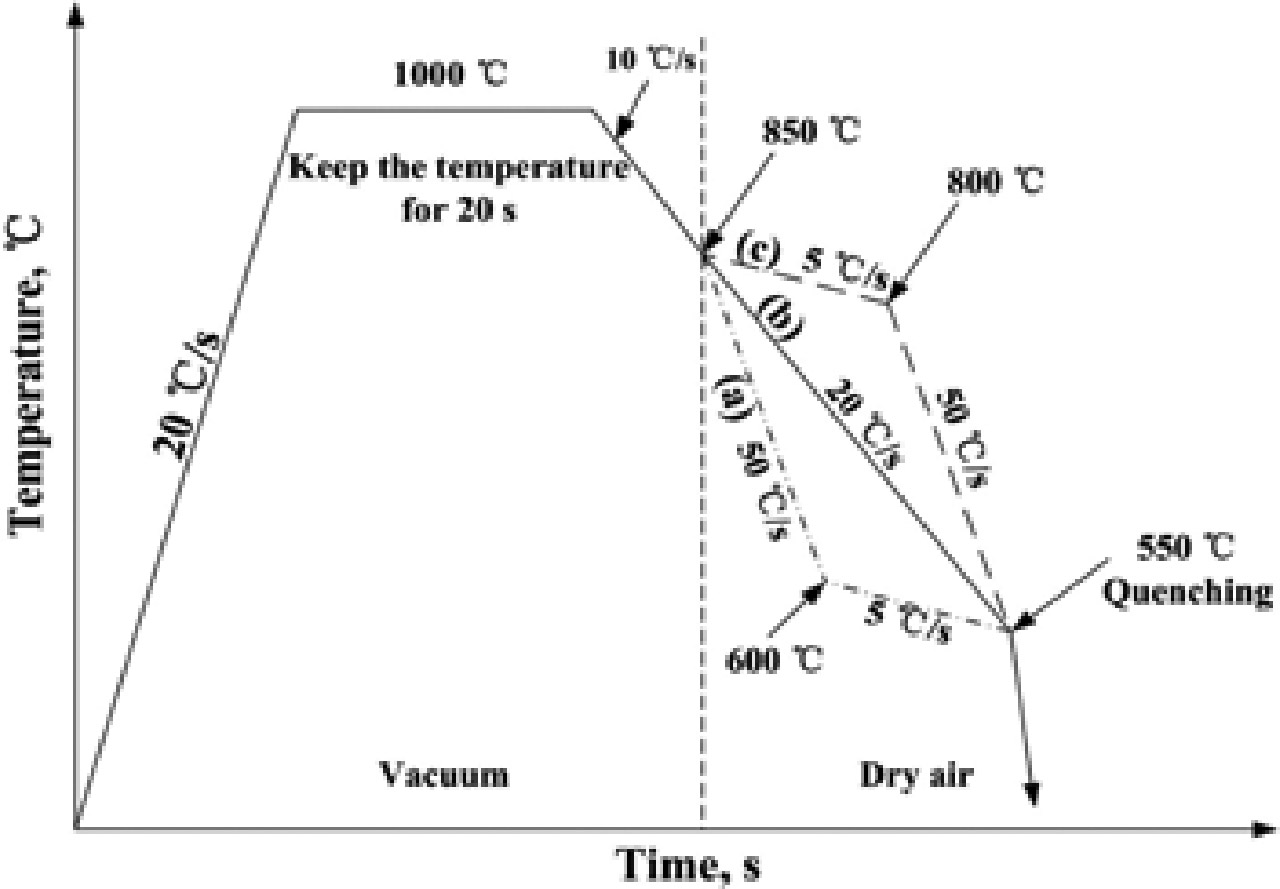
Schematic illustration of the heat-treatment schedule simulating laminar cooling procedure used for oxidation test.
Results and discussion
Oxidation kinetics
It is well known that isothermal oxidation of iron at high temperature follows the parabolic law after an initial oxidation stage, which can be expressed as [18].
where h denotes the thickness of oxide scale, t the oxidation time, and
where
Oxidation kinetics of 510L is determined at temperature ranging from 500 ℃ to 900 ℃ in air for 9 h. The results of oxidation gain weight are shown in Figure 2, and the oxidation rates enhance with increasing temperature in the test. Oxidation kinetics at all temperatures shows that initial fast oxidation period is always followed by slow oxidation period. Weight gain data of the steels indicates that weight gain is a function of time, which follows parabolic law. Plot of

Oxidation kinetics of 510L steel between 500 °C to 900 °C in dry air.
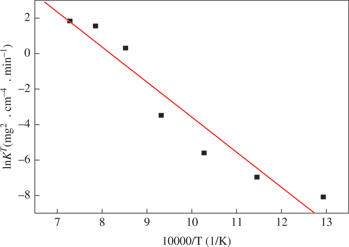
Relationship between lnKT and 1/T for 510L.
Hot strip rolling is a continuous temperature decreasing process. Expression of oxidation kinetics model depending on temperature change is described in eqs (4) to (6). Based on temperature change of strips during hot rolling, the evolution of oxide scale is simulated by empirical formula.
where,
Substituted to eq. (5) leads to
where
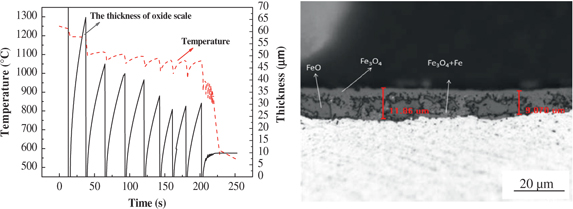
Simulated relationship between temperature and scale thickness and the structure after coiling.
Observation of cross-section and surface morphologies
The test process simulated laminar cooling is shown in Figure 1, and the oxide scale is obtained by the three different cooling processes. The X-ray diffraction (XRD) pattern in Figure 5 indicates that the oxide scale of 510L all consisted of Fe2O3, Fe3O4, FeO at the three cooling rates range from 850 °C to 550 °C. It is worth noting that the diffraction peaks of Fe2O3, Fe3O4, FeO are gradually weakened in the XRD patterns as the sequence of (a), (b) and (c) at three different cooling rates. It can be preliminarily deduced that the thickness of oxide scale in the scheme (c) is thicker than the other cooling rates.
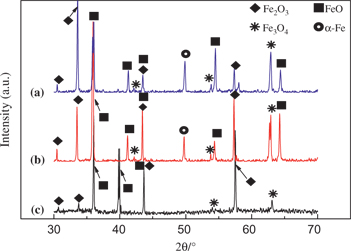
XRD patterns of 510L at different cooling rate (a) Cooling rate from 850 °C to 600 °C at 50 °C/s and then from 600 °C to 550 °C at 5 °C/s; (b) Cooling rate from 850 °C to 550 °C at 20 °C/s; (c) Cooling rate from 850 °C to 800 °C at 5 °C/s and then from 800 °C to 550 °C at 50 °C/s.
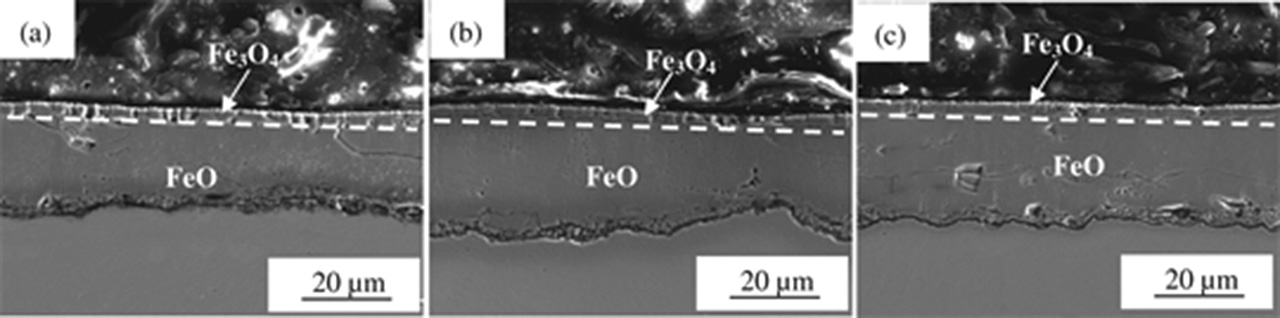
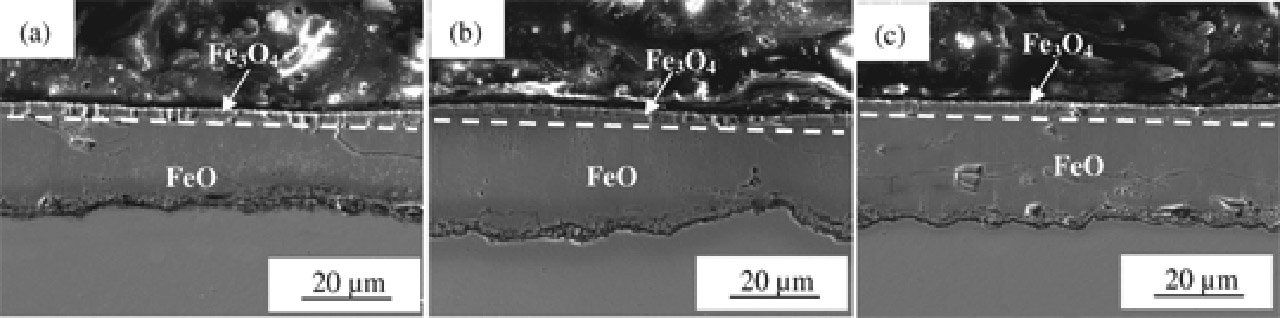
Cross-section of oxide scale structure under different cooling rates (a) Cooling rate from 850 °C to 600 °C at 50 °C/s and then from 600 °C to 550 °C at 5 °C/s; (b) Cooling rate from 850 °C to 550 °C at 20 °C/s; (c) Cooling rate from 850 °C to 800 °C at 5 °C/s and then from 800 °C to 550 °C at 50 °C/s.
The cross-sectional morphologies of 510L steel oxide scale at three different cooling rates are reported in Figure 6. It can be seen that the structure of oxide scales consisting of two significantly delamination zones is marked out by white imaginary line, outer Fe3O4 layer and FeO inner layer. Moreover, the outmost layer Fe2O3 cannot appear in cross-section micrographs due to the content is low of Fe2O3 in the oxide scale. Therefore, the Fe2O3 layer is set to one of unit ratio in the oxide scale, the thickness ratio of Fe2O3, Fe3O4 and FeO layers in different cooling rates are 1:15:84, 1:13:86 and 1:11:88, respectively. The simulated temperature of oxide scales is range from 850 ℃ to 550 ℃, on the one hand Fe3O4 is restored to become FeO by Fe2+, and on the other hand Fe2O3 and Fe2+ react to become Fe3O4. For the former reaction, the content of FeO is higher with the cooling rate lower in high temperature above 550 °C.
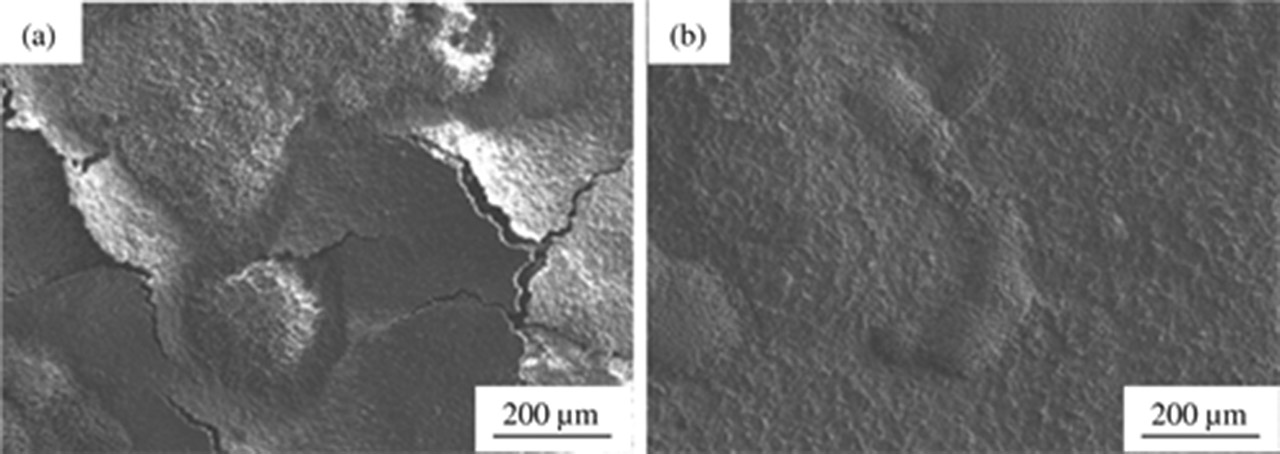
Surface morphology for 510L steel at different cooling rates. (a) Cooling rate from 850 °C to 600 °C at 50 °C/s and then from 600 °C to 550 °C at 5 °C/s; (b) Cooling rate from 850 °C to 550 °C at 20 °C/s.
Figure 7 shows the surfaces morphologies of 510L steel cooled from 850 °C to 550 °C at different cooling rates. As indicated in Figure 7(a), the oxide scale spalls when the cooling rate from 850 °C to 600 °C at 50 °C/s and then from 600 °C to 550 °C at 5 °C/s. In addition, the oxide scale only is observed foaming and spallation not occurs by the surface morphological image in Figure 7(b).
Mechanism and mathematic model of spallation
Adhesion of the oxide scale to the steel substrate depends on various parameters, such as the thickness of oxide scale, growth rate, the stress state, the interfacial energy and the elastic properties of the oxide scales [19]. Cracking, buckling and spallation of the oxide scale decrease the protective capability of oxide scale and then lead to the formation of oxide dust clouds. The aim of this work is to establish a model to predict the spallation of secondary and tertiary scale during hot rolling.
![Figure 8: Failures occurring in the oxide scale depending on heating or cooling stress fields [20, 22].](/document/doi/10.1515/htmp-2015-0248/asset/graphic/j_htmp-2015-0248_fig_008.jpg)
The failures occurring are subjected to interface stress which is caused by the difference between thermal expansion coefficients of substrate and oxide scale [21]. As shown in Figure 8, it is significant to recognize the function of the stress field within the oxide scale. When the temperature increases, the oxide scale is in tensile stress state and cracks develops in the oxide scale. On the contrary, the stress field is compressive and the oxide scale buckles in the cooling process. Once exceeding the critical spallation stress, the buckled oxide scale can separate from the internal oxide layer which leading to crack and eventually spall. Therefore, the spallation mathematic model is established by empirical formula base on the results of test and previous studies [22, 23]. The derived course of this model as follow:
Critical strain (
where,
where
Critical temperature change
where
No stress relaxation is considered to occur since the time intervals are small. The strain rate
From eq. (4) the time increment for the growth of the oxide layer from
where
Combine eqs (10) and (11) yields to
The change of internal energy is caused by straining which is given by
where
The critical thickness for scale broken is calculated by
where
Thermal coefficient values of the oxide scale used for mathematic model are listed in Table 2. The starting and finishing temperature of laminar cooling are 850 °C and 550 °C respectively. The cross-section morphology oxide scales in Figure 6 indicate that the content of FeO is more than 84 % within the oxide scale, which is accordance with the previous studies [22, 23, 24, 25]. Moreover, the phase of substrate is assumed as austenite to short-cut calculation due to the two-phase region (austenite+ferrite or austenite+bainite) of low-carbon microalloyed steel exists in temperature range from 850 °C–550 °C [9,25]. Some parameters are related to the oxide scale structure according to eq. (15). Therefore, the mathematic model based on empirical formula is built and used to explore the oxide scale structure in the laminar cooling process.
| Substrate | FeO | Fe3O4 | Fe2O3 | |
|---|---|---|---|---|
| 16.5+0.11T | 3.2 | 1.5 | 1.2 | |
| 8050–0.5T | 7750 | 5000 | 4900 | |
| 587.8+0.069T | 725 | 870 | 980 | |
| (–0.043T+43.5)0.5 | 130 | 208 | 219 | |
| 0.30 | 0.36 | 0.19 | 0.29 | |
| – | 3.0 | 4.5 | 6.0 | |
| 1.5×10⁻⁵ | 1.22×10⁻⁵ | – | – |
Note:
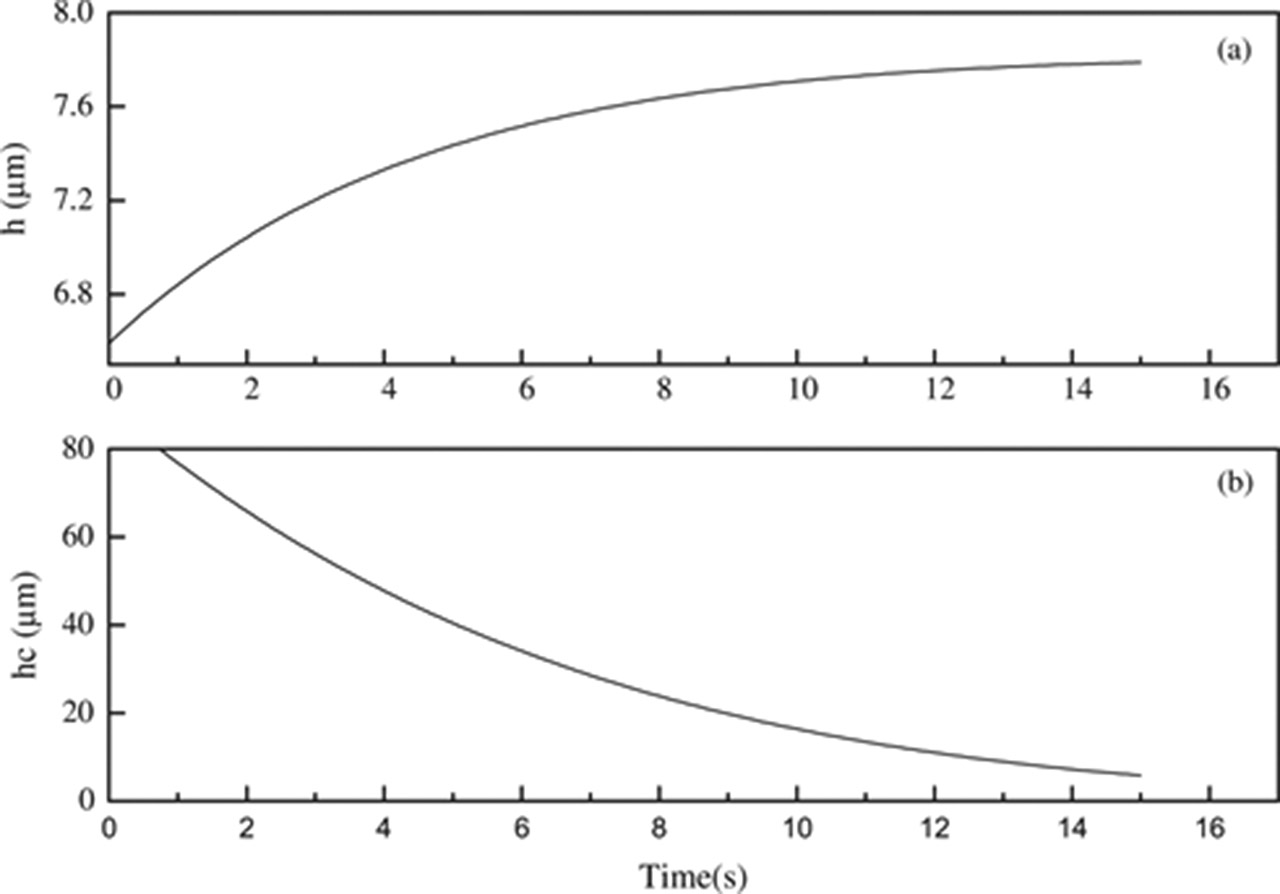
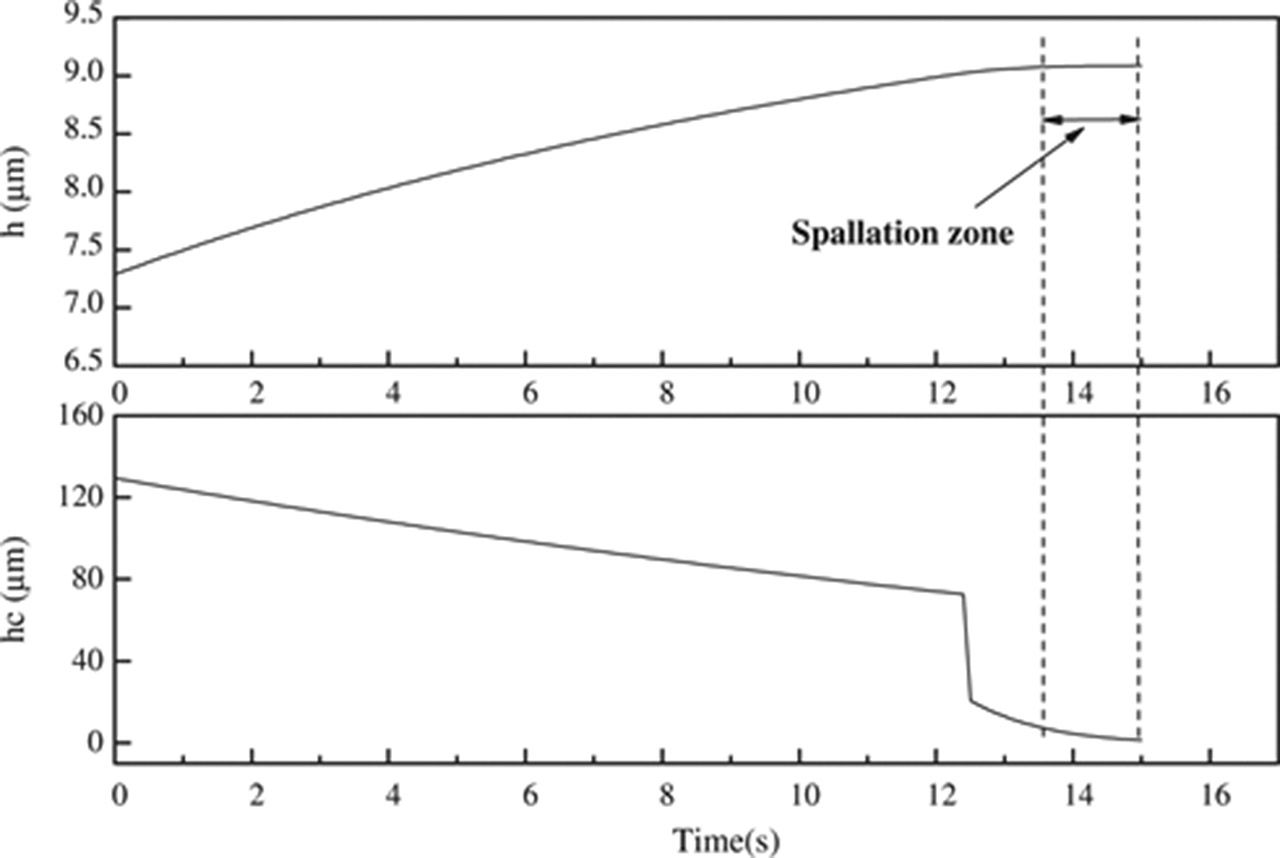
The stress at the interface of oxide/structure depends on the difference of contractions ratio between oxide scale and metal substrate when the temperature decreases. Figures 9–11 show the variation thickness of the oxide scale at laminar cooling stage with different cooling rates according to eq. (7). The critical value for oxide scale spallation was calculated with the aid of eq. (15). The results of the models shown in Figures 9–11 reveal that the thickness of oxide scale reaches the critical value of spallation at different time and cooling rates. The spallation zone of oxide scales is marked in between two black parallel imaginary lines in Figures 9 and 11, and the adhesion of oxide scale decreases when the thickness of oxide scale exceeds 9.4 μm. As shown in Figure 10, the thickness of oxide scale of the cooling rate at 20 °C/s fails to reach the calculated critical value and no spallation zone develops.
Growth of the oxide layer as a function of time from 850 °C to 600 °C at 50 °C/s and then from 600 °C to 550 °C at 5 °C/s. (a) Actual measure value; (b) Calculated critical value.
Growth of the oxide layer as a function of time from 850 °C to 550 °C at 20 °C/s. (a) Actual measure value; (b) Calculated critical value.
Growth of the oxide layer as a function of time from 850 °C to 800 °C at 5 °C/s and then from 800 °C to 550 °C at 50 °C/s. (a) Actual measure value; (b) Calculated critical value.
Conclusions
The high temperature oxidation kinetics of 510L steel follows the parabolic law and provides corresponding parabolic rate constants for the oxide scale growth on the surface of hot rolling plate in different temperature.
The thermal simulation test of laminar cooling stage indicates that the reasonable control of the cooling rate to reduce spallation appearing on the surface of oxide scale. In this present work, the spallation phenomenon fails to appear when the cooling rate of 6 mm 510L steel is set as 20 °C/s.
The mathematical model of predicting spallation behavior is an effective method for controlling the thickness of oxide scale to improve the surface quality of hot rolling plate.
Funding statement: This work was supported by National Natural Science Foundation of China (51204047), National Science and Technology Planning Project (2011BAE13B04) and Fundamental Research Funds for the Central Universities (N130407004).
References
[1] D. Young, High Temperature Oxidation and Corrosion of Metals, Elsevier, London (2008).Search in Google Scholar
[2] J. Ruan, Y. Pei and D. Fang, Acta Mech., 223 (2012) 2597–2607.10.1007/s00707-012-0739-4Search in Google Scholar
[3] L. Suarez and P. Rodriuez-Calvillo, Oxid. Met., 75 (2011) 281–295.10.1007/s11085-010-9231-5Search in Google Scholar
[4] L. Suarez, Y. Houbaert and X.V. Eynde, Corros. Sci., 51 (2009) 309–315.10.1016/j.corsci.2008.10.027Search in Google Scholar
[5] Q. Zhu, H. Zhu and A. Tieu, Corros. Sci., 53 (2011) 3603–3611.10.1016/j.corsci.2011.07.004Search in Google Scholar
[6] A. Saillard, M. Cherkaoui and L. Capolungo, Philos. Mag., 90 (2010) 2651–2676.10.1080/14786431003680780Search in Google Scholar
[7] X.L. Yu, Z.Y. Jiang and X.D. Wang, Adv. Mater. Res., 415 (2012) 853–858.Search in Google Scholar
[8] X.L. Yu, Z.Y. Jiang and J.W. Zhao, Corros. Sci., 90 (2015) 140–152.10.1016/j.corsci.2014.10.005Search in Google Scholar
[9] X.L. Yu, Z.Y. Jiang and J.W. Zhao, Corros. Sci., 85 (2014) 115–125.10.1016/j.corsci.2014.04.006Search in Google Scholar
[10] X.L. Yu, Z.Y. Jiang and J.W. Zhao, Appl. Mech. and Mater., 395 (2013) 273–278.10.4028/www.scientific.net/AMM.395-396.273Search in Google Scholar
[11] Y. Su, G.Y. Fu, Q. Liu and W.J. Bi, High Temp. Mater. Process., 29 (2010) 143–157.10.1515/HTMP.2010.29.3.143Search in Google Scholar
[12] Y. Su, S.K. Zhang, G.Y. Fu, Q. Liu and Y.Z. Tang, High Temp. Mater. Process., 35 (2016) 177–183.10.1515/htmp-2014-0171Search in Google Scholar
[13] R.Y. Chen and W.Y.D. Yuen, Mater. Sci. Forum, 522–523 (August 2006) 451–460.10.4028/www.scientific.net/MSF.522-523.451Search in Google Scholar
[14] X.L. Yu, Z.Y. Jiang and D.B. Wei, Wear, 302 (2013) 1286–1294.10.1016/j.wear.2013.01.015Search in Google Scholar
[15] X.L. Yu, Z.Y. Jiang and D.J. Yang, Adv. Mater. Res., 572 (2012) 249–254.10.4028/www.scientific.net/AMR.572.249Search in Google Scholar
[16] W.H. Sun, A.K. Tieu and Z.Y. Jiang, J. Mater. Process. Technol., 155–156 (2004) 1307–1312.10.1016/j.jmatprotec.2004.04.167Search in Google Scholar
[17] M. Krzyzanowski and J.H. Beynon, J. Mater. Process. Technol., 125–126 (2002) 398–404.10.1016/S0924-0136(02)00290-XSearch in Google Scholar
[18] Z. Liu and W. Gao, High Temp. Mater. Process., 17 (1998) 231–260.Search in Google Scholar
[19] C.M. Sellars and J.A. Whiteman, Met. Technol., 8 (1981) 10–18.10.1179/030716981803275451Search in Google Scholar
[20] L. Chang and S.N. Lin, Oxid. Met., 63 (2005) 131–144.10.1007/s11085-004-3196-1Search in Google Scholar
[21] N. Birks, G.H. Meier and F.S. Pettit, Introduction to the High Temperature Oxidation of Metals, Cambridge University Press, London (2006).10.1017/CBO9781139163903Search in Google Scholar
[22] M. Garza, A. Artigas, A. Monsalve and R. Colas, Oxid. Met., 70 (2008) 137–148.10.1007/s11085-008-9107-0Search in Google Scholar
[23] H.E. Evans, Int. Mater. Rev., 40 (1995) 1–40.10.1179/imr.1995.40.1.1Search in Google Scholar
[24] X.L. Yu, Z.Y. Jiang and D.B. Wei, Adv. Sci. Lett., 13 (2012) 219–223.10.1166/asl.2012.3771Search in Google Scholar
[25] R.Y. Chen and W.Y.D. Yeun, Oxid. Met., 59 (2003) 433–468.10.1023/A:1023685905159Search in Google Scholar
© 2017 Walter de Gruyter GmbH, Berlin/Boston
This article is distributed under the terms of the Creative Commons Attribution Non-Commercial License, which permits unrestricted non-commercial use, distribution, and reproduction in any medium, provided the original work is properly cited.
Articles in the same Issue
- Frontmatter
- Research Articles
- Calculation of the Spontaneous Polarization and the Dielectric Constant for the Ferroelectric N(CH3)4HSO4 Using the Mean Field Model
- Structural Properties of Molten CaO–SiO2–P2O5–FeO System
- Direct Acid Leaching of Vanadium from Stone Coal
- Effects of Cu Distribution on Solidification Microstructure in Transition Layer of Cu/Al Composite Ingot Prepared by Casting Aluminum Method
- Plasma Methods of Obtainment of Multifunctional Composite Materials, Dispersion-Hardened by Nanoparticles
- Microstructure and Diffusion Behaviors of the Diffusion Bonded Mg/Al Joint
- Phosphorus Segregation in Meta-Rapidly Solidified Carbon Steels
- Effects of Temperature and Strain Rate on Tensile Deformation Behavior of 9Cr-0.5Mo-1.8W-VNb Ferritic Heat-Resistant Steel
- Zn1–xCdxO Microtubes: Synthesis and Optical Properties Using Direct Microwave Irradiation
- Oxidation Kinetics and Spallation Model of Oxide Scale during Cooling Process of Low Carbon Microalloyed Steel
- Effect of Cr2O3 Pickup on Dissolution of Lime in Converter Slag