Application of response surface methodology for optimization of parameters for microwave heating of rare earth carbonates
-
Shaohua Yin


Abstract
Microwave heating has been applied in the field of drying rare earth carbonates to improve drying efficiency and reduce energy consumption. The effects of power density, material thickness and drying time on the weight reduction (WR) are studied using response surface methodology (RSM). The results show that RSM is feasible to describe the relationship between the independent variables and weight reduction. Based on the analysis of variance (ANOVA), the model is in accordance with the experimental data. The optimum experiment conditions are power density 6 w/g, material thickness 15 mm and drying time 15 min, resulting in an experimental weight reduction of 73%. Comparative experiments show that microwave drying has the advantages of rapid dehydration and energy conservation. Particle analysis shows that the size distribution of rare earth carbonates after microwave drying is more even than those in an oven. Based on these findings, microwave heating technology has an important meaning to energy-saving and improvement of production efficiency for rare earth smelting enterprises and is a green heating process.
1 Introduction
Currently, rare earth carbonates are the common intermediate products or finished products [1]. In the extraction and separation process of rare earths, regardless of methods, the rare earth solution obtained is precipitated using ammonium bicarbonate or oxalic acid to achieve the rare earth compounds which convert into rare earth oxides by the method of roasting at a high temperature, which includes two steps: dehydrating and roasting the rare earth carbonate. In general, the rare earth carbonates obtained from normal aging without further treatment have high moisture contents of about 30–80%. Literature indicates that a large part of heat is used to remove the moisture according to the heating curve of rare earth carbonates during the process of roasting. That is, the drying process of rare earth carbonates is an important step in the production of rare earth oxides [2]. In the conventional drying process of rare earth carbonates, they are usually dried in an oven for 1.5–2 h, which causes some disadvantages such as lower efficiency in thermal utilization and longer heating time.
Currently, microwave heating has been widely applied in the fields of drying various kinds of materials and products such as agricultural, chemical, food product, textile, paper, lumber and so on [3]. Few studies have been reported on drying the rare earth carbonates via microwave heating; however, microwave heating has some advantages of alternative heating, fast heating, energy conservation and environmental protection [4]. Therefore, the above advantages will make the microwave heating in the field of drying rare earth carbonates application extensively.
Recently, response surface methodology (RSM) has been attracted great attention as a collection of mathematical and statistical techniques useful for analyzing the effects of several independent variables, and assessing the relationships between the response values and the independent variables, also, RSM has been widely applied in the chemical engineering optimization [5–7]. Compared with the conventional methods like single variable optimization and orthogonal experimental designs, RSM has many advantages such as being more economical, needing fewer experiment numbers, studying interaction between parameters and response, predicting of the response and checking of method adequacy [8, 9]. To the best of our knowledge, there has been no report on the optimization of experiments on drying the rare earth carbonates by microwave heating using RSM.
In this study, RSM is used to optimize the drying experiments of rare earth carbonates for adsorbed water by microwave heating for further evaluation the dehydrating effects. Power density, material thickness and drying time are selected as the three main influential factors in the experiments, and weight reduction (WR) is the response value. Moreover, we adopt the central composite design (CCD) of RSM to study the effects of the three variables on the response [10] and to determine the optimal conditions and unit energy consumption for the drying rare earth carbonates process, which provides the basic information for the application of microwave heating in the process of drying rare earth carbonates industry.
2 Experimental
2.1 Materials and apparatus
The mixed rare earth carbonates are supplied by the Chinalno Guangxi Nonferrous Chongzuo Rare-Earth Development Ltd. Co., and its moisture content is 74% which is measured using a standard hot-air oven at 105℃ by retaining the samples for 24 h from three replicate measurements.
Microwave heating equipment is shown in Figure 1. Microwave reactor is made by Key Laboratory of Unconventional Metallurgy, Ministry of Education, Kunming University of Science and Technology. The microwave drying experiments are carried out in a lab-made microwave muffle furnace, and the microwave equipment consists of four sections: two magnetrons at the frequency of 2.45 GHz and 1.5 kW power which are cooled by water circulation as microwave sources; a waveguide for transporting microwaves; a resonance cavity to manipulate microwaves for a specific purpose; and a control system to regulate the temperature and microwave power. The inner dimensions of the microwave cavity are 260 mm in height, 420 mm in length and 260 mm in width. Continuous temperature measurement during microwave heating is a major problem, so a thermocouple (connected to the computer system) with a thin layer of aluminum shielding can be employed to measure temperature, and placed at the closest proximity to the material.

Schematic of a microwave drying system 1 – power controller; 2 – ampere meter; 3 – voltmeter; 4 – thermocouple; 5 – electronic balance; 6 – materials; 7 – power switch; 8 – start switch; 9 – stop switch; 10 – computer system.
A model of Rise-2002 laser particle size analyzer (Jinan Rise Science & Technology Co., Ltd.) is employed to measure the size distributions.
2.2 Experimental procedure
For each experiment, the mixed rare earth carbonates of 100 g are weighed and then placed in a quartz boat at experimental set thickness (5–20 mm). The drying experiments are carried out as followed: the samples placed in a quartz boat are put in the microwave muffle furnace, after then start the switch to dry at different power levels and drying time. On starting the drying experiments and after each 1 min interval, the weight of the material (Wt) is noted down until the weight of the samples remains constant. Experiments are randomized in order to minimize the effects of unexplained variability in the observed responses due to extraneous factors. All the experiments are performed in triplicate, and the average value is used for the determination the weight reduction (WR) and unit energy consumption (η, electricity needed per kilogram moisture removed), and these parameters are calculated by the following equations:
where Wi is the initial weight of rare earth carbonates (100 g), Wt the weight of rare earth carbonates after drying for any time t (g); P, h and m are the microwave power (kW), drying time (h) and water loss (g), respectively.
2.3 RSM modeling
RSM is an empirical statistical modeling technique employed for multiple regression analysis using quantitative data obtained from properly designed experiments to solve multivariate equations simultaneously [11]. In this study, the effects of three independent variables (χ1, power density; χ2, material thickness; and χ3, drying time) at five levels are investigated using a central composite design (Table 1). Based on the single-factor test (Figure 2), each independent variable is coded at five levels between –1.682, –1, 0, +1, and +1.682, whereas power density: 2.64–9.36 w/g; material thickness: 6.59–23.41 mm, and drying time: 6.59–23.41 min, respectively. Coding of the variables is done according to the following equation [12]:
where Xi is a coded value of the variable; χi is the actual value of variable; χ0 is the actual value of the Xi at the center point level; and Δχ is the step change of variable.
A second-order polynomial equation is employed to fit the experimental data to identify the relevant model terms using statistical software (Design Expert 8.0.7.1). A quadratic model, which also includes the linear model, can be described as [13]:
where Y is the response; β0 is the model intercept coefficient; βi is the linear coefficient; βii is the quadratic coefficients and βij is the interaction coefficients; n is the number of factors (independent variables); χi and χj indicate the independent variables; the terms χi χj and χi2 represent the interaction and quadratic terms, respectively.
Coded value of the independent variables and experimental ranges.
| Independent variables | Coded variable levels | ||||
| −1.682 | −1 | 0 | 1 | 1.682 | |
| Power density (w/g) | 2.64 | 4 | 6 | 8 | 9.36 |
| Material thickness (mm) | 6.59 | 10 | 15 | 20 | 23.41 |
| Drying time (min) | 6.59 | 10 | 15 | 20 | 23.41 |
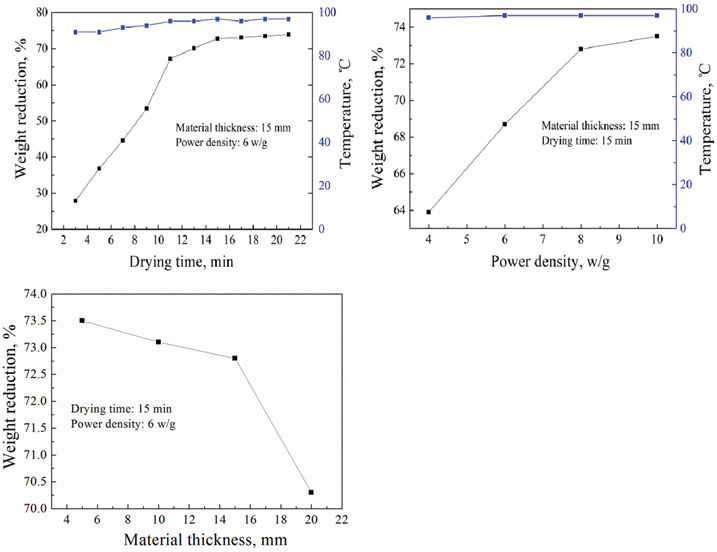
Effects of drying time, power density and material thickness on the weight reduction.
The statistical analysis is performed using Design Expert Statistical Software package 8.0.7.1 (Stat Ease Inc., Minneapolis, USA). The experimental data are analyzed using multiple regressions, and the significance of regression coefficients is evaluated by F-test. Modeling is started with a quadratic model including linear, squared, and interaction terms, and the model adequacy is checked in terms of the values of R2 and adjusted R2. The significant terms in the model are found by Pareto analysis of variance (ANOVA) for each response, and ANOVA tables are generated. The regression coefficients are used to make statistical calculations to generate response surface plots from the regression models [14].
3 Results and discussion
3.1 RSM modeling
Experiments are performed in order to find out the optimum combination and study the effect of process parameters on weight reduction, and the results are given in Table 2.
Experimental design matrix and results.
| Run | Independent variables | Response values | |||
| Power density, χ1 (w/g) | Material thickness, χ2 (mm) | Drying time, χ3 (min) | Weight reduction (%) | Unit energy consumption (kW·h/kg) | |
| 1 | 4 | 10 | 10 | 69 | 0.96 |
| 2 | 8 | 10 | 10 | 73 | 1.82 |
| 3 | 4 | 20 | 10 | 63 | 1.06 |
| 4 | 8 | 20 | 10 | 67 | 1.99 |
| 5 | 4 | 10 | 20 | 71.1 | 1.87 |
| 6 | 8 | 10 | 20 | 74 | 3.6 |
| 7 | 4 | 20 | 20 | 69.3 | 1.92 |
| 8 | 8 | 20 | 20 | 72.1 | 3.69 |
| 9 | 2.64 | 15 | 15 | 64 | 1.03 |
| 10 | 9.36 | 15 | 15 | 70 | 3.34 |
| 11 | 6 | 6.59 | 15 | 71 | 2.11 |
| 12 | 6 | 23.41 | 15 | 61 | 2.46 |
| 13 | 6 | 15 | 6.59 | 69 | 0.96 |
| 14 | 6 | 15 | 23.41 | 73.6 | 3.18 |
| 15 | 6 | 15 | 15 | 73.1 | 2.19 |
| 16 | 6 | 15 | 15 | 72.8 | 2.06 |
| 17 | 6 | 15 | 15 | 72.6 | 2.06 |
| 18 | 6 | 15 | 15 | 73.1 | 2.05 |
| 19 | 6 | 15 | 15 | 72.6 | 2.06 |
| 20 | 6 | 15 | 15 | 72.7 | 2.06 |
The weight reduction of 74% indicates that adsorbed water of rare earth carbonate is completely removed under some conditions using microwave heating. In addition, the weight reduction and unit energy consumption are up to 73% and 2.05 kW·h/kg (the unit energy consumption is 1.43 kW·h/kg under large-scale experiences) at material thickness of 15 mm and drying time of 15 min under power density 6 w/g, where the analysis of energy consumption is discussed in detail in Section 3.4. The results show that microwave heating has the advantage of energy conservation.
Pareto analysis of variance (ANOVA) is employed to analyze the adequacy and fitness of the models, and the results indicate that the equation adequately represents the actual relationship between the independent variables and the responses (Table 3). The ANOVA result for the WR shows F-value of 16.39 (p-value < 0.0001), which implies that the model is significant. According to p-values (<0.05 is significant), it can be shown that the first-order main effects (χ1, χ2 and χ3) are highly significant. The second-order effects of χ1 and χ2 on WR have the more significant effect among the other second-order effects. Meanwhile, the effects of the interaction χ2χ3 show high significant effects. Other variables have non-significant effect on WR due to the p-value is more than 0.05. Coefficient of determination (R2) and adj-R2 are calculated to check the adequacy and fitness of the model. According to the literature, a better fitting correlation coefficient for a model should be required at least a value of 0.80, while a high R2 value means a better agreement between the calculated and observed results within the range of experiments [15–17]. The value of R2 is calculated to be 0.9365, which implies that 94% of experimental data are compatible. The use of an adj-R2 is to evaluate the model adequacy and fitness. The value of adj-R2 (0.8794 for WR) is also high to advocate for a high significance the model.
The coefficient of variation (CV%) indicates the relative dispersion of the experimental points from the predictions of the second-order polynomial (SOP) models [18]. The value of CV is also low as 1.86, which indicates that the deviations between experimental and predicted values are low. Adequate precision measures the signal to noise ratio (greater than 4) is desirable [19]. In this work, the ratio is found to be 14.3, which indicates an adequate signal.
Figure 3(A) indicates that the values of the responses predicted from the empirical model are in agreement with the observed values in the range of the operating variables investigated, providing evidence for the validity of the regression model. Actual values are corresponding to response data for a particular run arranged by the CCD, and the predicted values are evaluated using the approximating functions generated for the models, namely eq. (5).
Figure 3(B) presents the relationship between residual plots and normal probability for WR of rare earth carbonates. The approximately straight line indicates that the variance of the original observation is a constant for all values, and provides a satisfactory result. Therefore, the empirical model is adequate to describe the WR of rare earth carbonates.
ANOVA for the experimental results of the design.
| Source | Coefficient | Sum of squares | Df | Mean squares | F-value | p-value |
| Model | 252.06 | 9 | 28.01 | 16.39 | < 0.0001 | |
| 6.23 | 41.44 | 1 | 41.44 | 24.06 | 0.0006 | |
| 1.29 | 77.43 | 1 | 77.43 | 45.32 | < 0.0001 | |
| 0.01 | 36.21 | 1 | 36.21 | 21.19 | 0.0010 | |
| 1.25 × 10⁻³ | 1.25 × 10⁻³ | 1 | 1.25 × 10⁻³ | 7.32 × 10⁻⁴ | 0.9790 | |
| 0.03 | 0.66 | 1 | 0.66 | 0.39 | 0.5478 | |
| 0.04 | 8.61 | 1 | 8.61 | 5.04 | 0.0486 | |
| −0.41 | 38.51 | 1 | 38.51 | 22.54 | 0.0008 | |
| −0.08 | 56.97 | 1 | 56.97 | 33.35 | 0.0002 | |
| −4.58 × 10⁻³ | 0.19 | 1 | 0.19 | 0.11 | 0.7464 | |
| Std. Dev. | 1.31 | |||||
| C.V.% | 1.86 | |||||
| Adeq. Prec | 14.3 | |||||
| R2 | 0.9365 | |||||
| Adj R2 | 0.8794 | |||||
| Pred R2 | 0.5263 |
Quadratic models are fitted to the experimental data to obtain the regression models. The second-order polynomial equation is fitted with the experimental results obtained on the basis of experimental design. The final equation obtained in terms of coded factors is given below:

Normal % probability plots (A) and Predicted values versus experimental values for WR (B).
3.2 Response surface and contour plots
Surface plots as a function of two factors by holding the other factors at fixed levels are more helpful in understanding both the main and the interactive effects of these two factors. The response surface curves are plotted to understand the interaction of the variables and to determine the optimum level of each variable for needed response. The response surface plot for weight reduction (WR) is shown in Figure 4(A)–(C), and it shows the effects of process variables such as power density, material thickness and drying time on weight reduction.

Response surface plot for weight reduction.
The higher power density and lower material thickness promote rapid weight reduction (Figure 4(A)) and thus reduce the time required to reach constant weight. During dehydration process, water removal from the material is always accompanied by the simultaneous counter diffusion of solutes from the osmotic medium into the tissue [20–22]. This effect is generally attributed by the influence of the diffuse properties of water and solutes. As for the confirmed material, the heat capacity cp and microwave absorption coefficient μ are constant, according to the law of conservation of energy, the greater the microwave power P absorbed by material and the higher the heating rate, which improves the dehydrating rate.
Increase in the power density and drying time leads to more water loss which causes an increase in the weight reduction (Figure 4(B)). The effect of high power density and drying time yields better water transfer characteristics on the product surface. An increase in the power density can be possibly explained that the larger the power density, and the more the microwave energy absorbed for the unit mass of rare earth carbonates, this contribute to shorter time to reach a water gasification point. An increase in the WR with time is well understood, as the number of intergranular fracture increases with increase in the microwave exposure time. The increase in the level of material thickness leads to decrease the water loss gradually, whereas drying time was not affected significantly (Figure 4(C)).
3.3 Process optimization and validation
Optimum condition for drying rare earth carbonates using microwave heating is determined to obtain maximum weight reduction and minimum unit energy consumption. Second-order polynomial model obtained in this study is utilized for each response in order to obtain specified optimum conditions. In order to optimize the weight reduction and unit energy consumption, the following constraint conditions are taken (1) power density (4–8 w/g), (2) material thickness (10–20 mm), and (3) drying time (10–20 min). Weight reduction value must be as high as possible and unit energy consumption value must be as low as possible. The Derringer’s desirability function method which has been proven to be a useful statistical tool to solve multi-problems [23] is employed to optimize the process variables for covering the criteria, and the optimum conditions are found to be power density of 6 w/g, material thickness of 15 mm, and drying time of 15 min, respectively (shown in Table 4).
Validation of the model.
| Power density (w/g) | Material thickness (mm) | Drying time (min) | Weight reduction | Unit energy consumption | ||||
| Predicated | Experimental | Relative error | Predicated | Experimental | Relative error | |||
| 6 | 15 | 15 | 72.75 | 72.97 | 0.30% | 2.08 | 2.06 | 0.96% |
Under this optimum condition, weight reduction and unit energy consumption are found to be 72.75% and 2.08 kw·h/kg with overall desirability value of 1.00. Drying experiments are conducted at this optimum condition, weight reduction values with three replications are 73%, 72.6%, and 73.3%, with an average of 72.97%, the corresponding unit energy consumption values are 2.05 kW·h/kg, 2.07 kW·h/kg and 2.05 kW·h/kg, with an average of 2.06 kW·h/kg. The variation values of 0.3% and 0.96% for weight reduction and unit energy consumption are calculated between the predicted and experimental values. This indicates the suitability of the developed models.
3.4 Comparison of microwave and conventional heating
Microwave and conventional heating are compared with their drying capability. The results of the statistical analysis and comparison between microwave and conventional heating are shown in Figure 5. The results show that the weight reduction approaches to an almost constant (74%) at drying time of 15 min under microwave power 600 W (power density 6 w/g) at material thickness of 15 mm, while it needs 120 min at power 2,050 W using conventional heating to reach an almost 74% dehydration, indicating that the microwave heating has higher ability rather than the conventional heating for the dehydration of rare earth carbonates. In addition, from the point of view of energy consumption, the power consumption is 0.2 kW·h using microwave heating when the weight reduction reaches 74%, while the power consumption is 4.1 kW·h using oven heating.
According to the above experimental data, microwave drying has advantage over oven heating. In this experience, energy consumption calculated is not based on the long time continuous production due to the intermittent experiments, so there is bigger difference, the energy consumption is larger than that in the continuous production. If the drying test is conducted continuously, the energy consumption will be reduced on the actual production. But it could provide guidance for practical production.
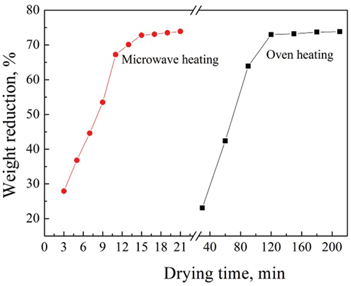
Comparison of effect of drying time on weight reduction using oven and microwave heating.
3.5 Particle analysis
In the present study, the size distributions of rare earth carbonates after drying using microwave heating and oven under the optimum experimental conditions are shown in Figure 6. As can be seen that, the size distribution of rare earth carbonates after drying in an oven exhibits an abnormal distribution, and the averaged size (D50) of 20.65 μm is much larger, while after drying using microwave heating, it appears a normal distribution, and D50 is 13.42 μm which is smaller than the former, indicating that microwave drying has a role of refinement. This may be explained that, the process of microwave heating is from inside to outside, the atoms in the rare earth carbonates under microwave heating produce oscillation, and then generate heat due to friction, which reduces the activation energy of material and sintering temperature quickly, the powder particles grow up too late before complete densification.

Size distribution of rare earth carbonates under different conditions: (1)-Drying using oven; (2)-Drying using microwave radiation.
4 Conclusion
The weight reduction and unit energy consumption of drying rare earth carbonates using microwave heating and the effect of operational parameters on weight reduction are investigated using RSM. The most important conclusions from this work are summarized as follows:
The optimum conditions are identified to be a power density of 6 w/g, material thickness of 15 mm, and drying time of 15 min, with an estimated weight reduction and unit energy consumption of 72.75% and 2.08 kW·h/kg, respectively.
Comparison experiments of microwave and oven heating show that microwave heating has some advantages of rapid dehydration and energy conservation.
The averaged size of rare earth carbonates after drying using microwave heating is much smaller and more even than that after drying using an oven.
Funding statement: Funding: The authors are grateful for the financial support by National Natural Science Foundation of China (51504116) and Kunming University of Science and Technology Personnel Training Fund (KKSY201452088) and Young and Middle-aged Academic Technology Leader Backup Talent Cultivation Program in Yunnan Province, China (2012HB008).
References
[1] R.L. Frost, A. López, R. Scholz, Y.F. Xi and F.M. Belotti, J. Mol. Struct., 105 (2013) 221–225.10.1016/j.molstruc.2013.07.051Suche in Google Scholar
[2] Y.X. Li, M. Li, X.B. He, P.G. Hu and Z.Y. Gu, Trans. Nonferrous Met. Soc. China, 9 (1999) 165–170.Suche in Google Scholar
[3] E.H. Kazi, Int. J. Miner. Process., 57 (1999) 1–24.10.1016/S0301-7516(99)00009-5Suche in Google Scholar
[4] W.H. Zi, J.H. Peng, X.L. Zhang, L.B. Zhang and J. Liu, J. Taiwan Inst. Chem. Eng., 44 (2013) 678–685.10.1016/j.jtice.2012.12.022Suche in Google Scholar
[5] G.P. Sharma and S. Prasad, J. Food Eng., 75 (2006) 441–446.10.1016/j.jfoodeng.2005.04.029Suche in Google Scholar
[6] P. Mitra and V. Meda, Drying Technol., 27 (2009) 1089–1096.10.1080/07373930903221101Suche in Google Scholar
[7] S.K. Giri and S. Prasad, Drying Technol., 25 (2007) 901–911.10.1080/07373930701370407Suche in Google Scholar
[8] M. Azizpour, M. Mohebbi, M.H.H. Khodaparast and M. Varidi, Drying Technol., 32 (2014) 374–384.10.1080/07373937.2013.794829Suche in Google Scholar
[9] T. Miletic, S. Ibric and Z. Duric, Drying Technol., 32 (2014) 167–179.10.1080/07373937.2013.811593Suche in Google Scholar
[10] N. Aslan, Powder Technol., 185 (2008) 80–86.10.1016/j.powtec.2007.10.002Suche in Google Scholar
[11] K. Dehghani, A. Nekahi and M.A.M. Mirzaie, Mater. Des., 31 (2010) 1768–1775.10.1016/j.matdes.2009.11.014Suche in Google Scholar
[12] C. Chellamboli and M. Perumalsamy, RSC Adv., 4 (2014) 22129–22140.10.1039/C4RA01179ASuche in Google Scholar
[13] Z.Y. Hu, M. Cai and H.H. Liang, Sep. Purif. Technol., 61 (2008) 266–275.10.1016/j.seppur.2007.10.016Suche in Google Scholar
[14] J. Prakash Maran, V. Sivakumar, K. Thirugnanasambandham and R. Sridhar, Alexandria Eng. J., 52 (2013) 507–516.10.1016/j.aej.2013.06.007Suche in Google Scholar
[15] B.S. Kaith, R. Sharma, S. Kalia and M.S. Bhatti, RSC Adv., 4 (2014) 40339–40344.10.1039/C4RA05300ASuche in Google Scholar
[16] G. Chen, K. Xiong, J.H. Peng and J. Chen, Adv. Powder. Technol., 21 (2010) 331–335.10.1016/j.apt.2009.12.017Suche in Google Scholar
[17] A.R. Khataee and G. Dehghan, J. Taiwan. Inst. Chem. Eng., 42 (2011) 26–33.10.1016/j.jtice.2010.03.007Suche in Google Scholar
[18] P.M. Jeganathan, S. Venkatachalam, T. Karichappan and S. Ramasamy, Prep. Biochem. Biotechnol., 44 (2014) 56–67.10.1080/10826068.2013.791629Suche in Google Scholar PubMed
[19] J.P. Maran and S. Manikandan, Dye. Pigm., 95 (2012) 465–472.10.1016/j.dyepig.2012.06.007Suche in Google Scholar
[20] D.R. Bongirwar and A. Sreenivasan, J. Food. Sci. Technol., 14 (1997) 104–112.Suche in Google Scholar
[21] J. Hawkes and J.M. Flink, J. Food. Process. Preserv., 2 (1978) 265–284.10.1111/j.1745-4549.1978.tb00562.xSuche in Google Scholar
[22] M.N. Islam and J.M. Flink, J. Food Technol., 17 (1982) 387–403.10.1111/j.1365-2621.1982.tb00194.xSuche in Google Scholar
[23] Z.Y. Hu, M. Cai and H.H. Liang, Sep. Purif. Technol., 61 (2008) 266–275.10.1016/j.seppur.2007.10.016Suche in Google Scholar
©2016 by De Gruyter
This article is distributed under the terms of the Creative Commons Attribution Non-Commercial License, which permits unrestricted non-commercial use, distribution, and reproduction in any medium, provided the original work is properly cited.
Artikel in diesem Heft
- Frontmatter
- Short Communication
- Microscale Interface Synthesis of Ni-B Amorphous Nanoparticles from NiSO4 by Sodium Borohydride Reduction in Microreactor
- Research Articles
- The Effect of Post-heat Treatment on the Microstructures of Single Crystal DD6 Superalloy
- Changes in the Material Properties of Steel 1.4762 Depending on the Temperature
- Formation of Ti5Si3 by Combustion Synthesis in a Self-Propagating Mode: Experimental Study and Numerical Simulation
- Effect of Processing Parameters on Plasma Jet and In-flight Particles Characters in Supersonic Plasma Spraying
- Crystallization Behavior and Growing Process of Rutile Crystals in Ti-Bearing Blast Furnace Slag
- Evaluation of Anticorrosion Performance of New Materials for Alternative Superheater Tubes in Biomass Power Plants
- Investigation on Burden Particle Softening and Melting Process under High Reduction Potential Condition
- Application of response surface methodology for optimization of parameters for microwave heating of rare earth carbonates
- Interfacial Evolution of Cement and Steel in CO2 Dissolved Solution Under High Temperature and High Pressure
- Study of Dissolution Process of Solid Cu in Liquid Al
- The Pin-Loaded Small One-Bar Specimen in Use to Determine Uniaxial and Multiaxial Creep Data
- Vertical Compensation Friction Stir Welding of 6061-T6 Aluminum Alloy