Assessment of measurement uncertainty of immunoassays and LC-MS/MS methods for serum 25-hydroxyvitamin D
-
Etienne Cavalier

 ,
Harjit P. Bhattoa
,
Annemieke C. Heijboer
,
Harjit P. Bhattoa
,
Annemieke C. Heijboer

Abstract
Objectives
Accurate 25-hydroxyvitamin D (25-(OH)D) assays are essential for defining vitamin D status and ensuring appropriate clinical decisions. Standardization efforts, including the Vitamin D Standardization Program (VDSP), aim to minimize assay variability. This study evaluates the measurement uncertainty (MU) of various 25-(OH)D assays and their ability to detect physiologically relevant changes over time.
Methods
Seventeen pooled and eight single-donor serum samples were analyzed using two LC-MS/MS methods and 13 immunoassays, each applied in two independent laboratories. Imprecision, bias, and MU were assessed relative to the University of Ghent’s reference measurement procedure (RMP). Results were compared against analytical performance specifications (APS) from VDSP, JCTLM-TF-RMSI, and IFCC C-BM based on physiological 25-(OH)D variation. A graphical approach was introduced to visualize MU in relation to clinical relevance.
Results
LC-MS/MS methods consistently met all APS criteria. Several immunoassays also achieved acceptable MU, although significant bias or inter-laboratory variability was observed for some of them. Slightly more than half of the assays met the desirable Joint Committee for Traceability in Laboratory Medicine Task Force on Reference Measurement System Implementation (JCTLM TF-RMSI) MU threshold (≤10 %), while four exceeded the minimum acceptable limit (≤15 %). The IFCC C-BM physiological approach identified a similar subset of assays. The graphical representation effectively illustrated method reliability across the tested concentration range.
Conclusions
Measurement uncertainty remains a major challenge for 25-(OH)D assays. The integration of MU-based APS and graphical visualization provides a comprehensive framework for evaluating assay performance. These findings highlight the importance of selecting assays capable of reliably detecting clinically meaningful changes in vitamin D status.
Introduction
Standardization of total 25-hydroxyvitamin D assays is essential for ensuring consistent clinical and epidemiological interpretations [1]. Standardization efforts aim to minimize inter-assay variability, establish reliable concentration thresholds for defining vitamin D status, and provide a framework for vitamin D supplementation guidelines. The Vitamin D Standardization Program (VDSP) and its Vitamin D Standardization-Certification Program (VDSCP), led by the Centers for Disease Control and Prevention (CDC) and the International Federation of Clinical Chemistry and Laboratory Medicine (IFCC) [2], are key initiatives promoting standardization and method comparability across laboratories. These programs have supported the development of three Joint Committee for Traceability in Laboratory Medicine (JCTLM) recognized reference measurement procedures (RMPs), which are maintained at the National Institute of Standards and Technology (NIST) [3], Ghent University [4], and the CDC [5].
To ensure meaningful standardization, analytical performance specifications (APS) must be established. The APS historically applied in vitamin D measurement standardization are those proposed by Stöckl et al. [6], as endorsed by the clinical laboratory community and agreed upon at the 1999 Stockholm Consensus Conference on Analytical Goals in Laboratory Medicine [7]. The VDSP has incorporated these APS into its certification process, whereby a 25-(OH)D method is considered “certified” if its calibration bias remains within±5 % of the CDC RMP and its imprecision, expressed as the coefficient of variation (CV), is<10 % [8]. The VDSCP also evaluates individual sample pass rates, i.e., the percentage of samples meeting bias criteria. Recent evaluations have shown that LC-MS/MS methods achieve higher pass rates (40–92 %, mean 65 %) compared to immunoassays (10–45 %, mean 27 %), highlighting the substantial variability between methods [9].
While standardization efforts focus primarily on bias and imprecision, measurement uncertainty (MU) provides a complementary approach for evaluating assay performance. MU integrates both systematic and random errors, offering a more comprehensive assessment of an assay’s reliability. In this manuscript, MU refers to the expanded measurement uncertainty (U), calculated from the combined standard uncertainty (uc), which itself incorporates both standard uncertainty due to imprecision (uIMP) and bias (uBIAS), as defined by ISO 20914. The JCTLM Task Force on Reference Measurement System Implementation (JCTLM TF-RMSI) has proposed APS specifically targeting combined MU, defining a desirable threshold of ≤10 % and a minimum acceptable threshold of ≤15 % for clinical samples [10]. Additionally, the IFCC–IOF Committee on Bone Metabolism (IOF-IFCC C-BM) has also proposed a complementary approach based on MU to derive APS for 25-(OH)D based on the 2014 Milan Strategic Conference “Model 1” [11]. The APS we proposed are based on the physiological variation of 25-(OH)D concentrations over time. Specifically, data from the European Biological Variation Study (EuBIVAS) [12] demonstrated that, in healthy individuals, 25-(OH)D concentrations naturally increased by 31.6 % over a 10-week period (April-June) [13]. This increase is primarily driven by seasonal effects, where progressive sun exposure during spring and summer enhances cutaneous vitamin D synthesis, leading to a biologically expected rise in circulating 25(OH)D levels. To evaluate whether analytical methods can reliably detect such physiologically meaningful changes, an assay should exhibit MU that allows for statistically significant differentiation of this increase. The minimum required MU for this purpose can be determined using the following formula:
where Z represents the Z-score, corresponding to different levels of statistical confidence. Since this variation represents an increase, the statistical approach must be one-sided. According to Fraser [14], the probability of detecting a significant rise can be classified as.
Likely detection (p>0.80) → Z=0.84
More than likely detection (p>0.90) → Z=1.28
Very likely detection (p>0.95) → Z=1.65
Virtually certain detection (p>0.99) → Z=2.33
Thus, an assay capable of detecting a 31.6 % increase in 25-(OH)D over 10 weeks with these probabilities must have an MU of ≤26.5 % (likely detection), ≤17.4 % (more than likely detection), ≤13.6 % (very likely detection) and ≤9.6 % (virtually certain detection), respectively.
In this multicentric study, we used the University of Ghent (UGhent) RMP to evaluate the performance of two distinct LC-MS/MS methods and 13 immunoassays. Performance was compared against the APS defined by the VDSP, JCTLM TF-RMSI and IOF-IFCC C-BM approach based on physiological variation of 25-(OH)D over 10 weeks. Finally, we introduced a novel graphical approach based on MU, providing an intuitive visualization of method performance to complement traditional APS evaluations.
Materials and methods
Preparation of samples
A collection of 17 pooled serum samples was prepared by pooling at least 10 remnant fresh samples whose concentration had been previously estimated with the DiaSorin Liaison method, routinely used at the CHU de Liège. The selection of the samples to create the collection was designed to cover a wide measurement range, spanning from the LOQ of most methods to approximately 100 μg/L. Based on their concentration, selected samples were pooled into seventeen 100 mL tubes (Greiner BioOne, REF 227261, Frickenhausen, Germany), which were stored at −80 °C. The collection of samples ceased once each vial contained approximately 50 mL of serum. It took approximately three months to collect the samples to prepare the pools. Once the desired volumes were achieved, pools were thawed at +4 °C, vortexed for 15 s and homogenized for 30 minutes on an orbital shaker at room temperature. They were then centrifuged for 10 min at 4,000 g (39.240 m/s2). After centrifugation, aliquots of 500 µL were prepared in 2 mL screw-capped tubes (Eppendorf Protein LoBind, REF 0030108132, Oldenburg in Holsten, Germany) for the samples dedicated to LC-MS/MS analysis and Sarstedt micto tubes (REF 72.694.007, Nümbrecht, Germany) for the immunoassays. These aliquots were stored at −80 °C until shipment to participating laboratories and the University of Ghent on dry ice or measurement in the CHU de Liege laboratory.
A second set of samples was prepared by using eight single donor samples which were purchased from SLR Research Corporation (Carlsbad, CA). Each donation contained a portion of 250 mL single donations consisting of separated serum which were selected based on the nominal 25-(OH)D concentration provided by the manufacturer. The donations were shipped on dry ice and the aliquots were prepared following the same process as described above.
Two aliquots of 500 µL of each sample were shipped to each participating laboratory to allow a measurement in duplicates on two consecutive days (n=4 determinations per sample).
The University of Ghent measured the samples in duplicates with the RMP for their 25-(OH)D3 concentration reporting results in ng/g. 25-(OH)D2 was not measured because of the limited sample volume available.
Examination methods and participating laboratories
Two LC-MS/MS methods, developed by the CHU de Liège (BE) and the Amsterdam UMC (NL), were used in this study. These methods have been described elsewhere [15], 16]. Of note, the method of the CHU de Liège is recognized as meeting the standardization criteria for traceability to the JCTLM RMPs by the CDC VDSCP [9]. In addition, the LC-MS/MS method from CHU de Liège was also used to quantify 24,25-dihydroxyvitamin D and three-epi-25-hydroxyvitamin D3 in the samples. These measurements were not part of the primary objective of the study and are therefore not included in the main analysis. The results are provided i Supplementary Table 1 for information.
Samples were also analyzed using various immunoassays across multiple clinical laboratories. The full list of the methods and their characteristics is detailed in Table 1. Most of the measurements were conducted by two different laboratories for each evaluated method, and manual methods were performed by two different experienced technicians when possible.
Assay manufacturers, testing laboratories, and instrumentation used for 25-(OH)D measurements.
| Examination manufacturer (short name in bold) with full name, country of origin) | Site | Examination model | Examination type | Reagent lot no | Calibrator lot no. |
|---|---|---|---|---|---|
| Abbott Diagnostics, Germany | CHU de Liege, Belgium | Architect 25-OH vitamin D; ALINITY serie i |
CLIA/CMIA | 43057UD00 | 40423UD00A-F (6 levels) |
| Abbott Diagnostics, Germany | Amsterdam UMC, Endocrine Laboratory, The Netherlands | Architect 25-OH vitamin D; ALINITY serie i |
CLIA/CMIA | 45580UDOO | 45248UD00 (6 levels) |
| Beckman-Coulter, USA | CHU de Liège, Belgium | Access 25(OH) vitamin D total; Access-2 |
CLIA | 234057 | 234224 |
| Beckman-Coulter, USA | Dienst laboratoriumgeneeskunde AZ Delta, Roeselare, Belgium | Access 25(OH) vitamin D total; Access 2 |
CLIA | 234057 | 234427 |
| DiaSorin, Italy | CHU de Liège, Belgium | Liaison 25 OH vitamin D total; Liaison XL |
CLIA | 136088–4972 | 136088 |
| DiaSorin, Italy | University of Debrecen, Department of Laboratory Medicine, Hungary | Liaison 25 OH vitamin D total; Liaison XL |
CLIA | 136263 | 136263 |
| Diazyme, USA | CHU de Liège, Belgium | EZ vitamin D assay Cobas 6,000 c501 |
PETIA | VL006210-10-01 | VLS02210-0,501 |
| Fujirebio, Japan | CHU de Liège, Belgium | 25-OH vitamin D; Lumipulse G1200 |
CLIA | 8XX3031 | 8YX3052E |
| Fujirebio, Japan | Laboratoire Hospitalier Universitaire de Bruxelles, Belgium | 25-OH vitamin D; Lumipulse G1200 |
CLIA | 8XX3082 | 8YX3052E |
| Immunodiagnostic systems (IDS), UK | CHU de Liège, Belgium | IDS-iSYS 25-hydroxy vitamin D IDS-iSYS |
CLIA | 104261–0 | 104217–0 |
| Immunodiagnostic systems (IDS), UK | Rigshospitalet Adeling for Klinisk Biokemi, Glostrup, Denmark | IDS-iSYS 25-hydroxy vitamin D IDS-iSYS |
CLIA | 103840–0 | 104217–0 |
| Siemens Healthineers, USA | Groupe santé CHC-Laboratoire d’Analyses Médicales, Liège, Belgium | Vitamin D total (VitD); Atellica IM |
CLIA | 25940190 | C3490 |
| Siemens Healthineers, USA | CHR Citadelle, Lliège, Belgium | Vitamin D total (VitD); Atellica IM |
CLIA | 1851563 | C3485 |
| Roche Diagnostics, Germany | CHU de Liège, Belgium | Vitamin D total II; Cobas e411 |
CLIA | 64622701 | 63910401 |
| Roche Diagnostics, Germany | University of Debrecen, Department of Laboratory medicine, Hungary | Vitamin D total II; Cobas e411 |
CLIA | 64622702 | 639104 |
| Snibe, China | CHU de Liège, Belgium | 25-OH vitamin D (CLIA) Maglumi ×3 |
CLIA | 262220211 | 262220211 |
| Snibe, China | University of Ddebrecen, Department of Laboratory medicine, Hungary | 25-OH vitamin D (CLIA) Maglumi ×3 |
CLIA | 262230111 | 262230111 |
| Ortho Clinical Diagnostics, USA | Rigshospitalet Afdeling for Klinisk biokemi, Glostrup, Denmark | tVITD Vitros 5,600 |
CLIA | 1830 | 175 |
| Ortho Clinical Diagnostics, USA | CHU UCL Namur, Belgium | tVITD VITROS 3600 |
CLIA | 1730 | 0167 |
| Immunodiagnostic Systems (IDS), UK | CHU de Liège, Belgium | 25-Hydroxy vitamin D EIA (IDS); Thermo fischer multiskan FC with incubator |
EIA | J52547 | J52359-65 (7 levels) |
| Diasource, Belgium | CHU de Liège, Belgium | 25OH vitamin D total ELISA; Thermo fischer multiskan FC with incubator |
ELISA | 2206–5986 | 2110-3612/02 2109-3402/02 |
| Affimedix, USA | CHU de Liège, Belgium | 25 OH quantitative vitamin D rapid test Cube reader |
IC | 22112182 | 22112182 |
-
This Table provides details on the immunoassays included in the study, including the manufacturer, country of origin, participating laboratory, examination model, examination type, reagent lot number, and calibrator lot number. Assays were conducted in multiple laboratories across different institutions. CLIA, chemiluminescent immunoassay; CMIA, chemiluminescent microparticle immunoassay; PETIA, particle-enhanced turbidimetric immunoassay; EIA, enzyme immunoassay; ELISA, enzyme-linked immunosorbent assay; IC, immunochromatographic assay.
The examinations were performed using routine laboratory operating procedures under a total quality management system. Commercial immunoassays were operated according to the manufacturers’ instructions, and all laboratories followed internal quality control procedures to ensure result validity. Results were reported in µg/L to one significant figure after the decimal point.
Data analysis
For each method, the mean and standard deviation (SD) of the four examinations were calculated, and the coefficient of variation (CV, %) was derived. The standard uncertainty due to imprecision uIMP was calculated as:
The standard uncertainty due to bias (uBIAS) was then calculated as:
The combined standard uncertainty (uc) was then computed as.
And the expanded absolute measurement uncertainty (U) was calculated as U=u c × 2
Finally, in order to express the uncertainty in relative terms, the expanded relative measurement uncertainty (Urel), referred to here as CREMU (Combined Relative Expanded Measurement Uncertainty), was derived by normalizing the expanded absolute uncertainty to the UGhent RMP assigned value:
Results
According to the UGhent RMP, serum total 25-(OH)D concentrations in the 17 pooled and eight single-donor samples ranged from 3.4 μg/L to 73.7 μg/L, with a mean of 31.7 μg/L. One sample contained a significant amount of 25-(OH)D2 (∼5 μg/L), as measured by LC-MS/MS methods, and was excluded since UGhent RMP did not provide 25-(OH)D2 measurements in this study. Another low-concentration sample was removed because its 25-(OH)D3 level was at or below the LOQ of several methods. Additionally, one sample from the single-donor set had concentrations below the LOQ of the Ortho system (<8 μg/L) and was excluded from the evaluation of this method only.
The mean imprecision (CV%) and mean bias (%) for serum total 25-(OH)D based on four individual replicate measurements, as well as VDSP performance criteria by assay, are presented in Table 2. Briefly, both LC-MS/MS methods and four automated immunoassays (Beckman-Coulter, DiaSorin, Fujirebio and IDS iSYS and ELISA – even if in one laboratory out of two for these three latter) passed the VDSP criteria for bias and imprecision. The individual sample pass rate, representing the percentage of determinations with bias between ± 5 %, ranged from 0 % (for Diazyme and Roche in one laboratory) to 87 % for the UMC Amsterdam LC-MS/MS. Table 2 also provides a detailed breakdown of bias, imprecision, and measurement uncertainty across participating laboratories. Significant inter-laboratory variability was observed for certain methods. With the Abbott assay, one laboratory exhibited a bias nine times higher than the other, suggesting considerable variability in calibration or operational conditions. Similarly, for DiaSorin, the CV in one lab was three times higher than in the other, indicating substantial differences in precision. Among the two laboratories using Ortho Diagnostics, one displayed extreme bias above 60 %, which remained uncontrolled even after recalibration and reruns with new samples. In ELISA-based methods, operator variability was evident despite all technicians being experienced and using identical instruments under controlled environmental conditions.
Bias, imprecision, and measurement uncertainty for serum 25-(OH)D assays across participating Laboratories.
| Method | Laboratory | Mean CV, % | Mean bias, % | Pass VDSP APS (biais <|5 %| and imprecision<10 % | Ample pass rate (% individual values with bias <±5 %) | Unexpanded MU, % | CREMU, % | Pass JCTLM TF-RMSI desirable APS for standard MU on clinical samples (≤10 %) [10] | Pass JCTLM TF-RMSI minimum acceptable APS for standard MU on clinical samples (≤15 %) [10] | Capacity of detecting a 31.6 % change in 25-(OH)D over 10 weeks (IOF-IFCC C-BM approach) |
|---|---|---|---|---|---|---|---|---|---|---|
| LC-MS/MS | ||||||||||
|
|
||||||||||
| CHU de Liège | A | 3.1 % | 3.5 % | YES | 65.2 % | 2.9 % | 5.7 % | YES | YES | Virtually certain |
| Amsterdam UMC | B | 3.7 % | 2.9 % | YES | 87.0 % | 2.9 % | 5.8 % | YES | YES | Virtually certain |
|
|
||||||||||
| Immunoassays | ||||||||||
|
|
||||||||||
| Abbott | A | 3.3 % | 2.0 % | YES | 30.4 % | 5.1 % | 10.2 % | YES | YES | Very likely |
| Abbott | B | 3.5 % | 18.6 % | NO | 8.7 % | 11.1 % | 22.1 % | NO | YES | Likely |
| Beckman-Coulter | A | 5.3 % | −2.9 % | YES | 34.8 % | 7.2 % | 14.4 % | YES | YES | More than likely |
| Beckman-Coulter | C | 5.1 % | −3.1 % | YES | 30.4 % | 6.9 % | 13.7 % | YES | YES | More than likely |
| DiaSorin | A | 3.2 % | −0.8 % | YES | 43.5 % | 5.0 % | 10.0 % | YES | YES | Very likely |
| DiaSorin | D | 9.9 % | 4.6 % | YES | 34.8 % | 8.0 % | 16.0 % | YES | YES | More than likely |
| Fujirebio | A | 1.7 % | −5.6 % | NO | 56.2 % | 3.4 % | 6.7 % | YES | YES | Virtually certain |
| Fujirebio | E | 3.9 % | 3.9 % | YES | 47.8 % | 4.0 % | 8.0 % | YES | YES | Virtually certain |
| IDS | A | 2.4 % | 5.2 % | NO | 52.2 % | 4.2 % | 8.4 % | YES | YES | Virtually certain |
| IDS | F | 4.9 % | 1.8 % | YES | 65.2 % | 4.3 % | 8.6 % | YES | YES | Virtually certain |
| Roche | A | 5.3 % | 11.5 % | NO | 21.7 % | 10.4 % | 20.7 % | NO | YES | Likely |
| Roche | D | 7.0 % | 17.1 % | NO | 0.0 % | 12.6 % | 25.2 % | NO | YES | Likely |
| Siemens | G | 4.1 % | 28.9 % | NO | 13.0 % | 17.9 % | 35.7 % | NO | NO | Not likely |
| Siemens | H | 6.3 % | 20.1 % | NO | 21.7 % | 14.8 % | 29.5 % | NO | YES | Not likely |
| Snibe | A | 1.4 % | 11.3 % | NO | 17.4 % | 6.7 % | 13.4 % | YES | YES | Very likely |
| Snibe | D | 4.6 % | 5.6 % | NO | 34.8 % | 6.6 % | 13.1 % | YES | YES | Very likely |
| Ortho | F | 7.6 % | 8.6 % | NO | 13.0 % | 10.6 % | 21.2 % | NO | YES | Likely |
| Ortho | H | 6.7 % | 64.2 % | NO | 4.5 % | 38.0 % | 75.9 % | NO | NO | Not likely |
| IDS ELISA | A1 | 8.7 % | 11.1 % | NO | 30.4 % | 10.4 % | 20.8 % | NO | YES | Likely |
| IDS ELISA | A2 | 7.1 % | 4.4 % | YES | 26.1 % | 9.8 % | 19.6 % | YES | YES | Likely |
| DiaSource ELISA | A1 | 16.0 % | 12.9 % | NO | 30.4 % | 15.9 % | 31.8 % | NO | NO | Not likely |
| DiaSource ELISA | A2 | 5.6 % | 17.3 % | NO | 13.0 % | 12.1 % | 24.2 % | NO | YES | Likely |
| Diazyme | A | 3.0 % | −20.3 % | NO | 0.0 % | 12.4 % | 24.8 % | NO | YES | Likely |
| Affimedix | A1 | 7.7 % | 35.1 % | NO | 13.0 % | 25.4 % | 50.7 % | NO | NO | Not likely |
-
This Table presents the mean coefficient of variation (CV, %), mean bias (%), percentage of individual values with bias < ± 5 % (sample pass rate), unexpanded measurement uncertainty (unexpanded MU, %), and combined relative expanded measurement uncertainty (CREMU, %) for each assay. Performance was assessed according to the Vitamin D Standardization Program (VDSP) criteria (bias within ± 5 % and imprecision<10 %) and MU, thresholds based on established analytical performance specifications (APS). The study evaluated 17 freshly prepared pools of serum samples and eight serum donations from healthy volunteers. The capacity of each method to detect a 31.6 % increase in 25-(OH)D concentrations over 10 weeks is categorized as Not likely (p<0.80), Likely (p>0.80), More than likely (p>0.90), Very likely (p>0.95), Virtually certain (p>0.99). A, CHU de Liège; A1 and A2, experienced technicians from the CHU de Liège; B, Amsterdam UMC; C, AZ Delta; D, University of Debrecen; E, Laboratoire Hospitalier Universitaire de Bruxelles; F, Rigshospitalet; G, CHR Citadelle; Groupe CHC; H2CCHU UCL Namur. APS, analytical performance specifications; VDSP, vitamin D standardization program; MU, measurement uncertainty; CREMU, combined relative expanded measurement uncertainty; CV (%), coefficient of variation; bias (%), systematic error deviation from the reference measurement procedure; LC-MS/MS, liquid chromatography-tandem mass spectrometry; ELISA, enzyme-linked immunosorbent assay.
To further assess assay performance, measurement uncertainty of the methods was also evaluated against the different APS frameworks described above. The two LC-MS/MS and the methods from Beckman, DiaSorin, Fujirebio, IDS iSYS and Snibe met the JCTLM TF-RMSI desirable APS for standard Mu on clinical samples (≤10 %) in all the laboratories whereas the methods from Abbott and the IDS ELISA were successful in one out of two centres; All the other methods failed to meet these APS. The “minimum acceptable” APS, set at (≤15 %) was met by all methods, except four of them: Siemens, Ortho and Diasource (in one out of two participating laboratories) and Affimedix.
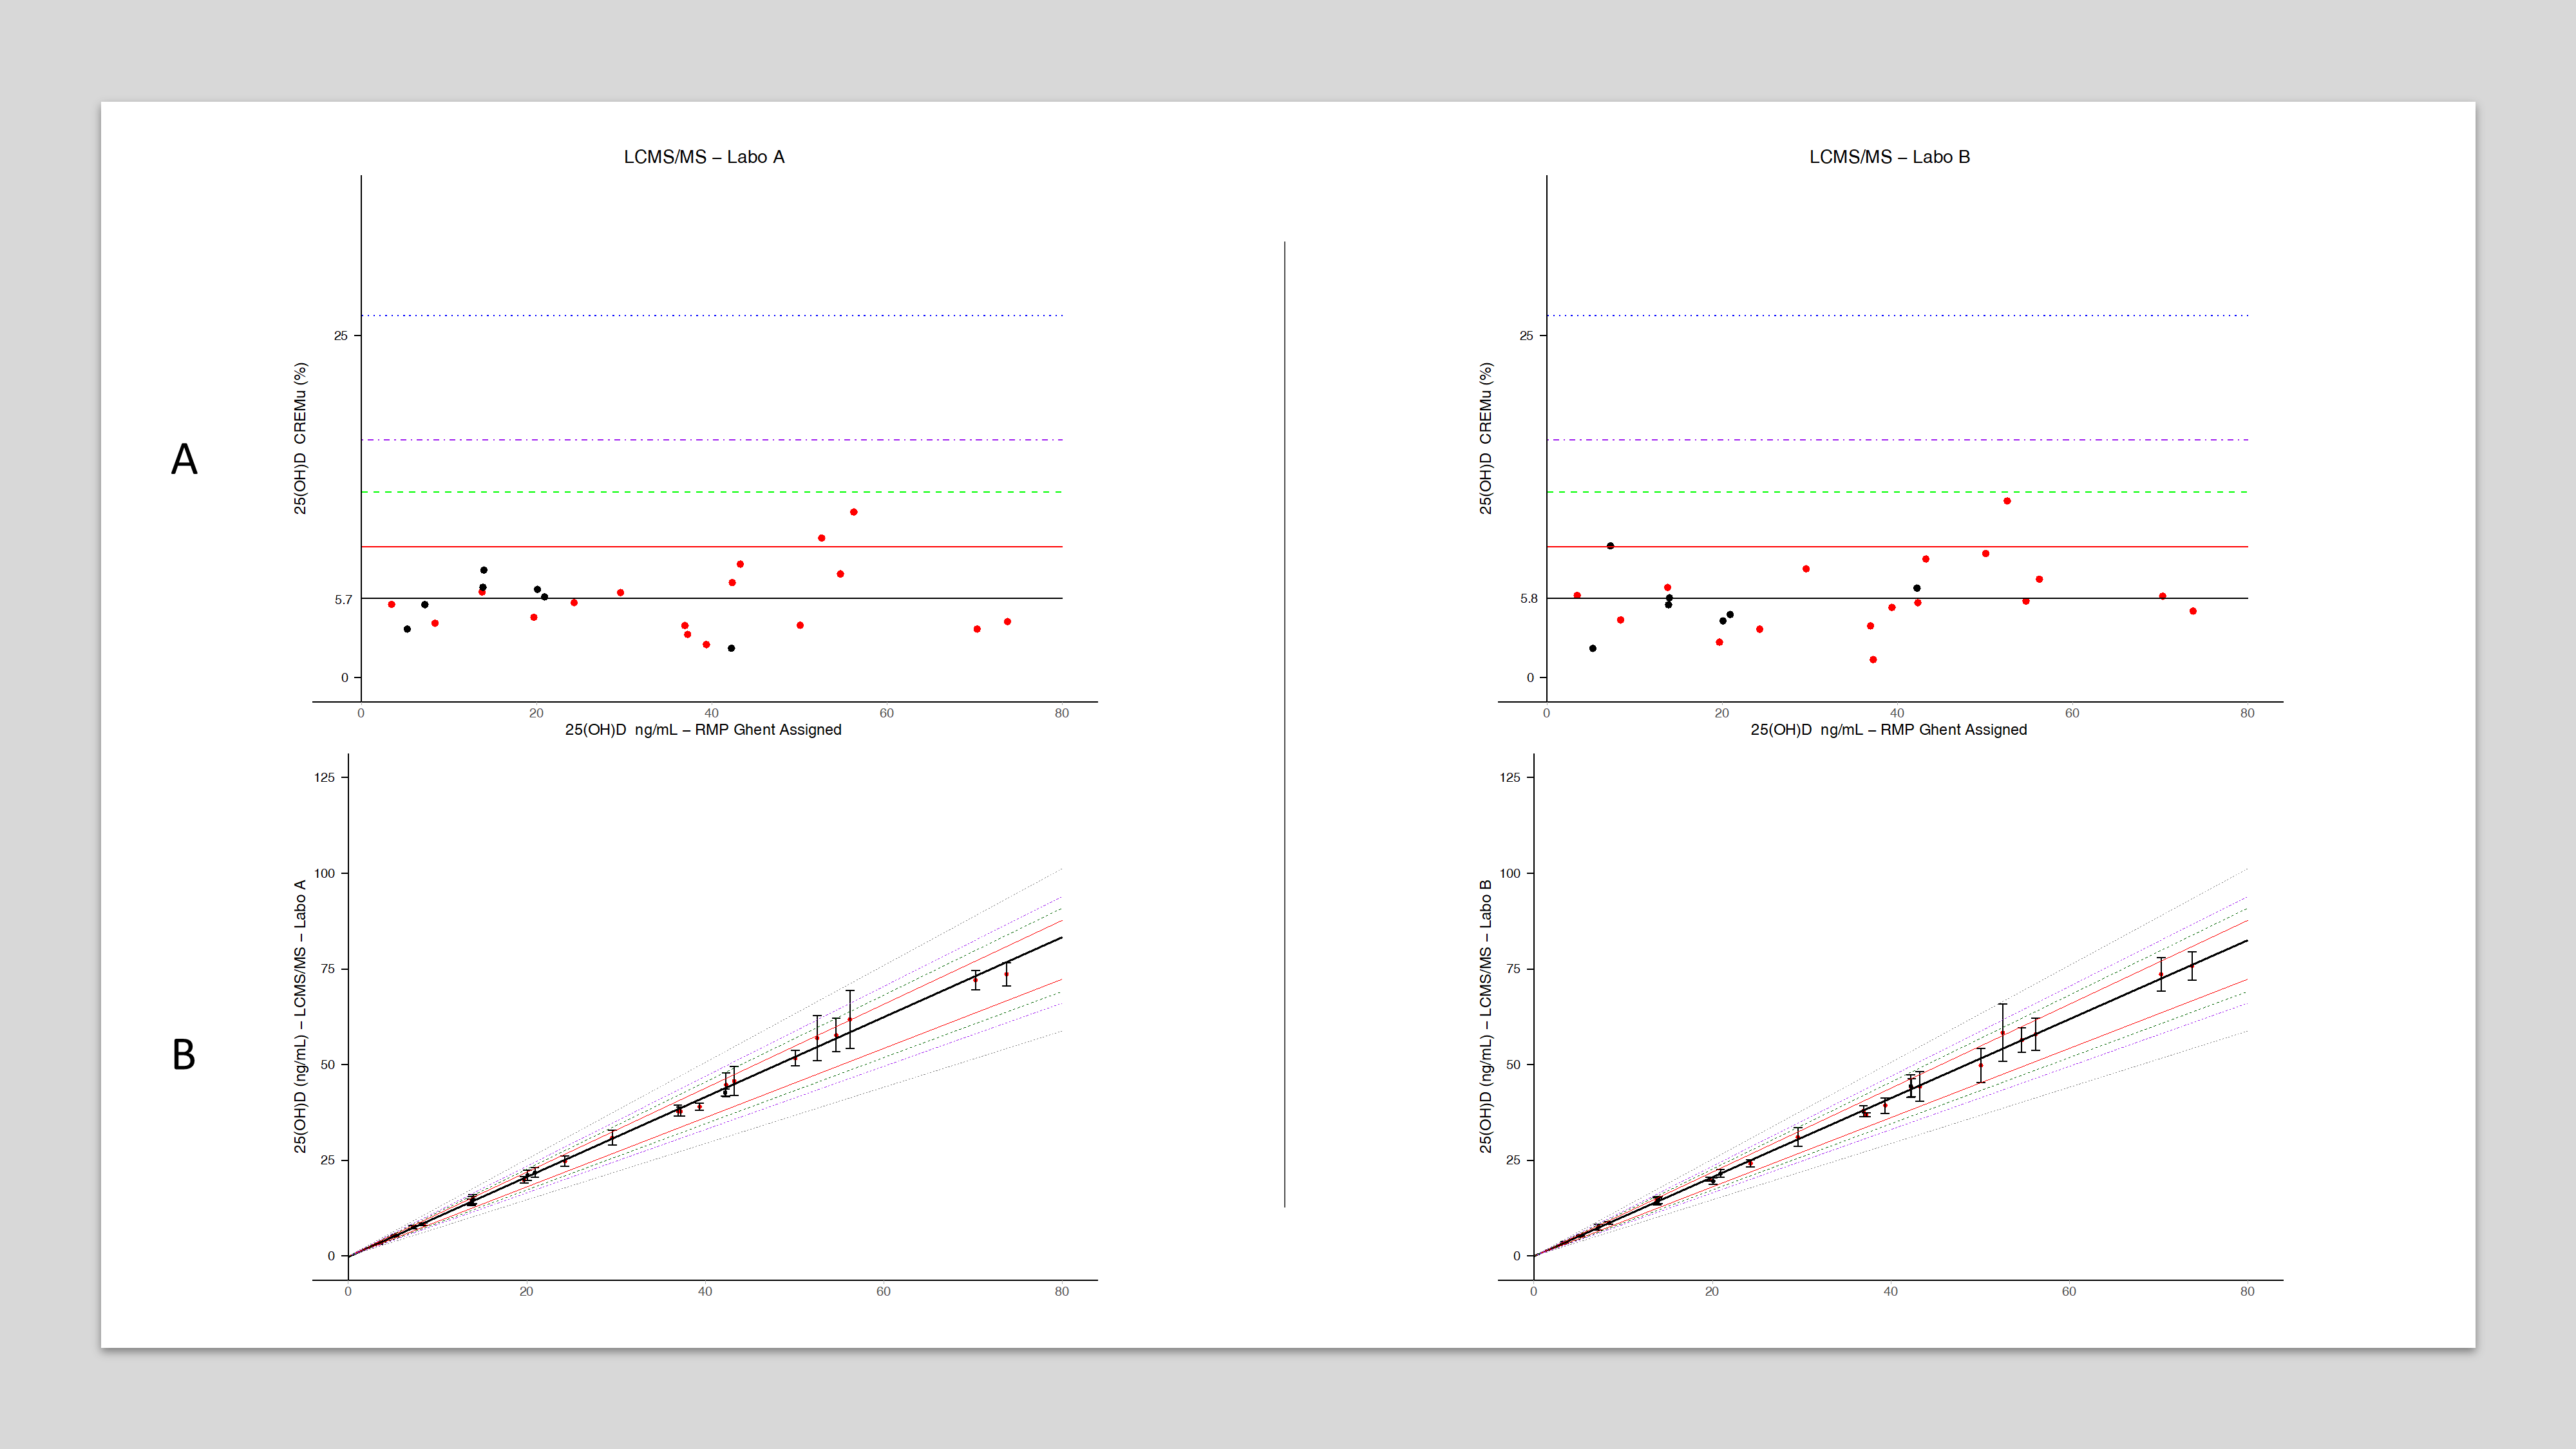
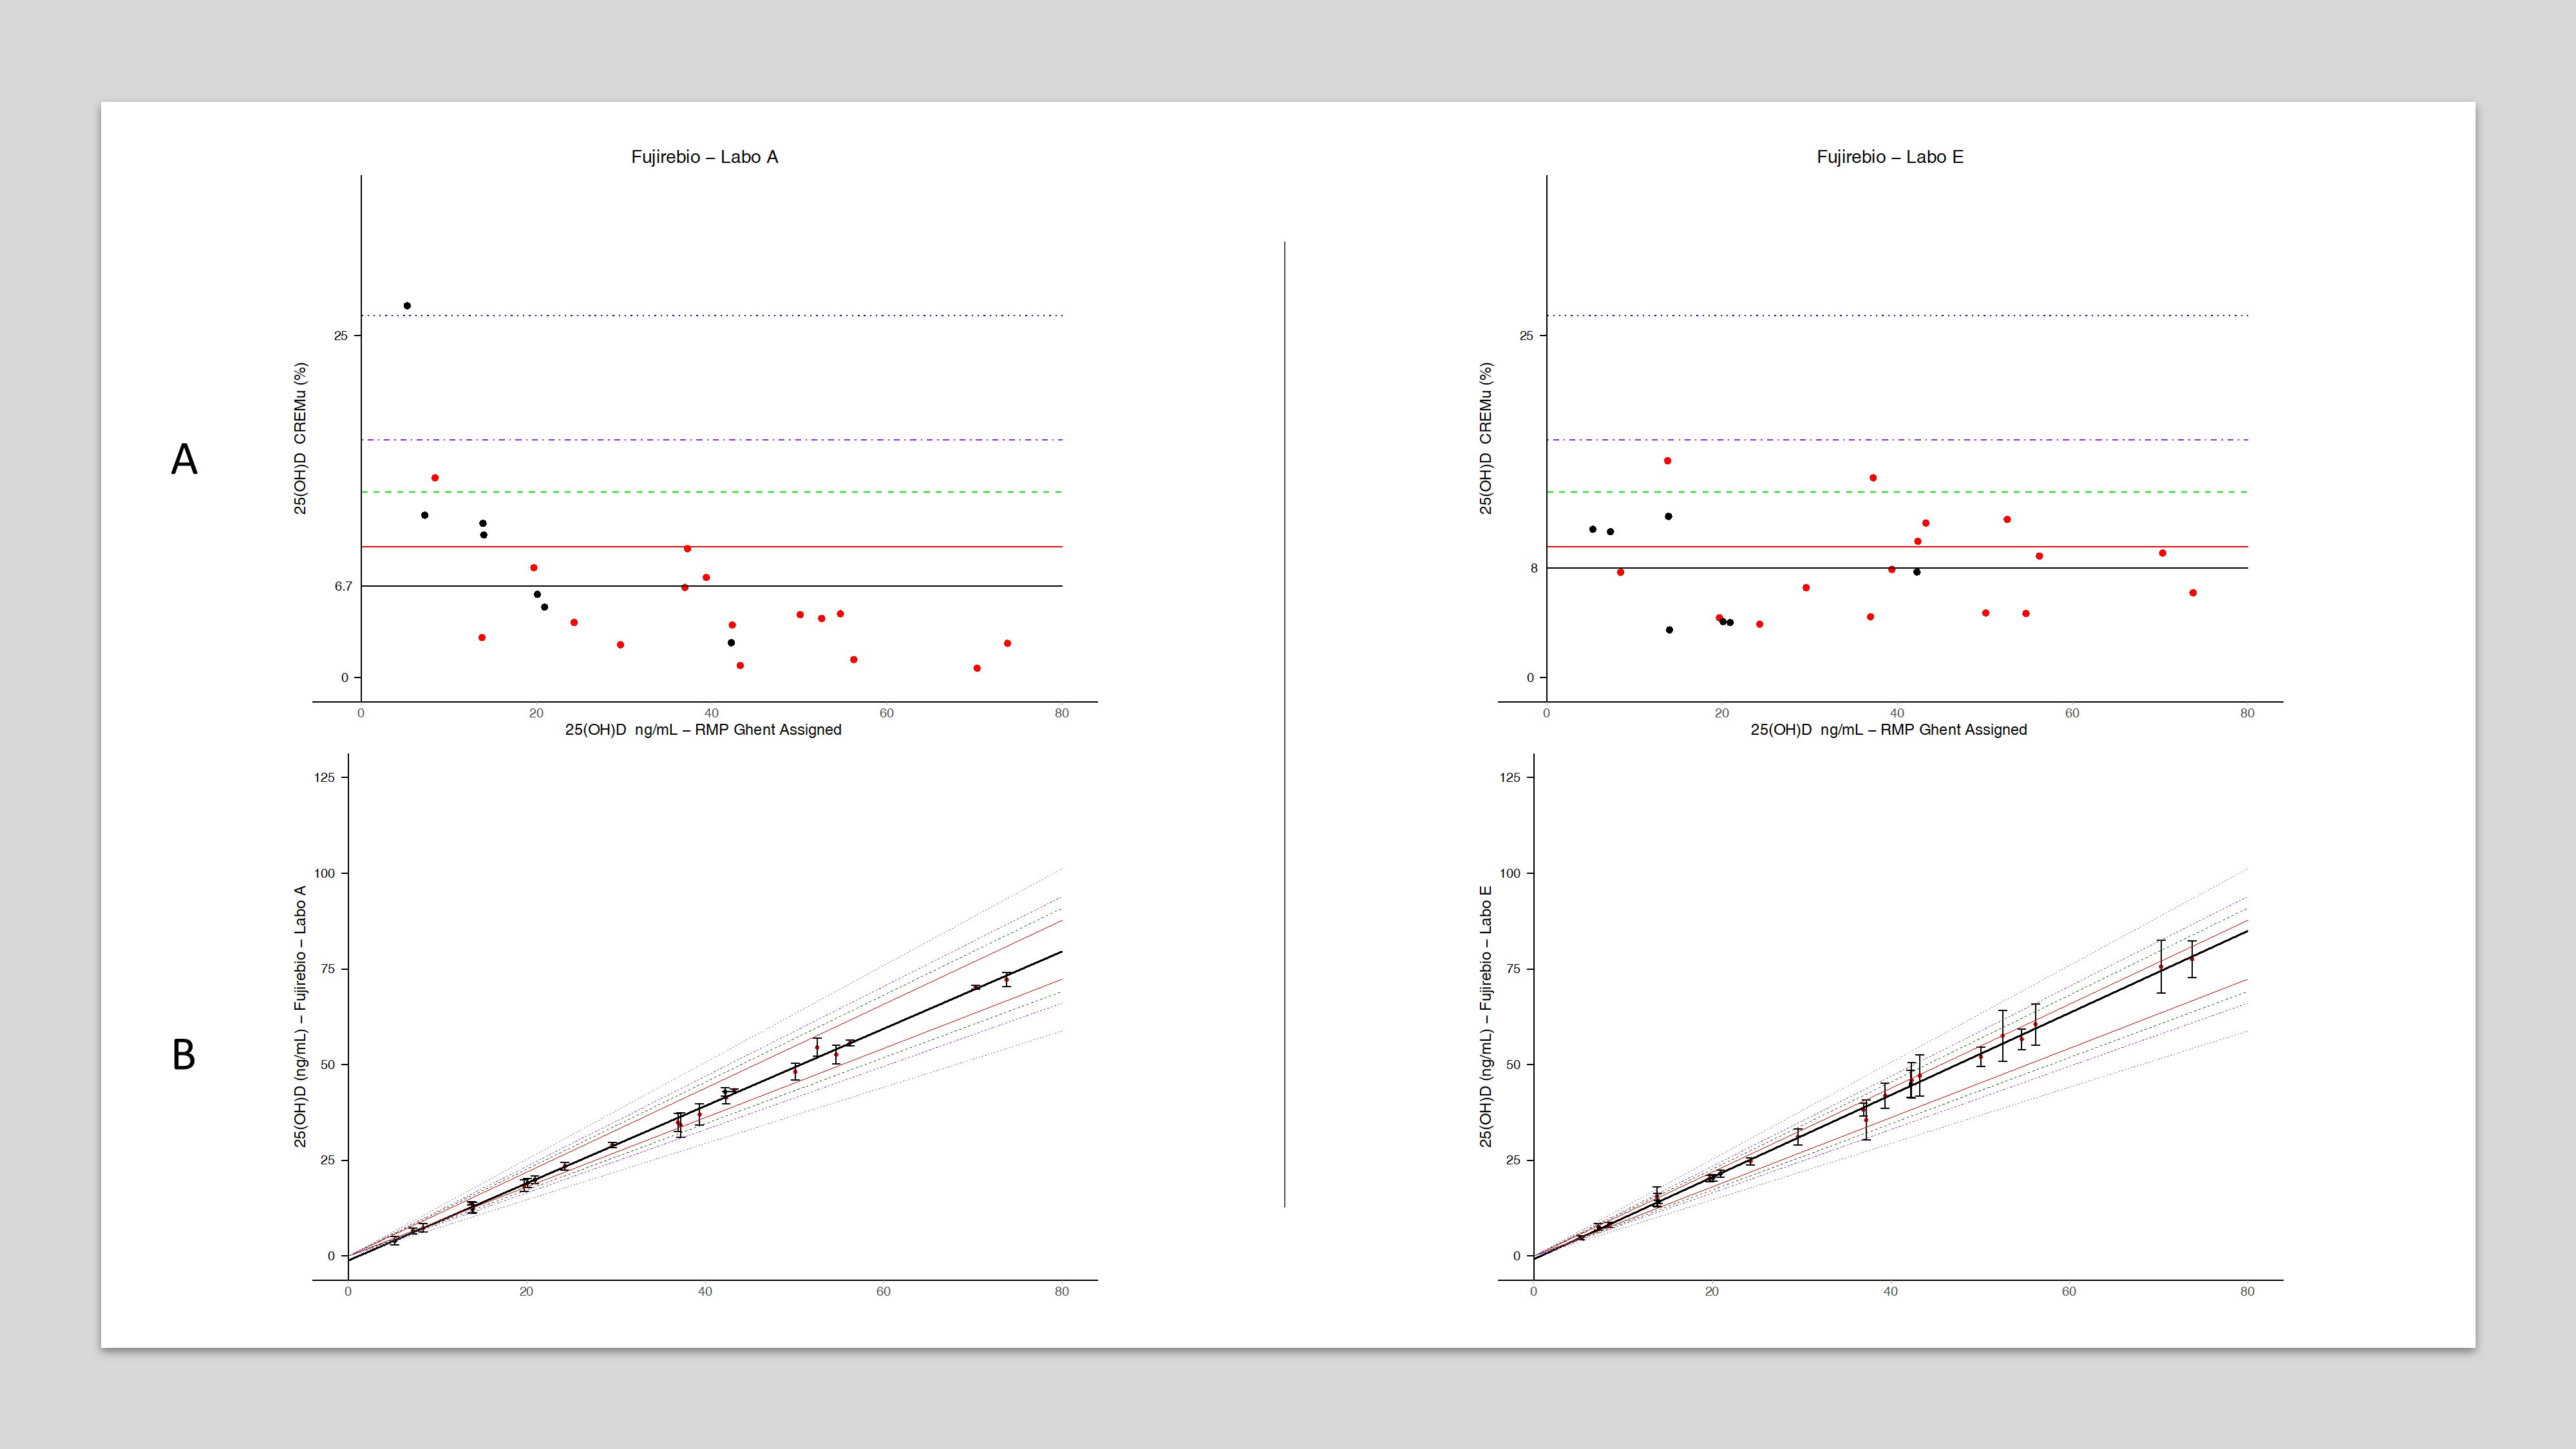
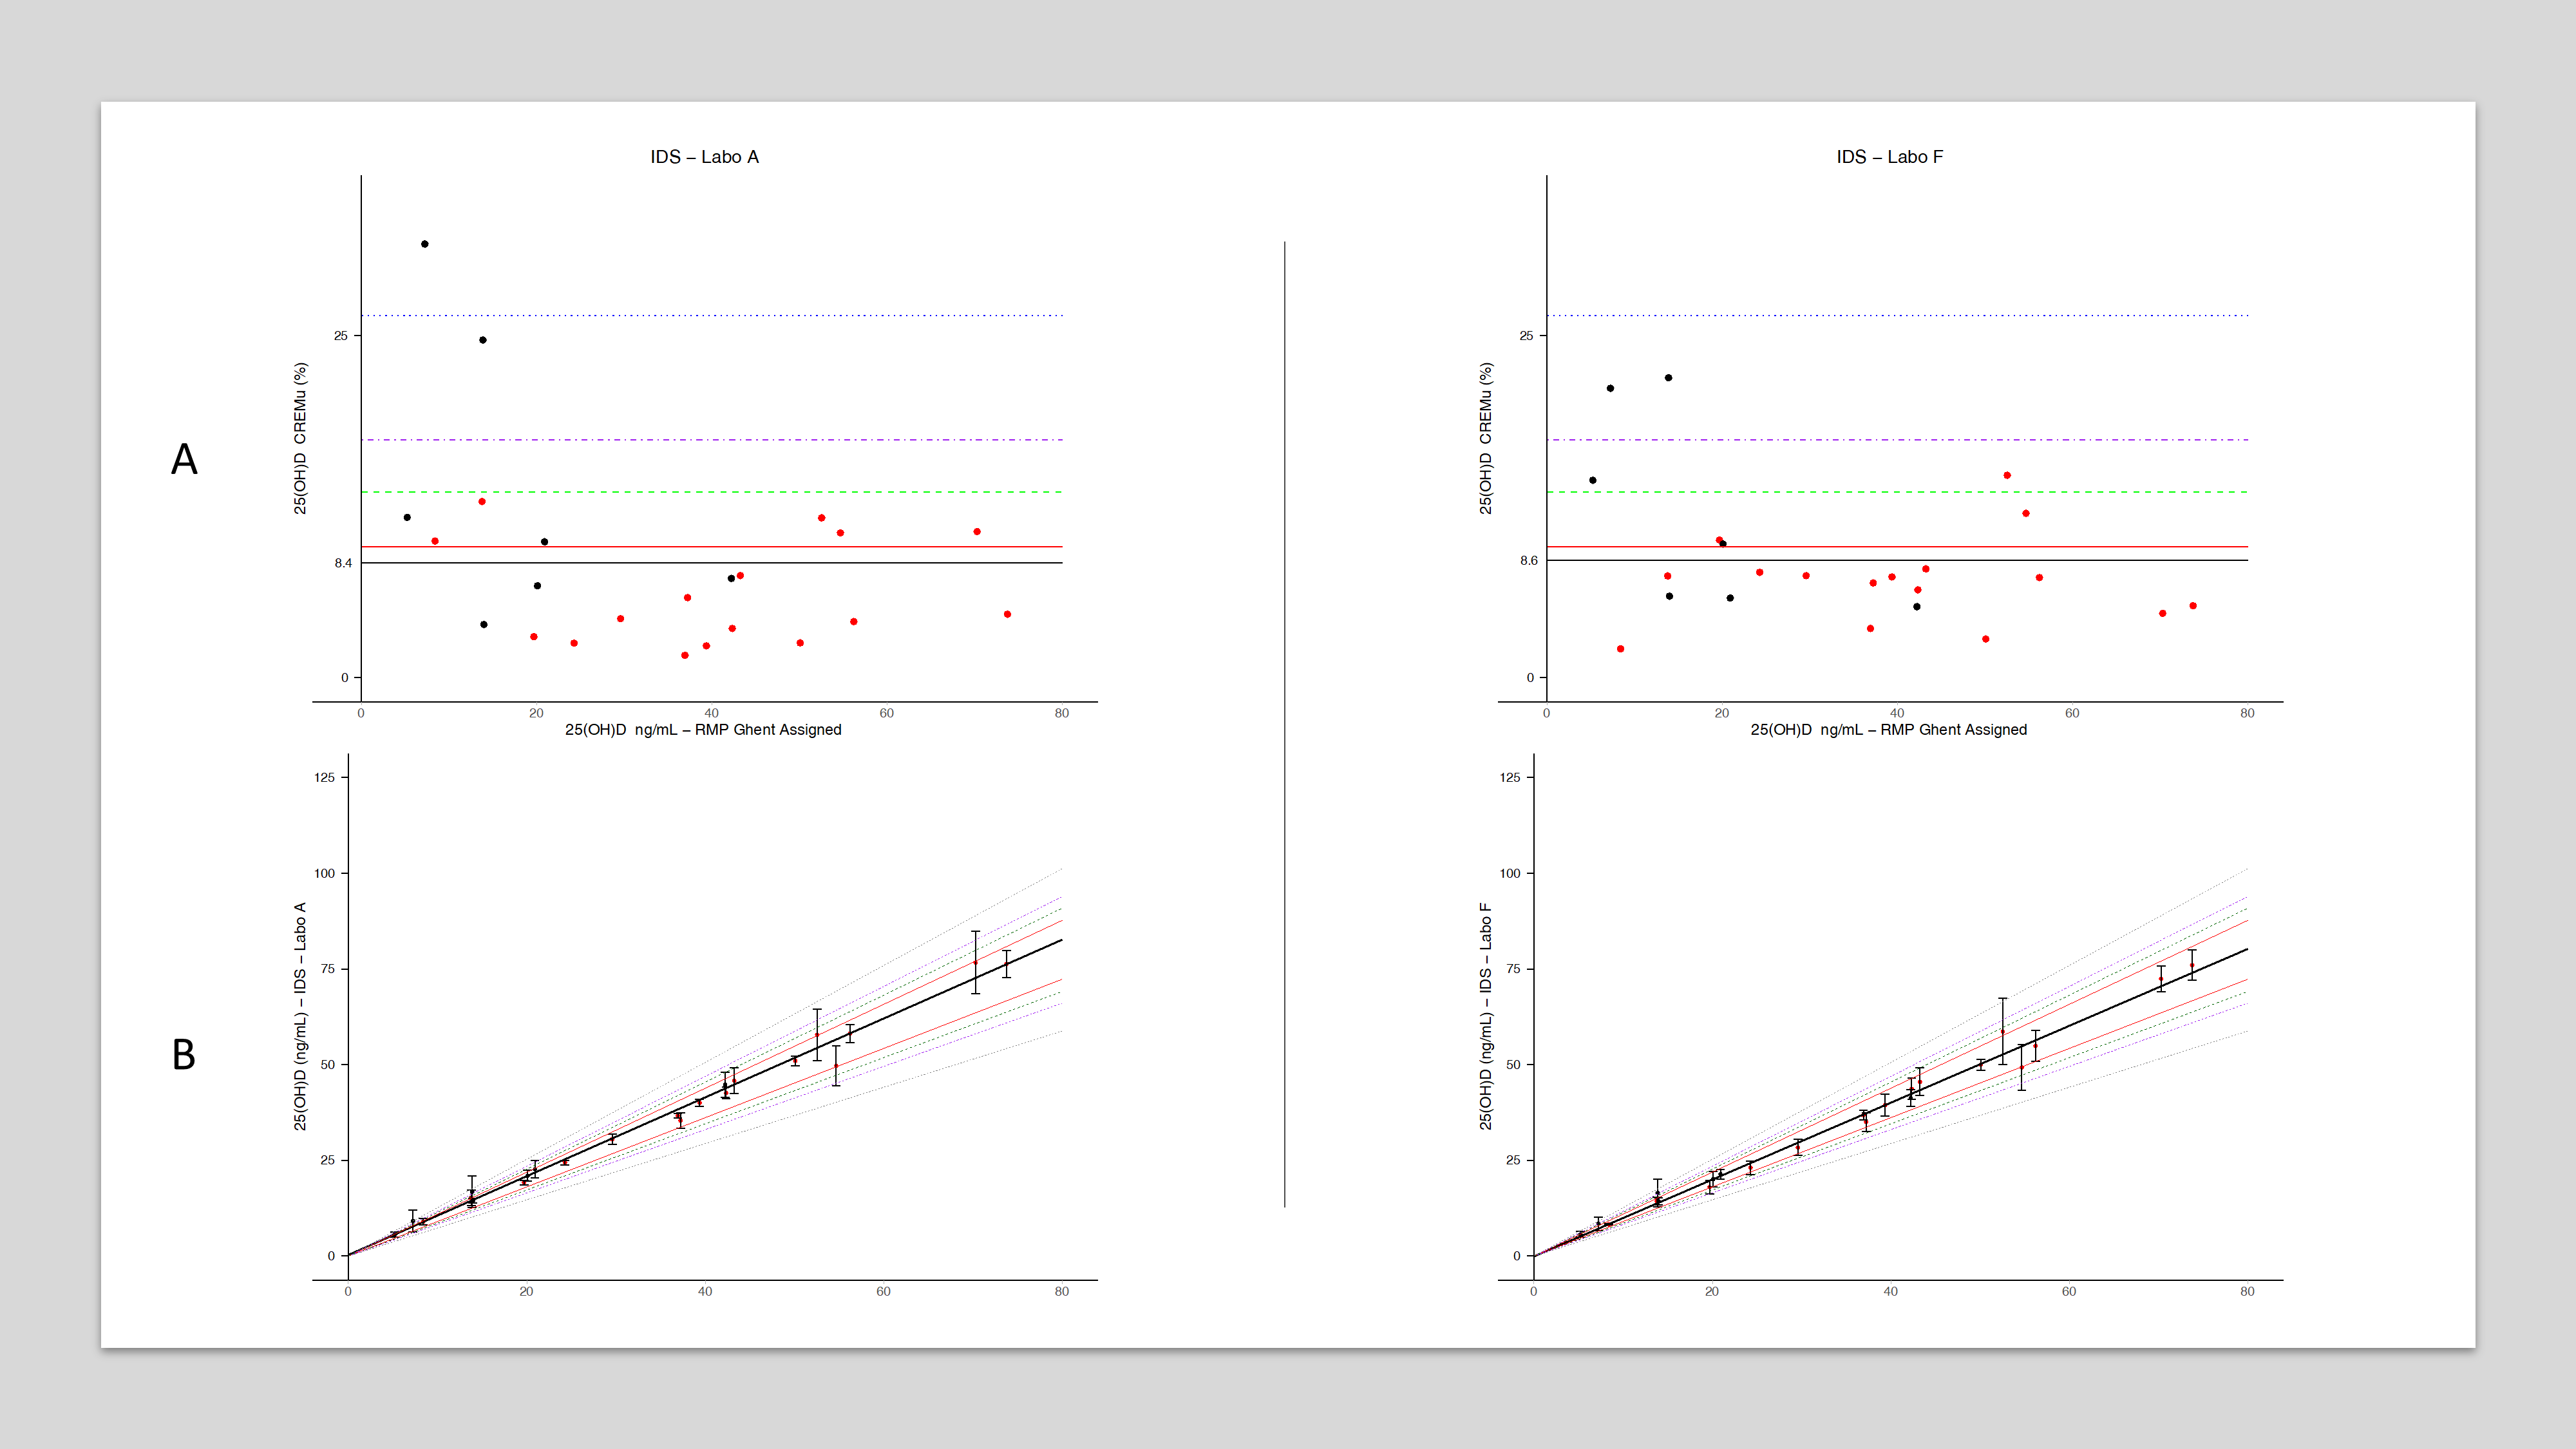
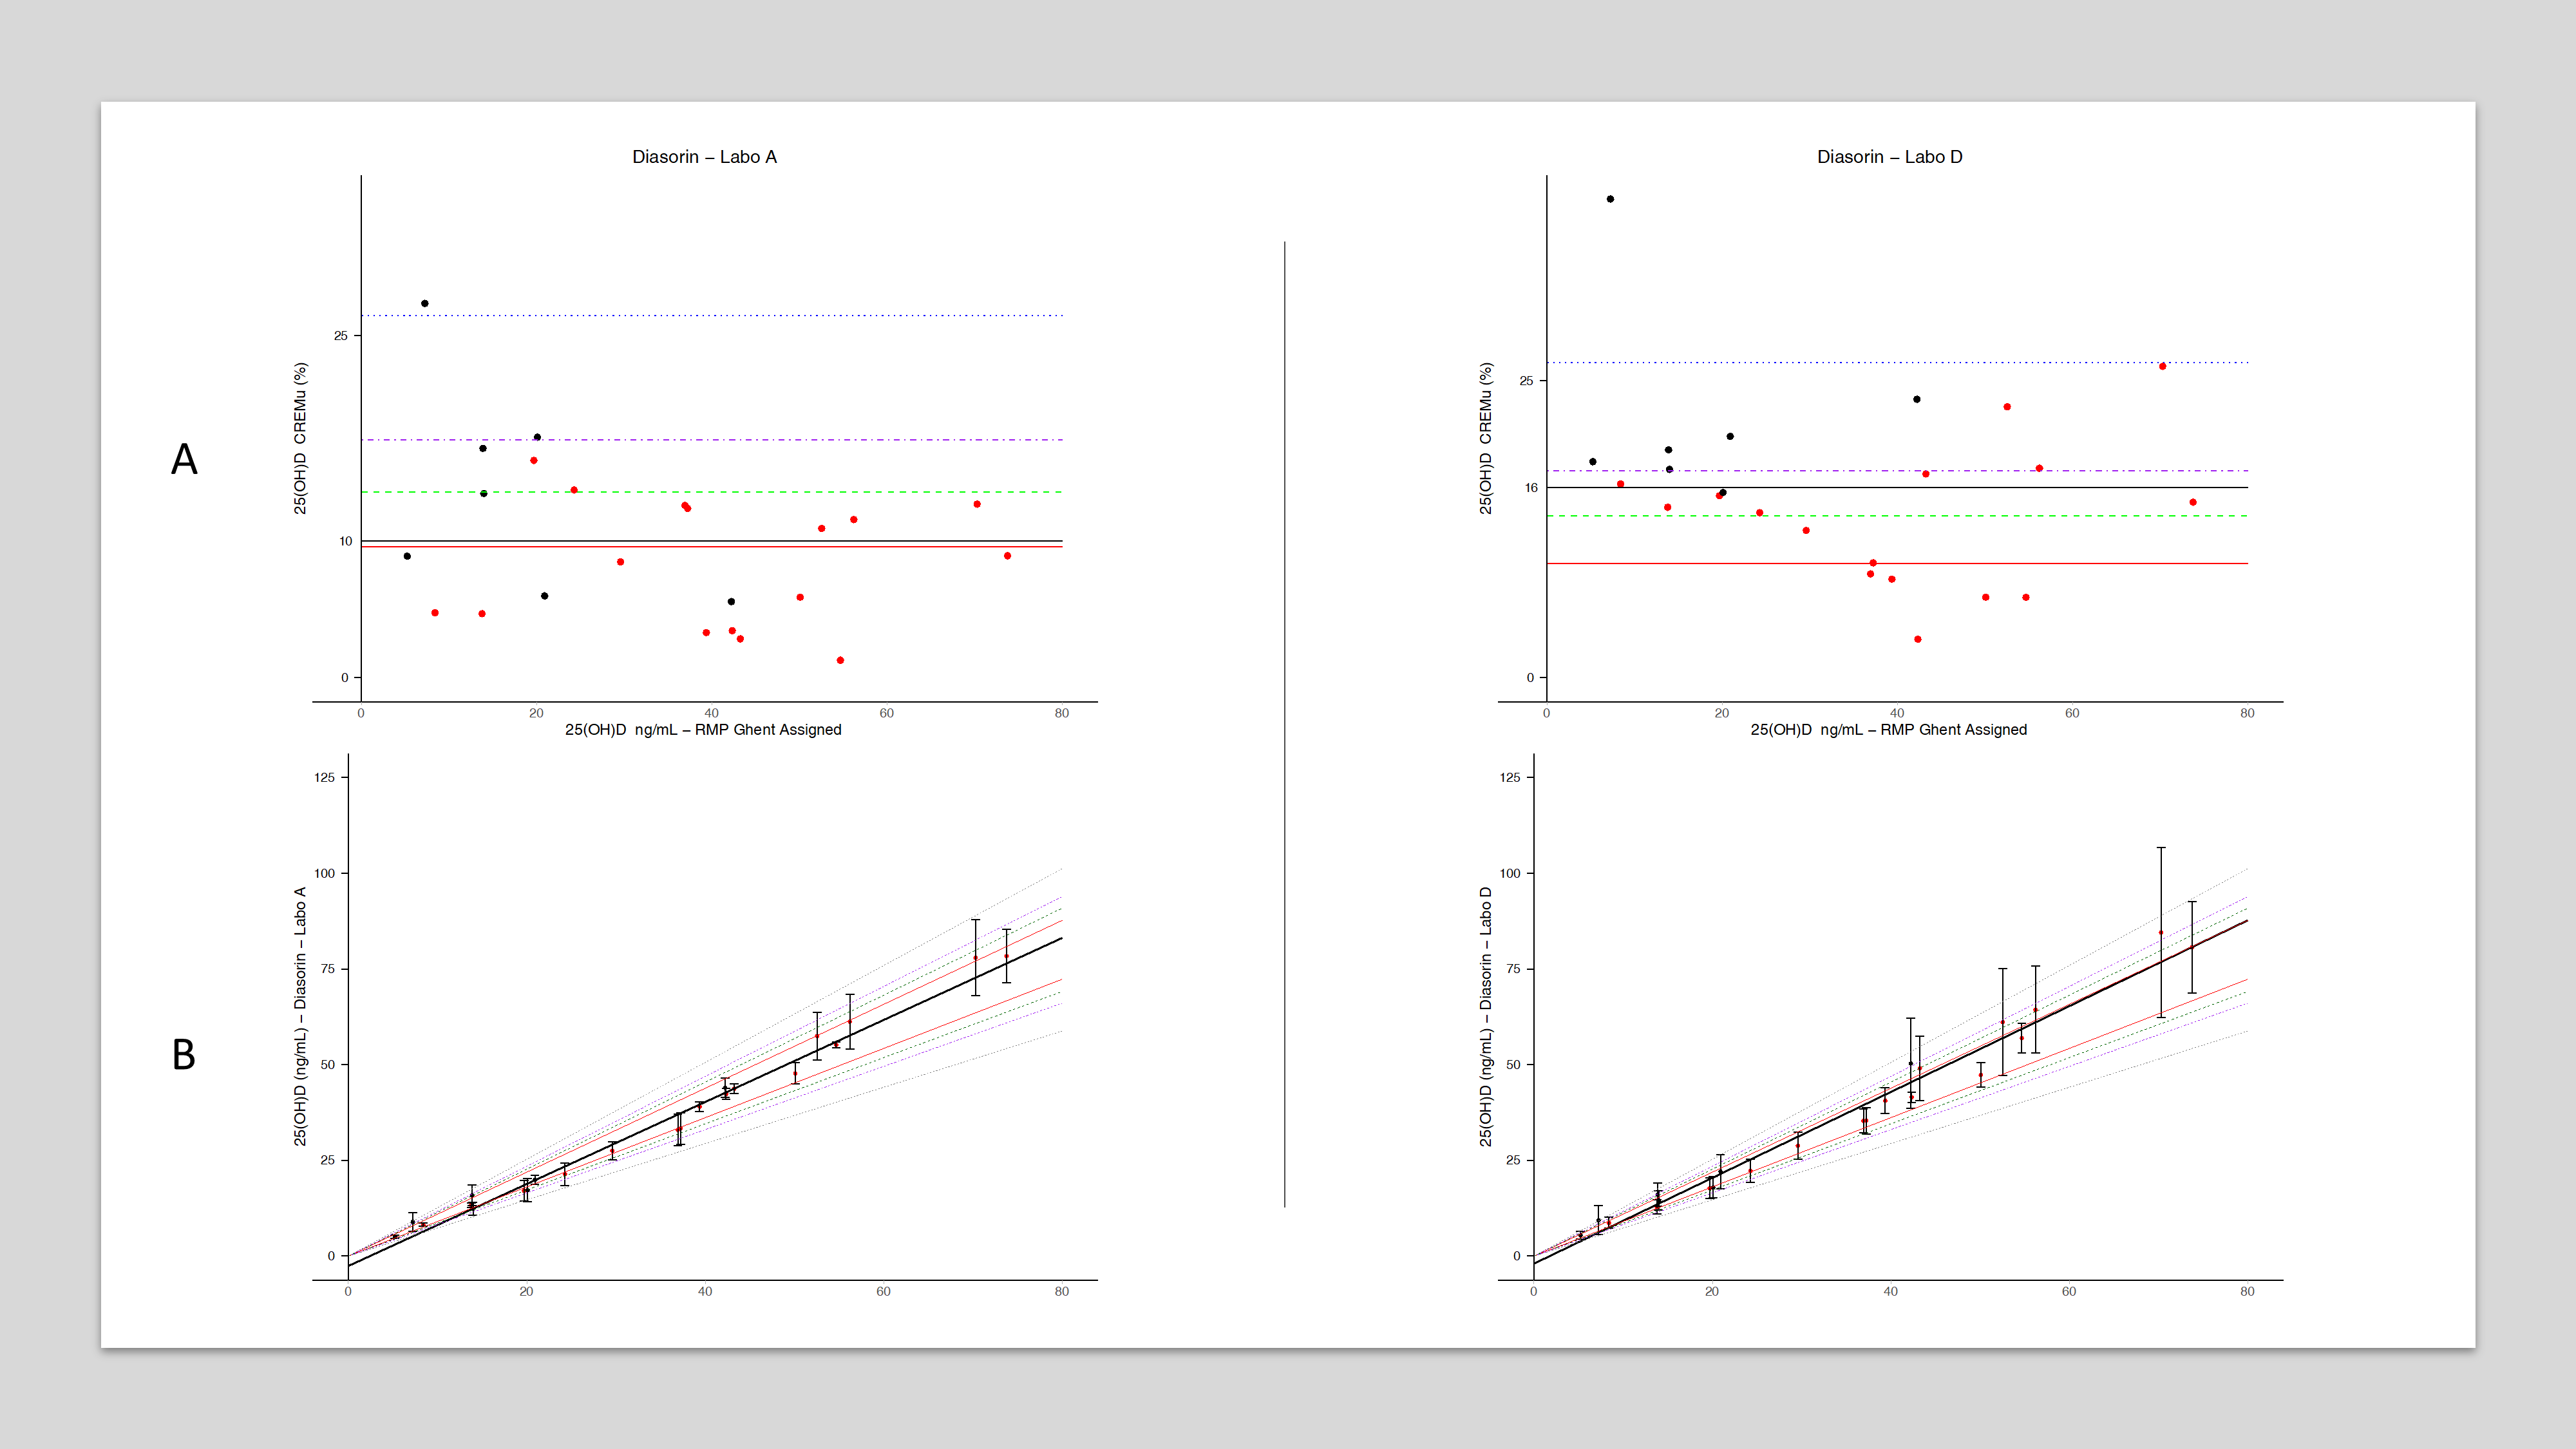
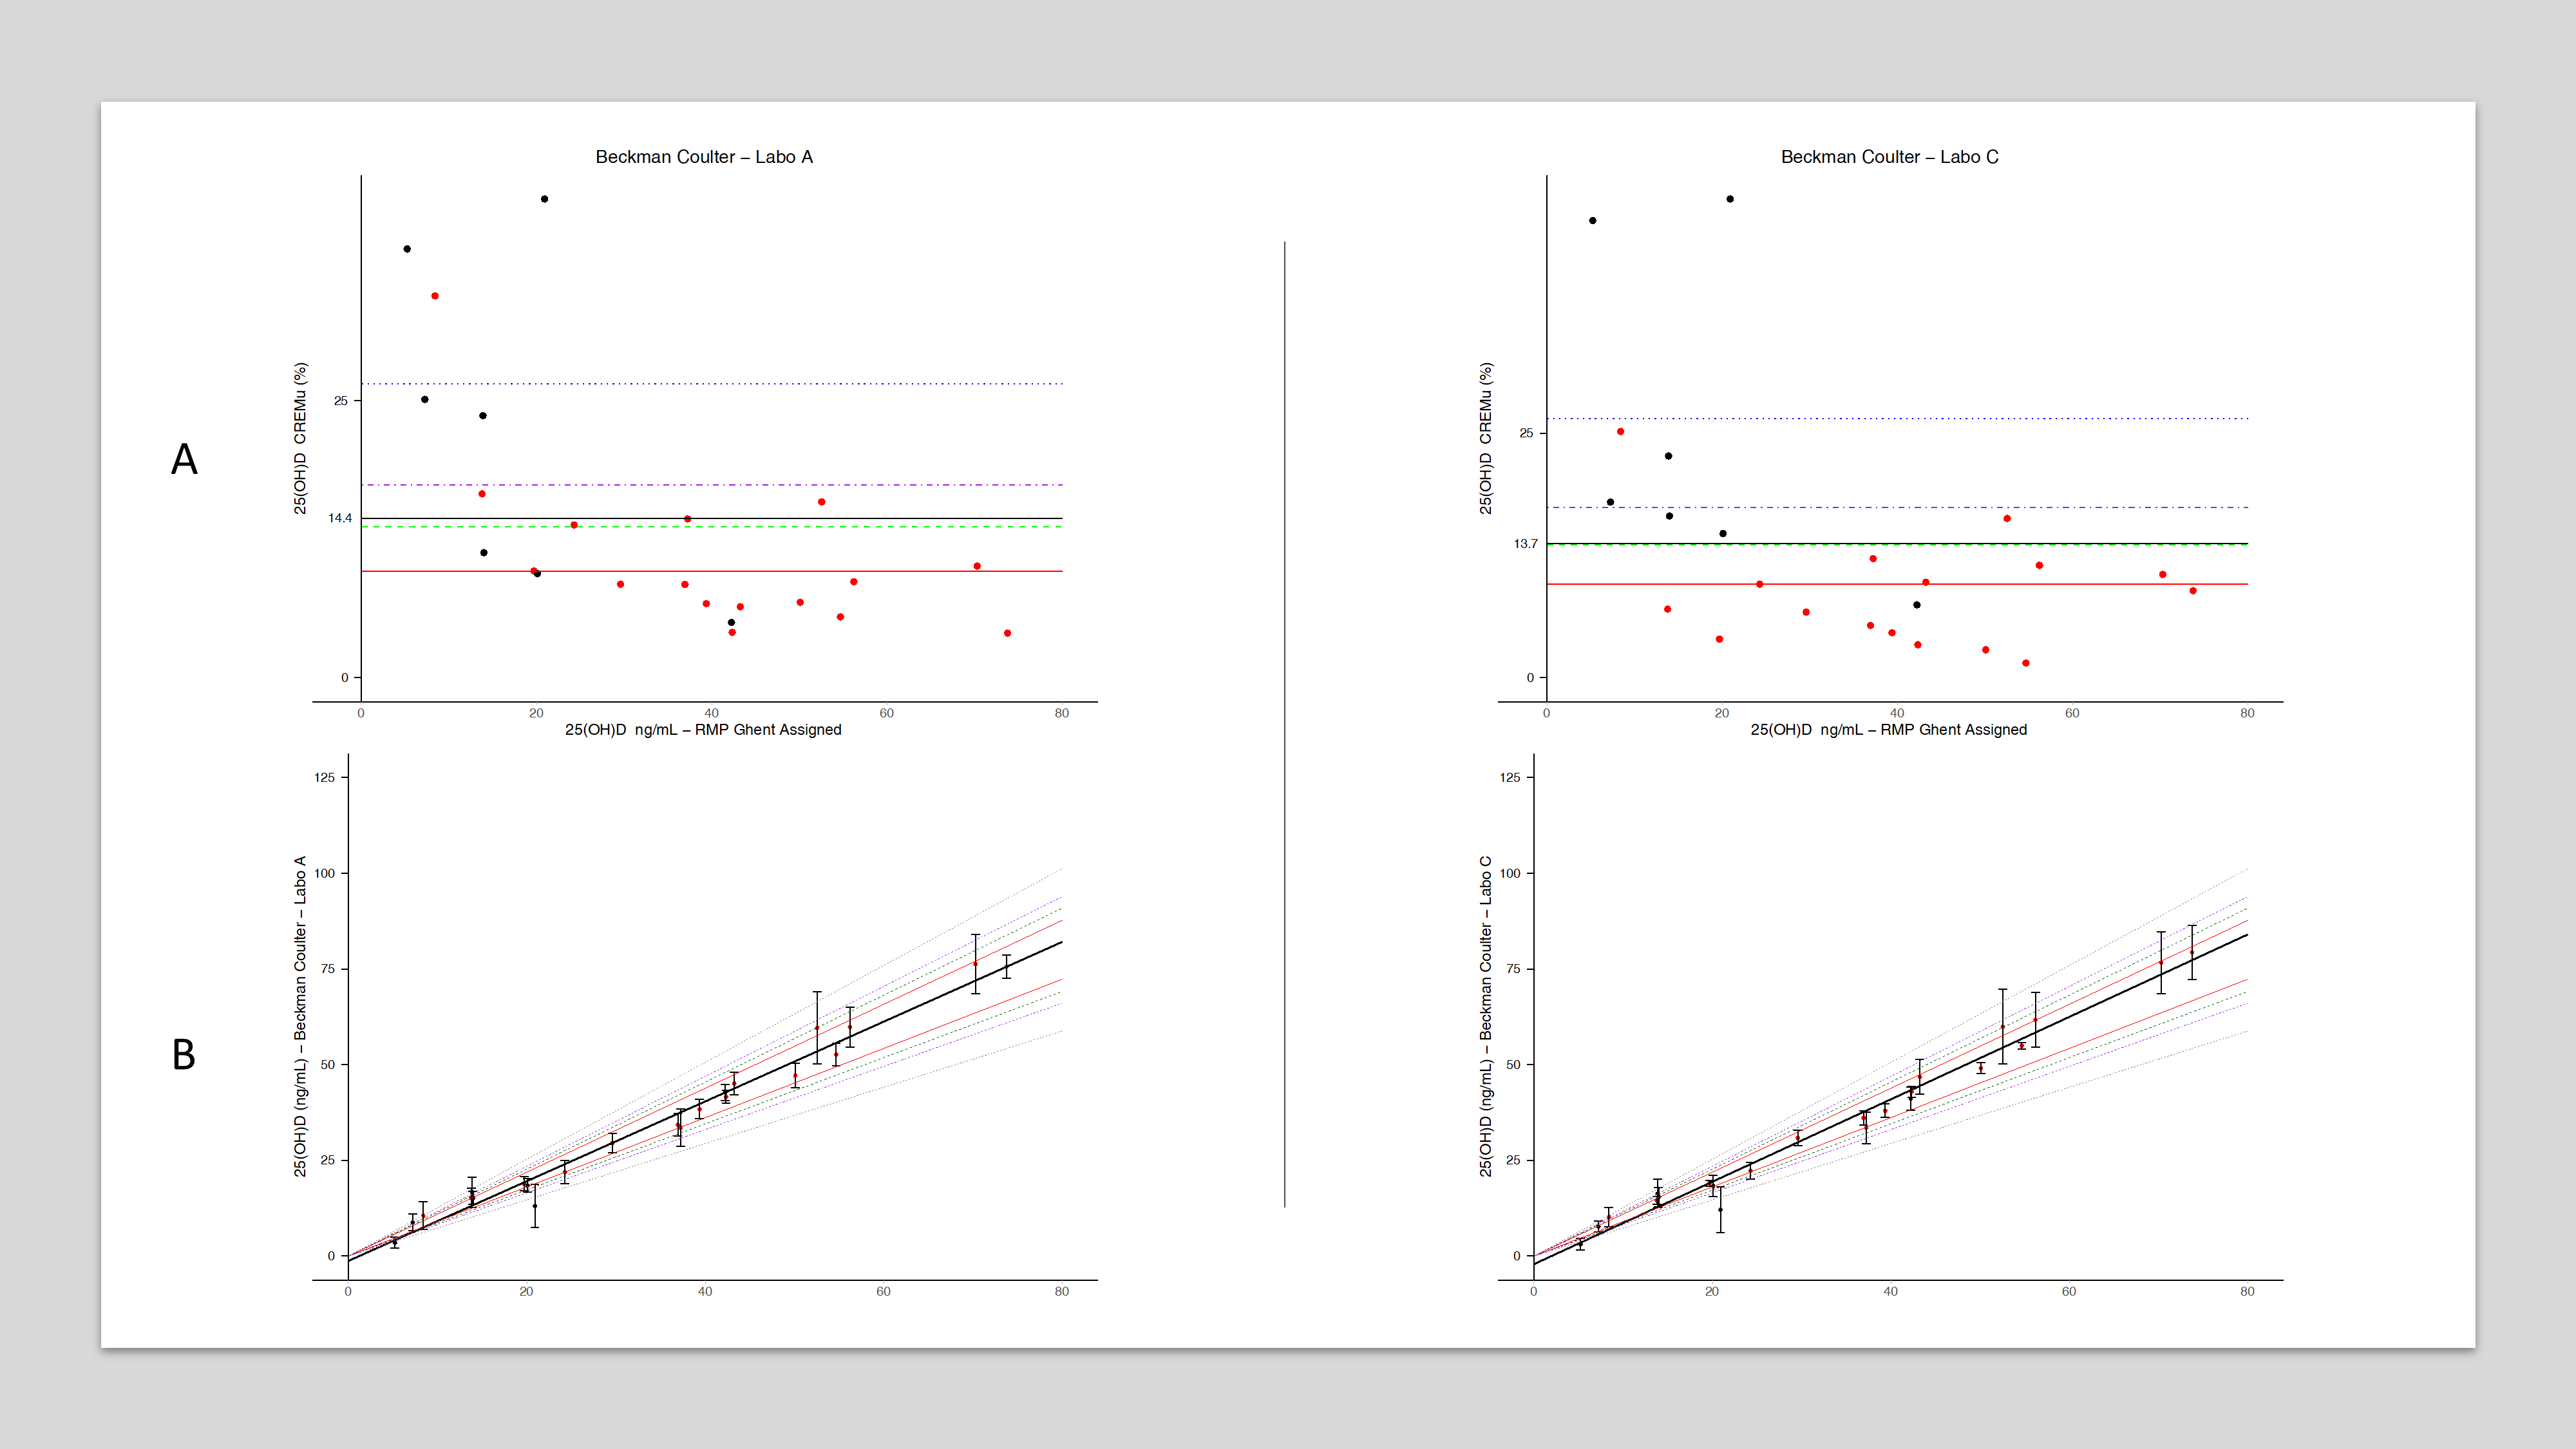
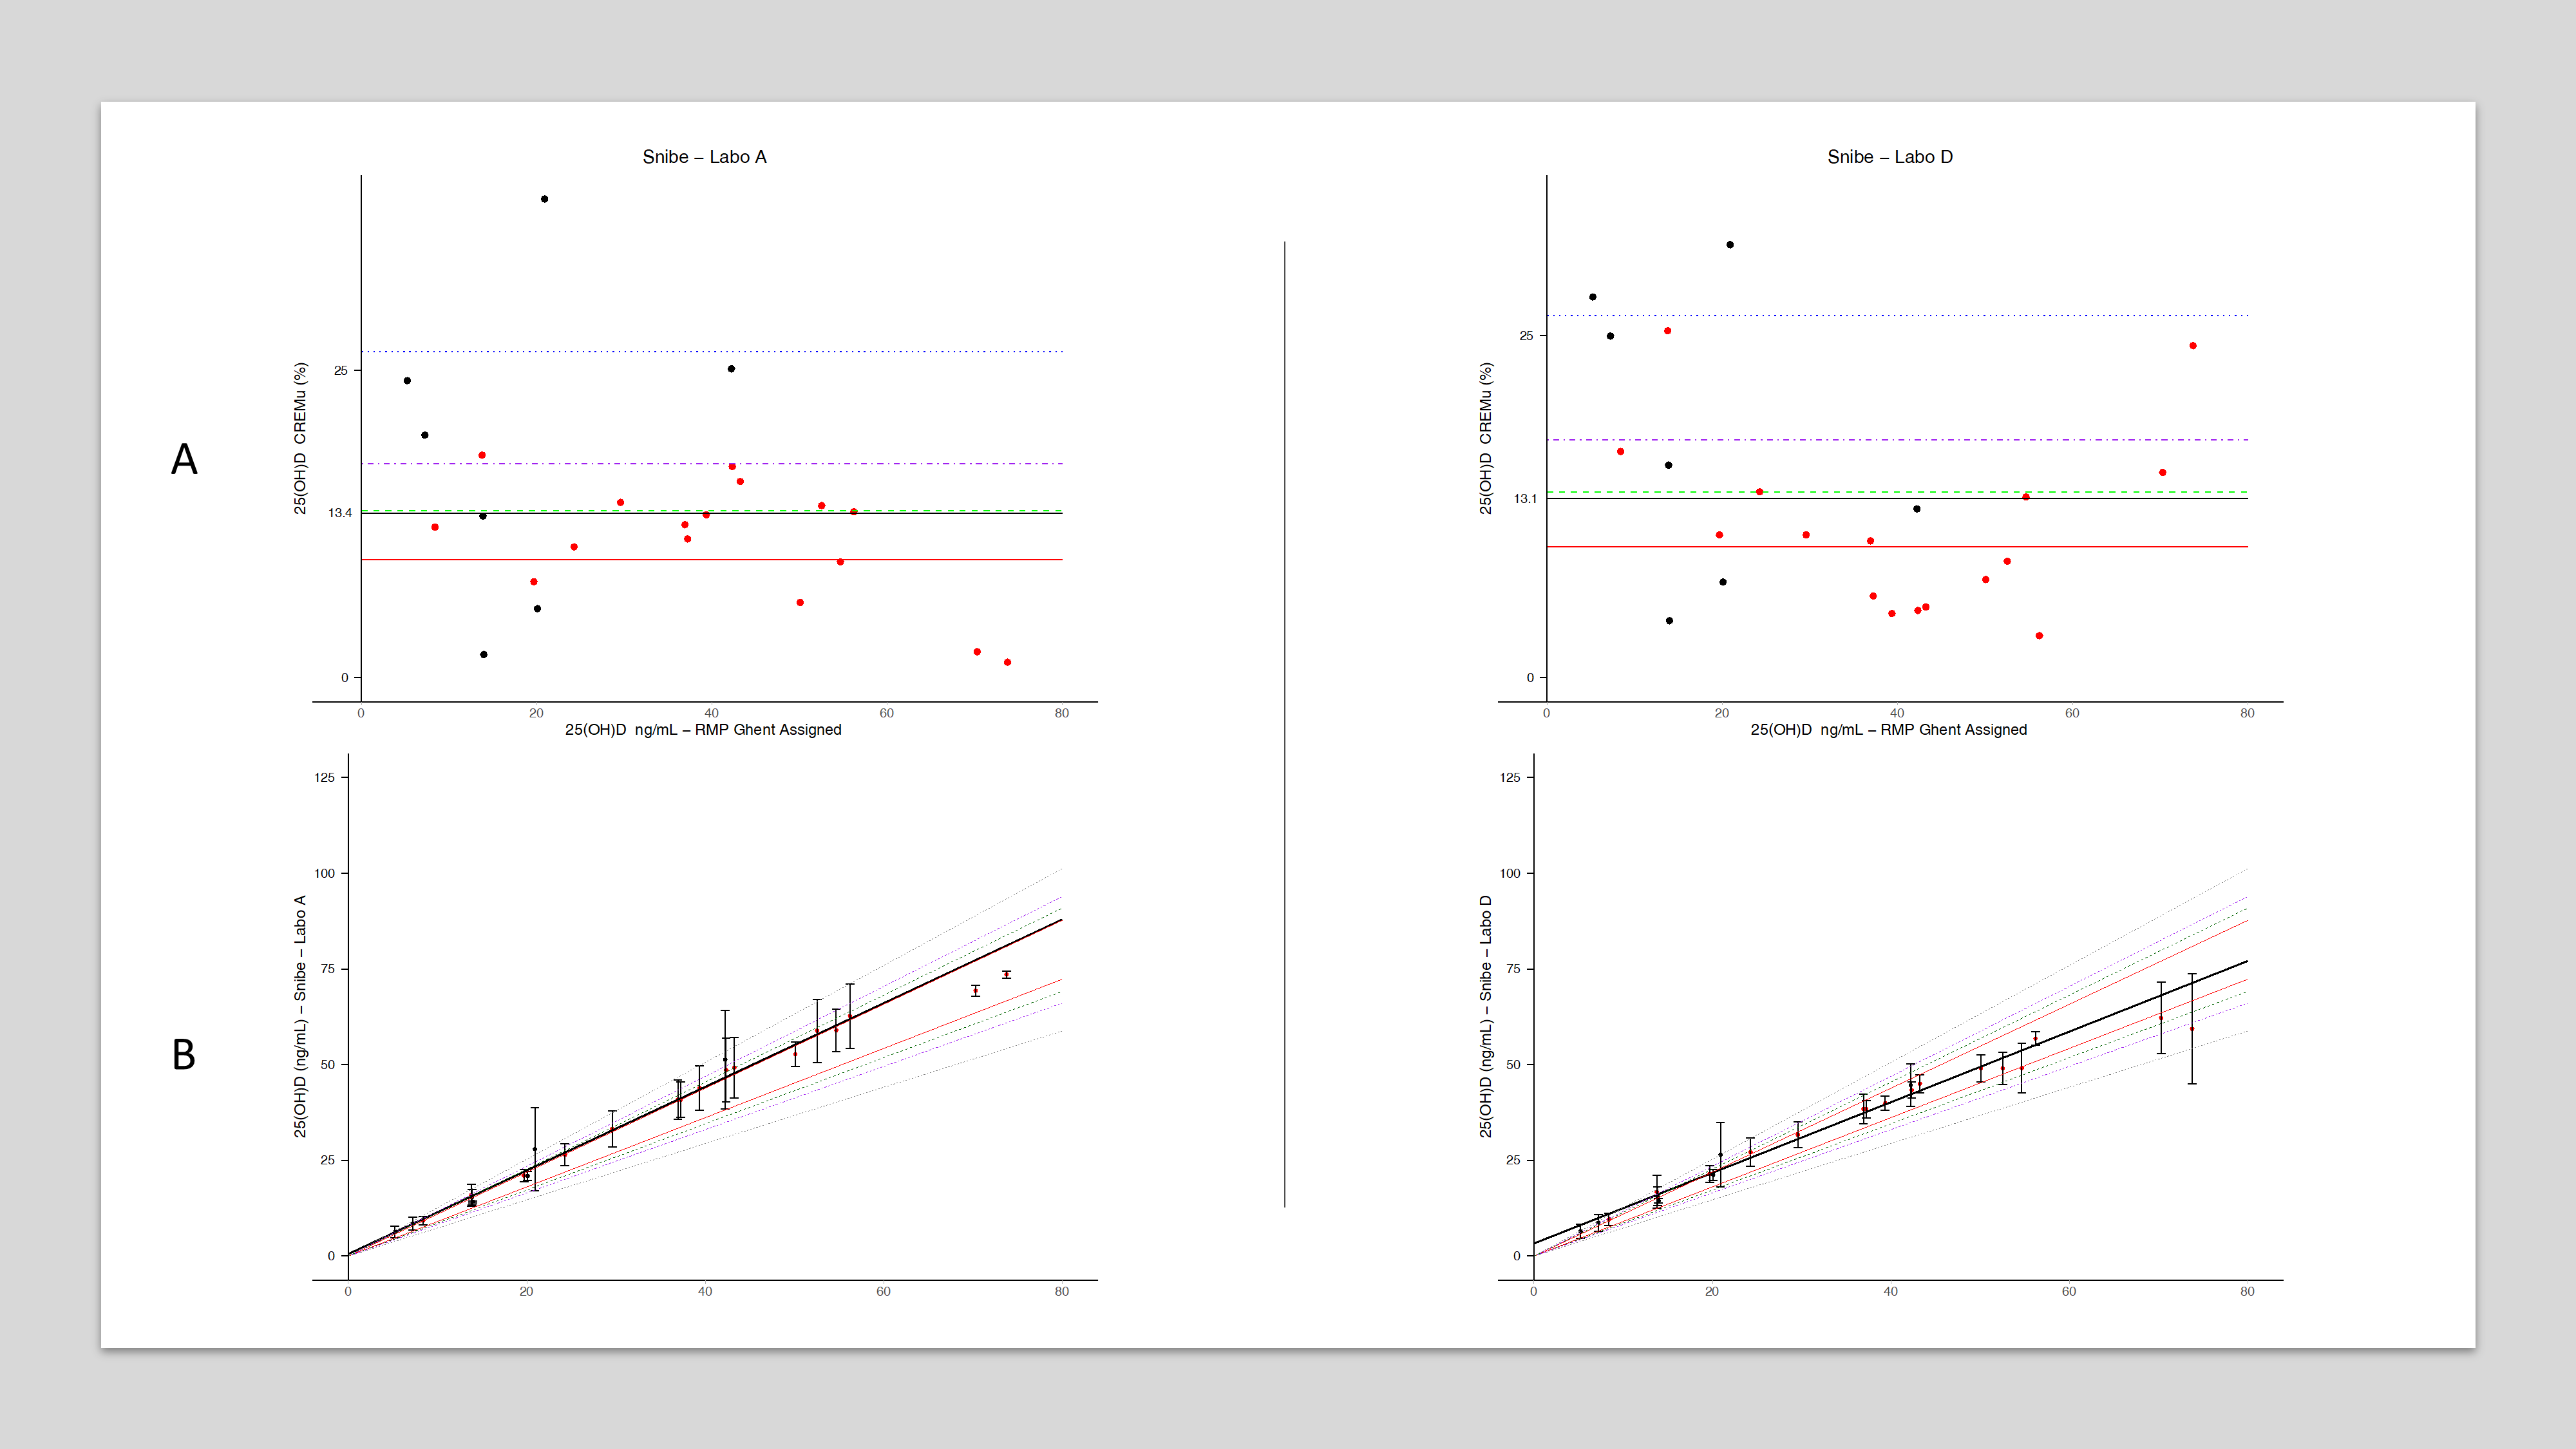
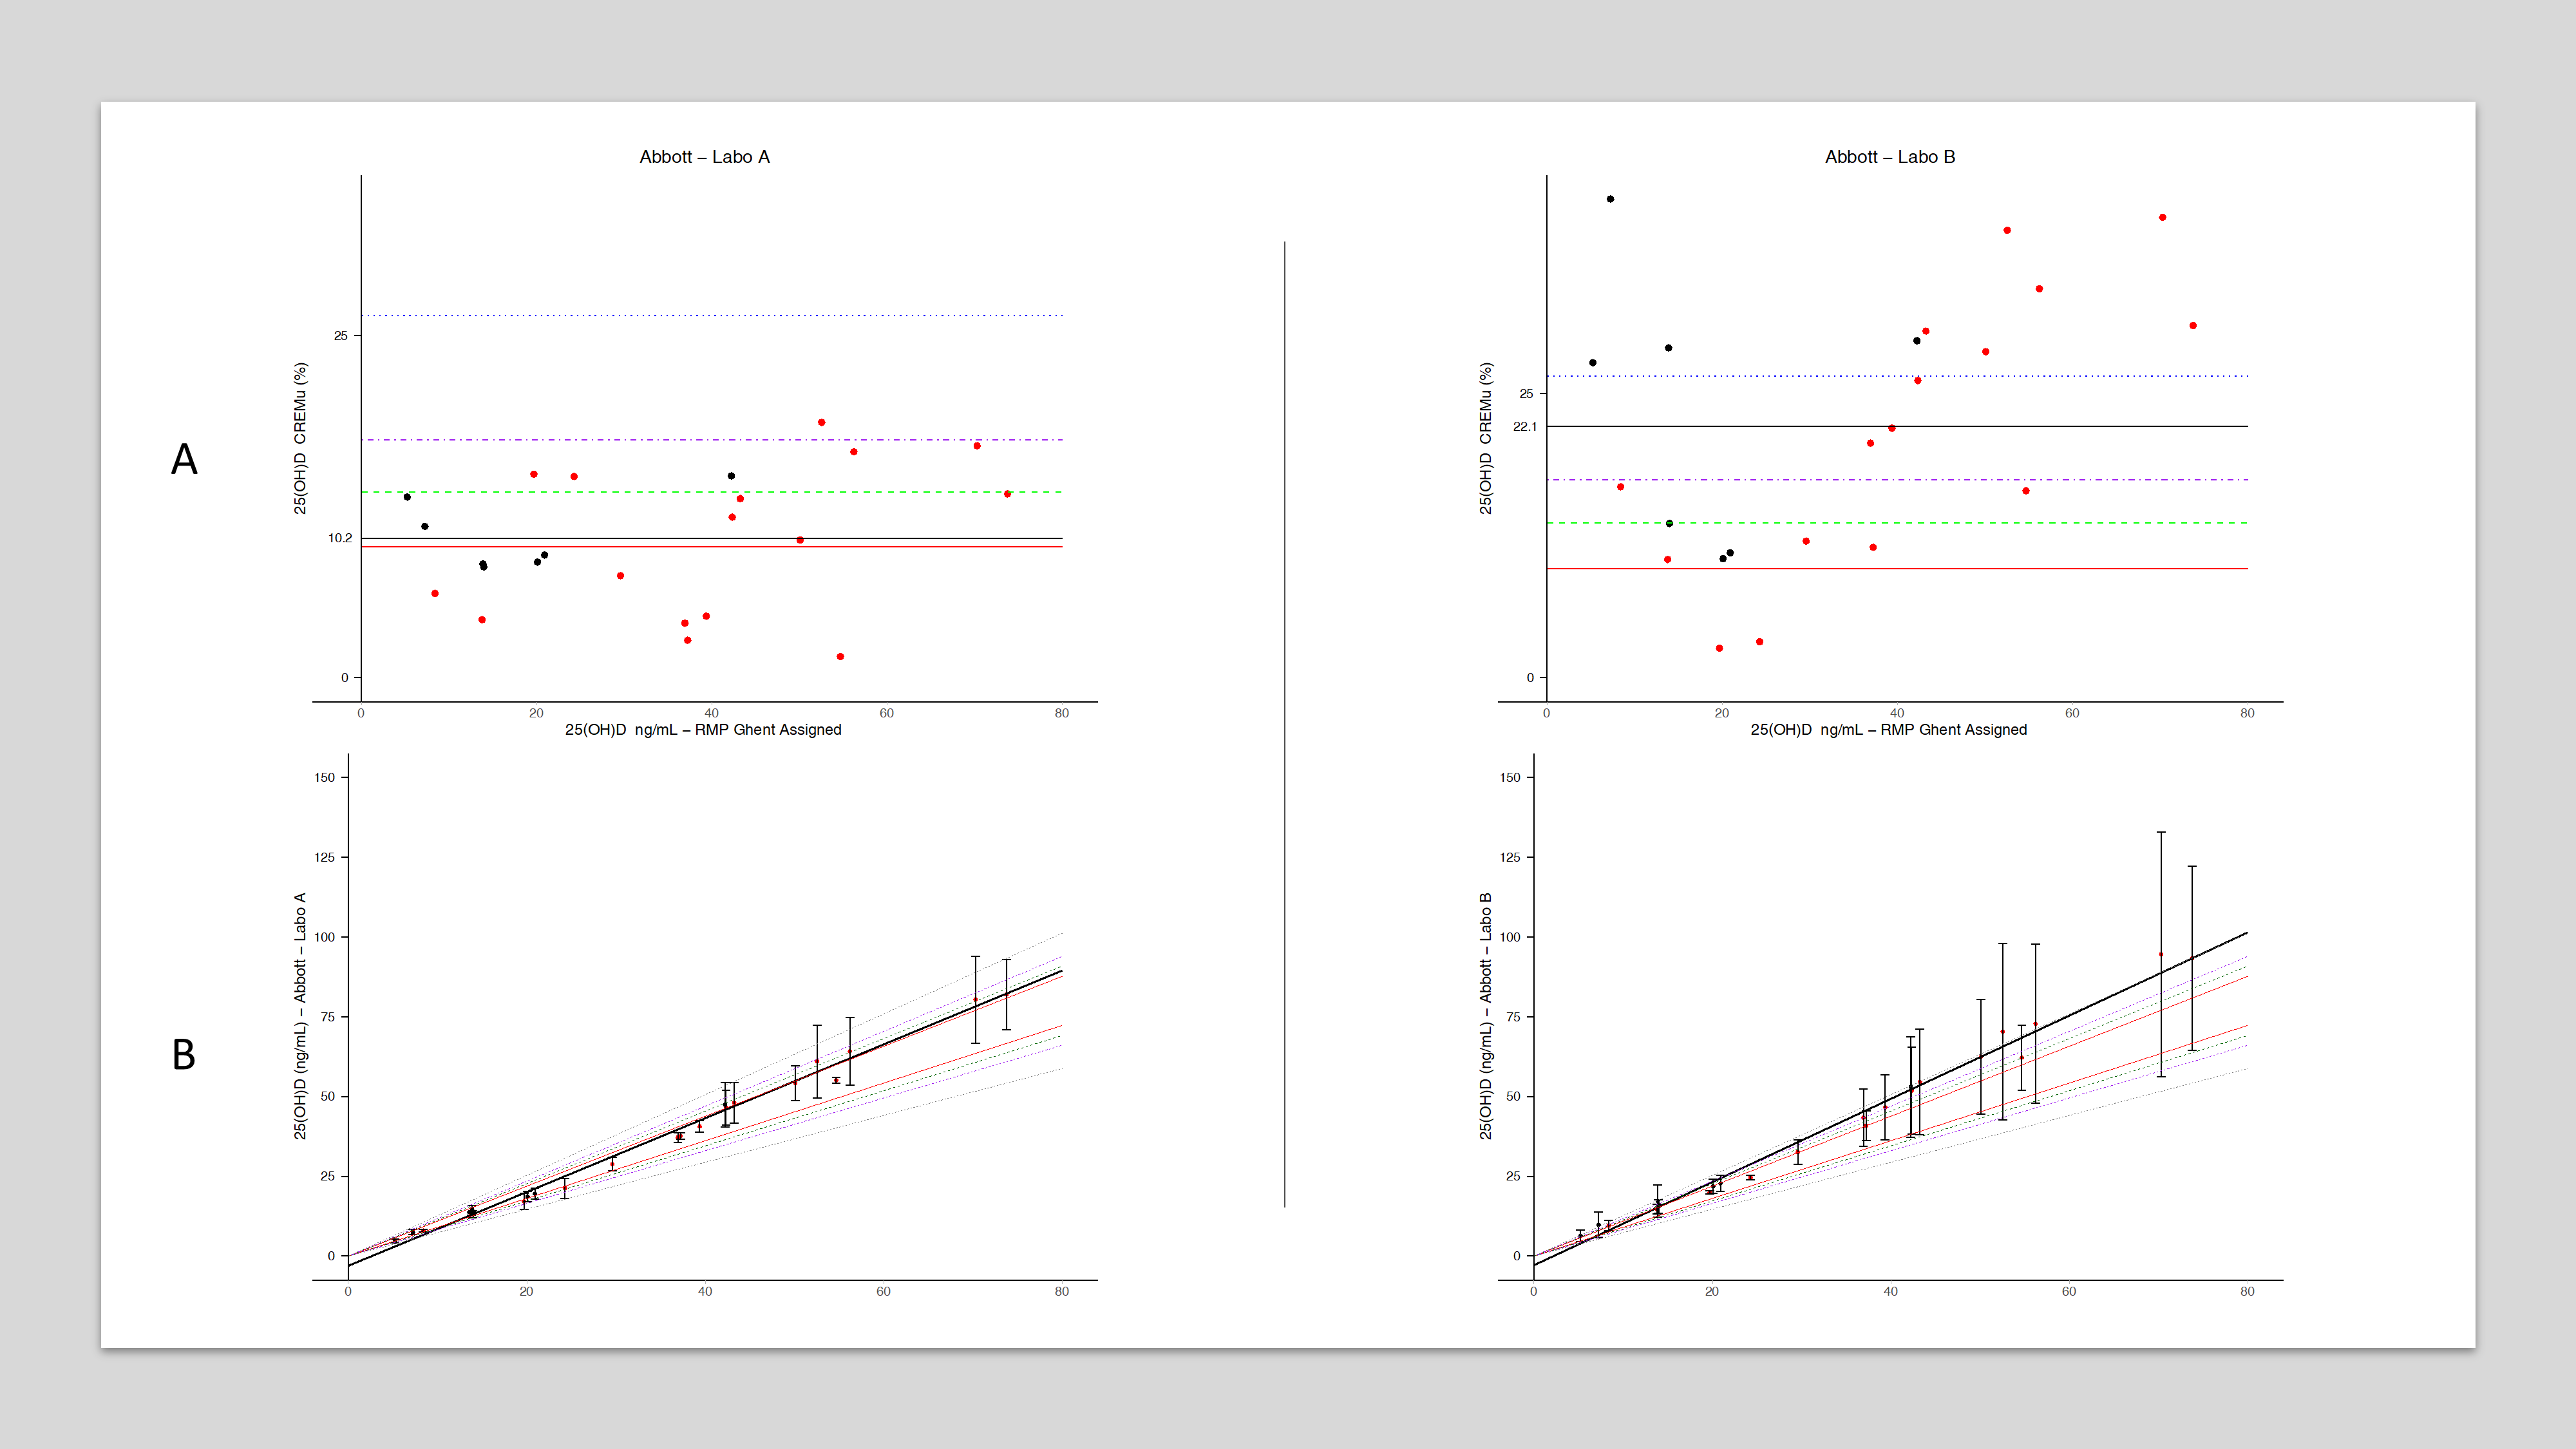
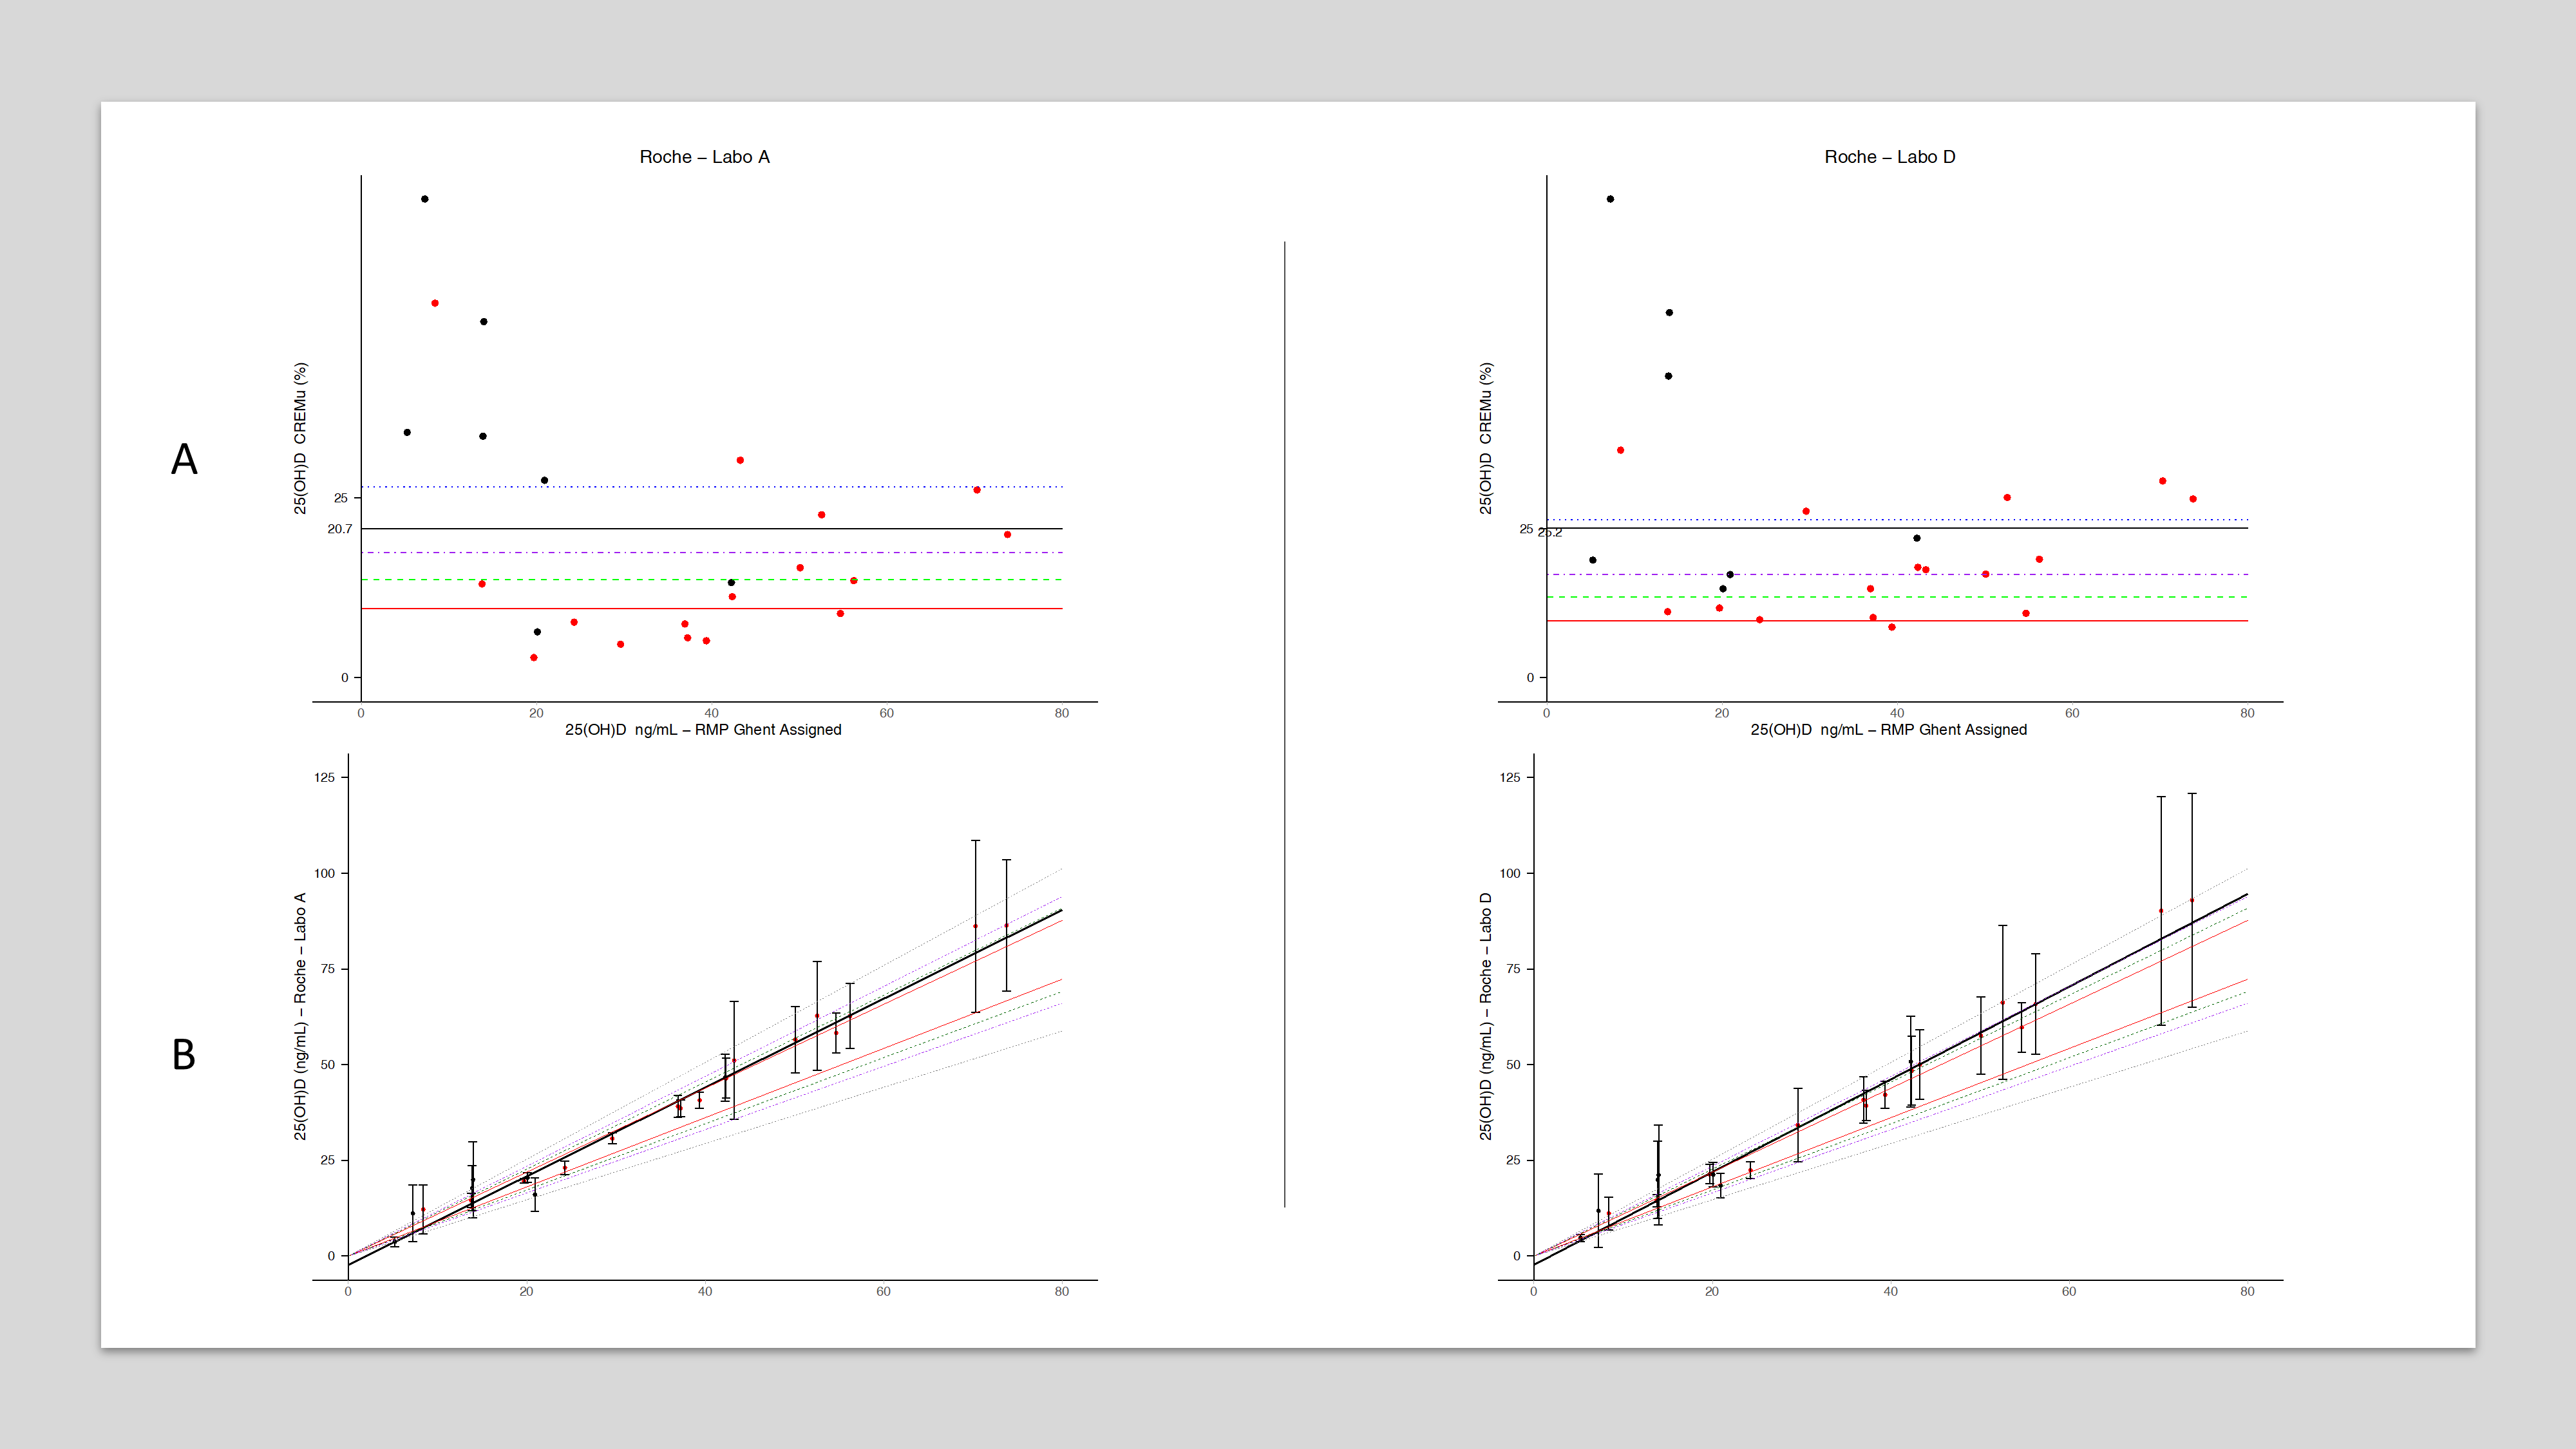
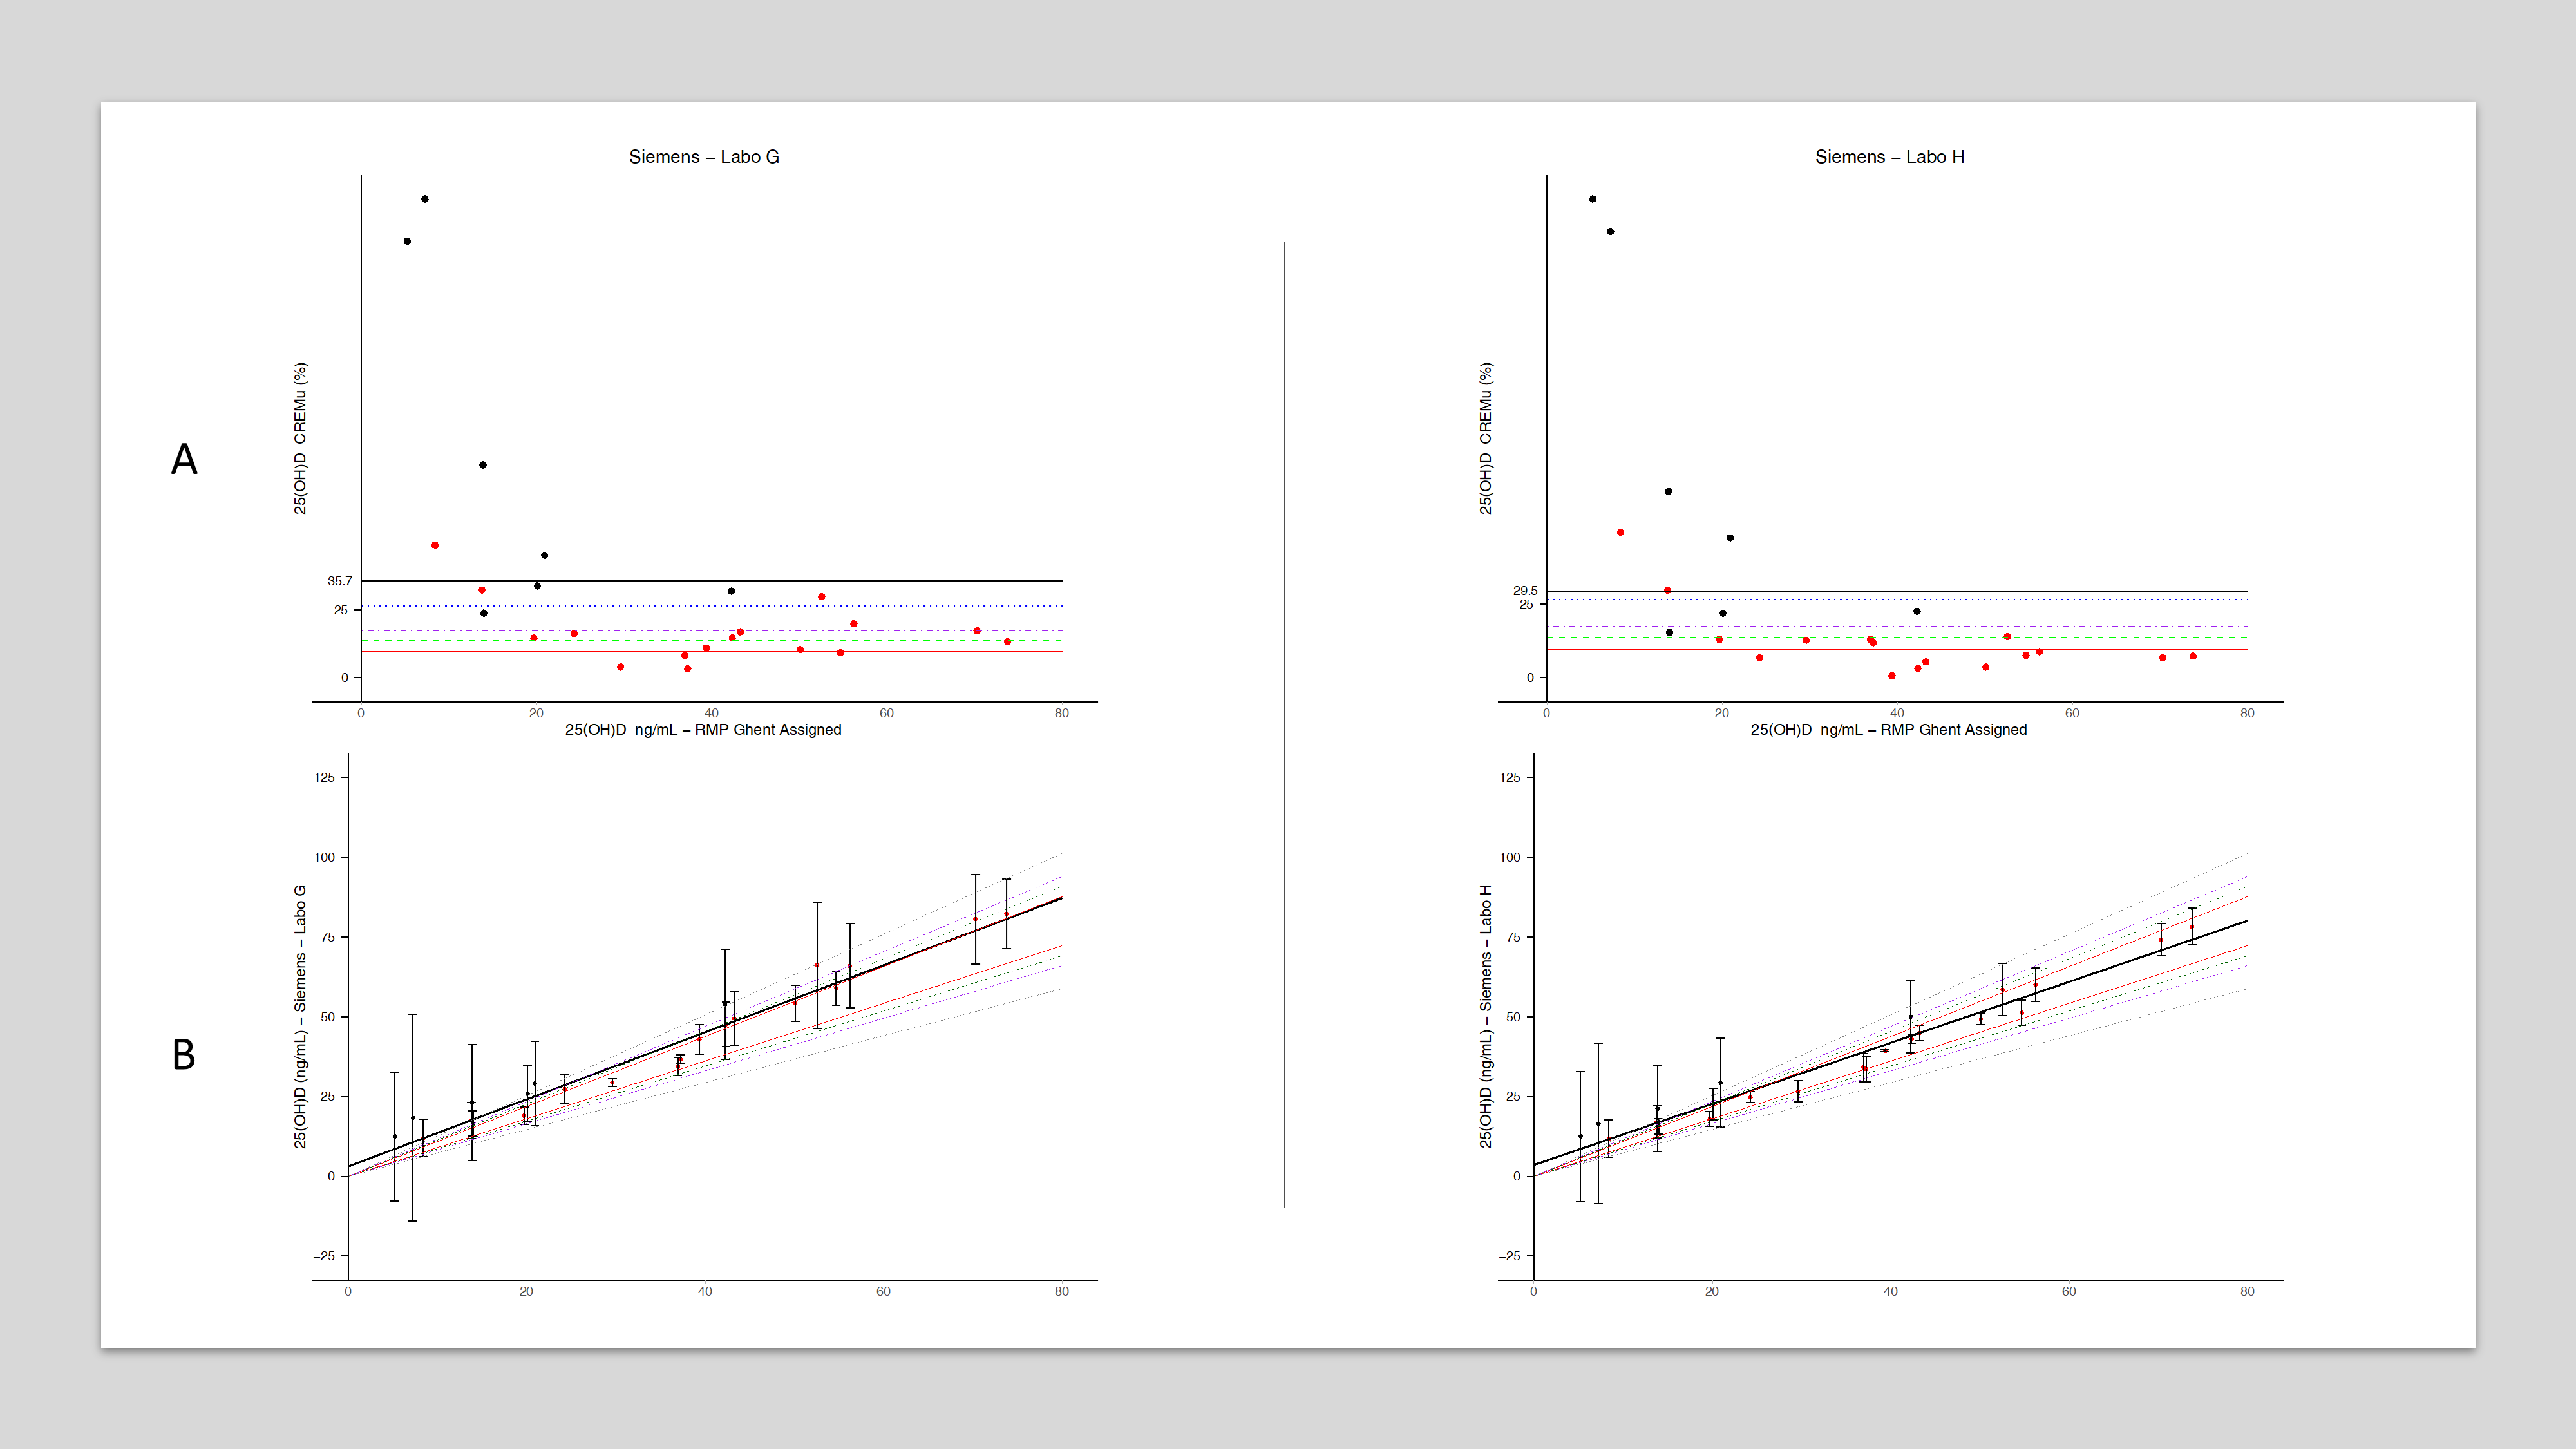
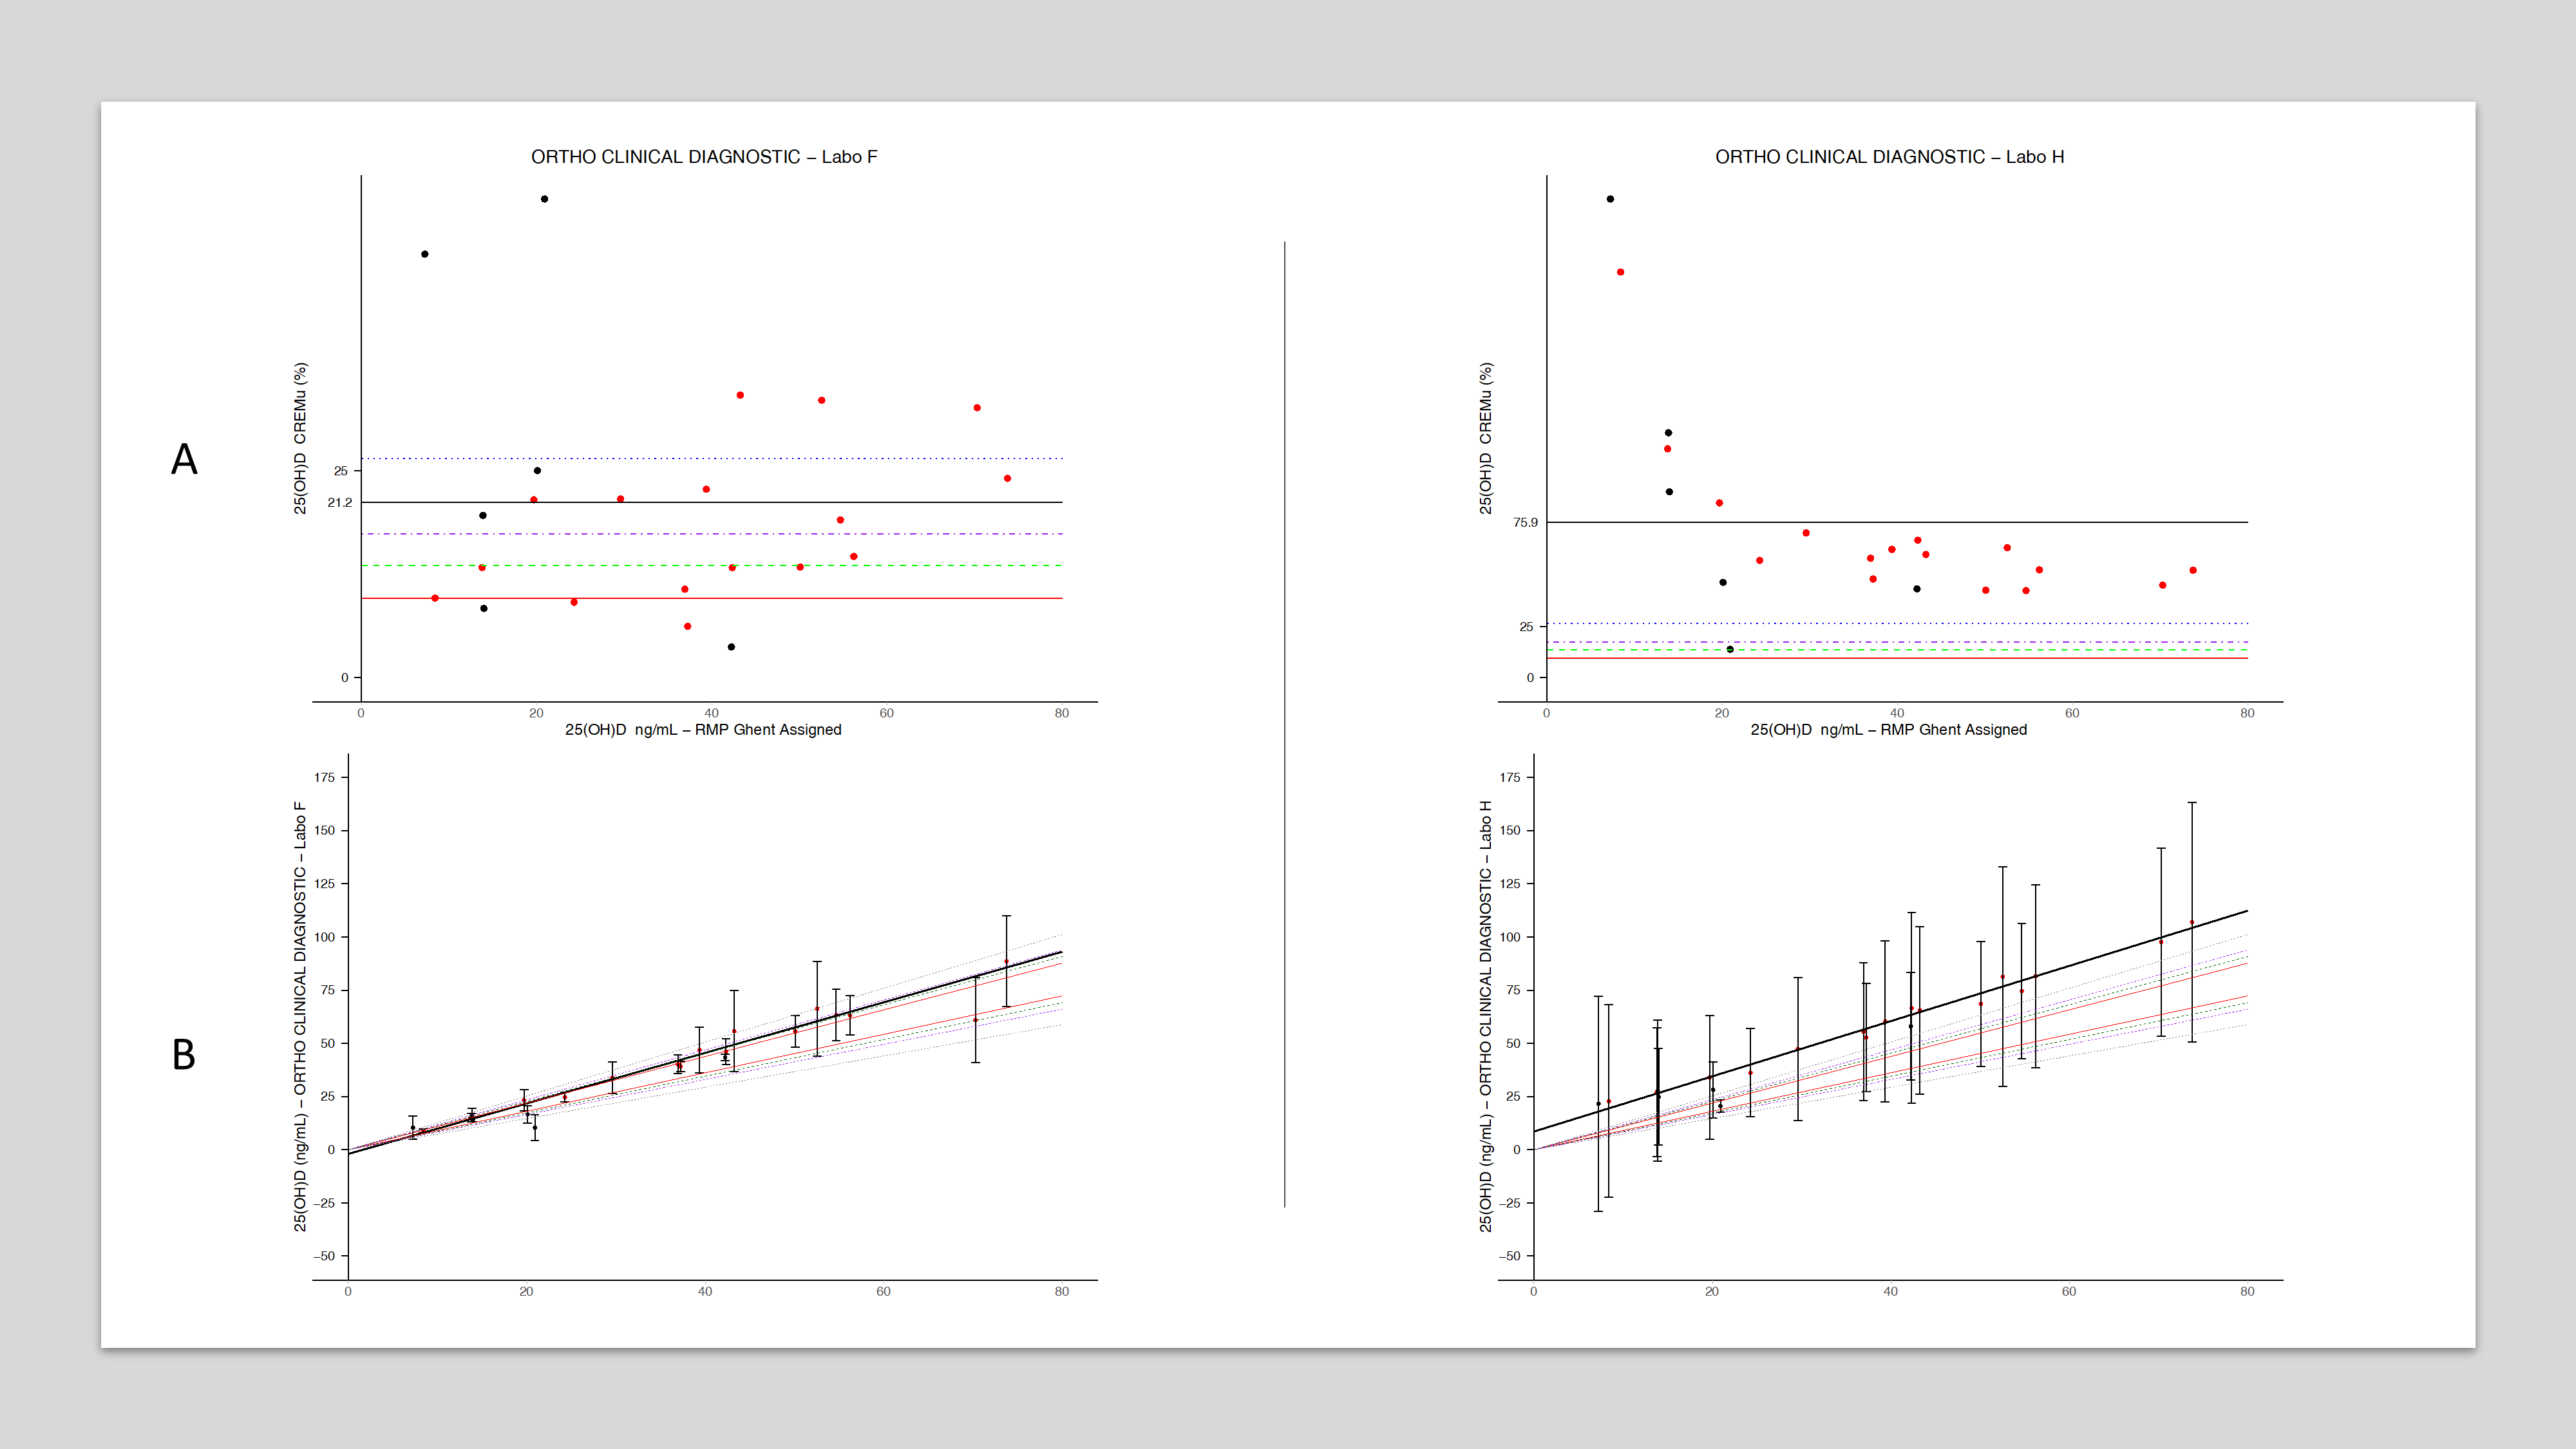
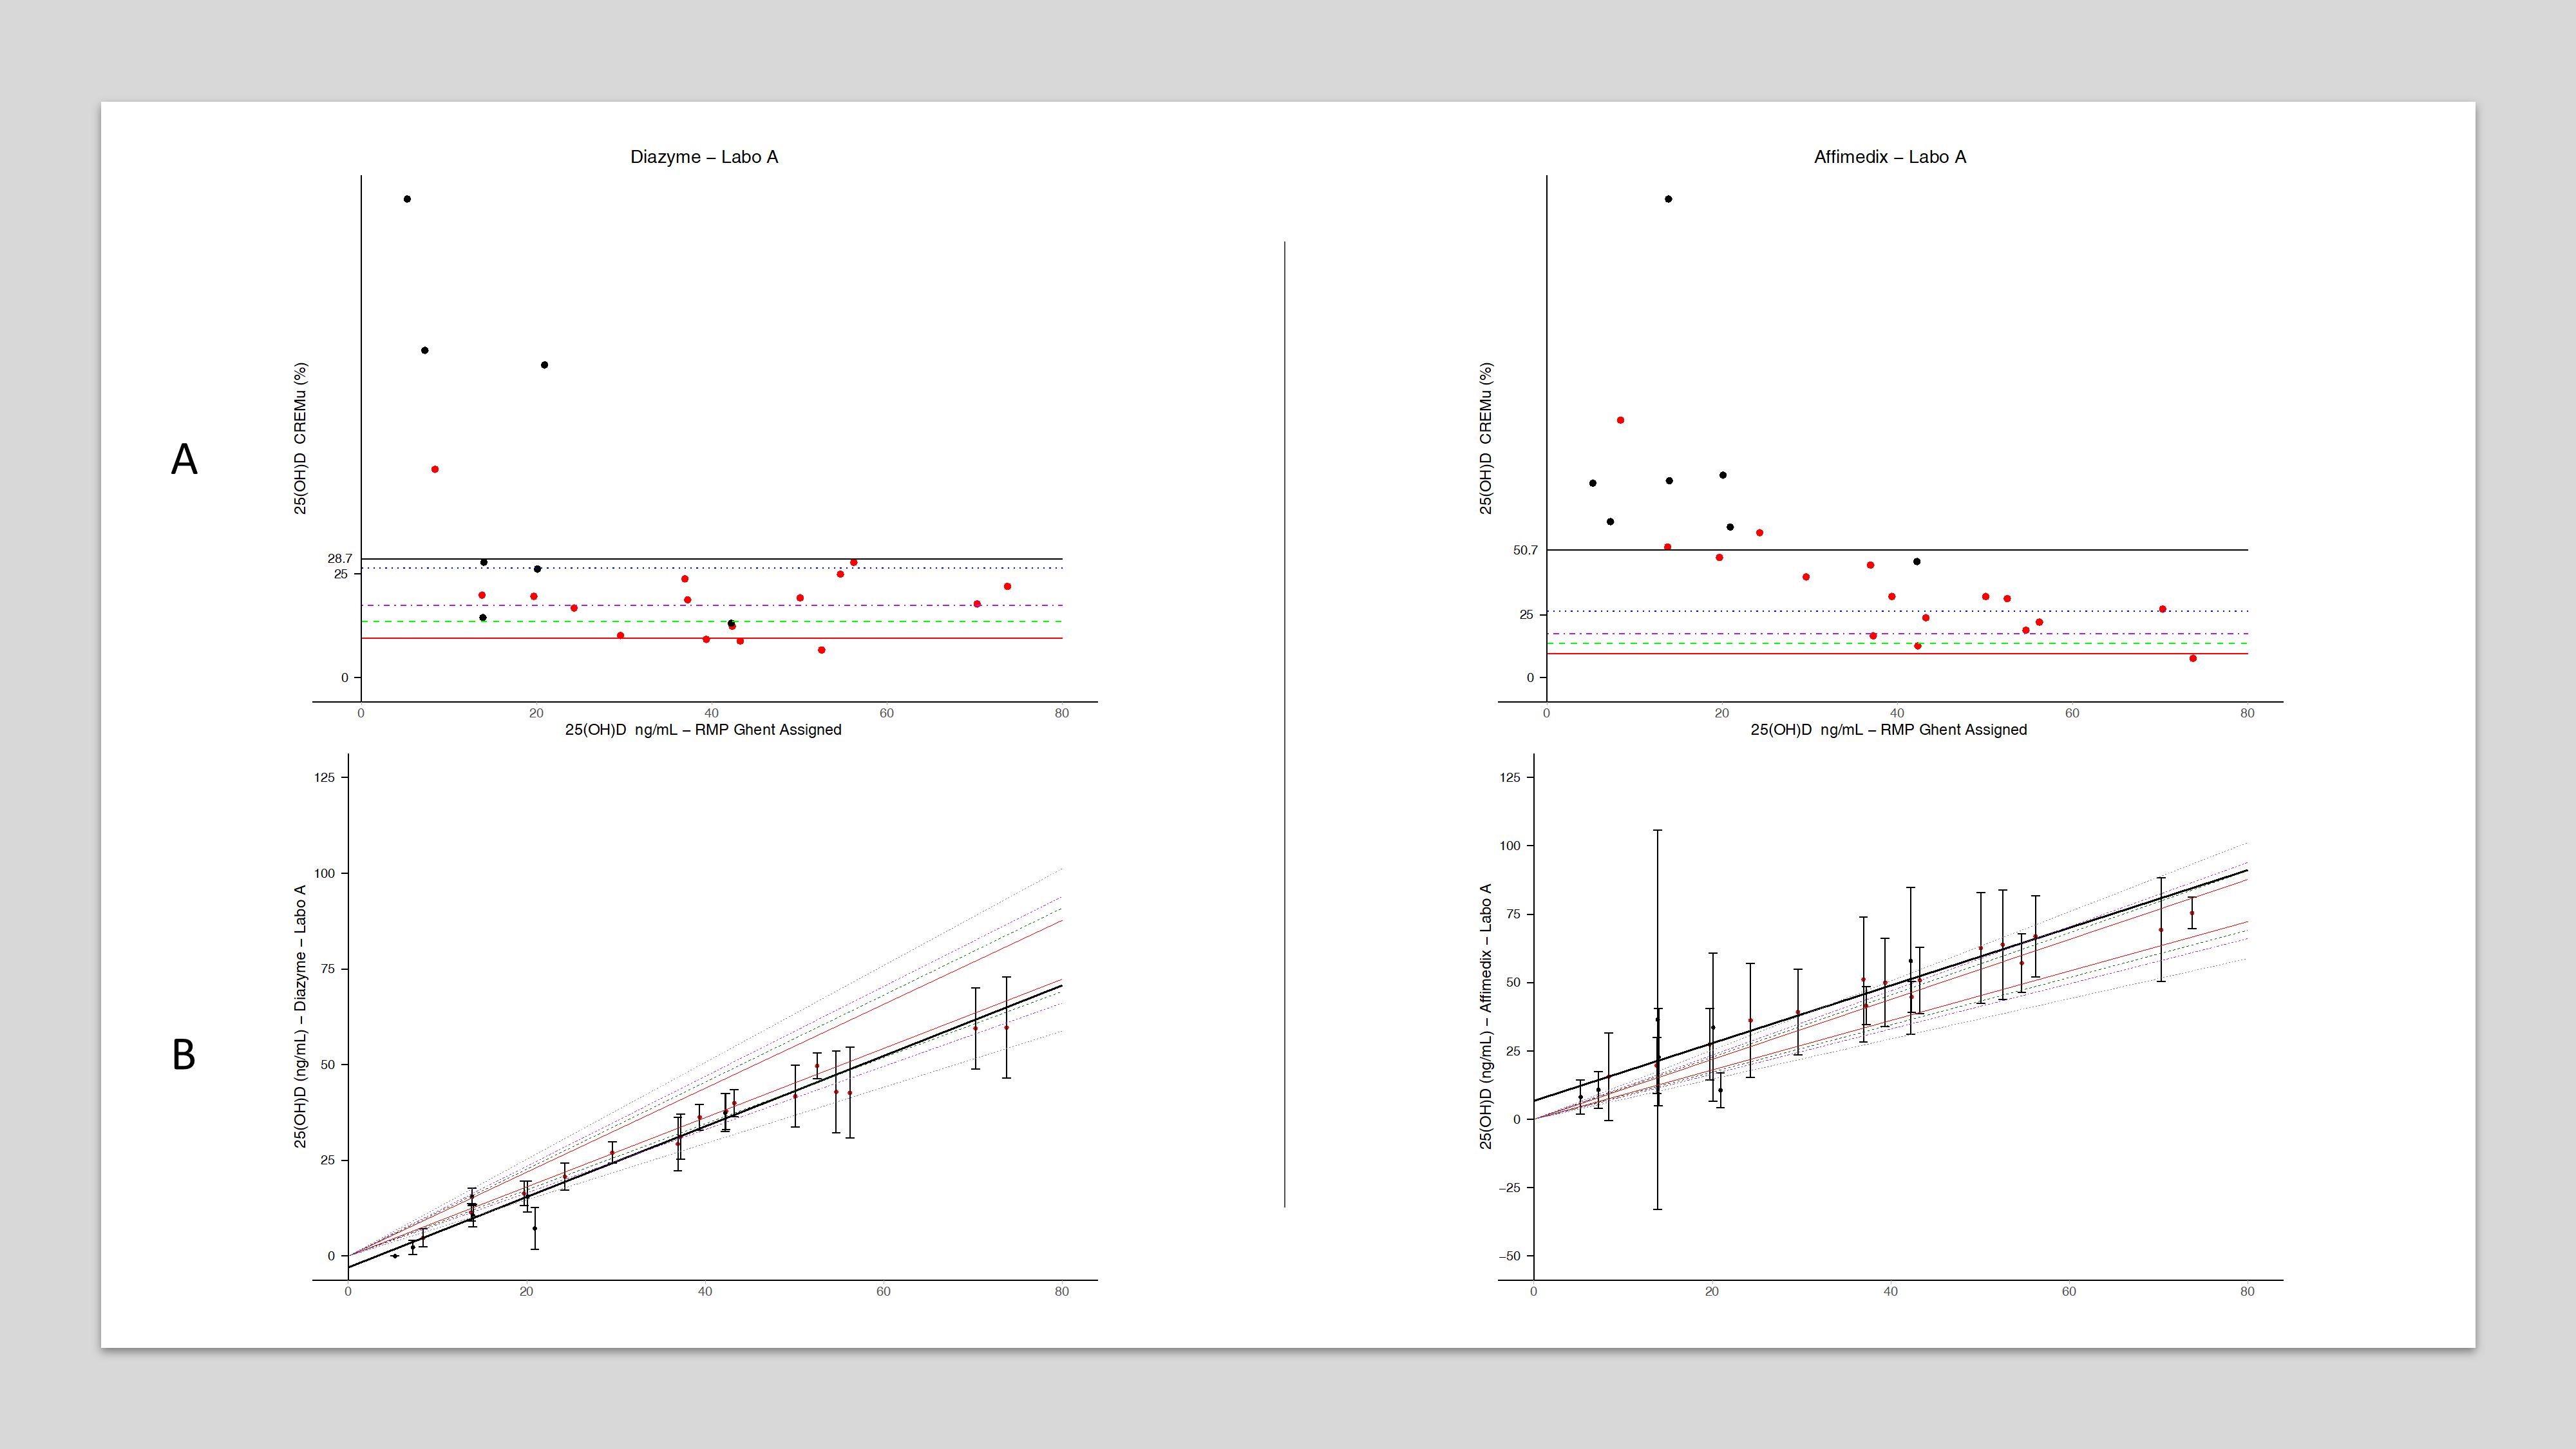
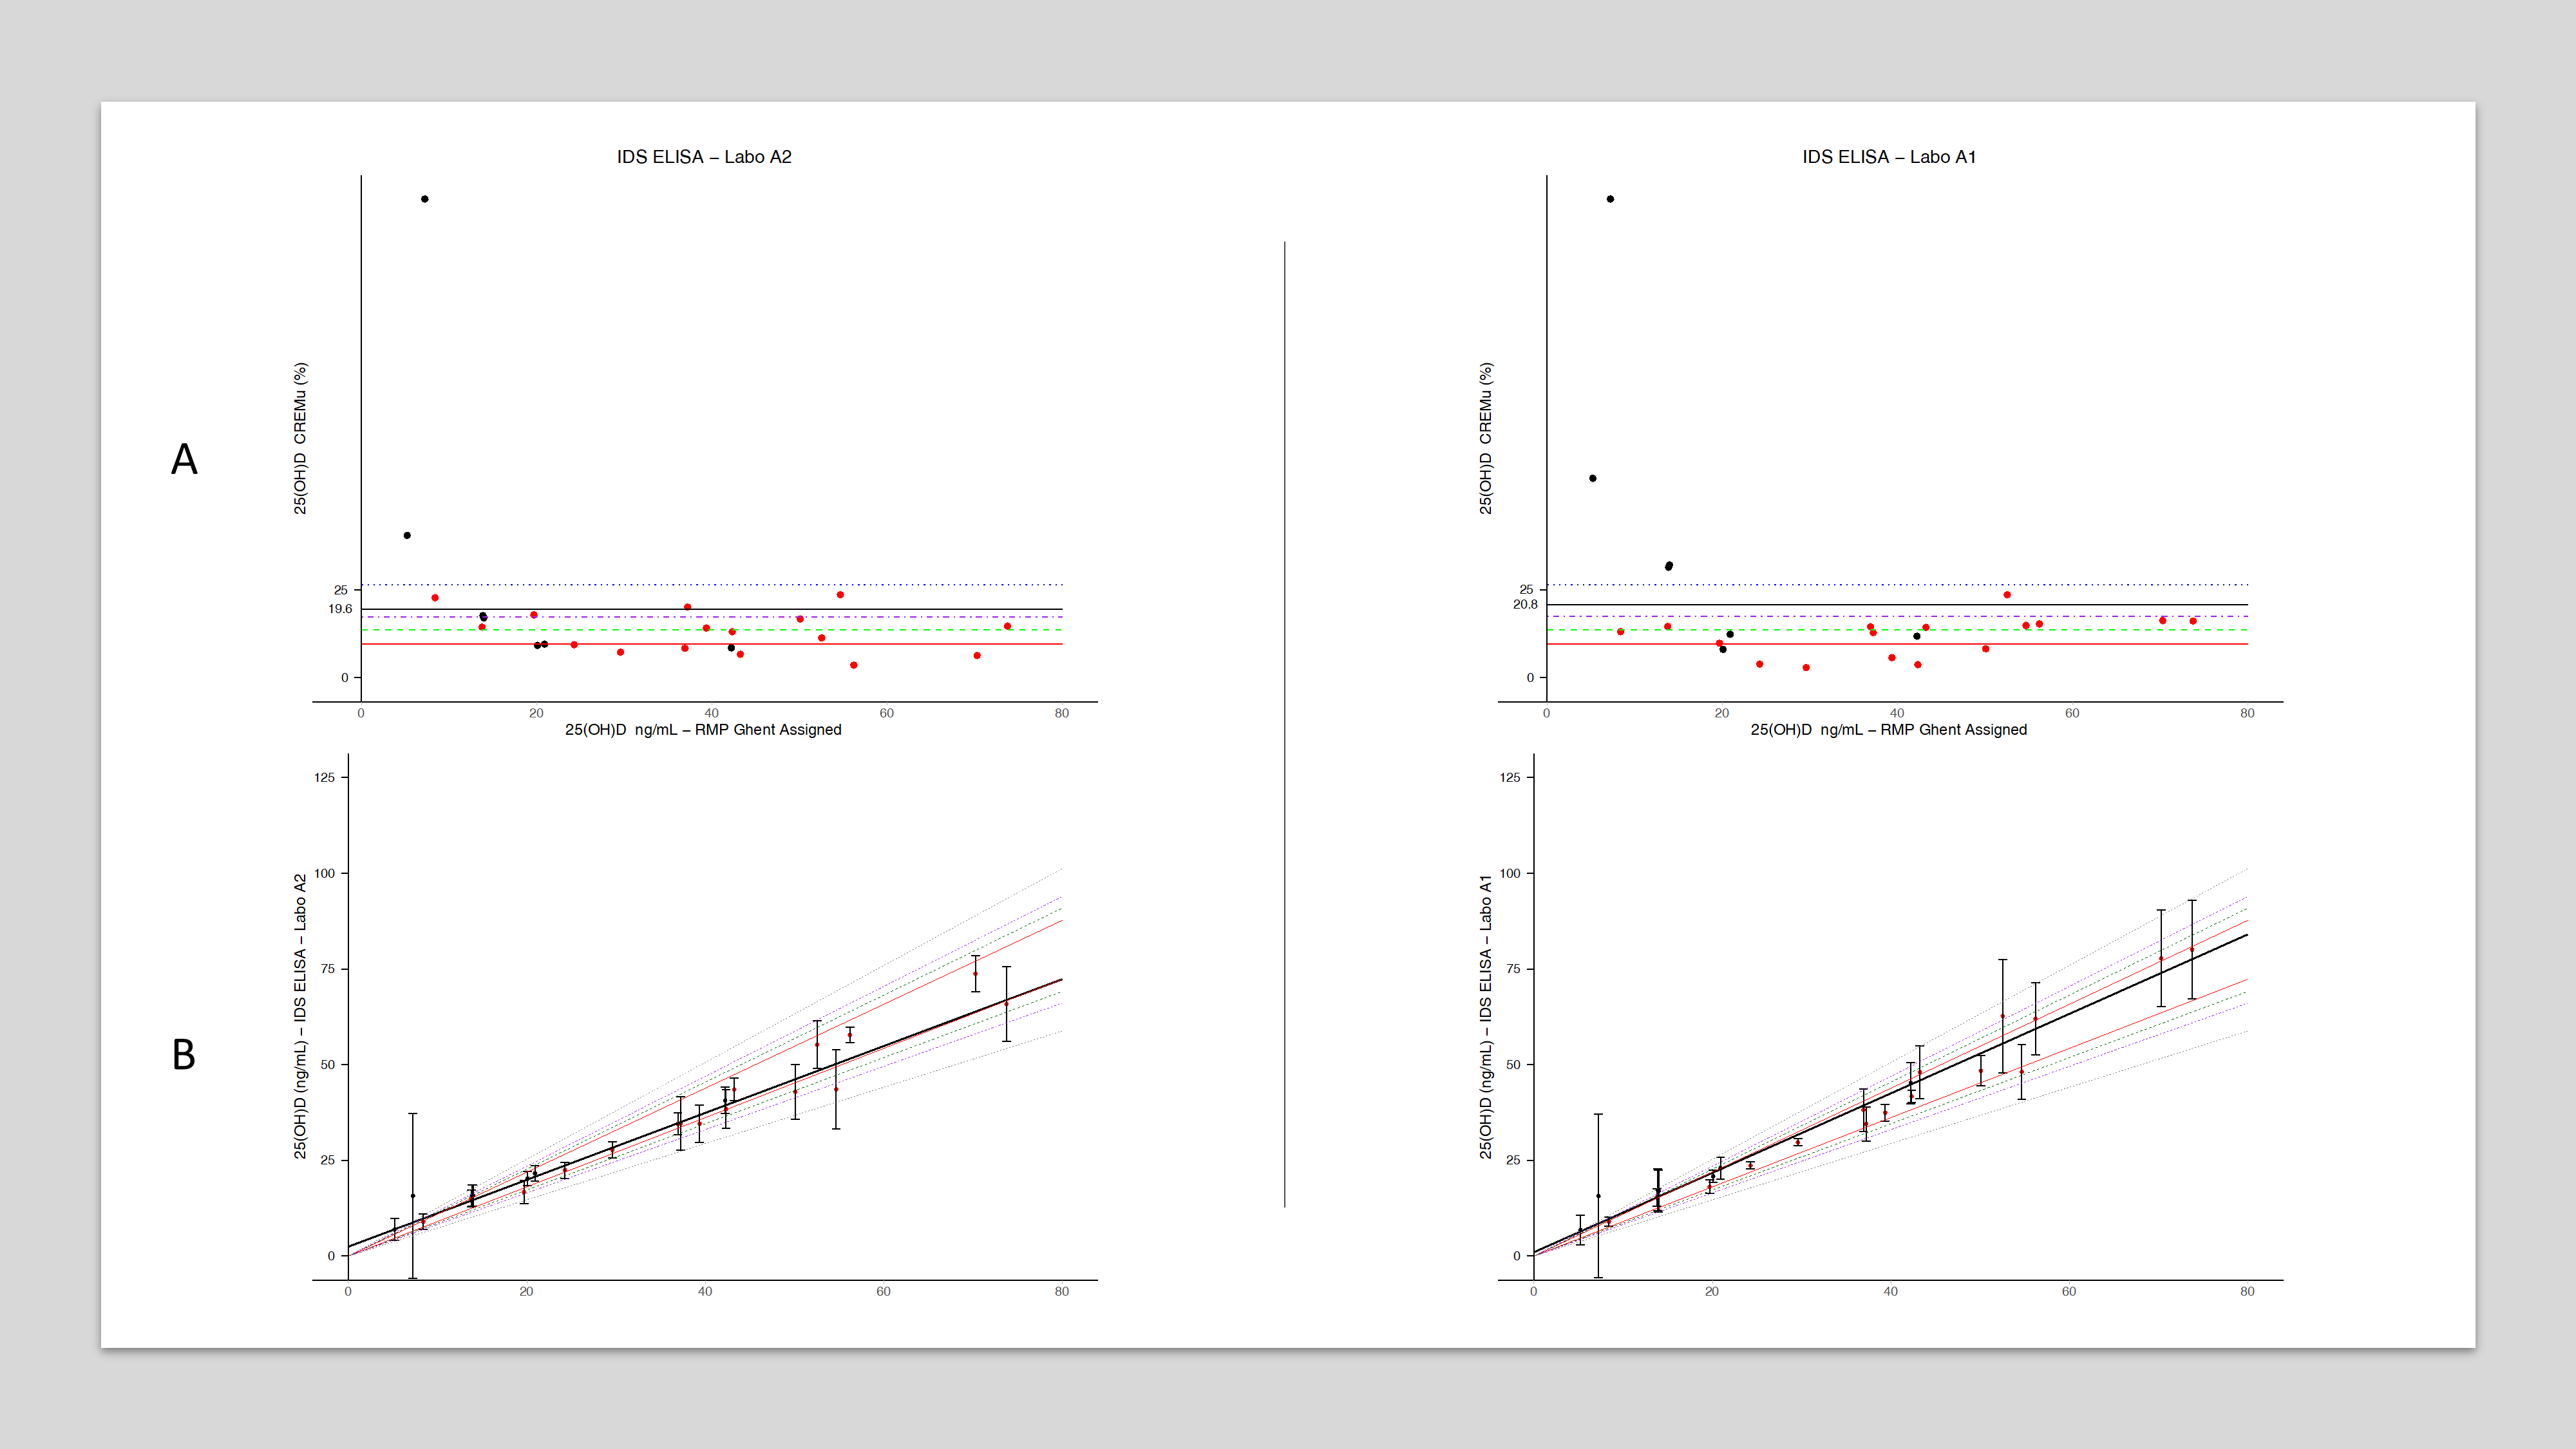
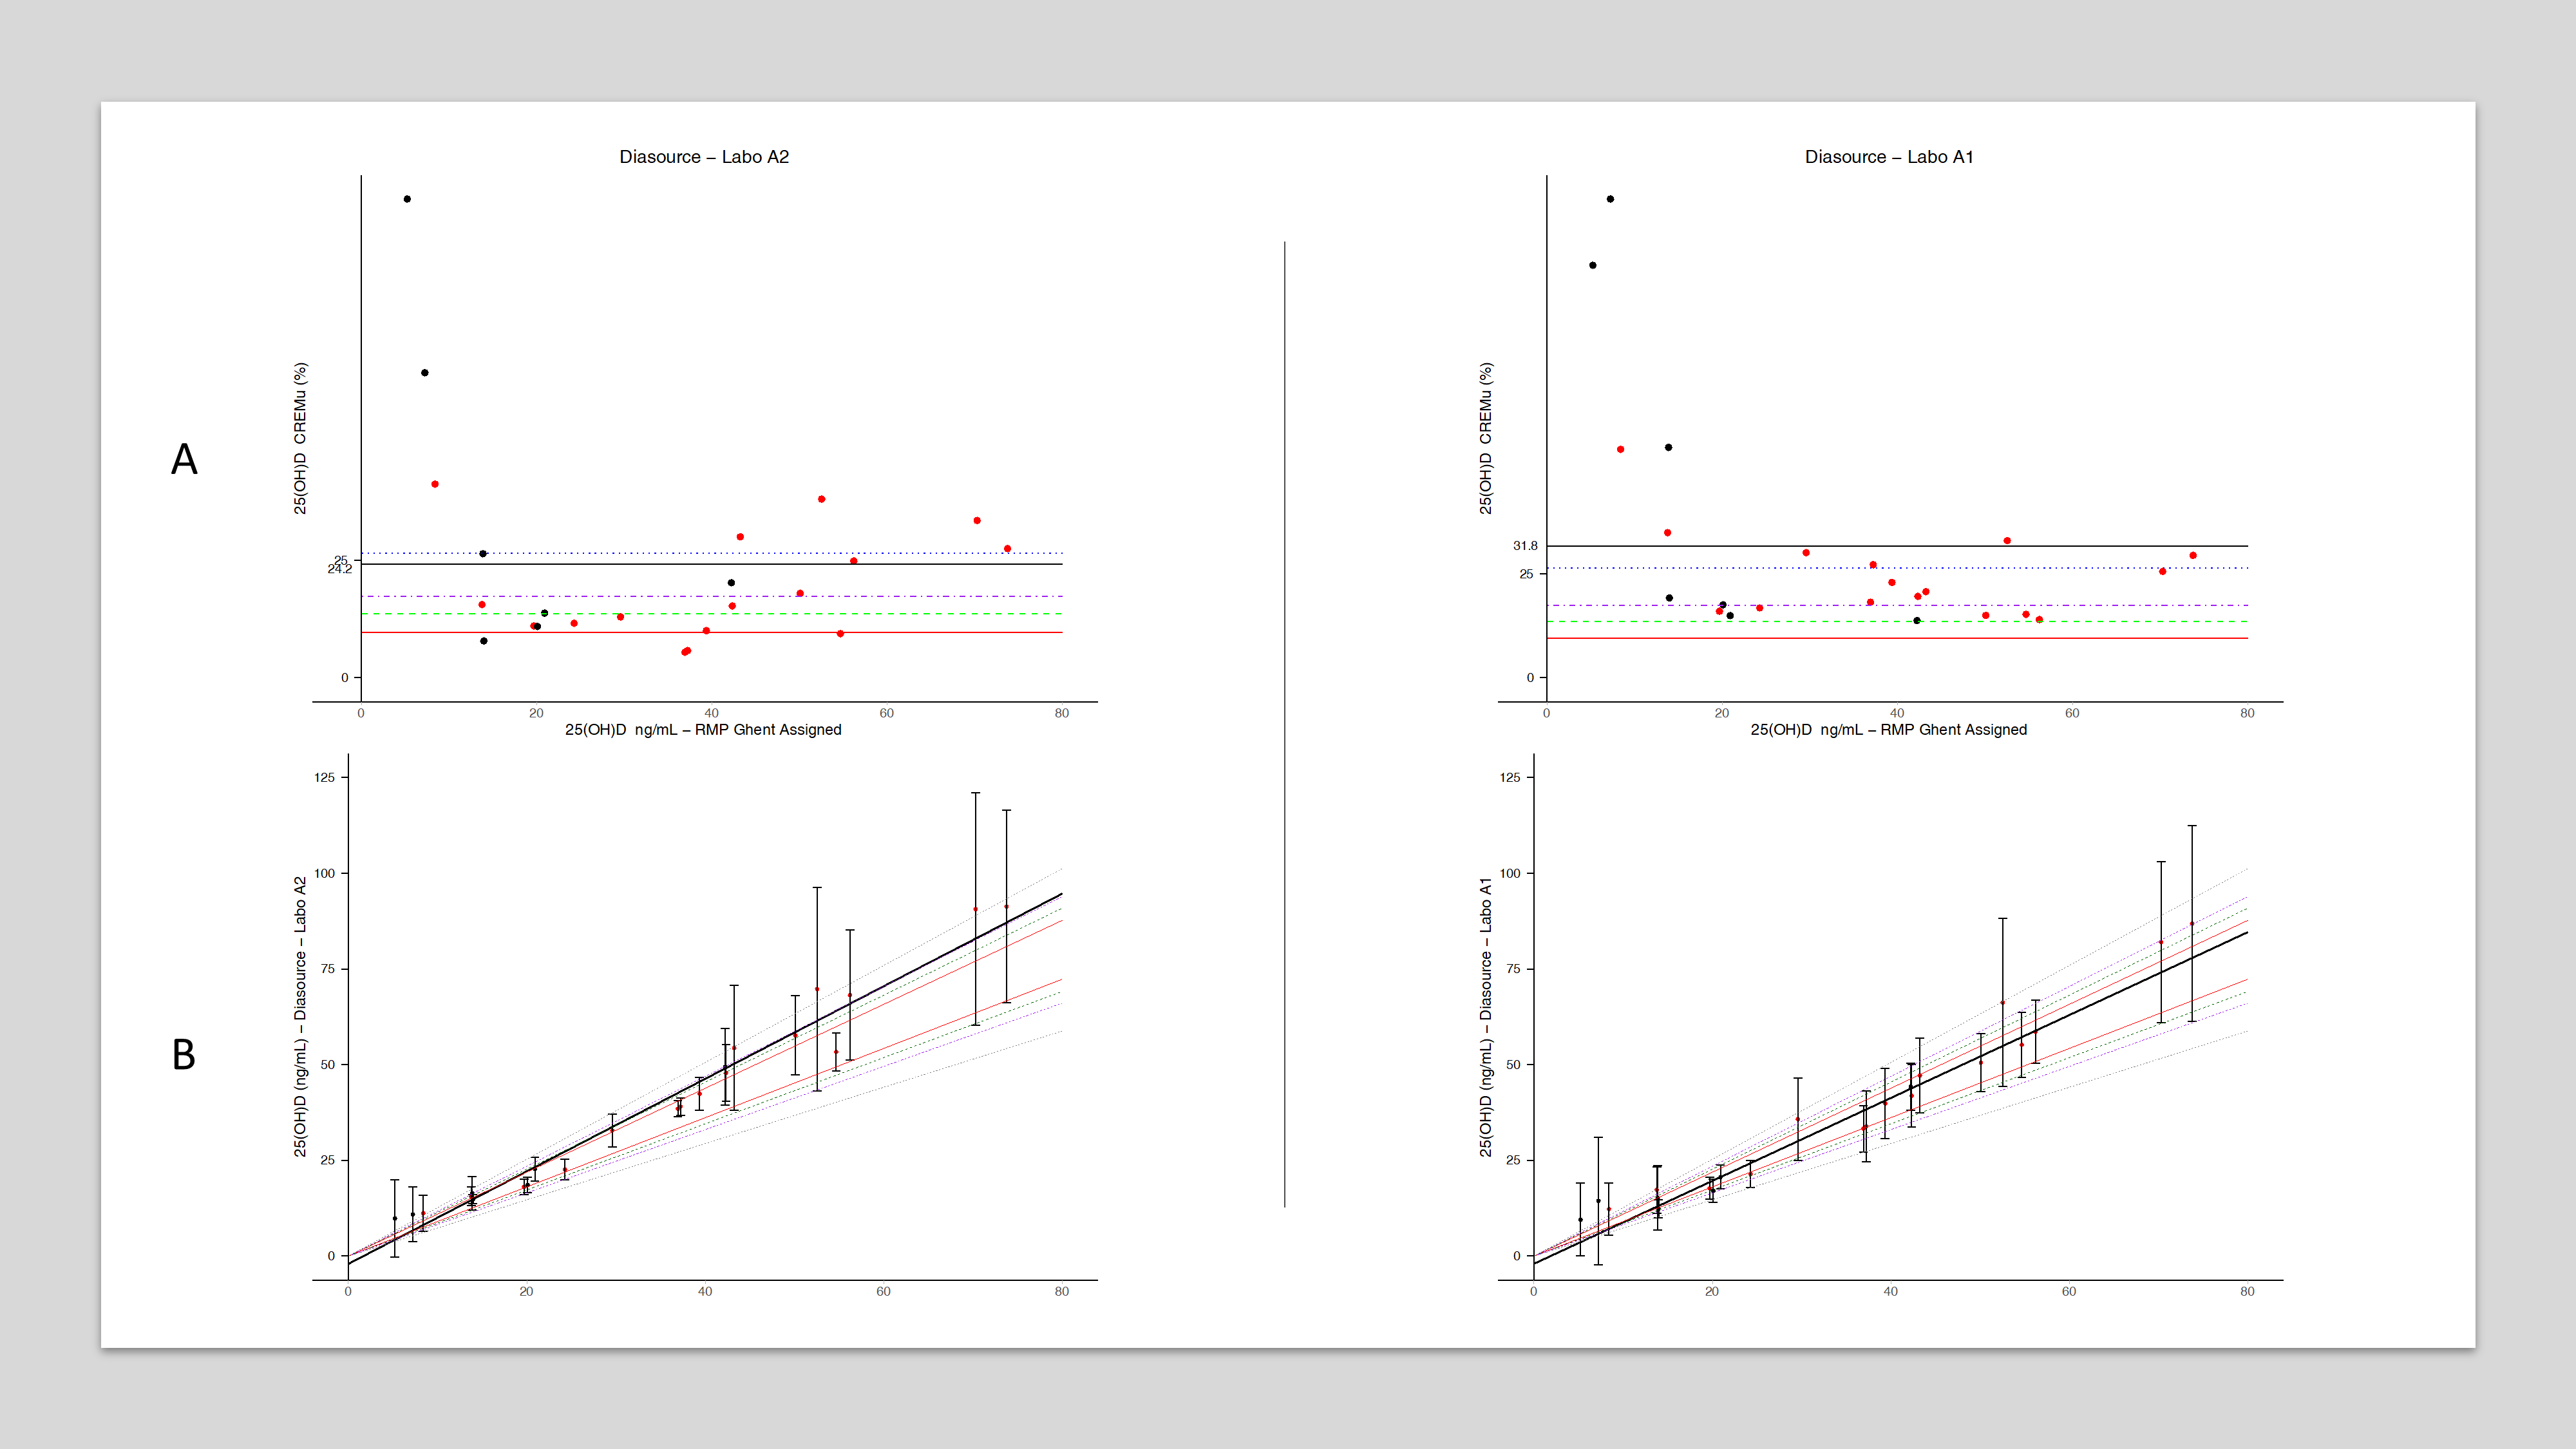
Figure 1 presents, for all methods combined, a set of correlation graph where the x-axis represents x(UGhentRMP) and the y-axis represents the mean of the 4 replicates for each sample included in the study. Each data point is displayed with an error bar corresponding to the calculated unexpanded Mu (%). V-shape tolerance limits were applied to each graph at x(UGhent)± 9.6 %, x(UGhent)± 13.6 %, x(UGhent)± 17.4% and x(UGhent)± 26.5 %. These limits represent the MU required for an analytical method to detect a 31.6 % physiological change in 25-(OH)D concentrations after a 10-weeks period with a probability of 99, 95, 90 and 80 %, respectively. The V-shaped zones provide a graphical representation of each method’s ability to track physiologically relevant changes. An assay is considered more clinically useful if its data points and MU bars fall within the narrower zones (e.g., within the±9.6 % or±13.6 % limits). LC-MS/MS methods consistently remained within the most stringent V-shape boundaries, confirming their ability to reliably track changes in vitamin D concentrations. In contrast, several immunoassays exceeded the broader V-shaped limits, indicating that their MU might compromise their ability to detect meaningful fluctuations in 25-(OH)D levels over time. Detailed individual plots for each method are provided in Supplementary Figures S1–S13.
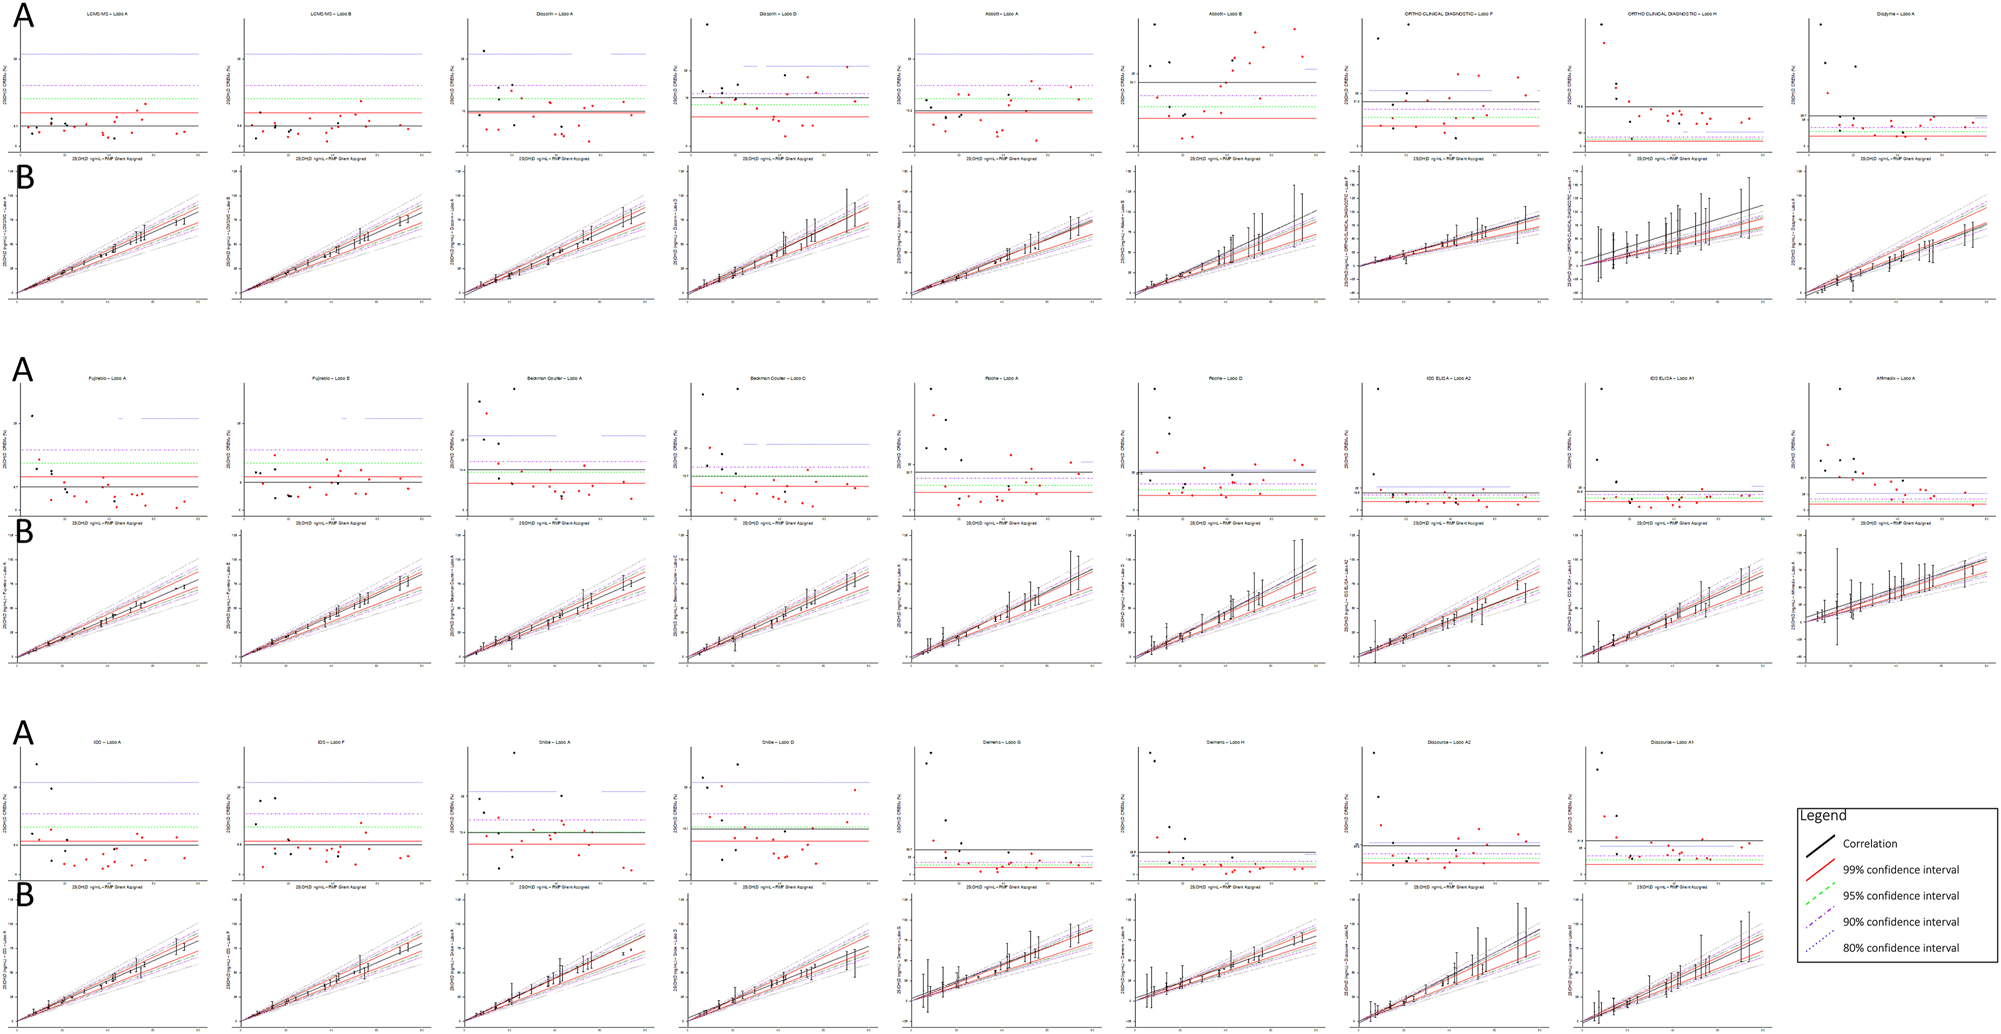
(A) Combined relative expanded measurement uncertainty (CREMU) across all immunoassays and LC-MS/MS methods. The CREMU (%) is plotted on the y-axis against the UGhent reference measurement procedure (RMP)-assigned 25(OH)D concentrations on the x-axis. Each method’s mean CREMU is shown, along with horizontal reference lines corresponding to the predefined analytical performance specifications (APS). This panel illustrates how methods perform across the concentration range and allows direct comparison between pooled samples (red dots) and single donations (black dots). (B) Combined correlation graphs with measurement uncertainty (MU) and V-shaped acceptance zones for all methods. Each data point represents the mean of four replicates per sample, with the x-axis showing the UGhent RMP-assigned value and the y-axis showing the method-specific mean. Vertical error bars indicate the calculated unexpanded MU (%). Superimposed V-shaped zones delineate thresholds of ±9.6 %, ±13.6 %, ±17.4 %, and ±26.5 % around the RMP value, reflecting the MU required to detect a 31.6 % physiological change in 25(OH)D concentrations over 10 weeks with probabilities of 99 , 95, 90, and 80 %, respectively. Methods with data points and MU bars within narrower zones (e.g., ±9.6 % or±13.6 %) are more likely to detect clinically meaningful changes reliably. LC-MS/MS methods consistently remain within the tightest zones, while some immunoassays exceed the broader limits, indicating potential limitations for longitudinal monitoring. Red dots represent pooled samples; black dots indicate individual single donations. Detailed method-specific plots are provided in Supplementary Figures S1–S13.
An alternative graphical representation of the results is also shown in Figure 1. In this approach, the CREMU (%) is plotted on the y-axis against the x-axis, which represents UGhent RMP. The mean CREMU (%) is displayed for each method, along with horizontal reference lines corresponding to the previously mentioned limits. This graph effectively illustrates how the methods behave across different concentrations and allows for an immediate comparison between pooled samples and single donations, as well as differences between methods.
For instance, Abbott shows a significant increase in CREMU at higher 25-(OH)D concentrations in one out of the two laboratories, likely due to high cross-reactivity with other vitamin D metabolites, such as 24,25-(OH)2 vitamin D. In the case of Ortho, the discrepancy between the two laboratories is quite pronounced, possibly due to an incorrect calibrator value assignment in one of the lots. Siemens exhibits a notably high CREMU in the low concentration range, particularly for single donations, which may be attributed to a matrix effect – though the pools with similar low concentrations also show elevated CREMU. Lastly, the figure highlights the excellent performance of LC-MS/MS methods, alongside certain immunoassays such as Fujirebio and IDS.
Discussion
In this study, we have used eight single donations of serum and 17 pools made from remnant samples spanning the measurement range to compare the performances of thirteen immunoassays and two distinct LC-MS/MS methods with the RMP from the University of Ghent. The samples have been measured in duplicate on two consecutive days in two different laboratories and we calculated the imprecision (CV%), the bias and the measurement uncertainty for each data point obtained with each method.
The 25-(OH)D imprecision and bias of most of these methods had previously been estimated by Wise et al. according to the VDSP APS (mean bias <|5 %| and mean CV<10 %) in 50 single-donor samples containing 25-(OH)D2 and 25-(OH)D3 or 25-(OH)D3 alone [17]. The results showed that three of the 12 methods they tested failed to pass, mainly due to a mean bias that exceeded the allowable limit of |5 %|. In our study, both LC-MS/MS, Beckman and DiaSorin were able to pass the VDSP criteria whereas this was the case for one lab (or technician) out of two for Fujirebio, Abbott, IDS iSYS and IDS ELISA. All the other methods failed. The reason for failing to pass the VDSP was the bias, which was higher than±5 %. Of note, one of the labs failed with Fujirebio while presenting a CV of 1.7 % and a bias of −5.6 % whereas a lab using DiaSorin succeeded with a CV of 9.9 % and a bias of 4.6 %.
The sample pass rate, which is an interesting metrics proposed by the VDSCP to evaluate the percentage of individual samples that pass the VDSP APS, is also of interest. If the two LC-MS/MS methods and one lab using IDS iSYS presented a high sample pass rate (from 65.2 to 87.0 %), the percentage dropped to around 50 % for the other iSYS system and Fujirebio to 30 % for the tests who succeeded the VDSP (Beckman and DiaSorin) and 20 % or lower for the other methods.
The JCTLM TF-RMSI has recently proposed APS for vitamin D measurement, establishing desirable and minimum thresholds for measurement uncertainty at≤10 % and ≤15 %, respectively [10]. We applied these APS to evaluate the ability of different methods to meet these criteria. Our findings show that slightly more than half of the tested methods met the≤10 % target, while only four methods failed to stay within the≤15 % limit, suggesting that this threshold may be relatively permissive. When applying the IFCC-IOF C-BM approach-assessing a method’s likelihood of detecting a physiological change based on its uncertainty [13] - we found a strong alignment with the TF-RMSI APS. Specifically, methods classified as virtually certain, very likely, or more than likely to detect this change corresponded to those meeting the<10 % APS, whereas those classified as only likely (or failing to detect the change) did not meet this APS.
Another key objective of this study was to assess the feasibility of using MU and novel graphical representations to visually evaluate assay performance. Traditional assessments of analytical performance often rely on separate evaluations of bias and imprecision and do not always provide an intuitive representation of whether an assay can reliably detect physiologically relevant changes in 25-(OH)D concentrations. By integrating MU into graphical representations, the approach we propose allows for a more holistic assessment of method performance, combining analytical errors into a single visualization. One of the major advantages of these graphs is that they provide an immediate and intuitive overview of an assay’s reliability, making it easier to compare different methods at a glance. Instead of requiring a detailed examination of multiple performance metrics, laboratorians and clinicians can quickly assess whether an assay’s MU is low enough to ensure the reliable detection of clinically relevant changes in vitamin D status. While numerical APS thresholds remain essential for standardization and certification, we believe that graphical representation enhances the interpretation of assay reliability by offering a more clinically meaningful perspective. Future standardization efforts should consider integrating both numerical MU assessments and intuitive visual tools to provide a more comprehensive evaluation of method performance.
Our study has however some weaknesses. It was conducted in only two laboratories per method, raising the question of whether these labs are fully representative of broader clinical and research settings. This is particularly relevant given that substantial inter-laboratory differences were observed for some immunoassays, despite their use under routine conditions. Also, while the two LC-MS/MS methods in this study showed comparable performance, in-house developed LC-MS/MS methods can exhibit significant variability in accuracy and precision across different laboratories. Therefore, caution should be exercised when generalizing these findings to other in-house LC-MS/MS methods that were not included in this study. Another limitation is that the commutability of the samples (i.e. the generated pools and the single donations) has not been established. Furthermore, most of the single donations had 25-(OH)D concentrations lower than 20 μg/L, whereas of the majority of the pools exhibited concentrations higher than 20 μg/L. Matrix effects are thus possible even though, visually, we did not observe overt discrepancies in behavior between the pools and the single donations. The nature of the anonymized samples, both single donations and pools (by definition), that were used in this study can also be questioned. The single donations came from apparently healthy subjects from the United-States, and no data were available on the ethnicity of the subjects. It is well known that vitamin D binding protein (VDBP) is highly polymorphic, and that allelic combinations differ in their affinities for vitamin D metabolites, circulating concentrations, and geographical and ethnic distribution [18]. The pools were made of remnant anonymized single serum samples coming from the routine practice of the CHU de Liege and it is very well possible that some of these samples were from patients suffering from CKD or hemodialyzed patients. It is well known that immunoassays for vitamin D can be affected by CKD [19], 20] which might explain differences observed in this study compared to external quality assessment schemes and similar studies using donations from healthy individuals only [21], 22]. Pregnancy, especially in the last trimester, can also affect VDBP concentrations [19], but the CHU de Liège does not have a maternity ward and there is highly improbable that a substantial number of samples coming from pregnant women were included in the pools.
Also, in this study, the estimation of MU was primarily based on a bottom-up approach, using within-laboratory imprecision (uRw) and bias relative to the RMP. Although ISO 20914 recommends a top-down approach incorporating all uncertainty sources along the traceability chain, including the uncertainty associated with reference materials (uref) and calibrator value assignment (ucal), these data could not be easily retrieved. Moreover, no MU estimates are provided by manufacturers in the kit inserts or validation documentation (a limitation we regret and believe should be addressed), making a full top-down estimation impractical. Since the bias component in our MU calculation is derived from comparison against the RMP, it implicitly covers part of the uncertainty linked to the calibration hierarchy. Therefore, for laboratories that do not design measurement procedures from scratch, a bottom-up estimation represents a pragmatic and acceptable approach to assess MU.
The study has also many strengths. The protocol we used is similar to the VDSCP and the study was performed in a total independence from the manufacturers, in a large number of experienced laboratories situated in various countries across Europe. Moreover, each method was run in at least two laboratories or two different technicians (except Affimedix). The results of this study should however not be over interpreted. As already mentioned, the excellent performance of the LC-MS/MS is not per definition representative for all LC-MS/MS methods and the performance of the immunoassays depicted in this study is only relevant for the lots of reagents and calibrators used.
Overall, this study highlights the persistent variability in 25-(OH)D assay performance despite ongoing standardization efforts. While LC-MS/MS methods have demonstrated superior accuracy and lower measurement uncertainty, certain immunoassays also met the established analytical performance specifications. The study underscores the importance of integrating measurement uncertainty into performance evaluations and introduces novel graphical representations to enhance the interpretation of assay reliability. However, limitations such as inter-laboratory variability, potential matrix effects, and the absence of commutability assessments should be considered when interpreting the findings. Future standardization initiatives should further explore the use of uncertainty-based metrics and visualization tools to improve method comparability and ensure clinically meaningful assessments of vitamin D status.
Acknowledgments
We would like to thank the colleagues who kindly accepted to measure the samples: Inge De Cuyper and Dieter Desmet (AZ Delta), Marie-Louise Schleck (Hôpital de la Citadelle), Lucas Dewalque (CHC Mont-Légia), Emilie Catry (CHU UCL Mont-Godinne), Fleur Wolf, and Frédéric Cotton (LHUB Bruxelles).
-
Research ethics: Not applicable, as the study used anonymized pooled serum samples, and no patient-identifiable information was collected or processed.
-
Informed consent: Not applicable.
-
Author contributions: All authors have accepted responsibility for the entire content of this manuscript and approved its submission. Soft-enter replaced as Paramark, EC, HPB, ACH, GL, VD, KVU, KM, NRJ, MH, RP, PL, SDV, and CGF contributed to the design, data collection, analysis, and interpretation of the study. EC drafted the manuscript, and all authors critically revised it.
-
Use of Large Language Models, AI and Machine Learning Tools: None declared.
-
Conflict of interest: EC is a consultant for IDS, DiaSorin, Fujirebio, Snibe, and Roche Diagnostics. All other authors state no conflict of interest.
-
Research funding: None declared.
-
Data availability: The data supporting the findings of this study are available from the corresponding author upon reasonable request.
References
1. Sempos, CT, Heijboer, AC, Bikle, DD, Bollerslev, J, Bouillon, R, Brannon, PM, et al.. Vitamin D assays and the definition of hypovitaminosis D: results from the first international conference on controversies in vitamin D. Br J Clin Pharmacol 2018;25.10.1111/bcp.13652Suche in Google Scholar PubMed PubMed Central
2. Sempos, CT, Vesper, HW, Phinney, KW, Thienpont, LM, Coates, PM, Vitamin D Standardization Program VDSP. Vitamin D status as an international issue: national surveys and the problem of standardization. Scand J Clin Lab Invest 2012;243:32–40. https://doi.org/10.3109/00365513.2012.681935.Suche in Google Scholar PubMed
3. Tai, SS-C, Bedner, M, Phinney, KW. Development of a candidate reference measurement procedure for the determination of 25-hydroxyvitamin D3 and 25-hydroxyvitamin D2 in human serum using isotope-dilution liquid chromatography-tandem mass spectrometry. Anal Chem 2010;82:1942–8. https://doi.org/10.1021/ac9026862.Suche in Google Scholar PubMed PubMed Central
4. Stepman, HCM, Vanderroost, A, Van Uytfanghe, K, Thienpont, LM. Candidate reference measurement procedures for serum 25-Hydroxyvitamin D3 and 25-Hydroxyvitamin D2 by using isotope-dilution liquid chromatography-tandem mass spectrometry. Clin Chem 2011;57:441–8. https://doi.org/10.1373/clinchem.2010.152553.Suche in Google Scholar PubMed
5. Mineva, EM, Schleicher, RL, Chaudhary-Webb, M, Maw, KL, Botelho, JC, Vesper, HW, et al.. A candidate reference measurement procedure for quantifying serum concentrations of 25-hydroxyvitamin D3 and 25-hydroxyvitamin D2 using isotope-dilution liquid chromatography-tandem mass spectrometry. Anal Bioanal Chem 2017;407:5615–24. https://doi.org/10.1007/s00216-015-8733-z.Suche in Google Scholar PubMed PubMed Central
6. Stöckl, D, Sluss, PM, Thienpont, LM. Specifications for trueness and precision of a reference measurement system for serum/plasma 25-hydroxyvitamin D analysis. Clin Chim Acta 2009;408:8–13. https://doi.org/10.1016/j.cca.2009.06.027.Suche in Google Scholar PubMed
7. Fraser, CG. The 1999 Stockholm consensus conference on quality specifications in laboratory medicine. Clin Chem Lab Med 2015;53; 837–40. https://doi.org/10.1515/cclm-2014-0914.Suche in Google Scholar PubMed
8. Sempos, CT, Betz, JM, Camara, JE, Carter, GD, Cavalier, E, Clarke, MW, et al.. General steps to standardize the laboratory measurement of serum total 25-hydroxyvitamin D. JAOAC Int 2017;100:1230–3. https://doi.org/10.5740/jaoacint.17-0259.Suche in Google Scholar PubMed
9. CDC. CDC Vitamin Standardization-Certification Program (CDC VDSCP) Certified total 25-hydroxyvitamin D procedures.Suche in Google Scholar
10. Panteghini, M, Braga, F, Camara, JE, Delatour, V, Van Uytfanghe, K, Vesper, HW, et al.. Optimizing available tools for achieving result standardization: value added by joint committee on traceability in laboratory medicine (JCTLM). Clin Chem 2021;67:1590–605. https://doi.org/10.1093/clinchem/hvab178.Suche in Google Scholar PubMed
11. Sandberg, S, Fraser, CG, Horvath, AR, Jansen, R, Jones, G, Oosterhuis, W, et al.. Defining analytical performance specifications: consensus statement from the 1st strategic conference of the european Federation of clinical chemistry and laboratory medicine. Clin Chem Lab Med 2015:53;833–5. https://doi.org/10.1515/cclm-2015-0067.Suche in Google Scholar PubMed
12. Carobene, A, Strollo, M, Jonker, N, Barla, G, Bartlett, WA, Sandberg, S, et al.. Collections from healthy volunteers for biological variation estimates’ update: a new project undertaken by the working group on biological variation established by the european federation of clinical chemistry and laboratory medicine. Clin Chem Lab Med 2016;54:1599–608. https://doi.org/10.1515/cclm-2016-0035.Suche in Google Scholar PubMed
13. Cavalier, E, Fraser, CG, Bhattoa, HP, Heijboer, AC, Makris, K, Ulmer, CZ, et al.. Analytical performance specifications for 25-hydroxyvitamin d examinations. Nutrients 2021;28:13.10.3390/nu13020431Suche in Google Scholar PubMed PubMed Central
14. Fraser, CG. Reference change values. Clin Chem Lab Med 2012;50:807–12. https://doi.org/10.1515/cclm.2011.733.Suche in Google Scholar PubMed
15. Fabregat-Cabello, N, Farre-Segura, J, Huyghebaert, L, Peeters, S, Le Goff, C, Souberbielle, JC, et al.. A fast and simple method for simultaneous measurements of 25(OH)D, 24,25(OH)2D and the vitamin D metabolite ratio (VMR) in serum samples by LC-MS/MS. Clin Chim Acta 2017;473:116–23. https://doi.org/10.1016/j.cca.2017.08.024.Suche in Google Scholar PubMed
16. Elsenberg, EHAM, ten Boekel, E, Huijgen, H, Heijboer, AC. Standardization of automated 25-hydroxyvitamin D assays: how successful is it? Clin Biochem 2017;50:1126–30. https://doi.org/10.1016/j.clinbiochem.2017.06.011.Suche in Google Scholar PubMed
17. Wise, SA, Camara, JE, Sempos, CT, Lukas, P, Le Goff, C, Peeters, S, et al.. Vitamin D standardization program (VDSP) intralaboratory study for the assessment of 25-hydroxyvitamin D assay variability and bias. J Steroid Biochem Mol Biol 2021;212:105917. https://doi.org/10.1016/j.jsbmb.2021.105917.Suche in Google Scholar PubMed PubMed Central
18. Arnaud, J, Constans, J. Affinity differences for vitamin D metabolites associated with the genetic isoforms of the human serum carrier protein (DBP). Hum Genet 1993;92:183–8. https://doi.org/10.1007/bf00219689.Suche in Google Scholar PubMed
19. Heijboer, AC, Blankenstein, Ma., Kema, IP, Buijs, MM. Accuracy of 6 routine 25-hydroxyvitamin D assays: influence of vitamin D binding protein concentration. Clin Chem 2012;58:543–8. https://doi.org/10.1373/clinchem.2011.176545.Suche in Google Scholar PubMed
20. Cavalier, E, Lukas, P, Bekaert, A-C, Peeters, S, Le Goff, C, Yayo, E, et al.. Analytical and clinical evaluation of the new fujirebio lumipulse non-competitive assay for 25(OH)-Vitamin D and three immunoassays for 25(OH)D in healthy subjects, osteoporotic patients, third trimester pregnant women, healthy African subjects. Clin Chem Lab Med 2016;54:1347–55. https://doi.org/10.1515/cclm-2015-0923.Suche in Google Scholar PubMed
21. Cavalier, E, Lukas, P, Crine, Y, Peeters, S, Carlisi, A, Le Goff, C, et al.. Evaluation of automated immunoassays for 25(OH)-vitamin D determination in different critical populations before and after standardization of the assays. Clin Chim Acta 2014;431:60–5. https://doi.org/10.1016/j.cca.2014.01.026.Suche in Google Scholar PubMed
22. Makris, K, Bhattoa, HP, Cavalier, E, Phinney, K, Sempos, CT, Ulmer, CZ, et al.. Recommendations on the measurement and the clinical use of vitamin D metabolites and vitamin D binding protein - a position paper from the IFCC committee on bone metabolism. Clin Chim Acta 2021;517:171–97. https://doi.org/10.1016/j.cca.2021.03.002.Suche in Google Scholar PubMed PubMed Central
Supplementary Material
This article contains supplementary material (https://doi.org/10.1515/cclm-2025-0554).
© 2025 Walter de Gruyter GmbH, Berlin/Boston
- Supplementary Material
- Supplementary Material
- Supplementary Material
- Supplementary Material
- Supplementary Material
- Supplementary Material
- Supplementary Material
- Supplementary Material
- Supplementary Material
- Supplementary Material
- Supplementary Material
- Supplementary Material
- Supplementary Material
- Supplementary Material
Artikel in diesem Heft
- Frontmatter
- Editorial
- Quality indicators: an evolving target for laboratory medicine
- Reviews
- Regulating the future of laboratory medicine: European regulatory landscape of AI-driven medical device software in laboratory medicine
- The spectrum of nuclear patterns with stained metaphase chromosome plate: morphology nuances, immunological associations, and clinical relevance
- Opinion Papers
- Comprehensive assessment of medical laboratory performance: a 4D model of quality, economics, velocity, and productivity indicators
- Detecting cardiac injury: the next generation of high-sensitivity cardiac troponins improving diagnostic outcomes
- Perspectives
- Can Theranos resurrect from its ashes?
- Guidelines and Recommendations
- Australasian guideline for the performance of sweat chloride testing 3rd edition: to support cystic fibrosis screening, diagnosis and monitoring
- General Clinical Chemistry and Laboratory Medicine
- Recommendations for the integration of standardized quality indicators for glucose point-of-care testing
- A cost-effective assessment for the combination of indirect immunofluorescence and solid-phase assay in ANA-screening
- Assessment of measurement uncertainty of immunoassays and LC-MS/MS methods for serum 25-hydroxyvitamin D
- A novel immunoprecipitation-based targeted liquid chromatography-tandem mass spectrometry analysis for accurate determination for copeptin in human serum
- Histamine metabolite to basal serum tryptase ratios in systemic mastocytosis and hereditary alpha tryptasemia using a validated LC-MS/MS approach
- Machine learning algorithms with body fluid parameters: an interpretable framework for malignant cell screening in cerebrospinal fluid
- Impact of analytical bias on machine learning models for sepsis prediction using laboratory data
- Immunochemical measurement of urinary free light chains and Bence Jones proteinuria
- Serum biomarkers as early indicators of outcomes in spontaneous subarachnoid hemorrhage
- High myoglobin plasma samples risk being reported as falsely low due to antigen excess – follow up after a 2-year period of using a mitigating procedure
- Candidate Reference Measurement Procedures and Materials
- Commutability evaluation of glycated albumin candidate EQA materials
- Reference Values and Biological Variations
- Health-related reference intervals for heavy metals in non-exposed young adults
- Hematology and Coagulation
- Practical handling of hemolytic, icteric and lipemic samples for coagulation testing in European laboratories. A collaborative survey from the European Organisation for External Quality Assurance Providers in Laboratory Medicine (EQALM)
- Cancer Diagnostics
- Assessment of atypical cells in detecting bladder cancer in female patients
- Cardiovascular Diseases
- False-positive cardiac troponin I values due to macrotroponin in healthy athletes after COVID-19
- Diabetes
- A comparison of current methods to measure antibodies in type 1 diabetes
- Letters to the Editor
- The neglected issue of pyridoxal- 5′ phosphate
- Error in prostate-specific antigen levels after prostate cancer treatment with radical prostatectomy
- Arivale is dead ‒ Hooke is alive
- A single dose of 20-mg of ostarine is detectable in hair
- Growing importance of vocabularies in medical laboratories
- Congress Abstracts
- 62nd National Congress of the Hungarian Society of Laboratory Medicine Szeged, Hungary, August 28–30, 2025