Histamine metabolite to basal serum tryptase ratios in systemic mastocytosis and hereditary alpha tryptasemia using a validated LC-MS/MS approach
-
Abdulrazzaq Alheraky
 ,
Claude P. Van Der Ley
,
Claude P. Van Der Ley

Abstract
Objectives
Histamine, mainly produced in mast cells (MC), plays a key role in allergy and inflammation. Measuring its urinary metabolites, N-methylhistamine (NMH) and 1-methyl-4-imidazoleacetic acid (MIMA), is essential in assessing histamine-related pathologies. Patients with concurrent systemic mastocytosis (SM) and hereditary alpha tryptasemia (HαT) may show increased MC mediator-related symptom severity. We developed and validated a liquid chromatography-tandem mass spectrometry (LC-MS/MS) assay to quantify histamine, NMH, and MIMA, and explored their correlation with basal serum tryptase (BST) levels.
Methods
Using an in-matrix double derivatization, enhancing extraction, we analyzed urinary histamine, NMH, and MIMA with an online solid-phase extraction LC-MS/MS system. Analytical method validation assessed recovery, imprecision, and detection limits. For clinical validation, correlation analysis between BST levels, NMH, and MIMA in SM and HαT patients was performed.
Results
The assay demonstrated recoveries>98 %, imprecision<3 %, and limits of quantification at 2.0 nmol/L for histamine, 0.53 nmol/L for NMH, and 0.011 μmol/L for MIMA. Patients with a combination of SM and HαT showed a 2.6–3.6 fold increase in BST compared to those with SM alone. A BST/NMH ratio>0.129 predicted HαT with 91.3 % sensitivity and 85.6 % specificity, and a BST/MIMA ratio>7.46 predicted HαT with 89.9 % sensitivity and 86.0 % specificity, independent of SM status.
Conclusions
Our LC-MS/MS method provides highly accurate and efficient quantification of histamine, NMH, and MIMA. Integrating BST/NMH and BST/MIMA ratios in diagnostic protocols enhances detection of HαT in MC-related disorders, supporting improved diagnostics and tailored patient management.
Introduction
Histamine is a biogenic amine primarily produced in mast cells (MCs) and basophils. It exerts its effect via H1 – 4 receptors [1], and is involved in several physiological processes, including allergic and inflammatory immune responses [2], 3], gastric acid secretion [4] and neuronal excitability [5]. Accurate detection of histamine and its primary metabolites is paramount for the assessment of histamine-related pathologies.
In clinical chemical practice, the histamine burden is assessed in blood or urine [6], 7], where urine is generally the preferred matrix due to the risk of falsely elevated histamine levels in blood [8]. Additionally, histamine metabolites are more reliable markers than histamine itself, especially in urine, as they are less prone to a false increase by urinary tract infections [9]. Histamine is metabolized through two enzymatic pathways, producing imidazoleacetic acid and N-methylhistamine (NMH), which is subsequently converted into 1-methyl-4-imidazoleacetic acid (MIMA).
Histamine, NMH and MIMA concentrations are usually separately measured with laborious gas chromatography–mass spectrometry (GC-MS) methods. For simultaneous quantification, only one liquid chromatography-tandem mass spectrometry (LC-MS/MS) method has been published [10]. The challenge in the combined analysis lies in distinguishing the small differences between their functional groups, which prevents a uniform method for extraction and chromatography.
Assessing histamine metabolites provides valuable insights into various conditions, including MC disorders like systemic mastocytosis (SM) [11]. SM causes clonal MC expansion and increased release of histamine, tryptase, and other MC mediators. This causes dermal, gastrointestinal, skeletal, and cognitive symptoms, anaphylaxis, and hematological disturbance [12]. Hereditary alpha tryptasemia (HαT), which occurs in 4–6% of the general population [13], is also associated with increased tryptase release from MCs and anaphylaxis [14], and interferes with SM diagnosis. However, while SM triggers a pathological release of a broad array of MC mediators, including tryptase and histamine [15], HαT primarily induces tryptase release from MCs without affecting histamine levels [16]. Accordingly, measuring urinary histamine metabolites alongside the routinely assessed serum tryptase in patients with MC mediator-related symptoms can help differentiate between HαT and SM [16]. This enhances routine clinical diagnostics, especially since molecular HαT assessment methods are not yet widely accessible [14], 17].
Even if SM diagnosis is established, HαT assessment is still relevant, as it occurs in 14–17 % of SM patients [18], 19], increases the severity of anaphylaxis [20], and may increase the SM symptom burden [19], 21]. While antihistamines are used to mitigate SM symptoms, their effectiveness for HαT is not validated [22], 23], possibly explaining the lack of effectiveness of antihistamines in some SM patients [24]. Thus, detecting HαT in SM patients is essential for effective patient management.
In this study, we developed a straightforward in-matrix double derivatization procedure. The double derivatization solves the issue of simultaneous extraction and chromatography of low molecular weight compounds with different chemical properties and improves the selectivity and sensitivity in the mass spectrometric detection as shown previously for the first derivatization step [25], [26], [27]. Additionally, we demonstrated the clinical utility of this new method by measuring urinary histamine metabolites to characterize SM, HαT and concurrent SM and HαT in individuals with MC mediator-related symptoms.
Materials and methods
Reagents
LC/MS-grade acetonitrile, isopropanol, methanol, formic acid, ammonium formate, and ammonium acetate were purchased from Biosolve (Valkenswaard, The Netherlands). Dipotassium hydrogen phosphate, acetic acid (99 %), and hydrochloric acid (32 %) were obtained from Merck Millipore (Amsterdam, The Netherlands). Ammonium hydroxide solution (28–30 %), trimethylacetic anhydride, dipotassium EDTA dihydrate, N-(3-Dimethylaminopropyl)-N′-ethylcarbodiimide hydrochloride, 2,2,2-Trifluoroethylamine hydrochloride, histamine dihydrochloride (purity≥99.0 %, assay titration), 1-methylhistamine dihydrochloride (purity≥98 %, TLC) were purchased from Sigma Aldrich (Zwijndrecht, The Netherlands). 1-methylimidazole-4-acetic acid hydrochloride (purity≥95 %, HPLC) was purchased from Toronto Research Chemicals (Toronto, Canada). Ultrapure water was produced using an in-house purification system from Merck Millipore (Amsterdam, The Netherlands). Chlorhexidine digluconate 19–21 % m/V was purchased from Fagron (Hoogeveen, The Netherlands). Stable deuterated isotopes for histamine-α,α,β,β-d4 dihydrochloride and 1-methylhistamine-d3 dihydrochloride (1-methyl-d3) were purchased from CDN Isotopes (Montreal, Canada). 1-methylimidazole-4-acetic acid-d3 (1-methyl-d3) was synthesized as previously described [28]. Methylation was performed with dimethyl-d6-sulfate from Merck Millipore (Amsterdam, The Netherlands). Mass spectrometric analysis of the internal standards confirmed the absence of detectable unlabeled analytes.
Preparation of standards and quality control samples
Internal standard stock solutions were prepared in 0.1 mol/L hydrochloric acid. Stock solutions were serially diluted in water. The internal standard working solution was freshly prepared on the day of the analysis in 0.5 mol/L dipotassium phosphate, and 4 mmol/L K2EDTA, pH 8.5.
Nine calibrators were prepared by spiking different volumes of working solution into a 96-well plate. Calibrator curves ranged from 60 to 5,500 nmol/L for histamine, 120–10,370 nmol/L for NMH, and 1.4–132 μmol/L for MIMA.
Concentrations for histamine-d4, NMH-d3, and MIMA-d3 were 400 nmol/L, 500 nmol/L, and 24 μmol/L, respectively. Quality control (QC) samples were prepared containing low, medium and high concentrations of histamine (60, 989 and 3,879 nM), NMH (214, 998, and 8,940 nM) and MIMA (3.99, 9.94, and 125 µM) using anonymized pooled urine samples, which remained in our laboratory after routine NMH and MIMA analysis. Only samples from patients who consented to the use of leftover materials for research were used. After mixing, the QC samples were aliquoted and stored at −80 °C until analysis. Concentrations of the QC samples are shown in Table 1.
Intra-assay, inter-assay imprecision and measurement uncertainty.
| Intra-assay imprecision (n=20) | Inter-assay imprecision (n=20) | Measurement uncertainty (n=52, ∼8 months) | ||||
|---|---|---|---|---|---|---|
| Mean QC concentrationa | CV, % | Mean QC concentrationa | CV, % | Mean QC concentrationa | CV, % | |
| Histamine | 60.1 | 2.3 | 60.1 | 2.9 | – | – |
| 989 | 1.8 | 986 | 2.4 | – | – | |
| 3,879 | 2.4 | 3,898 | 2.4 | – | – | |
| NMH | 214 | 1.2 | 217 | 1.7 | 150 | 4.3 |
| 998 | 1.3 | 1,023 | 2.2 | 812 | 3.1 | |
| 8,940 | 1.5 | 8,954 | 2.1 | 7,753 | 3.8 | |
| MIMA | 3.99 | 2.2 | 3.91 | 2.2 | 2.28 | 6.5 |
| 9.94 | 1.9 | 10.05 | 2.4 | 4.73 | 4.0 | |
| 124.7 | 1.9 | 124.7 | 2.2 | 103 | 3.2 | |
-
aHistamine and NMH, concentrations are given in nmol/L and MIMA, concentrations in µmol/L. QC, quality control; NMH, N-methylhistamine; MIMA, 1-methyl-4-imidazoleacetic acid.
Sample preparation and analysis
Before samples were analyzed, aliquots of thawed urine samples (50 μL) and calibrators were mixed with 50 μL of internal standard working solution, 200 µL of 0.5 mol/L dipotassium phosphate, and 4 mmol/L K2EDTA, pH 8.5 in a 2.0 mL 96-deepwell plate from Greiner Bio-One (Alphen a/d Rijn, The Netherlands). Subsequently, 50 µL of 25 % (v/v) trimethylacetic anhydride in acetonitrile was added and the plate was vortexed for 30 min. Subsequently, 100 µL of 0.4 M trifluoroethylamine was added and the plate was briefly vortexed, followed by the addition of 100 µL 0.4 M 1-Ethyl-3-(3-dimethylaminopropyl)carbodiimide (EDC) and 500 µL water. The first step derivatizes any amino and hydroxyl group using trimethylacetic anhydride. The second step derivatizes any carboxylic acid group using EDC in combination with 2,2,2-trifluoroethylamine (TFEA), resulting in a trimethylacetyl and/or 2,2,2-trifluoroethylamide derivative (Figure 1) [29], 30]. The plate was mixed for 30 min. All the previous pipetting steps were performed with a TECAN Freedom Evo pipetting robot (Freiburg, Germany).
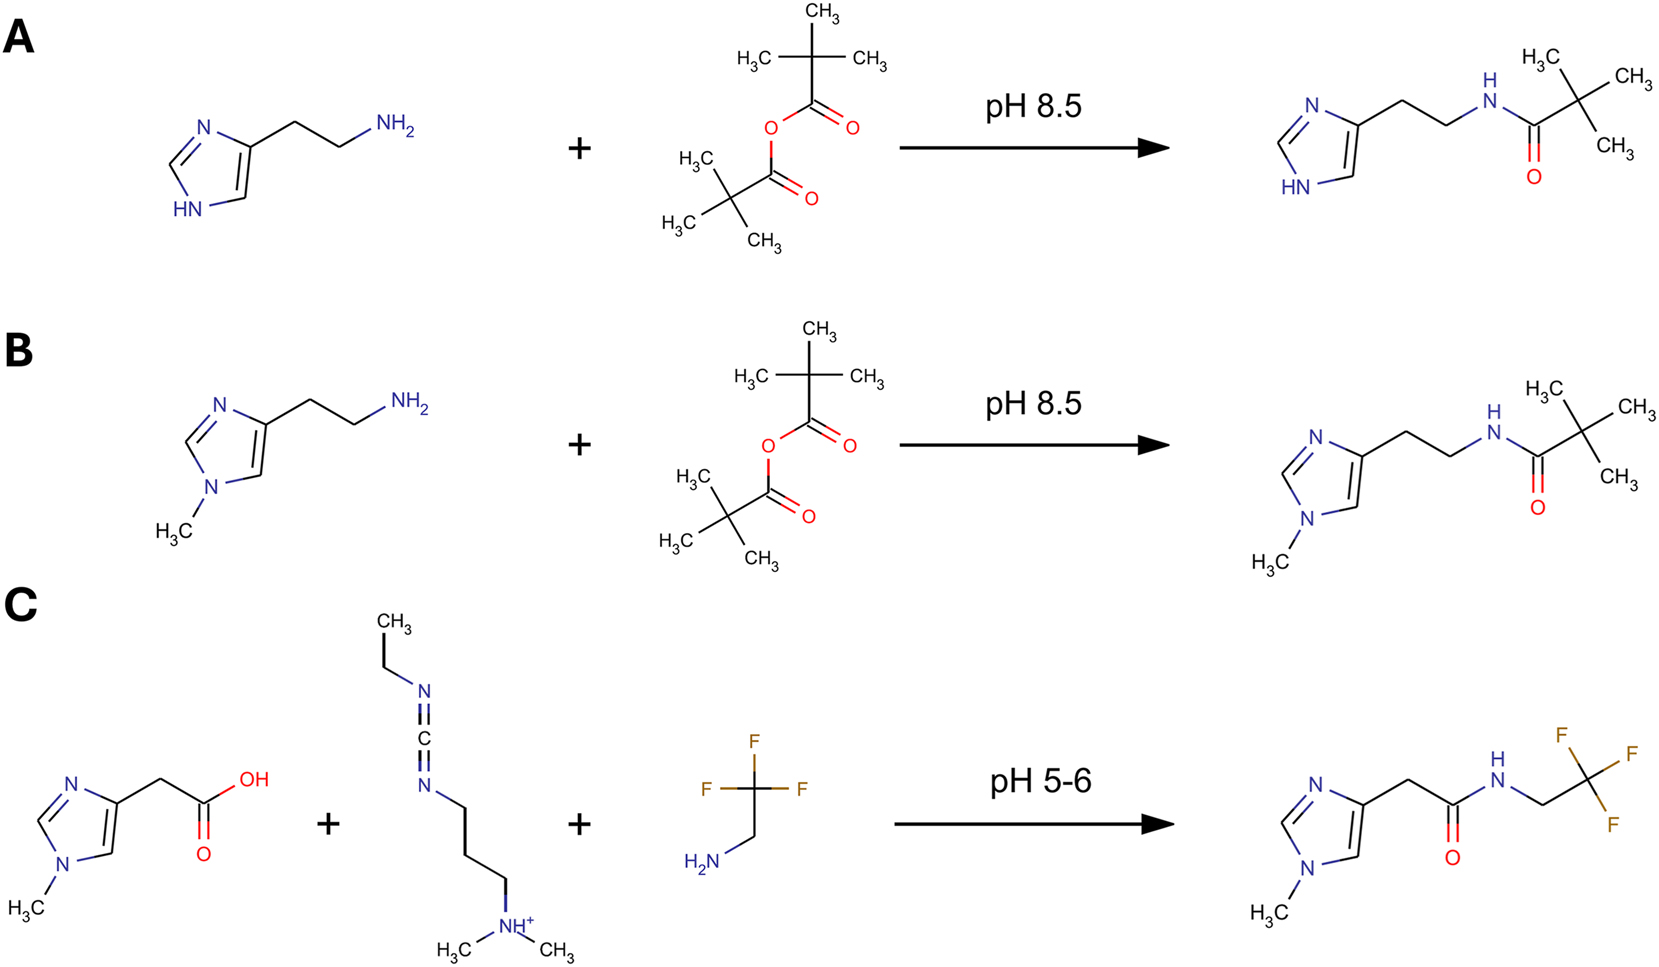
Schematic double derivatization procedure. First, histamine (A) and NMH (B) are derivatized with TMAA at pH 8.5. During the reaction with TMAA, the pH drops to 5–6 (formation of trimethyl acetic acid). MIMA (C) is then derivatized by the addition of TFEA and EDC. NMH, N-methylhistamine; TMAA, trimethylacetic anhydride; MIMA, 1-methyl-4-imidazoleacetic acid; EDC, 1-ethyl-3-(3-dimethylaminopropyl)carbodiimide; TFEA, 2,2,2-trifluoroethylamine.
The LC-MS/MS analysis was performed by injecting 5 µL of each calibrator and sample onto the online solid phase extraction (SPE) LC-MS/MS system. Online SPE was performed using the fully automated Spark Holland Symbiosis™ system in eXtraction Liquid Chromatography mode as previously described [31]. For a detailed description of the online SPE method see the online Supplement, Online Solid Phase Extraction (SPE) and LC-MS/MS.
Liquid chromatography was performed on a Phenomenex® Gemini-NX C18 2.0×150 mm 3 µm column with a binary gradient system that consisted of 20 mmol/L ammonium bicarbonate with 1 % ammonia in 10 % ACN in water (eluent A) and acetonitrile (eluent B). Initial conditions were 100:0 (v/v) at a flow rate of 0.3 mL/min, followed by a linear increase of eluent B to 50 % over 4 min, followed by a linear increase to 90 % B in 0.5 min, and this was kept constant for 1 min at 90 % B. Thereafter, flow rate and proportion of the pumps were returned to the starting conditions and kept constant for a further 1.5 min. The total run time was 7.5 min. Histamine, NMH and MIMA were all analyzed in positive ionization mode on a Waters® Xevo™ TQ-s micro. Mass spectrometer settings were optimized by tuning in the selective reaction monitoring mode. The following settings were applied: capillary voltage 1.0 kV, desolvation temperature 600 °C, desolvation gas flow 1000 L/h, cone gas flow 75 L/h, and collision gas flow 0.20 mL/min. Cone voltage and collision energies were optimized for all analytes and respective transitions. The transitions were analyzed by scheduled selective reaction monitoring (Supplemental Table 1). Quantification was performed using the peak-area response ratios of the quantifier transitions for the analyte and the corresponding internal standard. Calculations were performed with the TargetLynx™ software (Waters).
Acceptance criteria for measurement series
Three different system suitability test (SST) samples were analyzed before starting each analysis. The SST samples consist of the internal standard mix solution, the highest standard of the calibration curve without internal standard, and of the low quality control sample, all prepared as described in the “Methods, Preparation of standards and quality control samples” and “Methods, Sample preparation and analysis” sections. Acceptance criteria were established according to Clinical and Laboratory Standards Institute (CLSI) C64A guidelines and included a minimum internal standard peak area of 5,000, 25,000, and 10,000 for histamine-d4, NMH-d3, and MIMA-d3, respectively in the low quality control sample, a maximum ion ratio variation of 10 %, maximum carryover of 0.1 %, and the absence of unlabeled analyte in the internal standard mix solution.
Analytical method validation
The method was validated according to the guidelines from the Dutch Society of Clinical Chemistry (NVKC) for the validation and verification of examination procedures in medical laboratories by evaluating imprecision, limit of quantification, linearity, carryover, recovery, ionization suppression, interferences, and stability [32]. Detailed information on the procedures for method validation is provided in the online Supplement, Analytical method validation.
Patient sample collection
Blood, bone marrow (BM), and urine samples were collected from a cohort of 261 patients admitted to the University Medical Center of Groningen (UMCG) for MC mediator-related symptoms between 2014 and 2024. The cohort included 78 non-SM/non-HαT, 47 non-SM/HαT, 114 SM/non-HαT, and 22 SM/HαT patients. Procedures are described in the online Supplement, Patient sample collection.
Additionally, the NMH and MIMA from anonymized patient-paired and time-paired measurements (n=2,876) were extracted from the laboratory information system and used for correlation in a separate dataset.
Ethical compliance and patient consent
Patient inclusion and informed consent were conducted according to Dutch legislation, and all procedures followed ethical guidelines approved by the Medical Ethics Committee of the UMCG, including confidentiality protocols and data protection, in accordance with the principles of the Declaration of Helsinki.
Diagnosis of SM and HαT
SM diagnosis was performed as previously described [15], and established according to the criteria of the World Health Organization (WHO) Classification of Tumours of Haematopoietic and Lymphoid Tissues [33], 34]. The presence of HαT was established by determining the number of α-tryptase and β-tryptase sequences in the TPSB2 and TPSAB1 genes using an in-house assay [17]. Patients were excluded in the presence of other known conditions associated with high BST concentrations such as myeloid neoplasms and end-stage renal failure [35], 36]. End-stage renal failure was classified following the Kidney Disease Outcomes Quality Initiative (KDOQI) and Kidney Disease Improving Global Outcome Organization (KDIGO), defined as a glomerular filtration rate (GFR) lower than 15 mL/min/1.73 m2 [37].
Tryptase measurement
Total serum tryptase levels, which included the total α- and β-protryptases and mature tryptase, were measured using the Phadia 250 platform (ImmunoCAP Tryptase, Thermo Fisher Scientific, Phadia, Uppsala, Sweden). The assay’s analytical coefficient of variation (CV) was 5.8 %. Blood and urine samples for measuring BST and histamine metabolites were collected at the same time, and the lowest measured BST concentration at least 48 h after any episode of anaphylactic shock or other acute tryptase-related health changes were used.
Statistics
Method comparison results were calculated by Passing-Bablok regression using AnalyseIT for Excel. The distribution of all continuous variables was assessed for normality. The correlations of the BST, NMH, and MIMA with age for all patients of the cohort were examined using the Spearman rank correlation coefficient, and the association of the BST, NMH, and MIMA with sex was determined by the Mann–Whitney U test.
Correlations of NMH with MIMA and BST with NMH and MIMA were determined using the Pearson correlation coefficient. Fisher’s Z-test examined differences in BST correlations with NMH and MIMA between SM/non-HαT and SM/HαT groups. BST/NMH and BST/MIMA ratios with 95 % confidence intervals were calculated for all four subgroups (non-SM/non-HαT, non-SM/HαT, SM/non-HαT, SM/HαT). Significance of ratio differences between HαT/non-HαT and SM/non-SM was assessed using the Mann-Whitney U test. A p<0.05 was considered significant. Receiver operating characteristic (ROC) analysis identified optimal BST/NMH and BST/MIMA ratio cut-off values to predict HαT. Box plots and line diagrams were created with R version 4.3.1 in RStudio version 1.4.1106 (PBC).
Results
Analytical method validation
Histamine and its main metabolites NMH and MIMA were baseline separated (Figure 2). The total analysis time was 7.5 min, including automated sample extraction using the online SPE step. Intra-assay and inter-assay imprecision were<3 %, and measurement uncertainty was≤6.5 %, evaluated at three different concentrations (Table 1).

Representative chromatogram of a quality control sample for histamine (top), MIMA (middle) and NMH (bottom). The sample had the following concentrations: histamine, 62.7 nmol/L; MIMA, 2.39 μmol/L; and NMH, 142 nmol/L. Relative intensity is plotted on the y-axis and retention time (in minutes) on the x-axis. MIMA, 1-methyl-4-imidazoleacetic acid; NMH, N-methylhistamine.
Mean recovery of the added analytes was 99 % for histamine, 98–99 % for NMH, and 98 % for MIMA (see online Supplemental Table 2). NMH and MIMA were stable up to three months, at both 6 °C and −20 °C. Histamine remained stable for three months at −20 °C, but not at 6 °C (online Supplemental Tables 3-8). All stability tests showed that NMH and MIMA remained stable through five freeze-thaw cycles, whereas histamine showed an increase in two samples after one freeze-thaw cycle (online Supplemental Tables 9-11). Histamine, NMH, and MIMA derivatives remained stable in processed samples for at least two weeks at 10 °C (see online Supplemental Figure 1). Limits of quantification were 2.0 nmol/L for histamine, 0.53 nmol/L for NMH, and 0.011 μmol/L for MIMA. Carryover was below 0.1 % for each analyte. No significant ionization suppression for any of the three analytes was observed.
Method comparison
Passing-Bablok regression analysis revealed no proportional differences between the GC-MS method and LC-MS/MS method for NMH and MIMA (online Supplemental Figure 2). No constant bias was observed for NMH, but a minor constant bias (0.66 µM) was noted for MIMA, attributed to samples with concentrations exceeding 30 µM.
Age and sex controls for BST, NMH, and MIMA
Baseline characteristics of the SM and HαT subgroups were uniformly distributed (Table 2). No correlation was found between BST and age (Spearman ρ: −0.02; p>0.05), between NMH and age (Spearman ρ: −0.07; p>0.05), or between MIMA and age (Spearman ρ: 0.2; p>0.05). Also, no association was found between the BST and sex (t-test: p>0.05), between NMH and sex (t-test: p>0.05), but a borderline significant association was found between MIMA and sex (p<0.05). This potential association was not further investigated.
BST and urinary NMH and MIMA concentrations and BST/NMH and BST/MIMA ratios.
| Non-SM/Non-HαT (n=78) | HαT (n=47) | SM (n=114) | HαT & SM (n=22) | |
|---|---|---|---|---|
| Age, years, median (range; 95 % CI) |
58 (16–78; 54–59) |
54 (21–76; 51–58) |
52 (14–77; 48–53) |
55 (9–81; 37–63) |
| Sex, % female | 50 | 64 | 50 | 41 |
| BST, ng/mL, median (range; 95 % CI) |
4.9 (1.0–13.9; 4.7–5.7) |
16.6 (8.9–30.0; 15.5 18.4) |
13.5 (1.3;465.0; 17.1–36.6) |
42.9 (10.8–216.0; 39.8–87.6) |
| NMH, μmol/mol creatinine, median (range; 95 % CI) |
89.6 (39.9–808.0; 86.7–130.4) |
78.4 (28.2–225.9; 72.5–97.2) |
154.0 (35.3–4,744.4; 207.2–417.4) |
164.4 (51.0–641.0; 145.1–296.0) |
| MIMA, mmol/mol creatinine, median (range; 95 % CI) |
1.6 (0.8–16.7; 1.7–2.6) |
1.4 (1.0–4.7; 1.5–1.9) |
2.5 (0.9–70.1; 3.2–6.2) |
2.4 (0.9–15.2; 2.1–5.0) |
| BST/NMH median (range; 95 % CI) |
0.05 (0.01–0.30; 0.05–0.07) |
0.21 (0.05–0.70; 0.20–0.28) |
0.09 (0.004–0.40; 0.08–0.10) |
0.276 (0.16–0.44; 0.24–0.32) |
| BST/MIMA median (range; 95 % CI) |
2.7 (0.4–8.7; 2.7–3.5) |
9.9 (2.5–21.7; 9.5–11.9) |
5.0 (0.3–23.5; 5.2–6.5) |
17.6 (10.3–31.4; 15.6–21.2) |
-
SM, systemic mastocytosis; HαT, hereditary alpha tryptasemia; BST, basal serum tryptase; NMH, N-methylhistamine; MIMA, 1-methyl-4-imidazoleacetic acid; CI, confidence intervals.
Evaluating BST, NMH, and MIMA in SM and HαT
NMH and MIMA were moderately correlated in the anonymized cohort (n=2,876) with an R2 of 0.52 (Figure 3A). The correlation was partly affected by a number of individuals that highly deviated from the correlation in both directions.

Basal serum tryptase level (BST), N-methylhistamine (NMH), and 1-methyl-4-imidazoleacetic acid (MIMA) correlations. (A) NMH and MIMA from anonymized patient-paired and time-paired measurements were correlated. The correlation of MIMA with NMH shows significant deviations in both directions. (B) NMH is correlated with BST in SM patients without HαT (SM/non-HαT, white) and in SM patients with HαT (SM/HαT, black), showing that the correlation in SM patients with HαT significantly differs from that in SM patients without HαT (Fisher’s Z-test: p<0.05). (C) MIMA is correlated with BST in SM patients without HαT (SM/non-HαT, white) and in SM patients with HαT (SM/HαT, black), and the correlation in SM patients with HαT is significantly different from that in SM patients without HαT (Fischer’s Z-test: p<0.05). (D) The BST/NMH ratios are significantly higher in HαT patients vs. non-HαT patients (***: p<0.01), with a nonsignificant trend towards increased ratios in SM patients (red) vs. non-SM patients (white) (p>0.05). (E) The BST/MIMA ratios are significantly higher in HαT patients vs. non-HαT patients (***: p<0.01), with a nonsignificant trend towards increased ratios in SM patients (red) vs. non-SM patients (white) (p>0.05).
The correlation of the urinary NMH concentration with the BST concentration in SM patients was stratified by the presence of HαT (Figure 3B). In this, both subgroups SM/HαT and SM/non-HαT showed a strong correlation with an R2 of 0.90 and 0.80, respectively. Furthermore, the correlation in the SM/HαT subgroup had a 3.6-fold higher slope compared to the SM/non-HαT subgroup (Fisher’s z-test: p<0.05). The correlation of urinary MIMA concentration with the plasma total BST concentration showed a similar association between both subgroups (Figure 3C), in which the R2 of the SM/HαT and SM/non-HαT were 0.88 and 0.83, respectively, and the SM/HαT subgroup had a 2.6-fold higher slope compared to the SM/non-HαT subgroup (Fisher’s z-test: p<0.05).
Evaluation of the BST/NMH ratio (Figure 3D) and BST/MIMA ratio (Figure 3E) showed a significant increase in both ratios for patients with HαT compared to patients with no HαT (p<0.01). A small increase of BST/NMH and BST/MIMA ratios was also observed in association with the presence of SM, even though this increase was not statistically significant.
Predicting HαT
When not taking the presence of SM into account, a BST/NMH ratio≥0.129 predicted HαT with the highest accuracy with a sensitivity of 91.3 % and specificity of 85.6 %, while a BST/MIMA ratio≥7.46 achieved a sensitivity of 89.9 % and specificity of 86.0 % (Table 3). In patients without SM, a BST/MIMA ratio≥6.65 had the highest accuracy with 91.5 % sensitivity and 93.7 % specificity, while a BST/NMH ratio≥0.113 predicted HαT with 91.5 % sensitivity and 90.1 % specificity. In patients with a confirmed SM, a BST/NMH ratio≥0.157 showed the highest accuracy with 100 % sensitivity and 92.1 % specificity for predicting HαT, and a BST/MIMA ratio≥9.94 gave 100 % sensitivity and 91.2 % specificity. Furthermore, combining the BST/NMH and BST/MIMA ratios increased the sensitivity in predicting HαT only in the subgroup of patients without SM with a 93.6 % sensitivity and 88.6 % specificity.
Predicting HαT using BST/NMH and BST/MIMA ratios.
| BST/NMH (sens, spec) | BST/MIMA (sens, spec) | BST/NMH or BST/MIMA(sens, spec) | |
|---|---|---|---|
| Total cohort | 0.129 (91.3 %; 85.6 %) | 7.46 (89.9 %; 86.0 %) | 0.129 or 7.46 (79.8 %; 94.2 %) |
| Non-SM | 0.113 (91.5 %; 90.1 %) | 6.65 (91.5 %; 93.7 %) | 0.113 or 6.65 (93.6 %; 88.6 %) |
| SM | 0.157 (100 %; 92.1 %) | 9.94 (100 %; 91.2 %) | 0.157 or 9.94 (100 %; 84.2 %) |
-
SM, systemic mastocytosis; HαT, hereditary alpha tryptasemia; BST, basal serum tryptase; NMH, N-methylhistamine; MIMA, 1-methyl-4-imidazoleacetic acid; sens, sensitivity; spec, specificity.
Discussion
In this study, we present a simple in-matrix derivatization procedure that allows a reproducible and straightforward LC-MS/MS quantification of histamine and its main metabolites NMH and MIMA. Furthermore, we demonstrate the clinical relevance of this assay in the evaluation of patients with MC mediator-related symptoms.
The results from the analytical method validation demonstrate that the developed LC-MS/MS method is reproducible and exhibits strong concordance with the more laborious GC-MS method for NMH and MIMA. The inclusion of stable isotope-labeled standards for each analyte is crucial for achieving this level of precision. In contrast, a previously published method, which did not use stable isotope-labeled standards for each analyte, showed greater imprecision for NMH compared to our method and had to utilize a standard addition method for quantification [10]. The limits of quantification for histamine, NMH, and MIMA were more than adequate for quantification in urine samples. Additionally, the collision energy for MIMA was deoptimized to prevent saturation of the MS detector. The SPE cartridge materials used are widely accessible, making the development of an offline SPE method also feasible. NMH and MIMA are stable in preserved urine, but histamine requires freezing at −20 °C and the use of an antibacterial agent to prevent microbial degradation [38].
Quantifying multiple metabolites generally provides a more reliable approach to assess mediator release, as it accounts for metabolic variability. This is particularly relevant for histamine release, given the moderate correlation between NMH and MIMA observed in our study. These variations may be due to common and functionally significant polymorphisms in genes coding for the enzymes histidine decarboxylase (HDC), diamine oxidase (ABP1) and histamine N-methyltransferase (HNMT), affecting the histamine metabolism [39].
We demonstrate that HαT accelerates BST increase in SM patients by a factor of 2.6–3.6 compared to SM patients without HαT. The importance of this BST increase is highlighted in the most recent WHO classification of SM, which introduces a correction factor for HαT when determining BST levels [40]. This correction factor is essential to prevent misclassification of elevated BST levels as a diagnostic criterion for SM, or progression of indolent SM to smoldering SM [40].
As previously observed [16], we also found that SM increases BST and histamine metabolite levels, while HαT only increases BST levels. As a result, we found that increased BST/NMH and BST/MIMA ratios could accurately predict HαT with 79.8 % sensitivity and 94.2 % specificity, regardless of the presence of SM. The BST/NMH and BST/MIMA cut-off values in our study were determined in patients with MC mediator-related symptoms, stratified by SM confirmed, SM ruled out, and SM uncertain, because SM tends to increase BST levels more than histamine metabolites. We recommend using these ratios in the diagnostic algorithms for patients with MC mediator-related symptoms, particularly in health centers where genetic HαT assessment methods are not readily available.
In conclusion, we successfully developed and validated an accurate and straightforward LC-MS/MS method for the quantification of histamine and its main metabolites NMH and MIMA in urine. We demonstrated its clinical relevance in patients with MC mediator-related symptoms, providing valuable insights into HαT-corrected BST levels in SM patients, and a robust approach to distinguish HαT from SM. Therefore, we suggest incorporating the BST/NMH and the BST/MIMA ratios in the routine clinical diagnostics of patients with MC mediator-related symptoms.
-
Research ethics: The local Institutional Review Board deemed the study exempt from review.
-
Informed consent: Not applicable.
-
Author contributions: All authors have accepted responsibility for the entire content of this manuscript and approved its submission.
-
Use of Large Language Models, AI and Machine Learning Tools: None declared.
-
Conflict of interest: H.N.G. Oude Elberink is a member of the Advisory Board Blue Print and Cogent. provides expert testimony for Blueprint, and has received consulting fees from Novartis, Stallergenes. All other authors state no conflicts of interest.
-
Research funding: None declared.
-
Data availability: The data that support the findings of this study are available on request from the corresponding author, A. Alheraky. The data are not publicly available due to privacy restrictions.
References
1. Thangam, EB, Jemima, EA, Singh, H, Baig, MS, Khan, M, Mathias, CB, et al.. The role of histamine and histamine receptors in mast cell-mediated allergy and inflammation: the hunt for new therapeutic targets. Front Immunol 2018;9. https://doi.org/10.3389/fimmu.2018.01873.Search in Google Scholar PubMed PubMed Central
2. Akdis, CA, Blaser, K. Histamine in the immune regulation of allergic inflammation. J Allergy Clin Immunol 2003;112:15–22. https://doi.org/10.1067/mai.2003.1585.Search in Google Scholar PubMed
3. Bischoff, SC. Role of mast cells in allergic and non-allergic immune responses: comparison of human and murine data. Nat Rev Immunol 2007;7:93–104. https://doi.org/10.1038/nri2018.Search in Google Scholar PubMed
4. Barocelli, E. Histamine in the control of gastric acid secretion: a topic review. Pharmacol Res 2003;47:299–304. https://doi.org/10.1016/s1043-6618(03)00009-4.Search in Google Scholar PubMed
5. Tuomisto, L. Modifying effects of histamine on circadian rhythms and neuronal excitability. Behav Brain Res 2001;124:129–35. https://doi.org/10.1016/s0166-4328(01)00222-4.Search in Google Scholar PubMed
6. Comas-Basté, O, Latorre-Moratalla, ML, Bernacchia, R, Veciana-Nogués, MT, Vidal-Carou, MC. New approach for the diagnosis of histamine intolerance based on the determination of histamine and methylhistamine in urine. J Pharm Biomed Anal 2017;145:379–85. https://doi.org/10.1016/j.jpba.2017.06.029.Search in Google Scholar PubMed
7. Pittertschatscher, K, Hochreiter, R, Thalhamer, J, Hammerl, P. Quantification of histamine in blood plasma and cell culture supernatants: a validated one-step gas chromatography–mass spectrometry method. Anal Biochem 2002;308:300–6. https://doi.org/10.1016/s0003-2697(02)00260-9.Search in Google Scholar PubMed
8. Costing, E, Neugebauer, E, Keyzer, JJ, Lorenz, W. Determination of histamine in human plasma: the European external quality control study 1988. Clin Exp Allergy 1990;20:349–57. https://doi.org/10.1111/j.1365-2222.1990.tb02793.x.Search in Google Scholar PubMed
9. Keyzer, JJ, de Monchy, JGR, van Doormaal, JJ, van Voorst Vader, PC. Improved diagnosis of mastocytosis by measurement of urinary histamine metabolites. N Engl J Med 1983;309:1603–5. https://doi.org/10.1056/nejm198312293092603.Search in Google Scholar
10. Nelis, M, Decraecker, L, Boeckxstaens, G, Augustijns, P, Cabooter, D. Development of a HILIC-MS/MS method for the quantification of histamine and its main metabolites in human urine samples. Talanta 2020;220:121328. https://doi.org/10.1016/j.talanta.2020.121328.Search in Google Scholar PubMed
11. Butterfield, J, Weiler, CR. The utility of measuring urinary metabolites of mast cell mediators in systemic mastocytosis and mast cell activation syndrome. J Allergy Clin Immunol Pract 2020;8:2533–41. https://doi.org/10.1016/j.jaip.2020.02.021.Search in Google Scholar PubMed
12. Butterfield, JH. Systemic mastocytosis: clinical manifestations and differential diagnosis. Immunol Allergy Clin North Am 2006;26:487–513. https://doi.org/10.1016/j.iac.2006.05.006.Search in Google Scholar PubMed
13. Robey, RC, Wilcock, A, Bonin, H, Beaman, G, Myers, B, Grattan, C, et al.. Hereditary alpha-tryptasemia: UK prevalence and variability in Disease expression. J Allergy Clin Immunol Pract 2020;8:3549–56. https://doi.org/10.1016/j.jaip.2020.05.057.Search in Google Scholar PubMed
14. Lyons, JJ, Yu, X, Hughes, JD, Le, QT, Jamil, A, Bai, Y, et al.. Elevated basal serum tryptase identifies a multisystem disorder associated with increased TPSAB1 copy number. Nat Genet 2016;48:1564–9. https://doi.org/10.1038/ng.3696.Search in Google Scholar PubMed PubMed Central
15. van Doormaal, JJ, van der Veer, E, van Voorst Vader, PC, Kluin, PM, Mulder, AB, van der Heide, S, et al.. Tryptase and histamine metabolites as diagnostic indicators of indolent systemic mastocytosis without skin lesions. Allergy 2012;67:683–90. https://doi.org/10.1111/j.1398-9995.2012.02809.x.Search in Google Scholar PubMed
16. Giannetti, MP, Godwin, G, Weller, E, Butterfield, JH, Castells, M. Differential mast cell mediators in systemic mastocytosis and hereditary α-tryptasemia. J Allergy Clin Immunol 2022;150:1225–7. https://doi.org/10.1016/j.jaci.2022.04.025.Search in Google Scholar PubMed
17. Alheraky, A, Wierenga, ATJ, Simpelaar, A, Hesp, LB, Minovic, I, Bagheri, N, et al.. Hereditary alpha tryptasemia: validation of a single-well multiplex digital droplet PCR assay in a cohort of symptomatic patients. Clin Chem 2024;70:425–33. https://doi.org/10.1093/clinchem/hvad206.Search in Google Scholar PubMed
18. Polivka, L, Madrange, M, Bulai-Livideanu, C, Barete, S, Ballul, T, Neuraz, A, et al.. Pathophysiologic implications of elevated prevalence of hereditary alpha-tryptasemia in all mastocytosis subtypes. J Allergy Clin Immunol 2024;153:349–53.e4. https://doi.org/10.1016/j.jaci.2023.08.015.Search in Google Scholar PubMed
19. Greiner, G, Sprinzl, B, Górska, A, Ratzinger, F, Gurbisz, M, Witzeneder, N, et al.. Hereditary α tryptasemia is a valid genetic biomarker for severe mediator-related symptoms in mastocytosis. Blood 2021;137:238–47. https://doi.org/10.1182/blood.2020006157.Search in Google Scholar PubMed PubMed Central
20. Korošec, P, Sturm, GJ, Lyons, JJ, Marolt, TP, Svetina, M, Košnik, M, et al.. High burden of clonal mast cell disorders and hereditary α-tryptasemia in patients who need Hymenoptera venom immunotherapy. Allergy 2024;79:2458–69. https://doi.org/10.1111/all.16084.Search in Google Scholar PubMed PubMed Central
21. Sordi, B, Vanderwert, F, Crupi, F, Gesullo, F, Zanotti, R, Bonadonna, P, et al.. Disease correlates and clinical relevance of hereditary α-tryptasemia in patients with systemic mastocytosis. J Allergy Clin Immunol 2023;151:485–93.e11. https://doi.org/10.1016/j.jaci.2022.09.038.Search in Google Scholar PubMed
22. Glover, SC, Carter, MC, Korošec, P, Bonadonna, P, Schwartz, LB, Milner, JD, et al.. Clinical relevance of inherited genetic differences in human tryptases. Ann Allergy Asthma Immunol 2021;127:638–47. https://doi.org/10.1016/j.anai.2021.08.009.Search in Google Scholar PubMed PubMed Central
23. Giannetti, MP, Weller, E, Bormans, C, Novak, P, Hamilton, MJ, Castells, M. Hereditary alpha-tryptasemia in 101 patients with mast cell activation–related symptomatology including anaphylaxis. Ann Allergy Asthma Immunol 2021;126:655–60. https://doi.org/10.1016/j.anai.2021.01.016.Search in Google Scholar PubMed
24. Nurmatov, UB, Rhatigan, E, Simons, FER, Sheikh, A. H1-antihistamines for primary mast cell activation syndromes: a systematic review. Allergy 2015;70:1052–61. https://doi.org/10.1111/all.12672.Search in Google Scholar PubMed
25. van Faassen, M, Bouma, G, de Hosson, LD, Peters, MAM, Kats-Ugurlu, G, de Vries, EGE, et al.. Quantitative profiling of platelet-rich plasma indole markers by direct-matrix derivatization combined with LC-MS/MS in patients with neuroendocrine tumors. Clin Chem 2019;65:1388–96. https://doi.org/10.1373/clinchem.2019.305359.Search in Google Scholar PubMed
26. van Faassen, M, Bischoff, R, Eijkelenkamp, K, de Jong, WHA, van der Ley, CP, Kema, IP. In matrix derivatization combined with LC-MS/MS results in ultrasensitive quantification of plasma free metanephrines and catecholamines. Anal Chem 2020;92:9072–8. https://doi.org/10.1021/acs.analchem.0c01263.Search in Google Scholar PubMed PubMed Central
27. de Bruyn, K, Diekman, EF, van der Ley, CP, van Faassen, M, Kema, IP. Simultaneous mass spectrometric quantification of trace amines, their precursors and metabolites. J Chromatogr B 2024;1238:124098. https://doi.org/10.1016/j.jchromb.2024.124098.Search in Google Scholar PubMed
28. Keyzer, JJ, Wolthers, BG, Muskiet, FAJ, Kauffman, HF, Groen, A. Determination of N τ-methylhistamine in plasma and urine by isotope dilution mass fragmentography. Clin Chim Acta 1981;113:165–73. https://doi.org/10.1016/0009-8981(81)90150-9.Search in Google Scholar PubMed
29. Ford, QL, Burns, JM, Ferry, JL. Aqueous in situ derivatization of carboxylic acids by an ionic carbodiimide and 2,2,2-trifluoroethylamine for electron-capture detection. J Chromatogr A 2007;1145:241–5. https://doi.org/10.1016/j.chroma.2007.01.096.Search in Google Scholar PubMed
30. Keyzer, JJ, Breukelman, H, Wolthers, BG, Richardson, FJ, Monchy, JGR. Measurement of N τ-methylhistamine concentrations in plasma and urine as a parameter for histamine release during anaphylactoid reactions. Agents Actions 1985;16:76–9. https://doi.org/10.1007/bf01983105.Search in Google Scholar
31. de Jong, WH, Graham, KS, van der Molen, JC, Links, TP, Morris, MR, Ross, HA, et al.. Plasma free metanephrine measurement using automated online solid-phase extraction HPLC–tandem mass spectrometry. Clin Chem 2007;53:1684–93. https://doi.org/10.1373/clinchem.2007.087114.Search in Google Scholar PubMed
32. Roelofsen-de Beer, R, Wielders, J, Boursier, G, Vodnik, T, Vanstapel, F, Huisman, W, et al.. Validation and verification of examination procedures in medical laboratories: opinion of the EFLM Working Group Accreditation and ISO/CEN standards (WG-A/ISO) on dealing with ISO 15189:2012 demands for method verification and validation. Clin Chem Lab Med 2020;58:361–7. https://doi.org/10.1515/cclm-2019-1053.Search in Google Scholar PubMed
33. Swerdlow, S, Campo, E, Harris, N, Jaffe, E, Pileri, S, Stein, H, et al.. WHO classification of tumours of haematopoietic and lymphoid tissues, Revised 4th ed. Lyon: International Agency for Research on Cancer; 2017:61–9 pp.Search in Google Scholar
34. Swerdlow, SH, Campo, E, Harris, N, Jaffe, E, Pileri, A, Stein, H, et al.. WHO classification of tumours of haematopoietic and lymphoid tissues, 4th ed. Lyons: International Agency for Research on Cancer (IARC); 2008:54–63 pp.Search in Google Scholar
35. Lyons, JJ. Inherited and acquired determinants of serum tryptase levels in humans. Ann Allergy Asthma Immunol 2021;127:420–6. https://doi.org/10.1016/j.anai.2021.06.019.Search in Google Scholar PubMed PubMed Central
36. Gonzalez-Quintela, A, Vizcaino, L, Gude, F, Rey, J, Meijide, L, Fernandez-Merino, C, et al.. Factors influencing serum total tryptase concentrations in a general adult population. CCLM 2010;48:701–6. https://doi.org/10.1515/cclm.2010.124.Search in Google Scholar
37. Inker, LA, Astor, BC, Fox, CH, Isakova, T, Lash, JP, Peralta, CA, et al.. KDOQI US commentary on the 2012 KDIGO clinical practice guideline for the evaluation and management of CKD. Am J Kidney Dis 2014;63:713–35. https://doi.org/10.1053/j.ajkd.2014.01.416.Search in Google Scholar PubMed
38. Keyzer, JJ, Breukelman, H, Wolthers, BG, Heuvel, M, Kromme, N, Berg, WC. Urinary excretion of histamine and some of its metabolites in man: influence of the diet. Agents Actions 1984;15:189–94. https://doi.org/10.1007/bf01972348.Search in Google Scholar
39. García-Martín, E, Ayuso, P, Martínez, C, Blanca, M, Agúndez, JA. Histamine pharmacogenomics. Pharmacogenomics 2009;10:867–83. https://doi.org/10.2217/pgs.09.26.Search in Google Scholar PubMed
40. WHO Classification of Tumours Editorial Board. Haematolymphoid tumours WHO classification of tumours, 5th ed. Lyon: International Agency for Research on Cancer; 2024, 11:60–71 pp.Search in Google Scholar
Supplementary Material
This article contains supplementary material (https://doi.org/10.1515/cclm-2025-0189).
© 2025 the author(s), published by De Gruyter, Berlin/Boston
This work is licensed under the Creative Commons Attribution 4.0 International License.
Articles in the same Issue
- Frontmatter
- Editorial
- Quality indicators: an evolving target for laboratory medicine
- Reviews
- Regulating the future of laboratory medicine: European regulatory landscape of AI-driven medical device software in laboratory medicine
- The spectrum of nuclear patterns with stained metaphase chromosome plate: morphology nuances, immunological associations, and clinical relevance
- Opinion Papers
- Comprehensive assessment of medical laboratory performance: a 4D model of quality, economics, velocity, and productivity indicators
- Detecting cardiac injury: the next generation of high-sensitivity cardiac troponins improving diagnostic outcomes
- Perspectives
- Can Theranos resurrect from its ashes?
- Guidelines and Recommendations
- Australasian guideline for the performance of sweat chloride testing 3rd edition: to support cystic fibrosis screening, diagnosis and monitoring
- General Clinical Chemistry and Laboratory Medicine
- Recommendations for the integration of standardized quality indicators for glucose point-of-care testing
- A cost-effective assessment for the combination of indirect immunofluorescence and solid-phase assay in ANA-screening
- Assessment of measurement uncertainty of immunoassays and LC-MS/MS methods for serum 25-hydroxyvitamin D
- A novel immunoprecipitation-based targeted liquid chromatography-tandem mass spectrometry analysis for accurate determination for copeptin in human serum
- Histamine metabolite to basal serum tryptase ratios in systemic mastocytosis and hereditary alpha tryptasemia using a validated LC-MS/MS approach
- Machine learning algorithms with body fluid parameters: an interpretable framework for malignant cell screening in cerebrospinal fluid
- Impact of analytical bias on machine learning models for sepsis prediction using laboratory data
- Immunochemical measurement of urinary free light chains and Bence Jones proteinuria
- Serum biomarkers as early indicators of outcomes in spontaneous subarachnoid hemorrhage
- High myoglobin plasma samples risk being reported as falsely low due to antigen excess – follow up after a 2-year period of using a mitigating procedure
- Candidate Reference Measurement Procedures and Materials
- Commutability evaluation of glycated albumin candidate EQA materials
- Reference Values and Biological Variations
- Health-related reference intervals for heavy metals in non-exposed young adults
- Hematology and Coagulation
- Practical handling of hemolytic, icteric and lipemic samples for coagulation testing in European laboratories. A collaborative survey from the European Organisation for External Quality Assurance Providers in Laboratory Medicine (EQALM)
- Cancer Diagnostics
- Assessment of atypical cells in detecting bladder cancer in female patients
- Cardiovascular Diseases
- False-positive cardiac troponin I values due to macrotroponin in healthy athletes after COVID-19
- Diabetes
- A comparison of current methods to measure antibodies in type 1 diabetes
- Letters to the Editor
- The neglected issue of pyridoxal- 5′ phosphate
- Error in prostate-specific antigen levels after prostate cancer treatment with radical prostatectomy
- Arivale is dead ‒ Hooke is alive
- A single dose of 20-mg of ostarine is detectable in hair
- Growing importance of vocabularies in medical laboratories
- Congress Abstracts
- 62nd National Congress of the Hungarian Society of Laboratory Medicine Szeged, Hungary, August 28–30, 2025