High myoglobin plasma samples risk being reported as falsely low due to antigen excess – follow up after a 2-year period of using a mitigating procedure
-
Anders O. Olsson

 ,
Karin Lundberg
,
Karin Lundberg

Abstract
Objectives
Antigen excess (AE) or high dose hook-effect can seriously affect the reported concentration of an analyte, which may impact clinical decisions. This study analyze to what extent the Roche Elecsys® Myoglobin assay is affected by antigen excess and how this can affect the reported myoglobin concentration.
Methods
A dilution series experiment was conducted on a patient sample with a very high myoglobin concentration (>150,000 μg/L). Based on this, an AE mitigation procedure based on sample dilutions was developed and implemented. A retrospective analysis of reported patient results was performed to assess the potential frequency of samples that could be affected by AE.
Results
In the dilution experiment the Roche Elecsys® Myoglobin assay was susceptive to AE, where samples with concentrations >115,000 μg/L may be reported as <3,000 μg/L. Dilution series from patient samples (n=20) subjected to the AE mitigation procedure showed the same pattern as the dilution experiment. The percentage of samples >115,000 µ/L increased significantly after the AE mitigation procedure had been implemented. After implementation of the AE mitigation procedure, the maximum myoglobin concentration observed was 780,000 μg/L.
Conclusions
If the Roche Elecsys® Myoglobin assay is used according to the manufacturer, extremely high myoglobin samples risk being reported as only mildly elevated or near normal. This may affect clinical decisions. Thus, we suggest an AE mitigation procedure with automatic dilution of samples where myoglobin concentrations exceed 500 μg/L to mitigate this risk. Roche needs to take further actions to eliminate the consequences of the AE interference.
Introduction
Myoglobin is released during skeletal and cardiac muscle damage. It has a direct role in the development of acute kidney injury upon severe skeletal muscle damage (rhabdomyolysis). In severe rhabdomyolysis, defined as myoglobin >10,000 μg/L, extracorporeal elimination of circulating myoglobin resulted in more frequent recovery of kidney function [1]. Consequently, in a recent consensus statement from the rhabdomyolysis task force, it was suggested that patients with myoglobin >10,000 μg/L should be considered as a high-risk group for secondary organ damage. In these patients, removal of myoglobin from the blood by for example hemoadsorption should be considered. Furthermore, it was recommended that hemoadsorption should be continued until myoglobin concentrations were consistently <5,000 μg/L [2]. Thus, accurate monitoring of plasma myoglobin levels is of great importance for guiding treatment, to minimize the risk of sustained renal damage.
The Roche Elecsys® Myoglobin is a sandwich-type assay that have a measuring range in undiluted samples of up to 3,000 μg/L [3], 4]. During routine validation when transferring the assay from a Cobas® e602 to a Cobas® e801 instrument, samples analyzed on the Cobas e602® were used to determine the method commutability. One of the samples had a concentration of 158,000 μg/L on the e602, but the result was only 2,500 μg/L on the e801 instrument. On the e602 instrument the initial concentration of the undiluted sample was >3,000 μg/L resulting in further dilutions, whereas the 2,500 μg/L result on the e801 did not motivate any further automatic dilutions. When dilutions were manually ordered on the e801, the final concentration was determined to 147,000 μg/L. High dose hook-effect or more specific antigen excess (AE) interference was suspected.
Antigen excess (AE) is a well-known phenomenon hampering some immunoassays and is the depletion of signal with higher concentration (instead of an expected increased signal) when presented with very high concentrations of analyte antigen [5]. This is an interference observed mostly in Sandwich based immunoassays and turbidumetric methods, where both the capture and detection antibodies are added to the sample without an intermediate wash step (one-step). The interference is caused by a saturation of both capture and detection antibodies and results in reduced formation of Sandwich complexes, with a decrease in analytical signal as a result. AE is a potential problem when the expected analyte concentration range is wide. The Roche Elecsys® assay is a one-step Sandwich based assay [3], 4].
Previous case reports indicated that the Roche Elecsys® Myoglobin assay may give false low myoglobin concentrations in plasma [6] and urine [7]. Furthermore, there are also earlier reports of AE problem [8], 9] with other myoglobin assays, indicating a common problem with myoglobin assays in general due to the potential wide concentration range in patient samples. However, there are no data on the prevalence of patient samples with very high myoglobin concentrations that could risk getting a false result due to AE. In the current study, we aim to determine above which myoglobin concentration a patient sample result might be adversely affected by AE. Furthermore, an AE mitigation procedure was implemented and the prevalence of samples identified as affected by AE are presented. Finally, data from two example patient cases are shown, illustrating the potential severe consequences of unidentified AE in myoglobin measurements.
Materials and methods
Determination of myoglobin in plasma samples
During the period 2016 to 2022 myoglobin was analyzed on a Cobas® e602 instrument (Roche Diagnostics GmbH, Mannheim, Germany) using the Elecsys® Myoglobin assay (Catalog # 12178214122)[4]. With start in January 2023, myoglobin was analyzed on a Cobas® e801 instrument (Roche Diagnostics GmbH, Mannheim, Germany) using the Elecsys® Myoglobin assay (Catalog # 07027583190)[3]. The assays are essentially the same (same antibodies and incubation and detection principles), but the sample volume has been reduced in the later version to fit the new platform.
Assessment of antigen excess
To investigate the assay sensitivity to AE, a sample with a high myoglobin concentration (originally assessed to 158,000 μg/L on a e602 instrument not part of this study) was used to prepare dilution series. The dilution series was analyzed on two instruments, a Cobas® e801 and a Cobas® e602 at different occasions and with different reagent lots. The series consisted of at least 6 different diluted aliquots that were analyzed undiluted, after 1:10 automatic dilution, and when needed with a 1:100 manually ordered dilution. A new dilution series was prepared for each occasion. The “true” concentration of the undiluted sample was assessed based on the least diluted sample giving a measurable concentration without any additional dilution. To determine the onset of the hook effect and at what concentration the AE would give falsely low results, the analyte signal in different aliquots and subsequent dilutions was compared to the calculated analyte concentration. Calculation of analyte concentrations at different dilutions was based on the assessed true concentration of the sample and the applied dilution factor.
This procedure was then performed on the results of all patient samples from the period 2023–2024 with myoglobin concentrations >100,000 μg/L (n=20). During this period, all myoglobin results >500 μg/L were routinely diluted. Multiple reagent and calibrator lots were used during this period.
Antigen excess mitigating procedure
According to the assay package insert, the upper limit of the measuring range without dilution is 3,000 μg/L. Concentrations above 3,000 μg/L are automatically diluted 1:10. Instead of using 3,000 μg/L as upper limit we applied an upper measuring limit of 500 μg/L, with a subsequent 1:10 dilution of samples above 500 μg/L. We chose 500 μg/L as a conservative limit, based on the results of the dilution experiments and taking into consideration the uncertainty of what the actual highest possible concentration of myoglobin could be. Factored in was also the practical aspect of limiting the number of samples that need to be diluted.
Patient result review
All reported plasma myoglobin results for the period of 2016-06-01 – 2024-12-31 were reviewed. Only patient results were included in the final analysis, i.e. myoglobin results of study subjects and technical tests were excluded.
The fraction of samples >30,000 μg/L and >115,000 μg/L were calculated for time periods 2016-06-01 - 2022-12-31, and 2023-01-01 - 2024-12-31, respectively. For time period 2016-06-01 - 2022-12-31, myoglobin results were obtained on the original Cobas® e602 without measures to mitigate AE.
Since 2023-01-01 steps to detect AE have been in place in the laboratory. For the time period 2023-01-01 to 2024-12-31 the proportion of samples analyzed that would have been reported with a false low concentration (if not the lower upper measuring range had been applied), was calculated in addition to proportion of samples above threshold levels. Two case examples (Patient A and B) from this time period were selected.
Statistical analysis
Differences in proportions of samples were assessed using Fisher’s exact test. p<0.05 were considered significant. All statistical analyses were carried out using R V4.4.1 (R Core Team (2024), https://www.R-project.org/).
Results
The onset of high-dose hook effect and the concentration at which AE affects the reported myoglobin result were tested on two different instruments, a Cobas® e801 and a Cobas® e602, respectively. The myoglobin signal in respect to concentration in the two dilution series are presented in Figure 1. Both instruments show obvious signs of AE, where concentrations above approximately 30,000 μg/L have reduced signals with increasing concentrations. However, AE becomes a problem only when the signal drops below the signal of the upper limit of the measuring range (slightly different on the two instruments), and in these experiments this corresponds to approximately 115,000 μg/L and 135,000 μg/L, on the Cobas® e801 and the Cobas® e602, respectively.
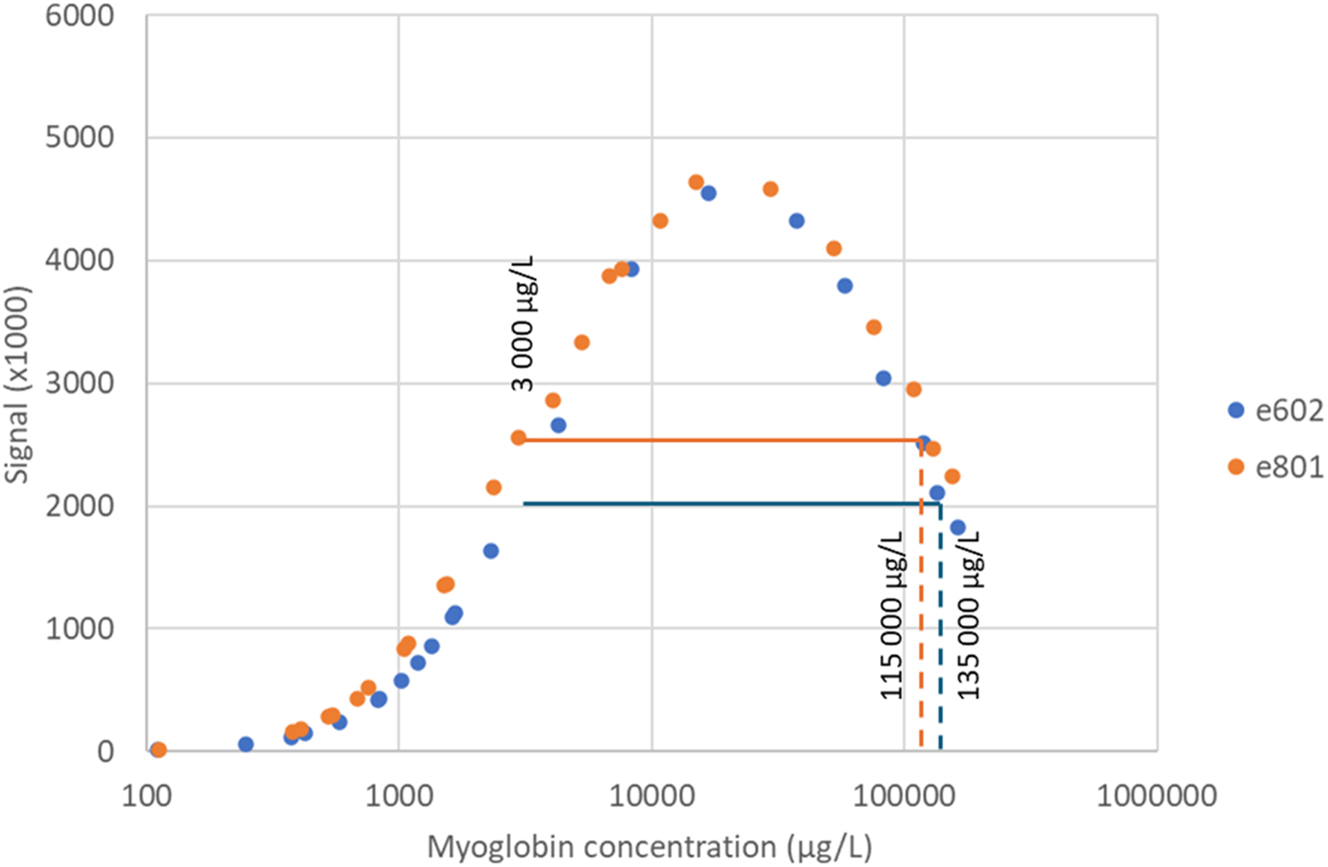
Response signal of different dilutions of a sample with myoglobin concentration of approx. 150,000 μg/L. The experiment was performed on two different instruments (blue e602 and orange e801). Horizontal line indicate signal at 3,000 μg/L (upper limit of measuring range) for both instruments at the time of the experiment. Vertical lines indicate AE cut off.
Response signal as a function of concentration for diluted samples with myoglobin >100,000 μg/L (n=20) from the last 2-year period is presented in Figure 2. The results show the same pattern as in the structured dilution experiment. However, there are clear indications that individual samples may deviate from the general pattern (Figure 2, circled results).
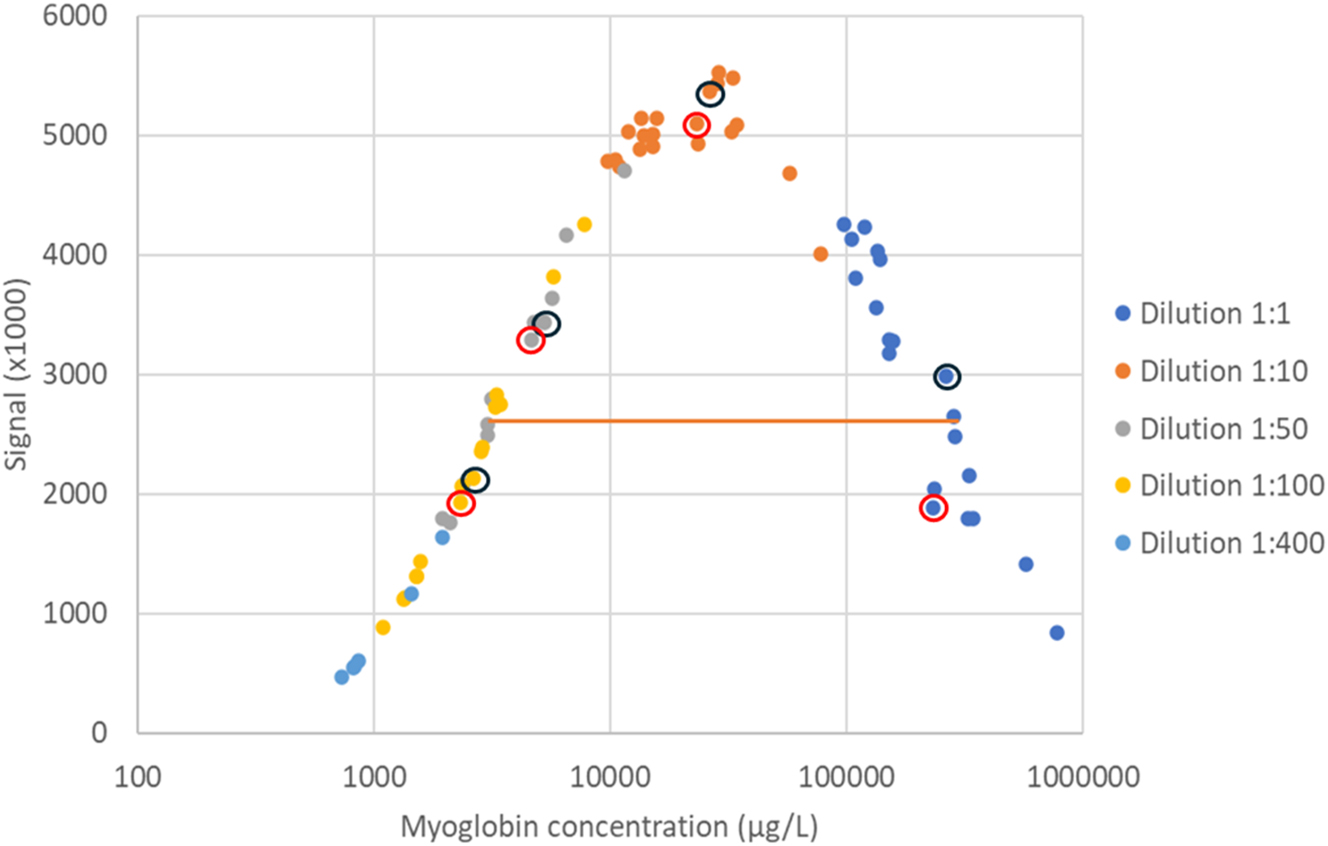
Response signal in relation to myoglobin concentration (logarithmic scale) in different dilutions of patient samples (n=20). Orange line represents average signal of the upper measuring limit (3,000 μg/L). Dilutions of two samples from the same patient (Patient A) are illustrated by circles. The reported concentration of the sample with black circles was 260,000 μg/L and the sample with red circles was 230,000 μg/L.
The fraction of myoglobin results >30,000 μg/L and >115,000 μg/L in samples analyzed for myoglobin between June 2016 to December 2022 are presented in Table 1. There were in total 32 samples with reported myoglobin concentrations >115,000 μg/L (0.14 % of the total number of myoglobin samples). Over the same period the percentage of samples >115,000 μg/L from the Intensive Care Unit (ICU) or Emergency Department (ED) of the hospital was 0.45 % (Table 1). Due to the variable nature of the AE it is highly likely that these numbers are underestimated. The highest concentration recorded during this period was 240,000 μg/L.
Number of myoglobin samples analyzed at Sahlgrenska University Hospital during different time periods. Proportions of samples above threshold levels were compared between time periods using Fisher’s exact test.
| Hospital unit | Number of samples | |||
|---|---|---|---|---|
| Total | >30,000 μg/L (% of total) | >115,000 μg/L (% of total) | Samples reported wrong if not diluted | |
|
|
||||
| 2016-06-01 – 2022-12-31. No AE mitigation procedure | ||||
|
|
||||
| All | 22,905 | 247 (1.1 %) | 32 (0.14 %) | ? |
| ICU and ED | 6,183 | 179 (1.3 %) | 28 (0.45 %) | ? |
|
|
||||
| 2023-01-01 – 2024-12-31. AE mitigation procedure implemented | ||||
|
|
||||
| All | 7,118 | 100 (1.4 %a) | 22 (0.31 %b) | 7 (0.098 %) |
| ICU and ED | 2034 | 80 (3.9 %a) | 18 (0.88 %a) | 7 (0.34 %) |
-
ap<0.05, bp<0.01.
The same retrospective analysis was performed for the period 2023 to 2024, during which a 1:10 dilution was applied to all samples with myoglobin >500 μg/L (Table 1). Over this period the number of samples with concentration >115,000 μg/L was 22 and the prevalence was approximately double compared to the earlier time period, 0.31 % and 0.88 %, of all samples and the ICU/ED samples, respectively. The increase in proportion of samples >115,000 µg/L was statistically significant (p<0.01). Seven samples had received falsely low myoglobin concentrations if antigen excess mitigating procedures had not been in place. The highest recorded concentration was 780,000 μg/L.
To illustrate the potential clinical impact of the antigen excess, the myoglobin concentrations in samples of two example patients collected over consecutive days are shown in Figure 3. Myoglobin was analyzed on admission and followed over a period of several days. In addition to the reported concentrations determined when antigen excess mitigating measures were applied, the concentrations that would have been reported if no AE mitigating procedure had been applied (i.e. using the measuring interval according to manufacturer), are shown. Finally, the estimated concentrations in a “worst case scenario” are visualized. This scenario represents concentrations assuming conditions similar to those at the time when the dilution experiment generating an antigen excess cut off of 115,000 μg/L was performed.
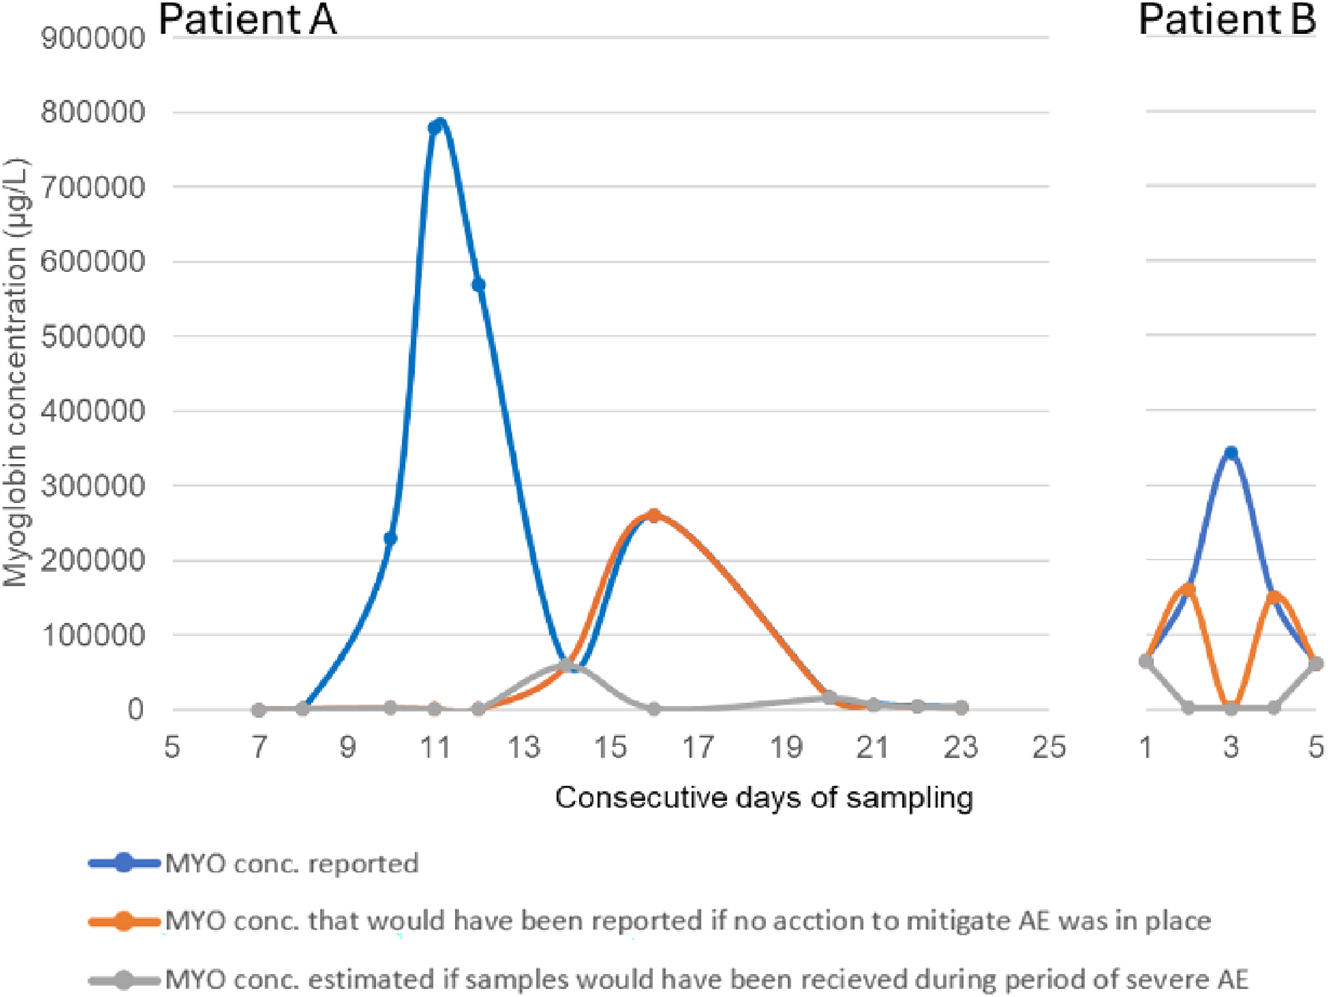
Case example. Myoglobin concentrations in two patients measured over consecutive days. Numbers refer to days after first myoglobin sample. Curves show concentration dynamics with (reported) or without procedures to mitigate AE. In addition, estimated results of a potential “worst case scenario”, corresponding to the conditions when the most severe AE effect was observed.
Discussion
Up until recently (June 2024) the Roche package insert regarding both the e602 and e801 platform only stated, “There is no high-dose hook effect at myoglobin concentrations up to 30,000 ng/mL [µg/L]”. This statement alone was dubious, since it was unclear if this meant that Roche had only tested up to 30,000 μg/L and not observed any hook effect or if a hook effect had been observed in samples with >30,000 μg/L. In an updated version of the insert (June 2024) it has been added “Above this concentration, the hook effect can be observed. In case of an unexpected low result, the sample should be diluted 1:10 (…) and retested.”. However, it is still unclear if Roche has data indicating that there is a risk of falsely low results already at concentrations as low as >30,000 μg/L or that this is the onset of the “hook” and that AE is expected to create falsely low results only at substantially higher concentrations. Our data suggests that AE can give falsely low results in samples with myoglobin concentrations at least as low as 115,000 μg/L under certain conditions (Figure 1).
Due to the wide expected concentration range all myoglobin immunoassays can in theory be affected by AE to some extent based on the assay methodology. It should be mentioned that even though the information given by Roche is unclear it is still, at least in the updated insert, alerting the user of a potential issue. Notably, a different manufacturer (Abbott) has no comment regarding any potential risk of AE in their myoglobin assay package inserts. If this is because they have validated that the assay do not suffer from AE or if they are unaware of the issue is not clear. Siemens on the other hand clearly states in their assay package insert that concentrations above 200,000 μg/L will give falsely low results. However, it is unclear how Roche and Siemens expect the customer to identify the samples that are giving “unexpected low results”.
Our results show that the AE varies. In the dilution experiments on the same patient sample performed on the two different models of Cobas® instruments (e602 and e801), both platforms were clearly suffering from AE (Figure 1), but to a different degree. This indicate that reagent lots and/or individual instruments (maintenance status or platforms) play a role in the variability of the AE. This is supported by historical data from the original Cobas® e602 instrument that have (at least in periods) been less susceptible to AE with reported myoglobin results up to 240,000 μg/L. Also, since the implementation of the new Cobas® e801 instrument, samples with concentrations up to 290,000 μg/L have been >3,000 μg/L as undiluted, thus, demonstrating that also the e801 instrument fluctuates in sensitivity for AE. This would indicate that reagent lots rather than instrument platforms are of more importance. However, based on the data from the last 2-year period when an AE mitigating routine has been implemented, there is no clear correlation with antigen excess and specific reagent lots (data not shown). On the other hand, our results indicate that the degree of AE at least partly may be dependent on the plasma matrix, as a clear variation in AE sensitivity in different samples from the same individual (Figure 2, circled data) was noted. It can be speculated that this may be caused by differences in for example treatments or disease states. Further studies are, however, needed to elucidate this.
An additional factor that could contribute to the observed AE variation is the manufacturers calibration method, i.e. applying two calibrators to adjust a general assay specific master curve. The high adjustment calibrator has the concentration of approx. 1,200 μg/L, thus quite far from the manufacturers upper measuring range. The shape of the master curve, as well as how the adjustment of the master curve at 1,200 μg/L adjust for actual changes in the response function towards 3,000 μg/L, are not provided by the manufacturer. The lack of transparency makes it hard to evaluate how much of the variability in calculated results from diluted samples (interpreted as AE variability) that can be attributed to different calibrations, but this could be a contributing factor.
To mitigate the observed risk of AE, a procedure was implemented where samples were automatically diluted >500 μg/L. In the present study, the maximum measured concentration was 780,000 μg/L after dilution. For this sample, the initially measured concentration prior to dilution was 1,120 μg/L. Thus, the >500 μg/L limit may seem conservative, but due to the observed variable and unpredictable nature of sensitivity to AE, we considered this an acceptable precaution. Consequently, more than 25 % of all samples requires dilution instead of 6–7% using measuring range according to package insert.
If the AE mitigation procedure described in the present study is not used, there is a risk of not identifying the very high myoglobin samples. The fraction of samples with concentrations higher than 115,000 μg/L increased significantly, approximately 2-fold, after adapting the lower upper limit of the measuring range. Notably, after applying the AE mitigation procedure, we observed a plasma sample with a myoglobin concentration as high as 780,000 μg/L compared to the previous highest sample of 240,000 μg/L. Also, after introducing the AE mitigating procedure, there were 7 samples that would have been reported as <3,000 μg/L, where the actual concentration was >200,000 μg/L.
The number of samples exceeding 115,000 μg/L, almost 1 % from the ICU or ED units, cannot be regarded as neglectable when considering the potential clinical implications. Clinical decisions may be seriously misled if extremely high results are reported as near normal due to AE. In the present study, results from two patient cases are presented (Figure 3). In Patient A, the dramatic release of, myoglobin into circulation starting at approximately day 9 would have gone completely unnoticed without actions to mitigate AE. Furthermore, if analyses had been carried out during a period of severe AE, the increase in myoglobin concentration would have gone almost completely unnoticed for the whole course of events. In Patient B, a 6-fold increase in the concentrations during the first two days followed by a decline over the next 2 days going back to the concentration at admission was observed. If no actions had been taken to mitigate AE, the observed myoglobin concentration over time would have taken the appearance of a sinus curve shape. If the analyses had been carried out during a period of severe AE, the concentration dynamics would have been completely inverted compared to the actual dynamic.
Although we did not have access to clinical data for the included patients, it is reasonable to assume that these two example patients may have received treatment with extracorporeal elimination of myoglobin due to the very high levels observed. If, on the other hand, concentration dynamics would have followed the AE susceptible pattern, treatment would perhaps not have been initiated at all or terminated prematurely, resulting in increased risk of permanent renal damage.
In conclusion, if the Roche® Elecsys myoglobin assay is performed according to package insert it is unsuitable for the intended use because of the risk of reporting falsely low myoglobin concentrations due to AE. The assay sensitivity to AE depends on many factors making it hard to routinely assess. In order to mitigate the risk of AE, we suggest truncating the measuring range of the undiluted sample from <3,000 μg/L to <500 μg/L. When using this routine, we have recorded myoglobin concentrations up to 780,000 μg/L. Antigen excess may result in severely underestimated very high myoglobin levels, possibly affecting treatment decisions. If the assay is performed according to manufacturer instruction, almost 1 % of the total number of myoglobin samples from ED and ICU departments, risk being reported as falsely low.
-
Research ethics: Not applicable.
-
Informed consent: Not applicable.
-
Author contributions: All authors have accepted responsibility for the entire content of this manuscript and approved its submission.
-
Use of Large Language Models, AI and Machine Learning Tools: None declared.
-
Conflict of interest: The authors state no conflict of interest.
-
Research funding: None declared.
-
Data availability: Not applicable.
References
1. Gräfe, C, Liebchen, U, Greimel, A, Maciuga, N, Bruegel, M, Irlbeck, M, et al.. The effect of cytosorb® application on kidney recovery in critically ill patients with severe rhabdomyolysis: a propensity score matching analysis. Ren Fail 2023;45:2259231. https://doi.org/10.1080/0886022x.2023.2259231.Suche in Google Scholar
2. Forni, L, Aucella, F, Bottari, G, Büttner, S, Cantaluppi, V, Fries, D, et al.. Hemoadsorption therapy for myoglobin removal in rhabdomyolysis: consensus of the hemoadsorption in rhabdomyolysis task force. BMC Nephrol 2024;25:247. https://doi.org/10.1186/s12882-024-03679-8.Suche in Google Scholar PubMed PubMed Central
3. Elecsys Myoglobin (07027583500) Package Insert, v.9.0, Roche Diagnostics; Mannheim G, Editor 2024-06-01.Suche in Google Scholar
4. Elecsys Myoglobin (12178214122) Package Insert, v.22.0, Roche Diagnostics; Mannheim G, Editor 2024-07-01.Suche in Google Scholar
5. Jacobs, JF, van der Molen, RG, Bossuyt, X, Damoiseaux, J. Antigen excess in modern immunoassays: to anticipate on the unexpected. Autoimmun Rev 2015;14:160–7. https://doi.org/10.1016/j.autrev.2014.10.018.Suche in Google Scholar PubMed
6. Kurt-Mangold, M, Drees, D, Krasowski, MD. Extremely high myoglobin plasma concentrations producing hook effect in a critically ill patient. Clin Chim Acta 2012;414:179–81. https://doi.org/10.1016/j.cca.2012.08.024.Suche in Google Scholar PubMed
7. Hunsaker, JJH, La’ulu, SL, Zupan, E, Patel, D, Pandya, V, Rudolf, JW. Detection of a high-dose hook effect and evaluation of dilutions of urine myoglobin specimens using a serum myoglobin assay. Ann Lab Med 2024;44:367–70. https://doi.org/10.3343/alm.2023.0427.Suche in Google Scholar PubMed PubMed Central
8. Toft, E, Stentoft, J, Andersen, PT. False-negative latex-agglutination test for myoglobin owing to antigen excess. Clin Chem 1988;34:177. https://doi.org/10.1093/clinchem/34.1.177.Suche in Google Scholar
9. Kikuchi, H, Ohta, A, Takahashi, Y, Shibata, A, Ohtake, T, Watanabe, K. High-dose hook effect in an immunochromatography-optical quantitative reader method for myoglobin. Clin Chem 2003;49:1709–10. https://doi.org/10.1373/49.10.1709.Suche in Google Scholar PubMed
© 2025 the author(s), published by De Gruyter, Berlin/Boston
This work is licensed under the Creative Commons Attribution 4.0 International License.
Artikel in diesem Heft
- Frontmatter
- Editorial
- Quality indicators: an evolving target for laboratory medicine
- Reviews
- Regulating the future of laboratory medicine: European regulatory landscape of AI-driven medical device software in laboratory medicine
- The spectrum of nuclear patterns with stained metaphase chromosome plate: morphology nuances, immunological associations, and clinical relevance
- Opinion Papers
- Comprehensive assessment of medical laboratory performance: a 4D model of quality, economics, velocity, and productivity indicators
- Detecting cardiac injury: the next generation of high-sensitivity cardiac troponins improving diagnostic outcomes
- Perspectives
- Can Theranos resurrect from its ashes?
- Guidelines and Recommendations
- Australasian guideline for the performance of sweat chloride testing 3rd edition: to support cystic fibrosis screening, diagnosis and monitoring
- General Clinical Chemistry and Laboratory Medicine
- Recommendations for the integration of standardized quality indicators for glucose point-of-care testing
- A cost-effective assessment for the combination of indirect immunofluorescence and solid-phase assay in ANA-screening
- Assessment of measurement uncertainty of immunoassays and LC-MS/MS methods for serum 25-hydroxyvitamin D
- A novel immunoprecipitation-based targeted liquid chromatography-tandem mass spectrometry analysis for accurate determination for copeptin in human serum
- Histamine metabolite to basal serum tryptase ratios in systemic mastocytosis and hereditary alpha tryptasemia using a validated LC-MS/MS approach
- Machine learning algorithms with body fluid parameters: an interpretable framework for malignant cell screening in cerebrospinal fluid
- Impact of analytical bias on machine learning models for sepsis prediction using laboratory data
- Immunochemical measurement of urinary free light chains and Bence Jones proteinuria
- Serum biomarkers as early indicators of outcomes in spontaneous subarachnoid hemorrhage
- High myoglobin plasma samples risk being reported as falsely low due to antigen excess – follow up after a 2-year period of using a mitigating procedure
- Candidate Reference Measurement Procedures and Materials
- Commutability evaluation of glycated albumin candidate EQA materials
- Reference Values and Biological Variations
- Health-related reference intervals for heavy metals in non-exposed young adults
- Hematology and Coagulation
- Practical handling of hemolytic, icteric and lipemic samples for coagulation testing in European laboratories. A collaborative survey from the European Organisation for External Quality Assurance Providers in Laboratory Medicine (EQALM)
- Cancer Diagnostics
- Assessment of atypical cells in detecting bladder cancer in female patients
- Cardiovascular Diseases
- False-positive cardiac troponin I values due to macrotroponin in healthy athletes after COVID-19
- Diabetes
- A comparison of current methods to measure antibodies in type 1 diabetes
- Letters to the Editor
- The neglected issue of pyridoxal- 5′ phosphate
- Error in prostate-specific antigen levels after prostate cancer treatment with radical prostatectomy
- Arivale is dead ‒ Hooke is alive
- A single dose of 20-mg of ostarine is detectable in hair
- Growing importance of vocabularies in medical laboratories
- Congress Abstracts
- 62nd National Congress of the Hungarian Society of Laboratory Medicine Szeged, Hungary, August 28–30, 2025