Prediction of Sewing Thread Consumption for Over-Edge Stitches Class 500 Using Geometrical and Multi-Linear Regression Models
-
Malek Sarah
 ,
Dominique C. Adolphe
,
Dominique C. Adolphe

Abstract
Rapid and precise methods (geometrical and statistical), which aim to predict the amount of sewing thread needed to sew a garment using different over-edge stitches of class 500 (501, 503, 504, 505, 512, 514, 515, and 516), have been provided. Using a geometrical method of different over-edge stitch shapes, sewing consumption value was determined to avoid the unused stocks for each stitch type. The prediction of the sewing thread consumption relative to each investigated over-edge stitch was proposed as a function of the studied input parameters, such as material thickness, stitch density, yarn diameter, and seam width (distance between the needle and the cutter and the distance between two needles). To improve the established models using a geometrical method, a statistical method based on multi-linear regression was studied. Geometrical and statistical results were discussed, and the coefficient R2 value was determined to evaluate the accuracy of the tested methods. By comparing the estimated thread consumption with the experimental ones, we concluded that the geometrical method is more accurate than the statistical method regarding the range of R2 (from 97.00 to 98.78%), which encourages industrialists to use geometrical models to predict thread consumption.
All studied parameters contributing to the sewing thread consumption behavior were investigated and analyzed in the experimental design of interest. It was concluded that the most important parameter affecting thread consumption is the stitch density. The material thickness and the seam width (B1) have a little impact on thread consumption values. However, the seam thread diameter has a neglected effect on thread consumption.
1 Introduction
The sewing thread consumption has been an unsolved and a complicated problem for many years, and scientists have tried to give manufacturers of sewing threads accurate results. As the sewing thread consumption problem remains a function of several parameters, assumptions, and hypotheses, researchers used different techniques (mathematical, statistical, etc.) and industrialists are still looking for reliable, efficient, and fruitful solutions. Nevertheless, sewing thread is one of the most important components of a sewn product that contributes significantly to the useful life of a product [1]. Indeed, sewing thread consumption is very interesting not only for the garment manufacturers and sewing threads suppliers but also for researchers who try to determine scientifically the suitable method to estimate consumed thread based on different techniques.
Indeed, the sewing thread consumption topic helps manufacturers to estimate their consumed thread based on stitch types consumptions before launching their seaming process.
According to the literature, an important number of studies have analyzed some woven and knitted garment problems to find an accurate method allowing them to objectively estimate the amount of sewing thread required to prepare garments [2,3,4,5]. However, the determination of the exact required amount is still difficult. Indeed, the industrial consumptions of sewing thread depend on different input parameters, such as yarn count, mass, wastage, and rate of breaks during sewing, which makes it difficult to identify the required thread amount [6, 7]. Indeed, little investigation has been done to determine the relationship among the sewing machine parameters, the thread insertion inputs, the clothing morphology factors simultaneously, and the consumed thread [8, 9]. Approximations and presumptions especially when stitch density, seam type, and material thickness are the main studied input parameters [10, 11]. In fact, these variables change according to the presumed garment's style or type. So, the thread consumption value cannot be considered, in any case, as a standard for sewn garment, such as jean pants, shirts, and jackets. Lauriol estimated the waste percentage value of sewing thread (10–15%), which should be added to the approximate values of consumed sewing thread [12].
It is still difficult to evaluate the sewing thread amount required to stitch a garment and to predict it as a function of the most influential input parameters. In this context, Abher et al. [9] considered the geometrical model to calculate the consumption of the sewing thread for 301 lockstitch. Sharma et al. [13] predicted the sewing thread consumption for chain stitch using regression models, and VIinay et al. [14] predicted the sewing thread consumption for lockstitch using regression models. Moreover, Jaouachi provided a rapid and accurate method to predict the amount of sewing thread required to stitch a specific length of woven fabric using lockstitch stitch (301) and chain stitch (401) and regression models, neural network and geometrical models, and fuzzy method [4, 15, 16]. Furthermore, chain stitch 401 was studied by Khedher and Jaouachi [5]. Also, Ghosh et al. [17] have determined a geometrical model of stitch length for lockstitch seam. Jaouadi et al. [18] compared thread consumption using both regression analysis and neural networks and proved that the neural network offers the most accurate prediction. Recently, Midha et al. [19] have predicted sewing thread consumption for lockstitch using the regression model. Furthermore, Gazzeh et al. [20] have developed a model, based on the 602 geometrical cover stitches, to calculate the relative consumed sewing thread length. Abher et al. [1] studied a geometrical model to calculate the consumption of sewing thread for 504 over-edge stitch.
Although the prediction of thread consumption has been studied for the 301, 401, 504, 516, and 602 stitches, to the best of our knowledge there is no work dealing with the determination of the seam thread consumption of different types of stitches in the same class.
Until now there is no work in the literature aimed to develop the geometrical relationships between the overall over-edge stitch types in the same class based on the geometrical models relative to stitch geometry consumptions (not one or two or three in the same class).
In the literature, among all stitch types of class 500, only the thread consumption of over-edge stitch type 504 has been studied. However, we investigate in the present work the most used over-edge stitch types in class 500 to sew garments. Undoubtedly, denim garments and various fabric types are seamed based mostly on these studied over-edge types.
This study aims to accurately determine the amount of sewing thread required to stitch a specific length of woven fabric using seven over-edge stitch types of class 500 (501, 503, 504, 505, 512, 514, 515, and 516). Indeed, two methods are proposed, and compared, to select the best one for the prediction of thread consumption and to help industrialists to estimate accurately the consumed amount of sewing thread. Thus, the geometrical method and a multi-linear regression method are considered.
According to the literature, many previous works used the geometrical model, regression model, fuzzy methods, and neural network model to predict the amount of sewing thread consumption. In this work, we chose geometrical and multi-linear regression methods because they are the two most used methods that allow giving relevant results in the field of sewing thread consumption. In our point of view, these techniques are very useful for prediction due to their simplicity of implementation, accuracy, and relevance, especially for industrialists. Indeed, based on the literature, the same applied methods have presented their efficiency to predict and evaluate widely the sewing thread consumption for lockstitch, chain stitch, over-edge, and cover stitch types 301, 401, 504, 516, and 602, respectively. However, there is no work dealing with the geometrical and regressive relationships between overall types of stitches in the same class (based on the geometrical models relative to stitch geometry consumptions). In fact, this study underlines the originality of the present work. Referring to the published studies, among overall Over-edge Stitch types of class 500, only the thread consumption based on stitch type 516 has been studied. In addition to the originality given previously in this study, another one consists of the most used Over-edge Stitch types in class 500 to sew garments that are also investigated and predicted widely. Undoubtedly, different clothes are seamed based mostly on these studied stitch types, such as denim garments and hems of knitwear, for the laying of mesh fabric and lace underwear and lingerie.
Moreover, the effect of each input parameter has been studied and discussed to clarify to the industrialists the most significant factors to regulate before launching production.
2 Materials and methods
2.1 Fabric properties
Six commercial denim fabrics were chosen in our study. They have different characteristics, namely thicknesses and blend compositions (chosen to cover a wide range of thicknesses and compositions). The samples and their properties are presented in Table 1. The results presented hereby are the average of five tests for each sample.
Fabric properties
| Parameter | Warp yarn density (ends/cm) | Linear density (tex) | Mass per square meter | Thickness | Tensile properties | |||||
|---|---|---|---|---|---|---|---|---|---|---|
| Fabric composition no | Warp | Weft | Mass (g/m2) | CV (%) | Thickness (mm) | CV (%) | Breaking force (N) | Elongation at break (%) | CV (%) | |
| 1 | 26 | 11.9 | 20 | 323 | 1.9 | 1.2 | 1.4 | 413.63 | 12.66 | 1.4 |
| 30 | 12.5 | 16.67 | 387 | 2.1 | 1.04 | 1 | 1,071.90 | 17.89 | 2.1 | |
| 2 | 32 | 11.36 | 14.92 | 445 | 1.5 | 0.96 | 1.4 | 894.26 | 17.40 | 0.8 |
| 29 | 12.5 | 27.78 | 342 | 1.2 | 0.90 | 1.6 | 624.21 | 30.45 | 1.2 | |
| 3 | 31 | 12.5 | 27.78 | 334 | 1.6 | 0.85 | 1.2 | 557.24 | 33.64 | 0.6 |
| 28 | 14.29 | 27.78 | 328 | 0.9 | 0.75 | 2.1 | 528.13 | 25.12 | 2.4 | |
Fabric composition no °1: 100% cotton warp and weft threads; fabric composition no 2: 100% cotton warp yarn and weft yarn in 95% cotton and 5% elastane; fabric composition no 3: 100% cotton warp yarn and weft yarn in 71% cotton, 5% elastane and 24% polyester.
The studied denim fabrics were prepared on a SULZER P7300 weaving loom projectile with 3/1 twill structure, whereas denim fabrics are generally made of cotton, cotton/elastane, or cotton/polyester/elastane. These specific compositions are considered in this study.
2.2 Sewing thread properties
Two commercial sewing threads, commonly used for sewing denim fabrics, were chosen. The selection of these threads was based on their linear densities, which can probably affect the used amount of sewing thread. The sewing thread linear densities were chosen according to NFG 07-117 [21]. Indeed, two “Royal” types of sewing threads were used. They are two-twisted and three-twisted polyester spun threads. The actual counts of the threads were 63.5 and 95 tex.
The seam threads’ properties are shown in Table 2.
Sewing threads properties
| Properties | Thread no 1 | Thread no 2 |
|---|---|---|
| Linear density (tex) | 63.50 | 95.00 |
| Number of strands | 3 | 3 |
| Composition | 100% PES | 100% PES |
| Twist direction | S | S |
| Breaking force (N) | 24.23 | 26.43 |
| Breaking elongation (%) | 21.12 | 16.90 |
| Rigidity (N/m) | 389.12 | 536.59 |
| Twist/m | 353.00 | 294.00 |
| Tenacity (cN/tex) | 38.16 | 27.82 |
2.3 Methods used for thread consumption prediction
In this work, a geometrical method and a multi-linear regression method are considered. We tested the most useful over-edge stitch class 500 in the sewn product industry. The over-edge stitch class 500 is the class used in most types of sewn products. Its thread consumption is as high as class 400. Both stitch classes are usually used for sewing denim garments (such as trousers, shirts, jackets, knitwear, mesh fabric, and lingerie). For this reason, eight types of stitch are chosen. In this work, we try to establish models to explain consumed thread based on over-edge stitch class 500, thus making one of the originalities of the present study, because until now there is no work dealing with over all types of stitch in the same class.
In fact, eight types of stitch for class 500 were considered. These stitches are as follows:
Over-edge stitch 501, one thread;
Over-edge stitch 503, one needle, two threads;
Over-edge stitch 504, one needle, three threads;
Over-edge stitch 505, one needle, three threads;
Over-edge stitch 512, two needles, four threads;
Over-edge stitch 514, two needles, four threads;
Over-edge 515 stitch, two needles, four threads; and
Over-edge 516 stitch, two needles, five threads.
Nevertheless, for the multi-linear regression, a statistical method based on an experimental design using MINITAB-17 software was applied to conduct objectively this modeling technique. Moreover, based on these multi-linear regression models, thanks to MINITAB-17 software, individual effects of input parameters were determined, analyzed, and classified. For both geometric and statistical methods, five input parameters with their levels were taken into account [material thickness (six levels), stitch density (three levels), yarn diameter (two levels), and stitch width (distance between the needle and the cutter (three levels) and the distance between two needles (two levels)]. It is highly complicated to optimize all parameter effects during the sewing process. The predicted thread consumption is still related to the stitched fabric plies or layers. In this work, all samples were sewn using two fabrics plies.
According to other parameters, such as thread tension, elongation behavior, and fabric compressibility, in this work, as in the most published ones, researchers usually do not consider the complex parameters to develop their models to facilitate their analysis. These parameters are remained constant to simplify the calculation of the consumed sewing thread based on stitch type. In the experimental analysis, all these parameters are adjusted and then, kept constant to seam overall studied fabrics. In fact, during the sewing process, the thread is fed to the sewing machine under a controlled tension, which leads to sewing thread extension. Therefore, the experimental conditions, such as thread tension and elongation behavior, are not discussed in this work despite their effect on the consumption behavior because they have been maintained constant.
3 Results and discussion
3.1 Geometrical model
The stitch modeling was realized using a mathematical calculation based on geometrical shapes of over-edge stitch geometries and some assumptions to facilitate the calculation of the consumed thread. However, to represent the overall shape geometries of the over-edge stitch class 500, we used two software: 3ds Max 2014 and keyshot 5. In our case, we must indicate that we assume that the cross-section of threads is circular and incompressible in nature. Also, in all cases, the needle threads and looper threads are the same.
3.1.1 Case of over-edge stitch type 504
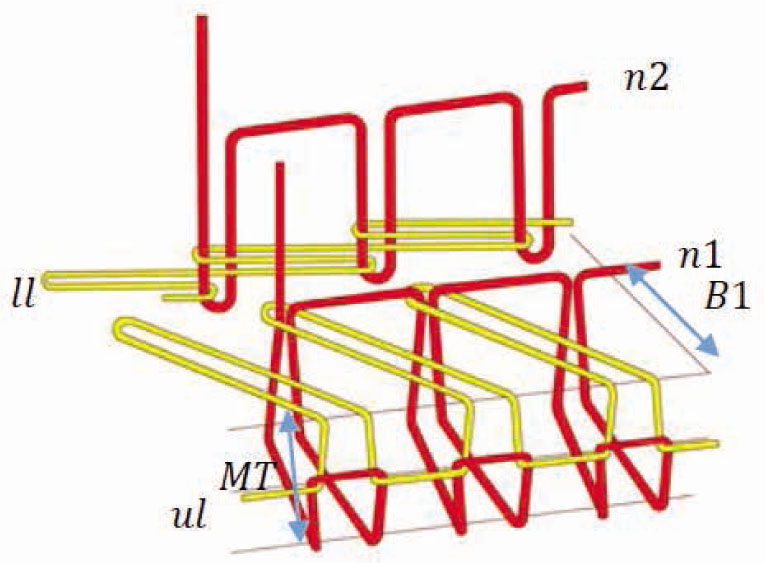
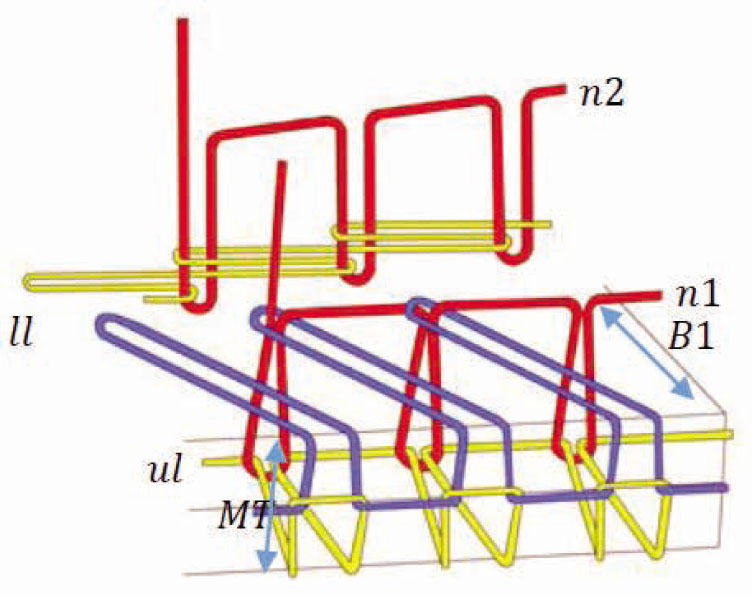
Figure 1A indicates the actual seam configuration and the positions of interlacing points formed by needle(s) and looper(s) threads. Figure 1B indicates a stitch configuration (a rectangular shape) of an over-edge stitch seam with a repeating unit. A unit cell of a seam has spacing. The thread length of a unit cell is assumed to be the same throughout the seam length for all the repeated units. Further elaboration of Figure 1 concluded that the stitch class 504 consists of three parts, i.e., needle thread, upper lopper thread, and lower lopper thread. Therefore, the sewing thread consumption of stitch class 504 depends on these three threads. Total thread consumed in a stitch will be the sum of needle thread consumed, upper lopper thread consumed, and lower lopper thread consumed. From the geometrical representation of each studied over-edge stitch, the length of the sewing thread was calculated for each stitch based on simple mathematical principles (sum, shape calculation using basic mathematical relationships, circular section of thread, incompressible threads, incompressible fabrics, etc.). It was assumed that the yarn is circular and incompressible in nature. The diameters of needle and looper(s) thread are equal; these are also equal to yarn present in a given fabric. The fabric is also incompressible in nature. The model is two dimensional in nature.
Geometrical model of over-edge stitch type 504 presented in three dimensions.
Equation (1) represents the total thread consumed by a stitch.
The amount of sewing thread C504 needed for the 504 over-edge stitch, whose geometry is represented in Figure 1, is estimated by the following formula:
where Cn504 is the consumption of needle thread (n1), Cul504 is the consumption of upper looper thread, and Cll504 is the consumption of lower looper thread.
Where
According to Abher et al. [1], the lower and upper loopers are presented as follows (Figures 2 and 3).
![Figure 2 Lower looper thread: (i) actual geometry and (ii) draw geometry [1].](/document/doi/10.2478/aut-2019-0060/asset/graphic/j_aut-2019-0060_fig_002.jpg)
Lower looper thread: (i) actual geometry and (ii) draw geometry [1].
![Figure 3 Upper looper thread: (i) actual geometry and (ii) draw geometry [1].](/document/doi/10.2478/aut-2019-0060/asset/graphic/j_aut-2019-0060_fig_003.jpg)
Upper looper thread: (i) actual geometry and (ii) draw geometry [1].
With
But here in our case, for more precision,
To calculate a sewing thread diameter supposed as circular (d), we used the general equation supposed by Sohanur [22] as a function of the thread linear density Tex [see Eq. (7)]:
Also, he said that X is linear but here, we observe that the thread form is rather rounded (Figures 4–6).
Lower looper thread: (i) actual geometry and (ii) draw geometry.
Upper looper thread: (i) actual geometry and (ii) draw geometry.
Geometrical model of over-edge stitch type 503.
Then,
With
Regarding that X represents 0.8 times of SL (according to Abher) and Y is equal to SW, then
Then,
Regarding that X represents 0.9 times of SL (according to Abher) and Y is equal to SW, then
3.1.2 Case of over-edge stitch type 503
The amount of sewing thread C503 needed for the 503 over-edge stitch, whose geometry is represented previously in Figure 2, is estimated by the following formula:
where Cn505 is the consumption of needle thread (n1) and Cll514 is the consumption of lower looper thread (Figure 7).
Geometrical model of over-edge stitch type 501.
Where
3.1.3 Case of over-edge stitch type 501
The amount of sewing thread C501 needed for the 501 over-edge stitch, whose geometry is represented previously in Figure 2, is estimated by the following formula:
where C1 is the consumption of looper thread (n1) (Figure 8).
Geometrical model of over-edge stitch type 505.
Where
3.1.4 Case of over-edge stitch type 505
The amount of sewing thread C505 needed for the 505 over-edge stitch, whose geometry is represented previously in Figure 2, is estimated by the following formula:
where Cn505 is the consumption of needle thread (n1), Cul504 is the consumption of upper looper thread, and Cll504 is the consumption of lower looper thread (Figure 9).
Geometrical model of over-edge stitch type 512.
Where
Regarding that Cul505 is equal to Cul504 with SW is equal to B, then:
3.1.4 Case of over-edge stitch type 512
The amount of sewing thread C512 needed for the 512 over-edge stitch, whose geometry is represented previously in Figure 2, is estimated by the following formula:
where Cn1 is the consumption of needle thread (n1), Cn2 is the consumption of needle thread (n2), Cul512 is the consumption of upper looper thread, and Cll512 is the consumption of lower looper thread (Figure 10).
Geometrical model of over-edge stitch type 514.
Where
3.1.5 Case of over-edge stitch type 514
The amount of sewing thread C514 needed for the 514 over-edge stitch, whose geometry is represented previously in Figure 2, is estimated by the following formula:
where Cn1 is the consumption of needle thread (n1), Cn2 is the consumption of needle thread (n2), Cul514 is the consumption of upper looper thread, and Cll514 is the consumption of lower looper thread (Figure 11).
Geometrical model of over-edge stitch type 515.
Where
3.1.6 Case of over-edge stitch type 515
Based on the geometrical representation (Figure 2), it concluded that the over-edge stitch type 515 is composed by the chain stitch type 401 and the over-edge stitch type 503, then the amount of sewing thread C515 needed for the 515 over-edge stitch is estimated by the following formula (Figure 12):
where
Geometrical model of over-edge stitch type 516
3.1.7 Case of over-edge stitch type 516
Regarding that the over-edge stitch type 516 is composed of the chain stitch type 401 and the over-edge stitch type 504 (Figure 4), then the amount of sewing thread C516 needed for the 516 over-edge stitch is estimated by the following formula:
To verify these models, 108 samples were prepared by varying the different factors for 503, 504, 516, and 514 over-edge stitches.
For both over-edge stitch types 503, 504, 514, and 516, the sewing machines type Siruba 503 M2-05, Siruba 504 M2-04, Siruba 514 M2-24, and Siruba 516 M2-35 over-edge stitch (speed: 2,000 rpm), respectively, =were used.
Table 3 presents the different factors and levels for each type of over-edge stitch point.
Different factors for each type of over-edge stitch
| Over-edge stitches | MT | SPC | d | B1 |
|---|---|---|---|---|
| 503 | * | * | * | * |
| 504 | * | * | * | * |
| 514 | * | * | * | * |
| 516 | * | * | * | * |
- *
Represents the existent parameter for each studied over-edge stitch type.
Table 4 presents the levels of each factor for preparing the samples of each type of over-edge stitch class 500.
Levels of each factor
| Input parameter | MT (cm) | SPC (stitches/cm) | d (cm) | B1 (cm) |
|---|---|---|---|---|
| Level 1 | 0,240 | 3 | 0.024 | 0.4 |
| Level 2 | 0,208 | 4 | 0.036 | 0.5 |
| Level 3 | 0,192 | 5 | – | |
| Level 4 | 0,180 | – | – | – |
| Level 5 | 0,170 | – | – | – |
| Level 6 | 0,150 | – | – | – |
–, no value of the parameter, which should be mentioned.
With B2 value is constant (equal to 0.2 cm) for 514 stitch.
The samples were prepared and a 10- cm seam length of each sample was investigated. Then, the seam was unstitched to get the needle(s) and looper(s) thread consumed in 5- cm length. After unstitching, the sewed thread length was determined to measure the value of the consumed thread per centimeter.
The average absolute relative error,
Table 5 presents the average error for each type of over-edge stitch class 500.
Average error
| Stitch | 516 | 503 | 504 | 514 |
|---|---|---|---|---|
|
|
3.45 | 3.06 | 2.09 | 3.32 |
The average absolute error does not exceed 3.45%. Thus, the result of testing thread consumption is widely verified. Regarding the findings, the error values are much lower than 6%. Thus, the studied models are well-justified and the findings are highly significant.
The experimental and theoretical values comparison showed a good agreement between geometrical and experimental consumption values. Indeed, the coefficient of regression ranged from 97.00 to 98.78% (Figure 13) reflects significant and efficient relationships between experimental and theoretical findings.
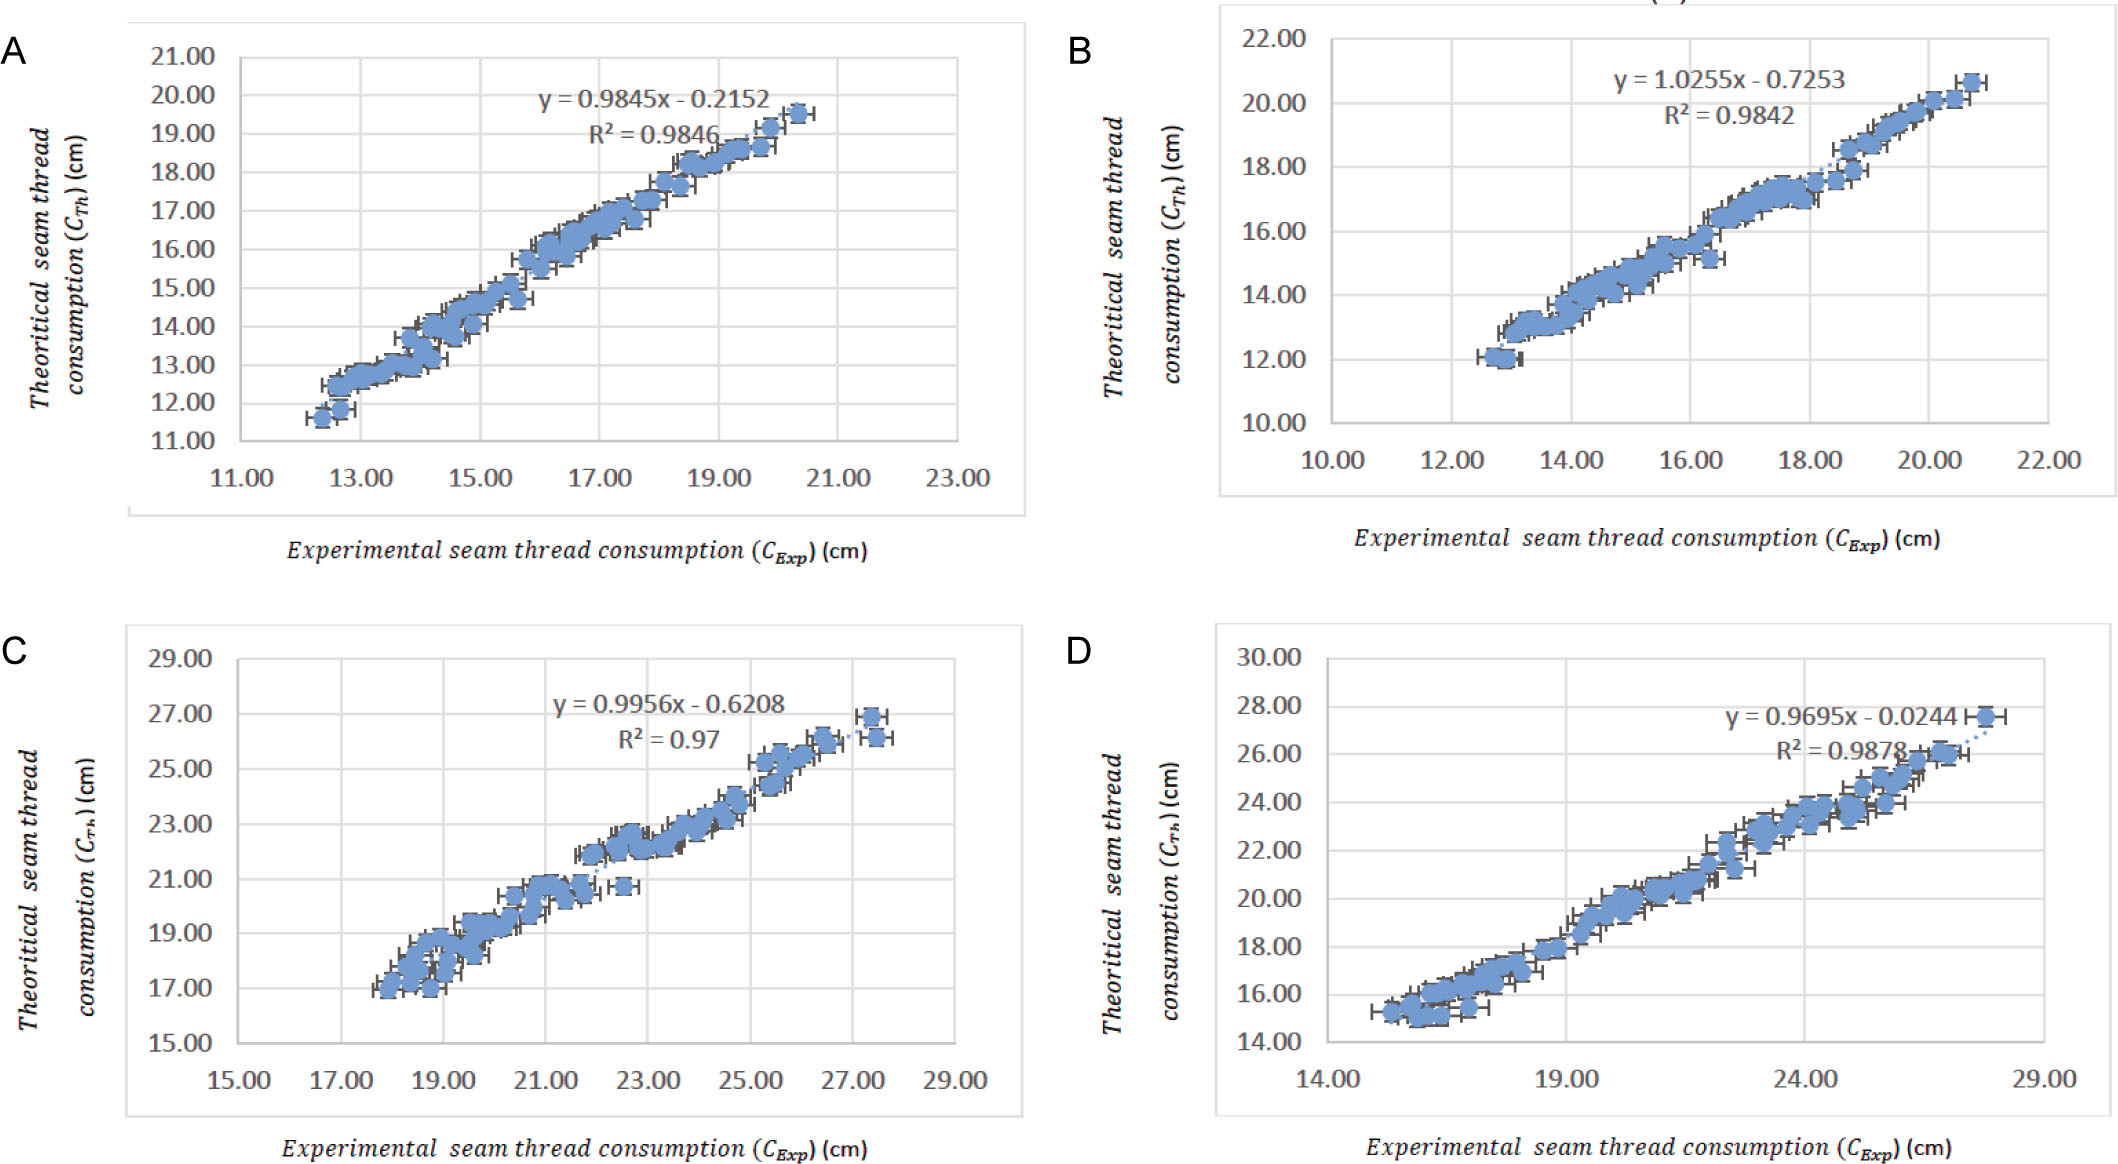
Theoretical consumption evolution as a function of experimental results for over-edge stitch type 503 (A), 504 (B), 516 (C), and 514 (D).
Comparisons between the theoretical and experimental consumption values for over-edge stitch types 503, 504, 516, and 514 are shown in Figure 13A–C. Experimental thread consumption (x-axis) is plotted against theoretical thread consumption (y-axis). Linear regression is applied and a line is fitted to the data. The R2 value of the fitted line is 98.46, 98.42, 97, and 98.78%, which means that the difference between the two data sets is very small. The high value of R2 verifies the model accuracy and depicts that the model has taken all the variables into account on which the thread consumption depends. This result is in a good agreement with Abher et al. [1] who concluded, using geometrical models, that the difference between the actual and predicted thread consumption, for 504 over-edge stitch, sets is very small (R2 value of the fitted line is 99.2%).
Regarding that, the error rate is very low and the regression coefficient values are very high (from 97.00 to 98.78%), it was concluded that the obtained geometrical models are fruitful and could be recommended for the prediction of thread consumption in the experimental design of interest.
As the results are well-verified and validated for the consumption of the stitch 503, 504, 514, and 516, we can validate the other over-edge stitches in this class, which are 501, 505, 512, and 515.
3.2 Multi-linear regression models
To help industrialists to use the best method to predict the consumed thread to sew denim garments, the multi-linear regression method was applied to compare its results with those obtained using the geometrical method.
Based on experimental design, a statistical method was applied to study the effect of each investigated input parameter and accurately estimate the suitable amount of thread based on different over-edge stitch types. Thanks to MINITAB-17 software, the multi-linear regression models were determined. Each input parameter's effects are analyzed. The studied input parameters and their levels are presented in Tables 3 and 4, respectively. The different models for over-edge stitches type 503, 504, 514, and 516 are considered as shown in Table 6.
Multi-linear regression models for different over-edge stitches class 500
| Equation | R2 (%) |
|---|---|
| 503 = −1.334 + 10.67MT + 2.3257SPC − 32.58d + 14.109 B1 | 98.46 |
| 504 = −3.656 + 12.02MT + 2.4193SPC - 17.20d + 18.009 B1 | 97.66 |
| 516 = −1.616 + 17.50MT + 2.8524SPC + 11.10d + 17.62 B1 | 96.44 |
| 514 = −7.042 + 19.17MT + 3.9666SPC + 62.87d + 13.070 B1 | 98.43 |
The value of the regression coefficient R2 reflects the significance and relevance of the developed models. Indeed, this coefficient of regression [Eq. (41)] ranged from 0 to 100%. The closer it is to 100%, the more significant the model is and vice versa [4]:
where SSerror is the portion of the variation, which is not explained by the model and is attributed to error. It was calculated according to the following equation:
SSerror is the portion explained by the multi-linear regression model. To calculate it, we used the formula given by the following equation:
SST is the sum of squared distances represents the total variation in the experimental data according to these relationships:
However, it is important to analyze the statistical analysis variance. Based on the p-value statistical coefficient, it is possible to evaluate the importance of different parameters. Indeed, three conditions are presented:
p-value is null: very significant parameter.
p-value is ranged from 0 to 0.05: significant parameter.
p-value is higher than 0.05: negligible parameter.
Table 7 presents the p-values for each multi-linear regression model.
p-value for each studied model.
| Parameter | MT | SPC | d | B1 |
|---|---|---|---|---|
| 503 model | 0.000 | 0.000 | 0.723 | 0.000 |
| 504 model | 0.000 | 0.000 | 0.010 | 0.000 |
| 516 model | 0.000 | 0.000 | 0.241 | 0.000 |
| 514 model | 0.000 | 0.000 | 0000 | 0.000 |
–, no value of parameter, which should be mentioned.
Each parameter having a p-value higher than 0.05 is neglected. As a consequence, referring to Table 8, all parameters are not neglected except the d parameter. Then, the multi-linear regression models presented in Table 8 are considered.
Multi-linear regression models for 503, 504, 516, and 514 over-edge stitches
| Equation | R2 (%) |
|---|---|
| 503 = −1.334 + 10.67MT + 2.3257SPC - 32.58d + 14.109 B1 | 98.46 |
| 504 = −3.656 + 12.02MT + 2.4193SPC - 17.20d + 18.009 B1 | 97.66 |
| 516 = −1.287 + 17.50MT + 2.8524SPC + 17.62 B1 | 96.47 |
| 514 = −7.042 + 19.17MT + 3.9666SPC + 62.87d + 13.070 B1 | 98.43 |
Considering the range of R2 values obtained (from 96.47 to 98.46%), it may be recognized as reliable and significant. Therefore, this range of R2 shows the effectiveness of the statistical method to determine the suitable consumption value. Moreover, to predict consumed thread using multi-linear regression models, industrialists can use statistical results for the estimation of the consumed amount. Nevertheless, compared to the geometrical modeling technique, the statistical method remained less accurate, less powerful, and less predictable regarding its range of R2 (from 97.00 to 98.78% and from 96.47 to 98.46%, for geometrical and statistical models, respectively). In fact, from a point of view of mathematical modeling, the geometrical method takes into account some hypotheses and assumptions, such as considering sewing thread section circular, fabric incompressible, the width of stitch constant, and threads incompressible, and makes the calculation of consumed thread more precise and independent of parameters considered in the statistical technique variables and interacting with each other. Regarding regressive and geometrical methods, the geometrical technique is found more effective than the regressive method and fitted the experimental results widely. This difference can be explained by the hypothesis used to simplify the determination of an approximate consumption value. The developed geometrical models allow a fruitful prediction of the consumed thread amount for the experimental design of interest. Indeed, the calculation of the sewing thread consumption based on different input parameters generates some errors during stitching and unstitching thread, explaining the range of the coefficient of regression from 96.47 to 98.46%. Hence, all measures can be subject to error taking into account wastage, reproducibility of unstitching steps, etc. For these reasons, the geometric modeling technique gives more accurate results than the statistical one. These findings seem in good agreement with those in the literature [1, 9].
3.3 Effects of input parameters
After determining the regression models, we determined the effect of each input parameter. Figure 14 presents the influence of fabric thickness, stitch density, yarn linear density, and the stitch width for the different studied stitches (503, 504, 514, and 516).
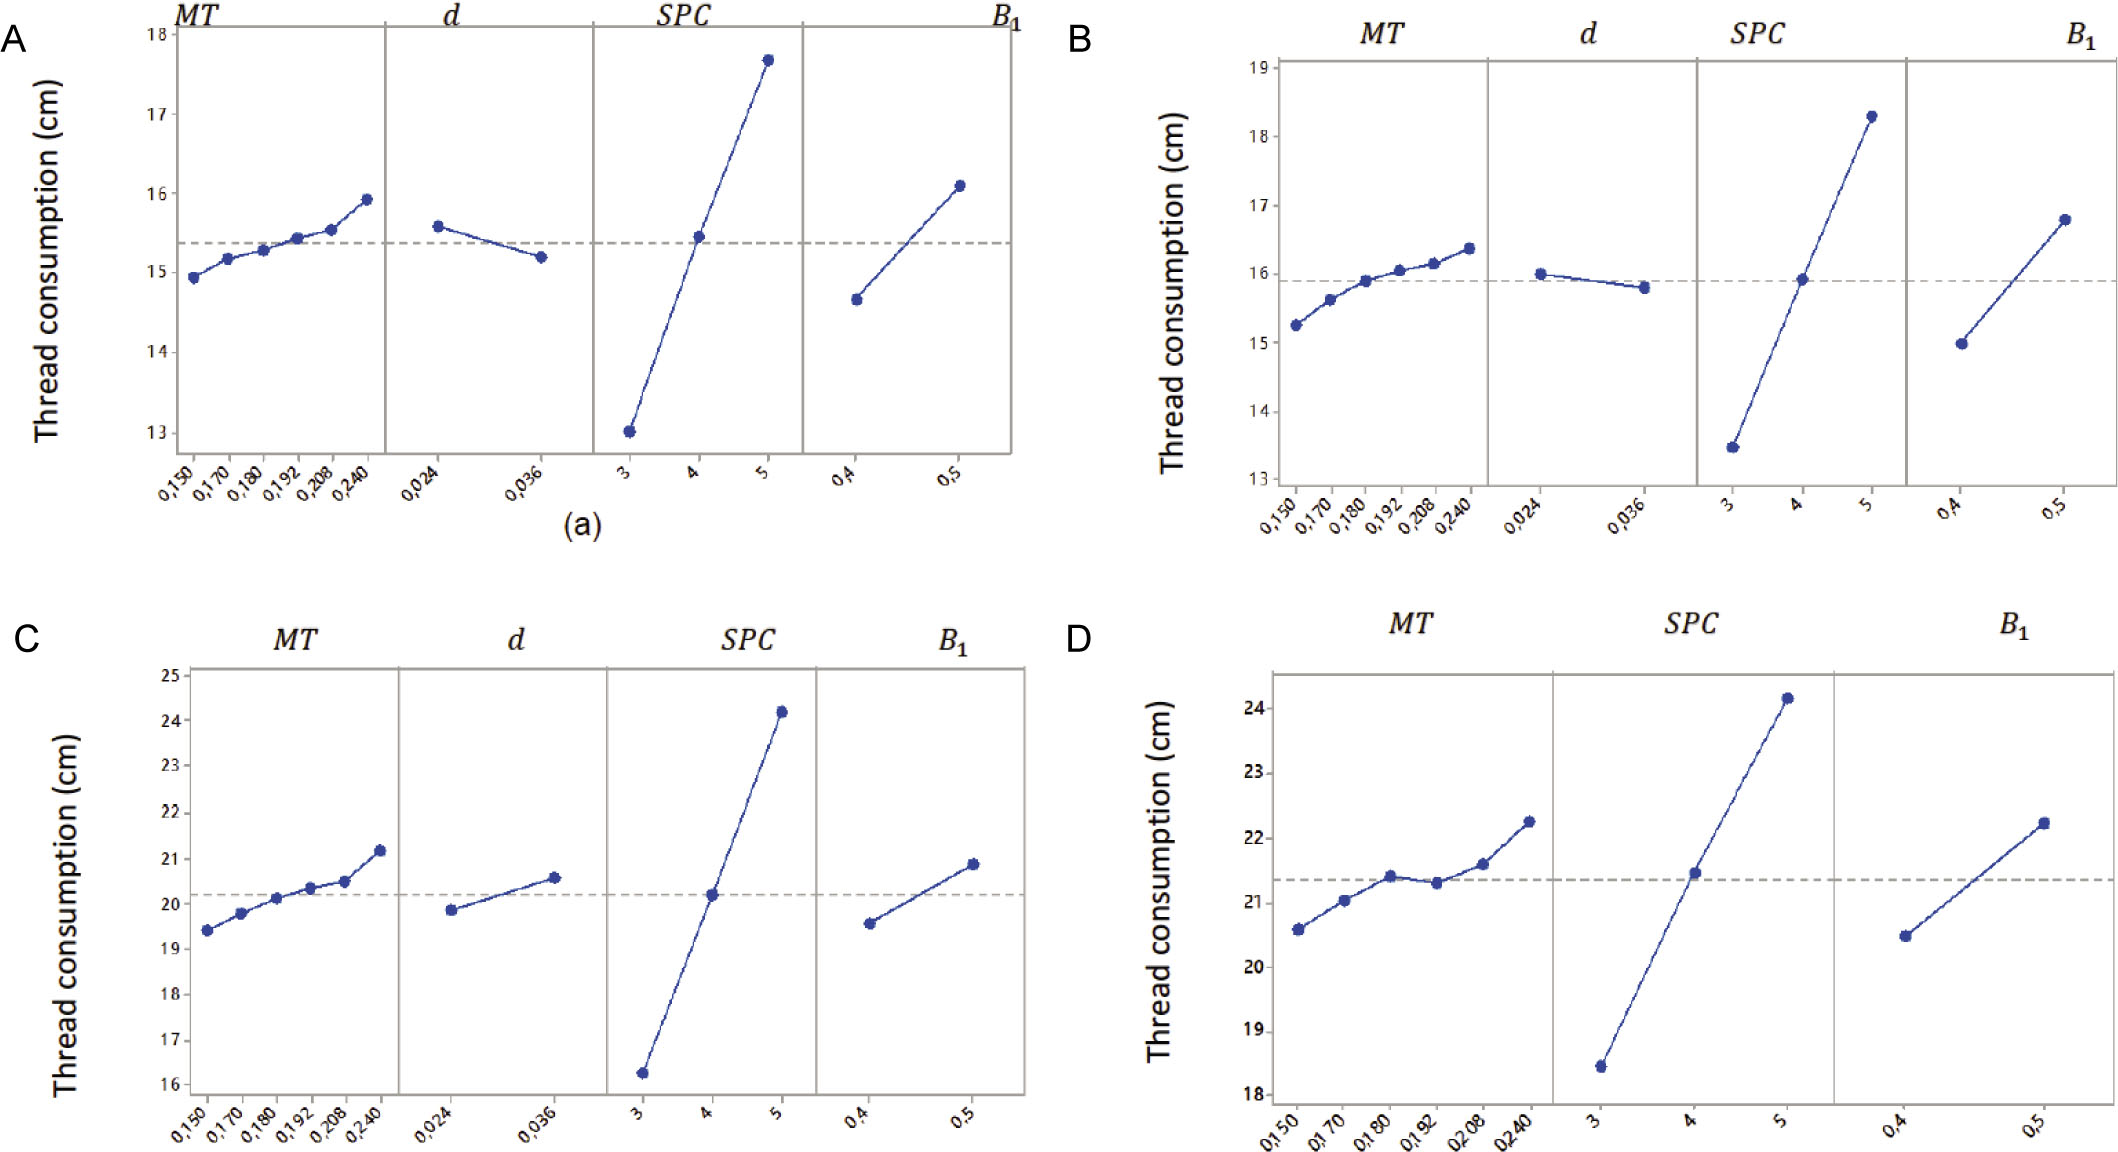
Effects of input parameters for over-edge stitch types 503 (A), 504 (B), 514 (C), and 516 (D).
3.3.1 Material thickness (MT) effect
Based on Figure 14A–D, it is notable that the increase of fabric thickness from 0.150 to 0.240 mm increases thread consumption by 6.63, 7.27, 9.01, and 8.16% for 503, 504, 514 and 516 over-edge stitches, respectively. Thus, fabric thickness does not have a very important effect, but it remains an influential factor influencing thread consumption. In fact, the increase in fabric thickness increases thread consumption for the three studied over-edge stitches. In addition, the increase in fabric thickness increases seam thickness as well as thread consumption. Thus, less thick fabric requires less thread, but thicker fabric requires more thread. This result is confirmed by Jaouachi and Abher's finding that consumption values increase with the increase of fabric thickness. This means that the thickness of fabric samples affects the consumed thread [4, 9]. This finding is also in accordance with the findings of other researchers [24, 25]. Besides, according to Jaouachi, a heavy fabric consumes more sewing thread than an average fabric. This consumption is estimated for heavy fabrics, which are thicker than the average fabrics [24]. Sharma et al. [13] proved that fabric thickness has the most important influence in seam consumption because the fabric thickness has a very large range (from 1.64 to 6.56 mm). However, Abher et al. [1] concluded that the contribution ratio of material thickness was around just 38%.
3.3.2 Yarn diameter effect
According to Figure 14A–C, Yarn linear density is not an important impact on thread consumption. Indeed, it has no impact on thread consumption of 516 over-edge stitch. Also, the increase of yarn diameter from 0.024 to 0.036 cm (relative to increase of yarn linear density from 63.5 to 95 tex) decreases thread consumption by 2.5 and 1.19% for 503 and 504 over-edge stitches, respectively, and increase by 3.73% for 514 over-edge stitch. This result is not in a good agreement with Jaouachi results [22]. In addition, if 100% PES thread composition is used instead of 100% cotton yarn, thread consumption becomes much less significant. In fact, in the case of polyester thread composition, the increase in its linear density does not have an important effect on thread consumption. This may be related to the close values of linear densities used by Jaouachi (equal to 16.5 and 16.67 tex). So, this result is in accordance with the properties of each thread.
3.3.3 Stitch density (SPC) effect
Referring to Figure 14A–D, stitch density seems an important parameter. In fact, the increase of stitch density from 3 to 5 stitches/cm increases the thread consumption percentage of 53.71, 35.93, 48.77, and 30.86% for 503, 504, 514, and 516 over-edge stitches, respectively. Thus, the increase in stitch density increases thread consumption. Besides, the increase in the consumed amount of sewing thread results from the increase in interlacing zone numbers inside assembled fabric layers. This result is in accordance with the findings of Jaouachi, Kennon, Hayes, and Abher [9, 24, 26, 27] and confirms our finding that with the fabric feed in motion, the thread is required to form the upper and lower lengths during stitch length modification. Moreover, this result is in good agreement with the findings of Lauriol's study [12] which proves that if the sewing length decreases from 2.5 to 2 mm (4–5 stitches/cm), thread consumption increases, approximately, by 10%. According to Sharma et al.'s [13] study, the stitch density presents the second most influential parameter on-seam thread consumption because the stitch density has a small range (from 2 to 3.5 stitches/cm).
Abher calculated the contribution ratio percentage and concluded that the contribution ratio of stitch density was around 62%. In his case, stitch density has more impact because stitch class 504 is made up of three different threads forming chain shape. Each thread has its own path but the path of lopper thread is very curvy, therefore, a little increase in stitch density contributes significantly toward the total thread consumption [1].
3.3.4 Seam width (B1) effect
According to Figure 14A–D for 503, 504, 514, and 516 over-edge stitches, stitch width is an important parameter. The increase in the seam width value (B1) increases thread consumption. In fact, increasing B1 from 4 to 5 mm, increased thread consumption by 9.61, 12.07, 5.67, and 10.10% for 503, 504, 514, and 516 Over edge stitches, respectively. In our case, the increase percentage value is not very important because the difference between two-width levels is not very important, which can explain the low impact of this parameter. This is because the increase in sewing width increases the stitch length. This result is confirmed by Goldnfiber who reported that a higher width of seam requires more thread to sew the garments [28].
4 Conclusion
This work deals with the prediction of the required amount of sewing thread using denim samples and over-edge stitch class 500 using more than three significant input parameters and studying their effects through two methods: mathematical (geometrical technique) and statistical (multi-linear regressive technique) methods. Comparing the results showed the accuracy of the geometrical modeling method to explain the consumption behavior in each over-edge stitch shape for class 500.
In fact, using statistical analysis, multi-linear regression models were obtained and investigated. Their corresponding R2 values ranged from 96.47 to 98.46% have shown their accuracy. Nevertheless, using the geometrical modeling technique, the R2 values (R2 ranged from 97.00 to 98.78%) seem more significant than those given by the statistical method. This superiority encourages industrialists to apply the geometrical models for thread consumption prediction based on the over-edge stitch geometry class 500.
This proposed methodology remains valid for denim fabrics and other types of fabric with characteristics similar to those of denim. For other fabric types, it was necessary to ensure the validity of these models because for the knitted fabric, for example, having extensibility and deformability character, other parameters must be integrated, such as thread tension, compressibility, and elongation behavior, which also has a notable influence on the sewing thread consumption. Hence, these input parameters must be included such influential factors.
Notwithstanding, to select the input parameters that are most influential on the consumption behavior, a classification of the significance using Minitab Software is applied.
The increase in each parameter increases the seam thread consumption, except in the case of the seam thread diameter that has a very low impact. The parameter that is most influential on the increase in thread consumption is the stitch density. The material thickness and seam width, in the range has been studied, have the lowest impact on thread consumption values. Stitch density has more impact because stitches of class 500 are made by using 1, 2, 3, 4, or 5 different threads. Each thread has its own path but the path of lopper thread is very curvy; therefore, a little increase in stitch density contributes significantly toward the total thread consumption. Also, the increase in stitch width influences the seam thread consumption because it has the same impact of increasing stitch density.
To conclude, the proposed models can accurately predict the thread consumption based on the over-edge stitch class 500 thanks to developed geometrical relationships. Therefore, it can be used to better estimate the required thread. Further work follows.
List of abbreviations
- n
needle threads
- n1
first needle in front of the cutter
- n2
second needle after the cutter
- ul
upper looper thread
- ll
lower looper thread
- L
sewing length
- MT
material thickness
- SPC
stitch density expressed by stitch number/cm
- SL
stitch length
- d
sewing thread diameter
- Sw
sewing width
- B1
distance between the needle 1 (n1) and the cutter expressed in cm
- B2
distance between needle 1 (n1) and needle 2 (n2) expressed in cm
- Tex
yarn linear density
- C501
thread consumption per centimeter of over-edge stitch type 501
- C503
thread consumption per centimeter of over-edge stitch type 503
- C504
thread consumption per centimeter of over-edge stitch type 504
- C505
thread consumption per centimeter of over-edge stitch type 505
- C504
thread consumption per centimeter of over-edge stitch type 504
- C512
thread consumption per centimeter of over-edge stitch type 512
- C514
thread consumption per centimeter of over-edge stitch type 514
- C515
thread consumption per centimeter of over-edge stitch type 515
- C516
thread consumption per centimeter of over-edge stitch type 516
- CTh
theoretical value of thread consumption
- CExp
experimental value of thread consumption
-
vector of the expected values of the response
- vi
vector of the observed values of the response
- v̅
average value of the answer
References
[1] Abher, R., Sheraz, A., Nauman, A., Ateeq, R., Muhammad, B. R., et al. (2018). Geometrical model to calculate the consumption of sewing thread for 504 over-edge stitch. The Journal of the Textile Institute, 109(11), 1418–1423.10.1080/00405000.2018.1423902Search in Google Scholar
[2] Doustar, K., Najar, S. S., Maroufi, M. (2010). The effect of fabric design and weft density on bagging behavior of cotton woven fabrics. The Journal of the Textile Institute, 101, 135–142.10.1080/00405000802309584Search in Google Scholar
[3] Taylor, P. M., Pollet, D. M. (2000). The low-force frictional characteristics of fabrics against engineering surfaces. The Journal of the Textile Institute, 91, 1–15.10.1080/00405000008659482Search in Google Scholar
[4] Jaouachi, B., Aouine, S., Khedher, F. (2017). Consumed sewing thread behaviour based on Lockstitch and chain stitch. Indian Journal of Fibre and Textile Research, 42, 325–334.Search in Google Scholar
[5] Khedher, F., Jaouachi, B. (2014). Waste factor evaluation using theoretical and experimental jean pants consumptions. The Journal of the Textile Institute, 106, 402–408.10.1080/00405000.2014.924225Search in Google Scholar
[6] Amirbayat, J. (1990). An energy approach to the instability problem of overfed seams: part 1: theoretical analysis. International Journal of Clothing Science and Technology, 2, 21–25.10.1108/eb002956Search in Google Scholar
[7] Amirbayat, J., Alagha, M. J. (1993). Further studies on balance and thread consumptions of lock-stitch seams. International Journal of Clothing Science and Technology, 5, 26–31.10.1108/eb003014Search in Google Scholar
[8] Jana, P. (2011). Assembling technologies for functional garments—an overview. Indian Journal of Fibre Textile Research, 36, 380–387.Search in Google Scholar
[9] Abher, R., Sheraz, A., Mohsin, M., Faheem, A., Ali, A. (2014). Geometrical model to calculate the consumption of sewing thread for 301 Lockstitch. The Journal of the Textile Institute, 105, 1259–1264.10.1080/00405000.2014.886366Search in Google Scholar
[10] Stylios, G., Sotomi, J. O. (1996). Thinking sewing machines for intelligent garment manufacture. International Journal of Clothing Science and Technology, 8, 44–55.10.1108/09556229610109609Search in Google Scholar
[11] Webster, J., Laing, R. M., Niven, B. E. (1998). Effects of repeated extension and recovery on selected physical properties of ISO-301 stitched seams, part I: load at maximum extension and at break. Textile Research Journal, 68(11), 854–864.10.1177/004051759806801111Search in Google Scholar
[12] Lauriol, A. (1999). Modes and techniques: initiation to the technology of materials in the clothing industries. (2nd ed.). Strasbourg (France).Search in Google Scholar
[13] Sharma, S., Gupta, V., Midha, V. K. (2017). Predicting sewing thread consumption for chain stitch using regression model. Journal of Textile Science and Engineering, 7, ISSN 2165-8064.10.4172/2165-8064.1000295Search in Google Scholar
[14] VIinay, K. M., Shailja, S., Vaibhav, G. (2016). Predicting sewing thread consumption for lockstitch using regression model. Research Journal of Textile and Apparel, 20, 155–163.10.1108/RJTA-08-2016-0019Search in Google Scholar
[15] Jaouachi, B., Khedher, F. (2015). Evaluation of sewed thread consumption of jean trousers using neural network and regression methods. Fibres & Textiles in Eastern Europe, 111, 91–96.10.5604/12303666.1152518Search in Google Scholar
[16] Jaouachi, B., Khedher, F. (2013). Evaluating sewing thread consumption of jean pants using fuzzy and regression methods. The Journal of the Textile Institute, 104, 1065–1070.10.1080/00405000.2013.773627Search in Google Scholar
[17] Ghosh, S., Md. Vaseem Chavhan. (2014). A geometrical model of stitch length for lockstitch seam. Indian Journal of Fibre & Textile Research. 39(2), 153–156.Search in Google Scholar
[18] Jaouadi, M., Msahli, S., Babay, A., Zitouni, B. (2006). Analysis of the modeling methodologies for predicting the sewing thread consumption. International Journal of Clothing Science and Technology, 18, 7–18.10.1108/09556220610637477Search in Google Scholar
[19] Midha, V. K., Sharma, S., Gupta, V. (2016). Predicting sewing thread consumption for lockstitch using regression model. Research Journal of Textile and Apparel, 20(3), 155–163.10.1108/RJTA-08-2016-0019Search in Google Scholar
[20] Gazzeh, M., Khedher, F., Jaouachi, B. (2017). Modelling the sewing thread consumption of 602 cover-stitch based on its geometrical shape. International Journal of Applied Research on Textile, 5, 1–15.Search in Google Scholar
[21] NFG 07-117. (1981). Method of assessing of fabric threads slippage and measurement of the seam resistance. French Association for Standardization AFNOR. 201–209.Search in Google Scholar
[22] Md Sohanur Rahman Sobuj. (2015). Relation between yarn count and diameter & count calculation for ply yarn. Web site: https://textilestudycenter.com/relation-between-yarn-count-and-diameter/. (27 February 2015).Search in Google Scholar
[23] Gazzeh, M. (2015). Study of the effect of wire/wire friction on the behavior of Denim tissue poaching. PhD thesis in Textile Engineering, University of Monastir. Tunisia.Search in Google Scholar
[24] Jaouachi, B., Khedher, F., Mili, F. (2012). Consumption of the sewing thread of jean pant using Taguchi design analysis. Autex Research Journal, 12, 81–86.10.2478/v10304-012-0015-7Search in Google Scholar
[25] O’Dwyer, U., Munden, D. L. (1975). A study of the chain stitch seam. Part 2. The extension at break of chain stitch seams under longitudinal loading conditions. Clothing and Textiles Research Journal, 3, 33–40.Search in Google Scholar
[26] Kennon, W. R., Hayes, S. G. (2000). The effects of feed retardation on chain stitch sewing. Journal of the Textile Institute, 91, 509–522.10.1080/00405000008659124Search in Google Scholar
[27] Hayes, S. G. (2001). The effects of check-spring travel on chain stitch sewing. Research Journal of Textile and Apparel, 5, 54–64.10.1108/RJTA-05-02-2001-B006Search in Google Scholar
[28] Goldnfiber. (2018). Major factors for doing sewing thread consumption. Web site: http://www.goldnfiber.com/2016/07/major-factors-for-doing-sewing-thread-consumption.html.Search in Google Scholar
© 2021 Malek Sarah et al., published by Sciendo
This work is licensed under the Creative Commons Attribution 4.0 International License.
Articles in the same Issue
- Defect Detection of Printed Fabric Based on RGBAAM and Image Pyramid
- Hydrophilization of Polyester Textiles by Nonthermal Plasma
- Prediction of Sewing Thread Consumption for Over-Edge Stitches Class 500 Using Geometrical and Multi-Linear Regression Models
- Experimental Investigation of the Properties of Laminated Nonwovens Used for Packaging of Powders in Mineral Warmers
- An Approach to Estimate Dye Concentration of Domestic Washing Machine Wastewater
- Moisture and Thermal Transport Properties of Different Polyester Warp-Knitted Spacer Fabric for Protective Application
- Quick Detection of Aldehydes and Ketones in Automotive Textiles
- Identification of Miao Embroidery in Southeast Guizhou Province of China Based on Convolution Neural Network
- Effect of Temperature on the Structure and Filtration Performance of Polypropylene Melt-Blown Nonwovens
- Analysis of Mechanical Properties of Unidirectional Flax Roving and Sateen Weave Woven Fabric-Reinforced Composites
- Development of Mask Design Knowledge Base Based on Sensory Evaluation and Fuzzy Logic
- Preparation of Polypyrrole/Silver Conductive Polyester Fabric by UV Exposure
- A New Approach for Thermal Resistance Prediction of Different Composition Plain Socks in Wet State (Part 2)
- Analyzing Thermophysiological Comfort and Moisture Management Behavior of Cotton Denim Fabrics
- Comparison of the Effects of the Cationization of Raw, Bio- and Alkali-Scoured Cotton Knitted Fabric with Different Surface Charge Density