Kansei Engineering as a Tool for the Design of Traditional Pattern
-
Daoling Chen
 ,
Pengpeng Cheng
,
Pengpeng Cheng

Abstract
Traditional patterns are widely used in the modern design due to their long history, rich connotation, and beautiful form. However, the current application of traditional patterns in the modern design is mostly based on the designer's subjective preferences, not from the perspective of consumers, to explore their feelings about traditional patterns, and which design factors have an impact on consumers, which is the main reason why modern applications of traditional patterns cannot meet the esthetic needs of modern consumers. Therefore, to make better inheritance of the traditional pattern and meet the needs of contemporary consumers, this article takes the caisson lotus pattern of Mogao Cave in the Tang dynasty as an example and first, using the theory of Kansei engineering to investigate the perceptual cognition of the young consumers aged 20–35 years old on the lotus pattern, then use SPSS 24.0 software to analyze the perceptual evaluation data, find the design element combination code corresponding to the perceptual vocabulary, and establish a mathematical model that can predict consumers’ emotional imagery of the lotus pattern of the caisson in the Tang dynasty. Through the verification of the model, the test results show that the model has a high degree of credibility; designers can use this model to quickly evaluate and redesign the lotus pattern to better meet the needs of modern consumers. At the same time, the method of this paper can also be applied to other design fields with user-centered concerns.
1 Introduction
The caisson lotus pattern of the Mogao Caves in the Tang dynasty is exquisite in shape, rich in patterns, and beautiful in color. It is the pearl of the Dunhuang pattern. Applying the classical decorative art of the Dunhuang caisson lotus pattern in the Tang dynasty to modern design and to make the past serve the present, it can not only carry forward the national traditional culture but also broaden the new ideas of modern design. At present, the field of modern application research on Mogao Cave pattern is like other traditional patterns, and it mainly discusses the application status; application value and application methods of caisson pattern; and color in modern design, modern home textile design, and so on [1,2,3]. However, the above application of the caisson pattern in the Tang dynasty in modern design is mainly based on the subjective preferences of the researchers to redesign the pattern, without discussing the perceptual evaluation of modern consumers on the lotus pattern. In the 21st century, where science and technology and the social economy are highly developed, people's consumption concepts are undergoing tremendous changes: consumer demand has changed from quantitative consumption to qualitative consumption and then transition to today's “sensible consumption” [4]. Perceptual imagery is the feeling that people hold on things, the psychological expectation of things, and a highly concentrated deep emotional activity [5]. People receive information about the product design elements (morphology, texture, color, etc.) through visual, tactile, and listening systems to generate cognitive images of design products in their minds. Perceptual imagery is not a sensory response produced by a certain sensory organ alone, but a psychological emotion generated by a combination of multiple sensory organs, which has a direct and important impact on people's consumption choices and product evaluation [6]. However, for a long time, consumers’ perception and evaluation of products involve complex psychological factors, full of ambiguity, and uncertainty; therefore, the extraction of the regular of consumer perception has always been a difficult problem. In the face of current consumption trends and research needs, the Kansei engineering method can provide an effective cognitive approach to product modeling, pattern design, and esthetic evaluation of fabrics [7].
Kansei engineering emerged in Japan in the 1970s; it is a method to explore the relation between human sensibility and product design of function, an appearance using engineering techniques [8], and try to translate emotions into measurable and physical design specifications [9]. So far, this kind of theory has been successfully used in the product design [10,11,12], architectural design, and design of a webpage [13,14], and it has also achieved great success in fashion design [15,16] and so on.
In recent years, the research on Kansei engineering in pattern design has become more and more perfect, but the coverage is still not comprehensive enough. According to the change of the angle, thickness, and curvature of the stripe, Shi and Zhu [17] found that the different stripe distributions have different quadrants. This quadrant can quantify and intuitively reflect the emotional relation between the stripe design elements and the knitwear style. Wang and Liu [18] used the semantic difference method to conduct an expert survey on the characteristic elements of the pattern of the grid pattern, the thickness of the lines, and the intensity of the color contrast. The relation between the emotional demand of the consumer and the characteristic elements of the grid pattern was found. The results could provide references for design of the lattice products to meet consumer emotional demand. Application effect of blue and white patterns of Ming dynasty on cheongsam was discussed; after factor analysis of the perceptual words, Gu and Wang [19] obtained three factors, such as the appearance personality factor, temperament factor, and vitality factor and constructed a relation diagram of 18 cheongsams and three factors, in which the hidden effect and effect of different blue and white flowers on the visual effect of cheongsam can be clearly judged.
Although the above is very rich in the application of Kansei engineering, few researchers have explored how modern consumers feel about traditional patterns and which design elements influence consumer perception. However, this plays a vital role in the modern application of traditional patterns to meet the needs of modern consumers. Therefore, the purpose of this paper is to use Kansei engineering and SPSS 24.0 software to explore the mapping relation between design elements of the caisson lotus pattern in the Tang dynasty and consumers’ perceptual images, clearly identify the combination of design elements corresponding to the consumer's emotional intentions, and establish regression model to predict the consumer's emotional image of the caisson lotus pattern in the Tang dynasty.
2 Experimental methods
2.1 Screening of lotus pattern in Mogao Cave of the Tang dynasty
The Tang dynasty is the golden age of the development of Dunhuang mural art; plants as the main decorative patterns in the Tang dynasty also began to perfect [20,21,22,23]. A large number of algae lotus patterns were collected through literature review and field research methods, and five Dunhuang cultural research and design-related experts were invited to screen the patterns, remove similar lotus patterns, and retain the different patterns. Finally, 14 lotus patterns were selected as shown in Figure 1.

Representative lotus pattern sample in the caisson of the Mogao Grottoes in the Tang dynasty.
2.2 Deconstruction of lotus pattern design elements
Through expert interviews and focus group discussions and referring to relevant research methods, a comprehensive analysis of 14 caisson lotus samples was carried out. The algae lotus pattern was disassembled into five design elements, such as the lotus center structure, the petal shape, the combination of the flower heart and the outer petals, the combination of the outer petals, and the position of other decorations. To further refine the design and obtain more accurate conclusions, these five design elements are subdivided into various form items. For example, the structure of the lotus center is divided into cross type, 米 type, and mission type. Petal morphology is divided into flat petal, curl petal, moiré petal + flat petal, moiré petal + peach-shaped petal, moiré petal + hook petal + peach-shaped petal, flat petal + hook petal + moiré petal, curl petal + hook petal + moiré petal, and flat petal + peach-shaped petal + moiré petal + hook petal. The combination of the flower heart and the outer petals is divided into three forms, such as the flower heart connected to the outer flower petals, the flower heart separated from the outer flower petals, and the single layer petal. The combination of petals is divided into no outer layer, multiple layers closely connected, and multiple layers sparsely connected. The position of the decoration is divided into the flower heart, around the lotus, no decoration, and the flower heart + around the lotus. The deconstruction of the lotus pattern design elements is shown in Table 1.
Lotus pattern design elements and numbers
| Design elements | Form items and numbers | ||||||||
|---|---|---|---|---|---|---|---|---|---|
| The lotus center structure | Form items | Cross type | 米 type | Mission type | |||||
| Numbers | 11 | 12 | 13 | ||||||
| Petal shape | Form items | Flat petal | Curl petal | Moiré petal + flat petal | Moiré petal + peach-shaped petal | Moiré petal + hook petal + peach-shaped petal | Flat petal + hook petal + moiré petal | Curl petal + hook petal + moiré petal | Flat petal + peach-shaped petal + moiré petal + hook petal |
| Numbers | 21 | 22 | 23 | 24 | 25 | 26 | 27 | 28 | |
| The combination of the flower heart and the outer petals | Form items | Connected | Separated | Single layer petal | |||||
| Numbers | 31 | 32 | 33 | ||||||
| The combination of the outer petals | Form items | No outer layer | Closely connected | Sparsely connected | |||||
| Numbers | 41 | 42 | 43 | ||||||
| The position of decorations | Form items | Flower heart | Around the lotus | No decoration | Flower heart + around the lotus | ||||
| Numbers | 51 | 52 | 53 | 54 | |||||
2.3 Perceptual evaluation experiment
Through extensive collection of pattern perceptual adjectives in magazines, books, research literature, and other materials related to patterns and then inquiry and survey in a small range, invite five design-related professionals to select adjectives that appropriately describe the pattern features from the collected adjectives, and to remove overlapping and inappropriate adjectives, 7 pairs of perceptual adjectives were selected from the 40 pairs, which are lively–dull, simple–complex, neat–disordered, tight–loose, cabinet–atmospheric, move–static, and unique–ordinary.
This study used the semantic difference method to conduct evaluation experiments. The selected lotus pattern samples and perceptual adjectives are combined using a Likert 5 scale. If we take the perceptual adjective “living–dull” as an example, 1 point is very lively, 2 points are a bit lively, 3 points are neither lively nor dull, 4 points are a bit dull, and 5 points are very dull.
2.4 Data processing and analysis
The results were processed and analyzed using mean value processing and correlation analysis, multiple linear regression analysis, and other mathematical methods in SPSS 24.0 software.
3 Results and discussion
3.1 Data processing of perceptual evaluation of caisson lotus pattern in Mogao Caves of the Tang dynasty
In this survey, online questionnaires were distributed to young consumers aged between 20 and 35 years. A total of 60 questionnaires were sent out. A total of 57 valid questionnaires were returned, and the recovery rate was 95%. The results of 57 surveys were processed by Excel software, and the mean value of each sample under each perceptual vocabulary was obtained as shown in Table 2.
Caisson lotus pattern perceptual evaluation results
| Sample number | Lively–Dull | Simple–Complex | Neat–Disordered | Tight–Loose | Cabinet–Atmospheric | Move–Static | Unique–Ordinary |
|---|---|---|---|---|---|---|---|
| 1 | 2.79 | 3.5 | 2.43 | 2.93 | 3.21 | 3.57 | 2.86 |
| 2 | 2.07 | 4.07 | 2.93 | 2.36 | 3.43 | 2.5 | 2.57 |
| 3 | 2.36 | 3.71 | 2.71 | 2.86 | 3.64 | 2.29 | 2.36 |
| 4 | 1.71 | 4.07 | 2.79 | 2.43 | 3.71 | 1.93 | 2.14 |
| 5 | 3 | 3.79 | 2.5 | 2.5 | 3.07 | 3.36 | 3.21 |
| 6 | 2.79 | 3.29 | 2.57 | 2.71 | 3.5 | 2.71 | 2.93 |
| 7 | 3 | 3.14 | 2.29 | 2.57 | 3.21 | 3.36 | 3.07 |
| 8 | 2.57 | 3.14 | 3.14 | 3.5 | 2.86 | 2.43 | 2.71 |
| 9 | 2.57 | 4.29 | 2.86 | 1.79 | 4 | 2.86 | 2.43 |
| 10 | 3.07 | 2.71 | 3.07 | 2.93 | 2.64 | 3.5 | 3.5 |
| 11 | 2.93 | 4.5 | 2.79 | 2 | 4.29 | 3.07 | 2.21 |
| 12 | 3 | 3.86 | 2.64 | 3 | 3.86 | 3 | 2.71 |
| 13 | 2.43 | 3.57 | 2.64 | 3.21 | 3.14 | 2.43 | 2.21 |
| 14 | 3.57 | 2 | 2.29 | 3.43 | 3.14 | 3.07 | 3.21 |
To further analyze the main feelings of each lotus pattern and the differences between them, the highest and lowest scores of each lotus pattern are listed in Table 3.
The main feelings of each lotus pattern
| Sample number | Main feelings |
|---|---|
| 1 | Neat (2.43) Static (3.57) |
| 2 | Lively (2.07) Complex (4.07) |
| 3 | Move (2.29) Complex (3.71) |
| 4 | Lively (1.71) Complex (4.07) |
| 5 | Neat (2.5) Tight (2.5) Complex (3.79) |
| 6 | Neat (2.57) Atmospheric (3.5) |
| 7 | Neat (2.29) Static (3.36) |
| 8 | Move (2.43) Loose (3.5) |
| 9 | Tight (1.79) Complex (4.29) |
| 10 | Cabinet (2.64) Static (3.5) Ordinary (3.5) |
| 11 | Tight (2) Complex (4.5) |
| 12 | Neat (2.64) Complex (3.86) Atmospheric (3.86) |
| 13 | Unique (2.21) Complex (3.57) |
| 14 | Simple (2) Dull (3.57) |
As can be seen from the Table 3, samples 1, 5, 6, 7, and 12 have a neat feeling; samples 1, 7, and 10 have a static feeling; samples 2 and 4 have a lively feeling; samples 2, 3, 4, 5, 9, 11, 12, and 13 have a complex feeling; samples 3 and 8 have a feeling of movement; samples 5, 9, and 11 have a tight feeling; samples 6 and 12 have an atmospheric feeling; sample 8 has a loose feeling; sample 10 has a cabinet and ordinary feeling; sample 13 has a unique feel; and sample 14 has a simple and dull feel. At the same time, all the samples in Table 3 did not show the feeling of disordered. In Table 2, the samples with disordered feelings were 8 and 10, the scores were 3.14 and 3.07, and the scores were lower. It can be said that all the samples have almost not disordered.
Correlation between perceptual vocabulary and design elements
| The lotus center structure | Petal shape | The combination of the flower heart and the outer petals | The combination of the outer petals | The position of decorations | ||
|---|---|---|---|---|---|---|
| Lively–Dull | Pearson correlation | −0.031 | −0.568* | 0.381 | −0.062 | 0.118 |
| Significant (two tailed) | 0.917 | 0.035 | 0.130 | 0.834 | 0.688 | |
| Simple–Complex | Pearson correlation | −0.092 | 0.711** | 0.193 | −0.304 | 0.380 |
| Significant (two tailed) | 0.755 | 0.004 | 0.509 | 0.184 | 0.132 | |
| Neat–Disordered | Pearson correlation | 0.450 | 0.367 | −0.590* | 0.391 | −0.163 |
| Significant (two tailed) | 0.088 | 0.156 | 0.026 | 0.112 | 0.578 | |
| Tight–Loose | Pearson correlation | −0.154 | −0.691** | 0.469 | −0.342 | −0.216 |
| Significant (two tailed) | 0.600 | 0.006 | 0.152 | 0.228 | 0.339 | |
| Cabinet–Atmospheric | Pearson correlation | 0.148 | 0.642* | 0.339 | 0.034 | 0.168 |
| Significant (two tailed) | 0.614 | 0.013 | 0.236 | 0.907 | 0.566 | |
| Move–Static | Pearson correlation | −0.023 | −0.357 | 0.094 | 0.028 | 0.565* |
| Significant (two tailed) | 0.938 | 0.217 | 0.750 | 0.926 | 0.039 | |
| Unique–Ordinary | Pearson correlation | −0.034 | −0.596* | 0.211 | 0.411 | 0.107 |
| Significant (two tailed) | 0.908 | 0.022 | 0.468 | 0.148 | 0.716 |
- *
Significant correlation at the 0.05 level (two tailed).
- **
Significant correlation at the 0.01 level (two tailed).
3.2 Correlation analysis between perceptual vocabulary and design elements
Then using SPSS 24.0 software, the design elements are independent variables, and the perceptual vocabulary evaluation value is the dependent variable. First, the correlation analysis is carried out to find out the design elements that are significantly related to the sensible vocabulary. As can be seen from Table 4, the design element that is significantly associated with the perceptual adjectives lively–dull is the petal shape; the Pearson correlation coefficient is −0.568, with a significant value of 0.035, followed by the combination of the flower heart and the outer petals; the Pearson correlation coefficient is 0.381. The design elements related to the simple complicated are petal form, the position of decorations, and the combination of outer petals; the Pearson correlation coefficients are 0.711, 0.380, and −0.304, respectively. Petal shape is the most relevant with the significant value of 0.004. The design elements related to neat–disordered are the combination of the flower heart and the outer petals, the lotus center structure, the combination of the outer petals, and the petal shape. The Pearson correlation coefficients are −0.590, 0.450, 0.391, and 0.367, respectively. The petal shape is closely related to the perceptual vocabulary tight–loose significant, with a significant value of 0.006 < 0.01, the combination of the flower heart and outer petals, and the combination of the outer petals are also related to it; the Pearson correlation coefficients are 0.469 and −0.342, respectively. The petal form of the design element is also significantly correlated with the cabinet–atmospheric perceptual vocabulary, with a significant value of 0.013 < 0.05, followed by the combination of the flower heart and the outer petals; the Pearson correlation coefficient is 0.339. The design elements related to move–static are the position of decorations and the petal shape; the Pearson correlation coefficients are 0.565 and −0.357, respectively. The petal shape and the combination of the outer petals are related to unique–ordinary, and the petal shape is significantly correlated with it; the Pearson correlation coefficient is −0.596; and the significant value is 0.022.
3.3 Multiple linear regression analysis of perceptual evaluation data
Then multivariate linear regression analysis is carried out to finally find out the correspondence between the design elements of lotus pattern and the sensible vocabulary and establish the regression model (as shown in Table 5).
Regression model of perceptual vocabulary and design elements
| Regression model | |||
|---|---|---|---|
| Lively–Dull | Y=4.375-0.069 × 2 | R2=0.865 P=0.011 | X1 represents the lotus center structure X2 represents petal shape X3 represents the combination of the flower heart and the outer petals X4 represents the combination of the outer petals X5 represents the position of decorations |
| Simple–Complex | Y=0.703+0.230 × 2-0.259 × 4+0.153 × 5 | R2=0.853 P=0.014 | |
| Neat–Disordered | Y=7.587+0.076 × 1-0.183 × 3 | R2=0.826 P=0.021 | |
| Tight–Loose | Y=−10.725-0.173 × 2+0.139 × 3+0.317 × 4 | R2=0.781 P=0.035 | |
| Cabinet–Atmospheric | Y=−10.969+0.167 × 2+0.320 × 3 | R2=0.878 P=0.009 | |
| Move–Static | Y=−6-0.038 × 2+0.187 × 5 | R2=0.798 P=0.028 | |
| Unique–Ordinary | Y=−8.313-0.128 × 2+0.338 × 4 | R2=0.851 P=0.016 | |
As can be seen from Table 5, all models have a good fitting degree, and the values of R2 are all above 0.78. Among the seven pairs of perceptual vocabulary, the design element of the petal shape has influence on the other six pairs of perceptual vocabulary, except that it has no effect on the neat–disordered perceptual vocabulary. The combination of the flower heart and the outer petals has influence on the neat–disordered, tight–loose, and unique–ordinary. The position of decorations has an impact on the simple–complex and move–static two sets of perceptual vocabulary. The structure of the lotus center only affects neat–disordered.
3.4 Formulation of design element combination coding table
With regard to the design elements in the model of Table 4 and the samples in Table 3, to find out which design elements will affect the perceptual vocabulary, according to the design element coding in Table 1, a design element coding combination table corresponding to the perceptual vocabulary is formulated. Taking the perceptual vocabulary lively–dull as an example, in the model, the petal shape has an influence on it; the samples with lively features in Table 3 are 2 and 4; the samples with dull features are 14; by observing the petal shape of samples 2, 4, and 14, it can be concluded that the petal shape encoded as 27 and 26 gives a lively feeling, and the petal shape encoded as 21 gives a dull feeling. According to this method, the design element codes corresponding to each pair of perceptual vocabulary are specifically obtained, as shown in Table 6.
Design element combination coding corresponding to perceptual vocabulary
| Perceptual vocabulary | Design element combination code |
|---|---|
| Lively | 27, 26 |
| Dull | 21 |
| Complex | 224154, 244151, 254353, 284253, 274251, 264252 |
| Simple | 214151 |
| Neat | 1131, 1232, 1332, 1333 |
| Disordered | 1331 |
| Tight | 283242, 253143 |
| Loose | 243143 |
| Cabinet | 2331 |
| Atmospheric | 2532, 2832 |
| Move | 2254, 2451 |
| Static | 2153, 2653, 2353 |
| Unique | 2441 |
| Ordinary | 2342 |
By comparing the design element coding in Table 6 with the sample picture 1, it can be concluded that the petal shape of codes 26 and 27 has a lively sensation, and the petal shape of code 21 has a dull feeling. The design element combination codes 254353 and 284253 present a complex feeling, while the samples 9, 11, and 12 corresponding to code 284253 happen to be the common pattern of the Mission flower and the Baoxiang flower in the Tang dynasty caisson. This shows that modern young consumers think that the traditional lotus pattern, such as the typical Mission flower and Baoxiang flower, gives people a complex feeling. The samples 2, 3, 4, and 13 corresponding to the codes 274251, 264252, 224154, and 244151 have no complex pattern characteristics, such as the Mission flower and the Baoxiang flower, but the lotus pattern has a decorative object, which also gives a complex feeling. Among all the samples, only the 14th sample has a simple character. By analyzing the shape of the petals, the combination of the outer petals, and the position of the ornament, it can be seen that the two-layered different-sized lotus petals combined with the hear decorate with a simple ornament; it gives a simple feeling. For neat–disordered sensuous vocabulary, all samples are presented in a neat sense; by analyzing the center structure of the sample and the combination of the flower heart and the outer petals, it can be found that the center structure of the lotus pattern exhibits a cross shape, a 米 shape, and a mission shape, which itself has a symmetric and balanced characteristic; the outer petals then radiate outward from small to large layers, but it is only when the flower heart is combined with the outer petals, it will give a little disordered feeling. The design element combination code 283242 has a tight feeling, corresponding to the physical samples 9 and 11, and it can be seen that the complex multilayered Mission flower and the Baoxiang flower's petal shape give a tight feeling. The difference between the design elements of codes 253143 and 243143 is the shape of the petals. By analyzing samples 5 and 8, it can be seen that the complex multilayered petal shape of sample 5 gives a tight feeling, while the less number of petal layers and shape of sample 8 give a feeling of looseness. In the design element coded 2331, the lotus flower heart is connected to the simple petal shape giving a cabinet feeling. The complex petal shape, the flower heart does not connect with the outer petals, such as the samples corresponding to the codes 2532 and 2832, gives an atmospheric feel. By comparing the coding of the move–static vocabulary design elements with the sample, it can be seen that the curl petal produces a rotational illusion due to the inward curling of the petals; at the same time, the movement of animals or characters in the center of the flower or the surrounding area will also give people a sense of movement. Analysis of the design elements of codes 2441 and 2342 shows that the single-layered combination of Moiré petal and peach-shaped petals gives a unique feeling; Moiré petal with similar shapes and sizes that are closely arranged in multiple layers gives a common feeling.
3.5 Verify the regression model of perceptual vocabulary and design elements
To verify the reliability and validity of regression model of perceptual vocabulary and design elements, five lotus patterns were randomly selected from the Mogao Caves in the Tang dynasty caisson to verify the accuracy of the correspondence between sensual vocabulary and design elements (as shown in Figure 2).
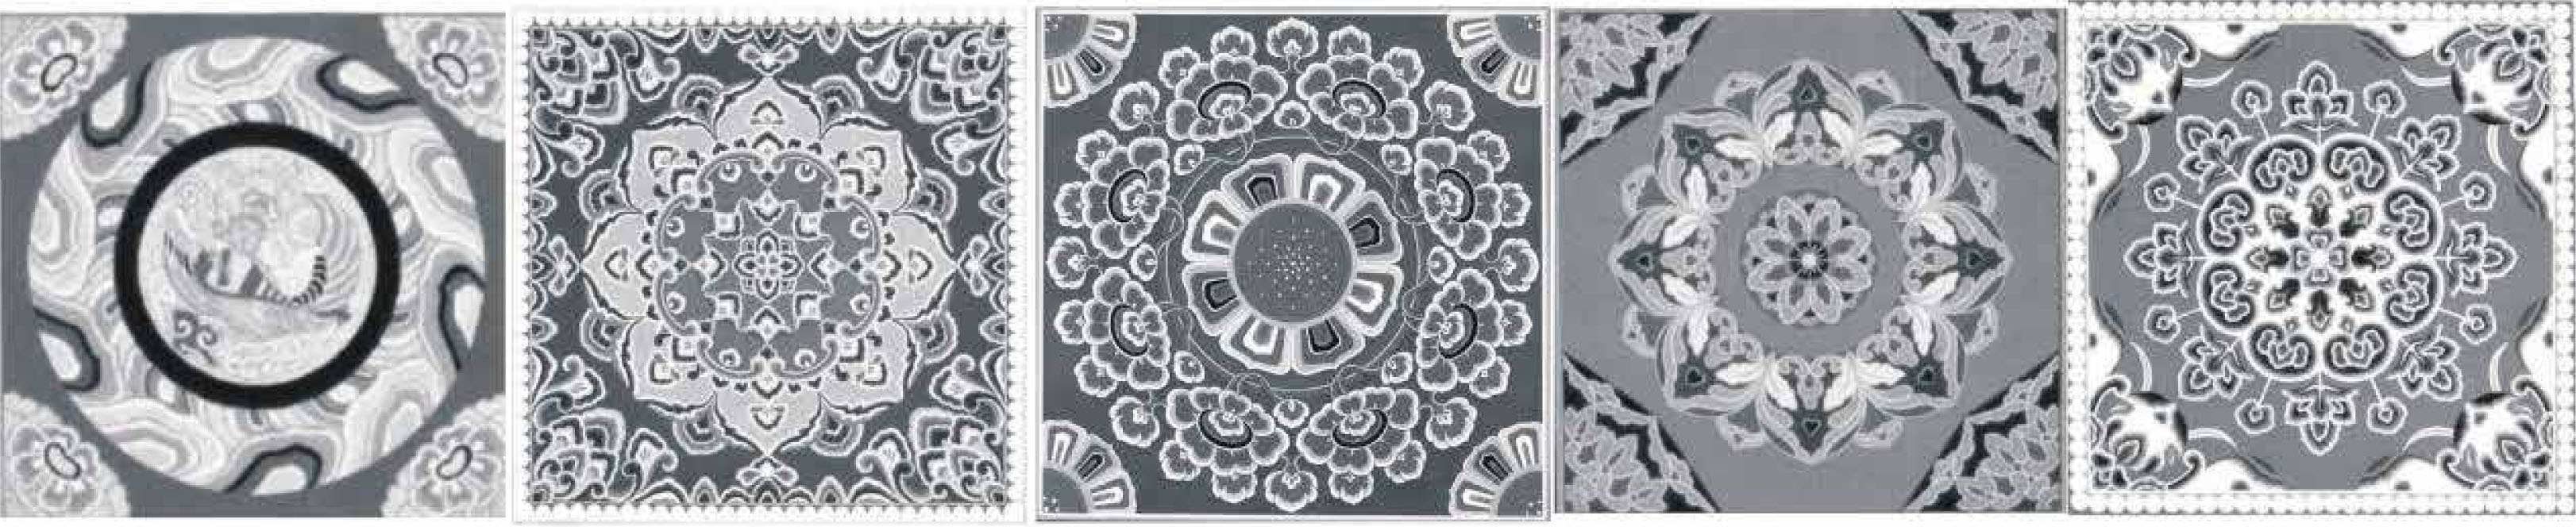
Verification samples.
First, five lotus patterns are used as verification samples to analyze the design elements, bring the analysis results into the model corresponding to each group of perceptual vocabulary, and calculate the perceptual predictive value of the verification sample. Then, a perceptual questionnaire was created on the network for this five verification samples, and it was distributed to 20 target consumers to conduct a perceptual evaluation about them. Based on the results of the survey, the average of the evaluation results of five verification samples was calculated. To verify the accuracy of the model, the relative error method is used to normalize the perceptual prediction value and the measured value of the questionnaire (as shown in Table 7).
Verification sample relative error
| Lively–-Dull | Simple–Complex | Neat–Disordered | Tight–Loose | Cabinet–-Atmospheric | Move–-Static | Unique–-Ordinary | |||||||||||||||
|---|---|---|---|---|---|---|---|---|---|---|---|---|---|---|---|---|---|---|---|---|---|
| Predicted value | Survey value | Relative error (%) | Predicted value | Survey value | Relative error (%) | Predicted value | Survey value | Relative error (%) | Predicted value | Survey value | Relative error (%) | Predicted value | Survey value | Relative error (%) | Predicted value | Survey value | Relative error (%) | Predicted value | Survey value | Relative error (%) | |
| Verification sample 1 | 2.86 | 2.78 | 2.8 | 2.95 | 2.9 | 1.7 | 2.54 | 2.44 | 3.9 | 3.05 | 3 | 1.6 | 3.27 | 3.13 | 4.3 | 2.7 | 2.58 | 4.4 | 2.73 | 2.65 | 2.9 |
| Verification sample 2 | 2.65 | 2.62 | 1.1 | 3.43 | 3.51 | 2.3 | 2.64 | 2.52 | 4.5 | 3.03 | 3.11 | 2.6 | 3.45 | 3.5 | 1.4 | 2.96 | 2.92 | 1.4 | 3.02 | 3.13 | 3.6 |
| Verification sample 3 | 2.93 | 2.85 | 2.7 | 2.87 | 2.73 | 4.9 | 2.54 | 2.47 | 2.8 | 3.23 | 3.07 | 5.0 | 3.1 | 3.17 | 2.3 | 2.93 | 3.02 | 3.1 | 2.86 | 2.74 | 4.2 |
| Verification sample 4 | 2.72 | 2.68 | 1.5 | 3.2 | 3.37 | 5.3 | 2.72 | 2.68 | 1.5 | 2.89 | 2.76 | 4.5 | 3.28 | 3.21 | 2.1 | 3.0 | 3.11 | 3.7 | 2.81 | 2.77 | 1.4 |
| Verification sample 5 | 2.58 | 2.63 | 1.9 | 3.66 | 3.57 | 2.5 | 2.57 | 2.63 | 2.3 | 2.86 | 2.91 | 1.7 | 3.61 | 3.7 | 2.5 | 2.92 | 3 | 2.7 | 2.89 | 2.91 | 0.7 |
| Average relative error | 2 | 3.34 | 3 | 1.75 | 2.52 | 3.06 | 2.56 | ||||||||||||||
From Table 7, it can be seen that in addition to the two groups of perceptual words “Simple” and “Tight,” the relative error of the results obtained by the verification sample 4 is 5.3%; the “Tight” group of perceptual words—the relative error of the results obtained in sample 3 is 5%; other perceptual words’ relative errors are below 5%; and the average relative error of each group of perceptual words is below 4%. That is to say, the model corresponding to each group of perceptual vocabulary obtained in this study has certain credibility and can predict consumers’ perception about the lotus pattern of the caisson in the Tang dynasty.
4 Conclusion
Pattern design is a time-consuming and laborious task. Designers often draw through their own design experience, restricted by personal level and inefficient. Especially for the modern application of traditional patterns, because the traditional pattern has a long history, its composition, pattern modeling, color, and other aspects are more complicated and cannot meet the esthetic needs of modern people. Moreover, most of the modern applications of traditional patterns still depend on the designer's personal preferences, which undoubtedly hinders the application and development of traditional patterns in modern society. In this context, we proposed the theory of Kansei engineering to integrate with the SPSS 24.0; it has obtained the perceptual cognition of traditional patterns by young consumers, and which design elements of traditional patterns have an impact on consumers’ perceptions, and established a mathematical model that can predict consumers’ perception of traditional patterns. The conclusions are as follows:
In the Tang dynasty, the lotus pattern of the caisson gave the modern young people a neat, complicated, tight, and static feeling. Through the perceptual evaluation experiments of the 14 lotus samples of the Tang dynasty, it was found that 12 samples had a neat feeling; samples 8 and 10 have a disordered sensation with a lower score of 3.14 and 3.07. In addition, eight samples have a complex feeling, five samples have a neat feeling, and three samples have a tight and static feeling. There are two samples with atmospheric, move, and lively sensations. The number of samples with cabinet, unique, ordinary, loose, dull, and simple feelings is 1.
Through correlation analysis and multiple linear regression analysis, six of the seven groups of perceptual vocabulary were affected by the design element of petal shape. It is significantly associated with the simple–complex and tight–loose of the sensible vocabulary, with a significant value of P < 0.01. The combination of the flower heart and the outer petals has an effect on the neat–disordered, tight–loose, and cabinet–atmospheric, which is significantly related to the sensible vocabulary neat–disordered; the Pearson correlation coefficient is −0.590. The combination of the outer petals has an effect on the simple–complex, tight–loose, and unique–ordinary of the vocabulary but exhibits a low correlation of 0.3 ≤ |R| ≤ 0.5. The position of the ornament has an effect on the simple–complex and move–static two sets of perceptual vocabulary, which is significantly associated with move–static, with a significant value of 0.039. The lotus center structure only affects the perceptual vocabulary neat–disordered and presents a low correlation; the Pearson correlation coefficient is 0.450.
Corresponding analysis of the design elements and experimental samples in the regression model, specifically identifying the combination of design elements corresponding to each perceptual vocabulary. The design element combination code is analyzed in detail, and the reasons why different combinations of design elements give people different feelings are found out. For example, the representative Mission flower and the Baoxiang flower in the Tang dynasty caisson give people a complicated and tight feeling because of their complex petal shape and multilayered closely connected pattern features. And when the complex petal shape use the way of the flower heart is separated from the outer petals, it gives a feeling of the atmosphere. Because the center structure of the lotus pattern uses a cross type, a 米type, and a mission type with symmetric equalization characteristics, and the outer petals are arranged by radiating from the center, almost all the samples exhibit neat characteristics. Different petal shapes give different feelings, and the petal shape of codes 26 and 27 has a lively feeling, and the petal shape of code 21 has a dull feeling; the curl petal lotus has a feeling of rotation as the petals curl inward; the lotus pattern of the combination of a single layer of Moiré and peach petals gives a unique feeling; the multilayered closely arranged Moiré petal gives a common feeling, when there is a moving ornament in the center of the lotus or around it, it will give a sense of movement.
In short, through the combination of the theory of Kansei engineering and SPSS 24.0 software, the corresponding relation between the perceptual cognition of consumers and the caisson lotus pattern of Mogao Cave in the Tang dynasty was found out. It not only helps related industries and designers to determine the direction of product development but also improves the designer's work efficiency and consumer satisfaction with the design.
Acknowledgements
This paper was supported by Fuzhou Department of Science & Technology (No. 2017-G-112), Collaborative Innovation Center of Modern Clothing Technology, Minjiang University (No. MJKFFZ201708), and Fujian Department of Education (No. JAT170446).
References
[1] Zhou, J., Su, J. N., Liu, Z. Q., Sang, Y. N. (2018). Research on empathic of cultural and creative products design, take as Mogao Grottoes caisson art creative product design as an example. Art and Design (Theory), 16(7), 113–115.Search in Google Scholar
[2] Zhou, F. (2016). Analysis of the application value of Dunhuang caisson pattern in modern design. Popular Literature, 60(22), 91.Search in Google Scholar
[3] Jiang, S. Y. (2014). The reference and application of Dunhuang art in modern home textile art design. Jiangsu Silk, 42(1), 20–23.Search in Google Scholar
[4] Wang, Y., Chen, Y. (2007). Relationship between perception and designing elements of woman's overcoats. Journal of Textile Research, 28(11), 97–100.Search in Google Scholar
[5] Luo, S. J., Pan, Y. H. (2007). Progress in sensory image theory, technology and application in product design. Journal of Mechanical Engineering, 43(3), 8.10.3901/JME.2007.03.008Search in Google Scholar
[6] Su, J. N., Li, H. Z. (2005). Research on the sensory characteristics of materials in industrial design. Mechanical Design and Research, 21(3), 12.Search in Google Scholar
[7] Xia, P. P., Wang, Y. H. (2016). Research on the sensibility evaluation of closed clothing patterns. Liaoning Silk, 43(4), 11.Search in Google Scholar
[8] Mitsuo, N. (2002). Kansei engineering as a powerful consumer-oriented technology for product development. Applied Ergonomics, 33(3), 289–294.10.1016/S0003-6870(02)00019-4Search in Google Scholar
[9] Vieira, J., Osorio, J. M. A., Mouta, S., Delgado, P., Portinha, A., et al. (2017). Kansei engineering as a tool for the design of in-vehicle rubber keypads. Applied Ergonomics, 61, 1–11.10.1016/j.apergo.2016.12.019Search in Google Scholar PubMed
[10] Yuhazri, M. Y., Hidayah, W. N., Sihombing, H., Yahaya, S. H., Sulaiman, S., et al. (2018). Kansei engineering approach for the customers preferences of car design. In: Proceedings of the 7th International Conference on Kansei Engineering and Emotion Research. 739, 289–295.10.1007/978-981-10-8612-0_31Search in Google Scholar
[11] Mattia, M., Giampaolo, C. (2018). Prediction of Kansei engineering features for bottle design by a Knowledge Based System. IJIDeM, 12(4), 1201–1210.10.1007/s12008-018-0485-5Search in Google Scholar
[12] Chaiwat, K., Koichi, Y. (2018). Application of Kansei engineering and data mining in the Thai ceramic manufacturing. Journal of Industrial Engineering International, 14(4), 757–766.10.1007/s40092-018-0253-ySearch in Google Scholar
[13] Lin, Y. C., Yeh, C. H., Wei, C. C. (2013). How will the use of graphics affect visual aesthetics? A user-centered approach for web page design. International Journal of Human-Computer Studies, 71(3), 217–227.10.1016/j.ijhcs.2012.10.013Search in Google Scholar
[14] Guo, F., Liu, W. L., Cao, Y. Q., Liu, F. T., Li, M. L. (2016). Optimization design of a webpage based on Kansei engineering. Human Factors and Ergonomics in Manufacturing, 26(1), 110–126.10.1002/hfm.20617Search in Google Scholar
[15] Jiang, Y., Liu, G. L. (2006). Study on consumer's perceptual demand for the image of T-shirt. Journal of Textile Research, 27(2), 98–100.Search in Google Scholar
[16] Wang, L. Z., Liu, C., Liu, S. D. (2016). Design of underwear based on Kansei engineering. In: The Textile Bioengineering and Informatics Symposium, Proceedings, 1, 836–843.Search in Google Scholar
[17] Shi, J. P., Zhu, J. N. (2011). A research on the knitted stripe apparel based on the perceptual knowledge of the wearer. Knitting Industry, 38(1), 53–56.Search in Google Scholar
[18] Wang, H. Y., Liu, G. L. (2014). Study on cognition of grid patterns based on consumer's sensibility demand. Journal of Textile Research, 35(11), 151–156.Search in Google Scholar
[19] Gu, Z. H., Wang, Y. J. (2018). Application effect of blue and white patterns of Ming Dynasty on cheongsam. Journal of Textile Research, 39(1), 126–132.Search in Google Scholar
[20] Cai, S. H. (2015). Research on the decorative art of Dunhuang caisson pattern in Tang dynasty. Modern Decoration (Theory), 30(9), 223–224.Search in Google Scholar
[21] Luo, X. W. (2018). Analysis of lotus ornaments in Dunhuang Mogao Grottoes in the Tang dynasty. Western Leather, 40(13), 64.Search in Google Scholar
[22] Chen, X. J., Liang, Z. H. (2004). Simplification in the circumstances-analysis of Dunhuang caisson patterns. Journal of Xi an University of Engineering Science and Technology, 18(1), 44–47.Search in Google Scholar
[23] Zhang. J., Chen, X. J. (2010). The evolution of the pattern of the caisson in the Dunhuang Mogao Grottoes. Art Grand View, 22(11), 54.Search in Google Scholar
© 2021 Daoling Chen et al., published by Sciendo
This work is licensed under the Creative Commons Attribution 4.0 International License.
Articles in the same Issue
- Photostability of TiO2-Coated Wool Fibers Exposed to Ultraviolet B, Ultraviolet A, and Visible Light Irradiation
- Chemical Hand Warmers in Protective Gloves: Design and Usage
- The Removal of Reactive Red 141 From Wastewater: A Study of Dye Adsorption Capability of Water-Stable Electrospun Polyvinyl Alcohol Nanofibers
- A Review of Contemporary Techniques for Measuring Ergonomic Wear Comfort of Protective and Sport Clothing
- Experimental Study on Dyeing Performance and Antibacterial Activity of Silver Nanoparticle-Immobilized Cotton Woven Fabric
- Sewing Thread Consumption for Chain Stitches of Class 400 using Geometrical and Multilinear Regression Models
- The Status of Textile-Based Dry EEG Electrodes
- Comprehensive Assessment of the Properties of Cotton Single Jersey Knitted Fabrics Produced From Different Lycra States
- Prognosticating the Shade Change after Softener Application using Artificial Neural Networks
- Influence of the Structure of Seersucker Woven Fabrics on their Friction Properties
- Evaluation of Cochlospermum vitifolium Extracts as Natural Dye in Different Natural and Synthetic Textiles
- Homogeneous Coatings of Titanium Dioxide Nanoparticles on Corona-Treated Cotton Fabric for Enhanced Self-Cleaning and Antibacterial Properties
- Numerical Analysis of Large Deflections of a Flat Textile Structure with Variable Bending Rigidity and Verification of Results Using Fem Simulation
- Thermal Behavior of Aerogel-Embedded Nonwovens in Cross Airflow
- Kansei Engineering as a Tool for the Design of Traditional Pattern