Multicriteria Decision-Making in Complex Quality Evaluation of Ladies Dress Material
-
Srabani Misra
 ,
Jana Salacova
,
Jana Salacova

Abstract
Quality is the essence of any product for consumer satisfaction. However, different people have different perception of quality. Eventually the definition of quality varies from product to product and thus it is much more complex in textile clothing material evaluation. The end use application of a specific clothing material determines what should be the parameters of quality evaluation. Thus, the evaluation based on subjective assessment becomes unpredictable and unquantifiable. Quality for dress materials is not simply a physical parameter but something called as psycho-physical parameter. In recent times, many objective evaluation systems have been developed to evaluate the apparel grade textile materials with regard to their quality parameters. However, the evaluation does not involve enough statistical treatment of data so as to obtain a parametric weighted characterization of complex quality. The current work deals with parametric approach to complex quality evaluation based on multicriteria decision-making approach for ladies dress materials. The ladies dress materials are of numerous varieties and choices across the globe. The selection and marketing of these kinds of textile materials need to be given proper emphasis as it depends not only on physical parameters but also on climate, geography, ethnic group, market trend, age group, gender, and many such complex parameters, which are not quantifiable in absolute terms. In this study, woven fabrics used for ladies dress materials are collected from the market and they were evaluated for the consumer-oriented property parameters. A parametric approach is adopted to quantify the overall quality of these dress materials. Various objective techniques were used to evaluate the comfort and esthetic parameters. A complex quality index (CQI) was estimated with weighted combination of all the contributing parameters and total quality index was calculated. Selected consumers with different education level, age, and gender were interviewed to get a statistic of their opinion about quality parameters preferred by them. This complex quality index/degree of satisfaction shows very high correlation with subjective judgment. A CQI can be evaluated for each kind of clothing material looking into their applications.
1 Introduction
Multicriteria decision-making problems comprise of an underlying space of feasible solutions and several objectives that can be evaluated with regard to the feasible solutions. In general, for this kind of problem, a generic solution approach and unambiguous concept of optimality does not exist. Different approaches, e.g., fuzzy logic, neural networks, etc. have been tried depending on the viewpoint of the decision-maker toward the underlying problem [1]. The optimization assumes that the given objectives can be ranked a priori and that the decision-maker is interested in an optimal solution with respect to this ranking. Reference point methods assume that the decision-maker is interested in a solution that minimizes a certain distance function to a given reference point [2, 3]. These different notions of optimality will generally lead to different (desired) solutions. In sustainable product development (PD) problems, the objective cannot be ranked a priori since the economic, environmental, and social dimension is considered to be equally important [4, 5]. The problem of PD is shown in Figure 1.
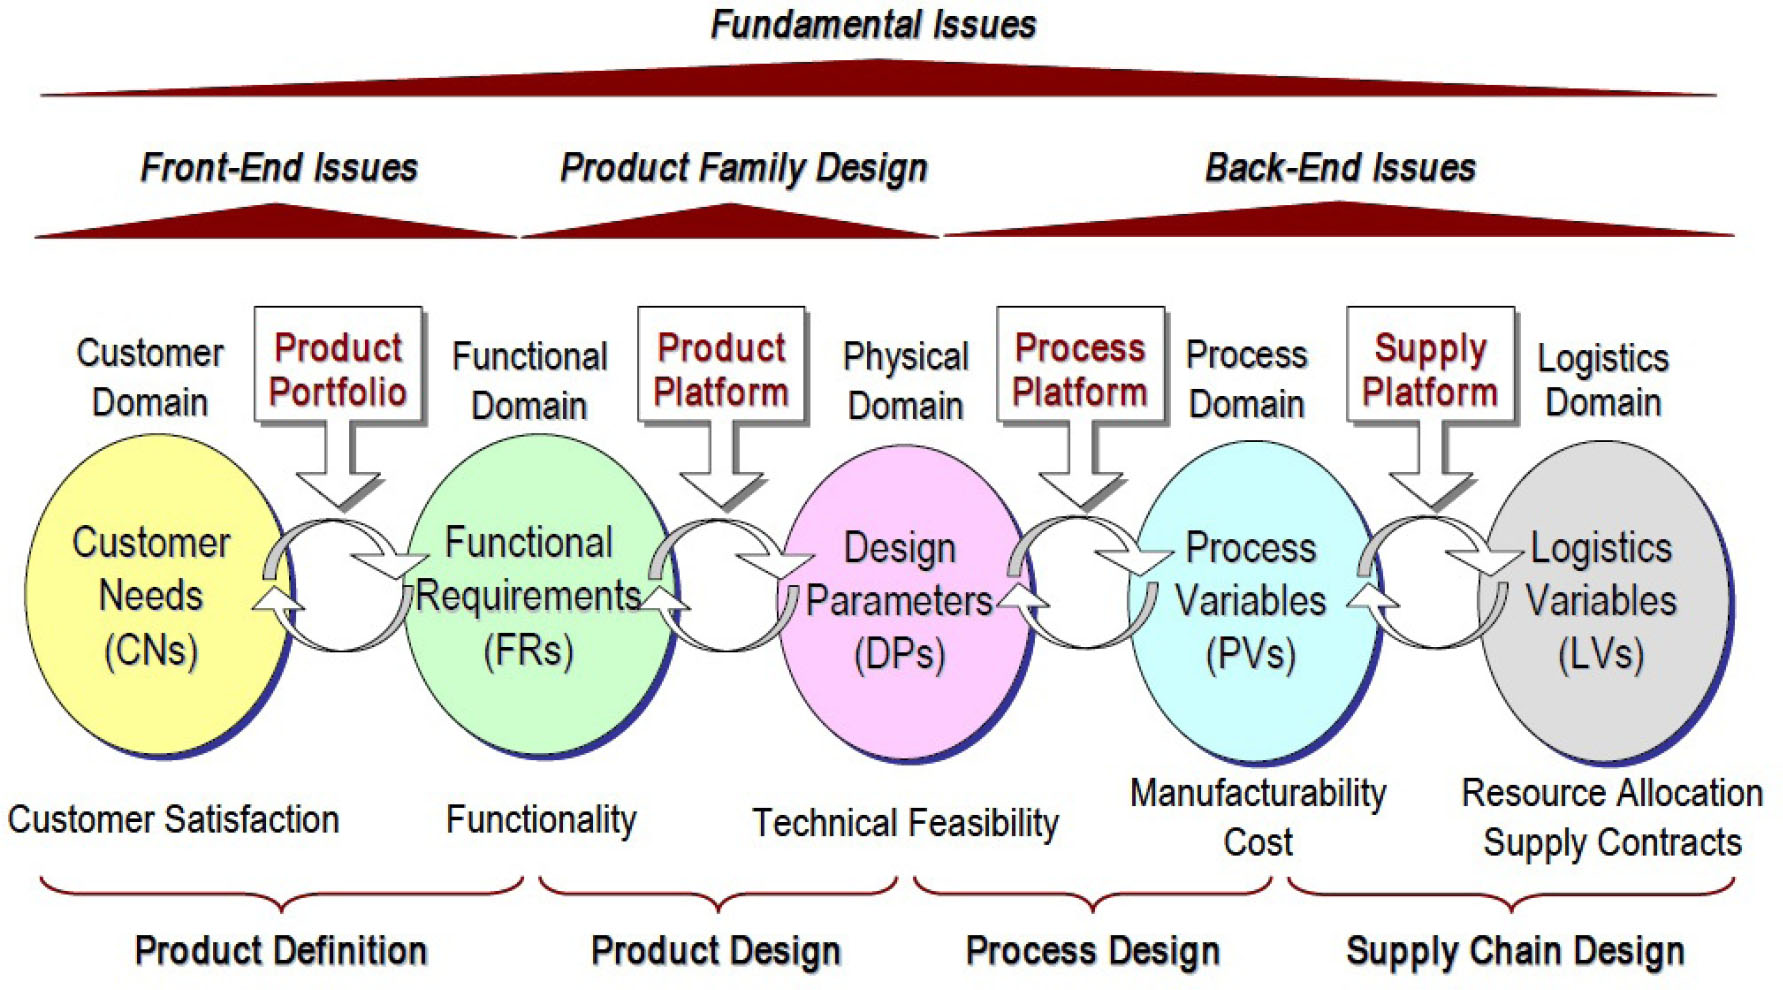
Issues of product decision-making.
In recent years, understanding the structure and function of complex clothing functions has become the foundation for explaining many different real-world complex biological, technological, and environmental phenomena [6]. Techniques from statistical physics have been successfully applied to the analysis of these networks and have uncovered surprising statistical structural properties that have also been shown to have a major effect on clothing functionality [7]. The current investigation shows that the statistical properties of strategically important clothing properties identified by people engaged in distributed PD in clothing industry and the significance of these properties in providing insight into ways of improving the strategic and operational decision-making of the clothing quality is discussed. It is believed that the new analysis methodology and empirical results are also relevant to other PD in textile area.
1.1 Complex quality aspects of clothing
According to researchers [8], the quality of clothing is categorized into
Physiological properties (heat, moisture, and air transmission)
Physical properties (mechanical properties)
Psychological properties (appearance, acceptability, and fashion)
1.1.1 The physiological properties
Various methods, e.g., disc type, hot cylinder type, hot plate type have been used for measuring the thermal insulation of fabric in the steady-state mode and contact transient mode [9]. In practice, the measurement of the rate of heat flow in particular direction is difficult as a heater, even when supplied with a known amount of power, dissipates its heat in all directions [10]. Togmeter and guarded hot plate, which are most commonly used for evaluation steady-state thermal insulation characteristics (mainly thermal resistance and thermal conductivity), have several disadvantages such as the length of time required for testing, the size of the samples, and cumbersome sample insertion in the apparatus. Presently, the transient state characteristics of fabrics have become important. Alambeta instrument [10] developed at the Technical University of Liberec, Czech Republic, is able to determine these characteristics. It enables insertion of the sample between the parallel measuring plates. The geometry of the measuring space enables this procedure, if the garment is not too large. The principle of this relatively good precision results from special design of the measuring head, where the central sensing area is smaller than the total area of the measuring head. Thus, the heat flow direction in the measuring zone is perpendicular to the measuring plate and the negative edge effects are compensated.
Thermal manikins are most important for clothing study due to their anatomic shape and their ability to sweat and move. The interest in using thermal manikins in research and PD has increased continuously over the past 20 years as indicated by the number of manikins being developed and manufactured. In addition, the level of advancement has also increased either for improved precision of the device or for reduced costs. Furthermore, these versatile instruments of evaluation are implemented now-a-days in a wide range of disciplines including clothing research and manufacturing, automobile industry, and environmental engineering of artificial microclimates for human occupancy. The principle of a manikin system is shown in Figure 2.
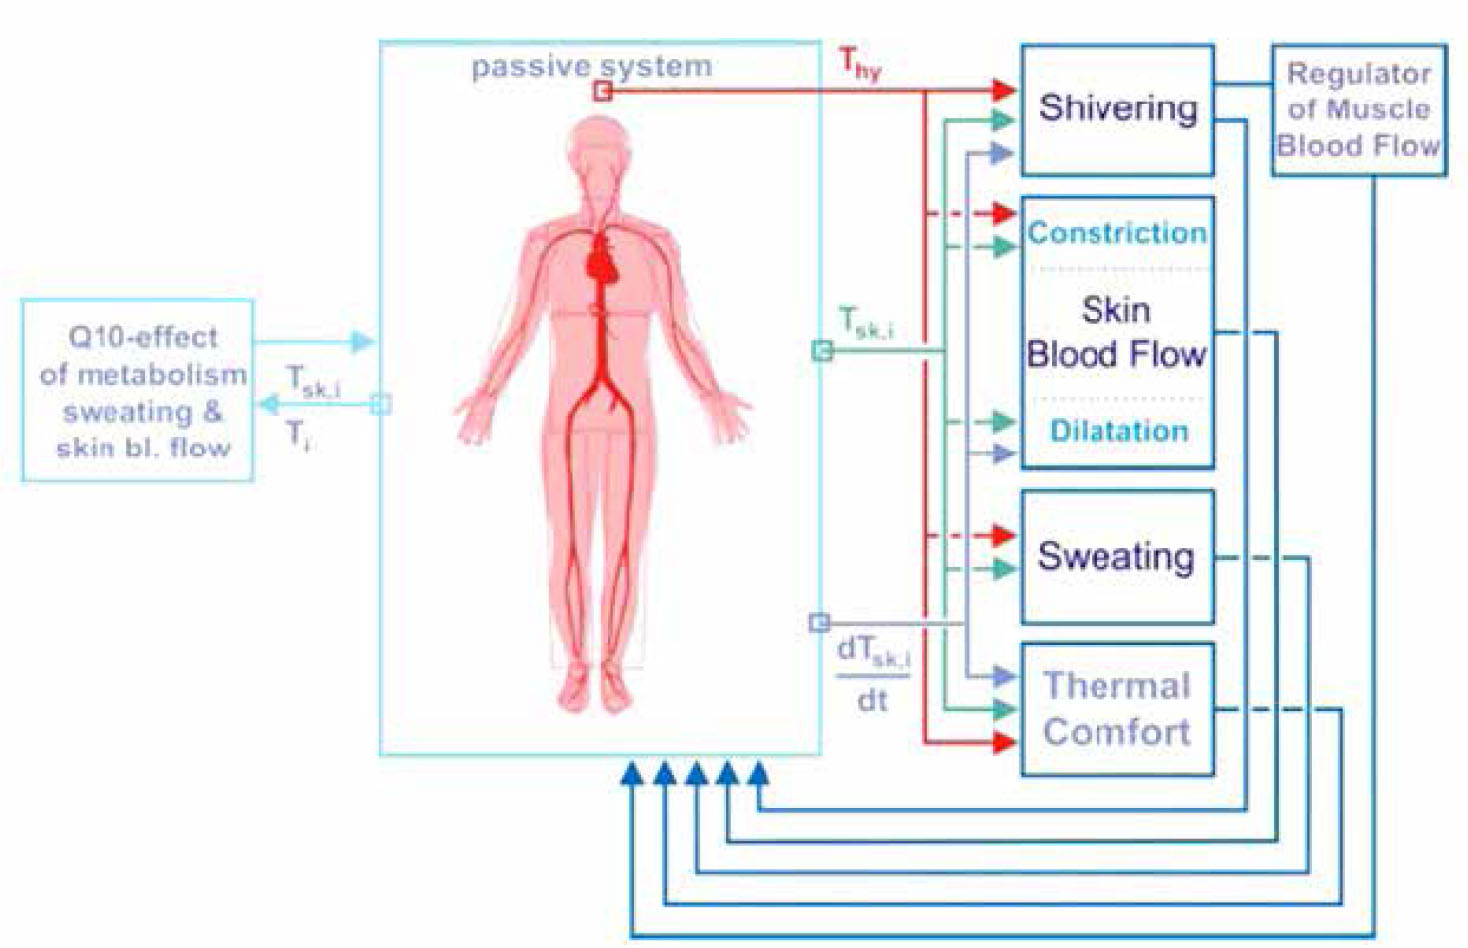
Heat transfer in a manikin.
1.1.2 Physical properties for clothing
Fabric physical properties assessment can be done in two particular ways:
Subjective assessment
Objective assessment
Subjective assessment treats fabric hand as a psychological reaction obtained from the sense of touch (Figure 3). Apparently it is a common method that has traditionally been used by textile technologists and researchers. Although it is probably the most widely discussed aspect of fabric assessment, it is not so well understood due to the reliance on subjective judgments [11]. The attempts of hand evaluation of textiles in an organized and quantitative manner have continued up to the present time. Extensive studies have been made on the subjective assessment of hand, with particular reference to rank correlation between judges from varying technical and sociological backgrounds. The judges are asked to rank the samples directly according to hand, from best to worst, without any suggestion of what primary hand qualities to look for.
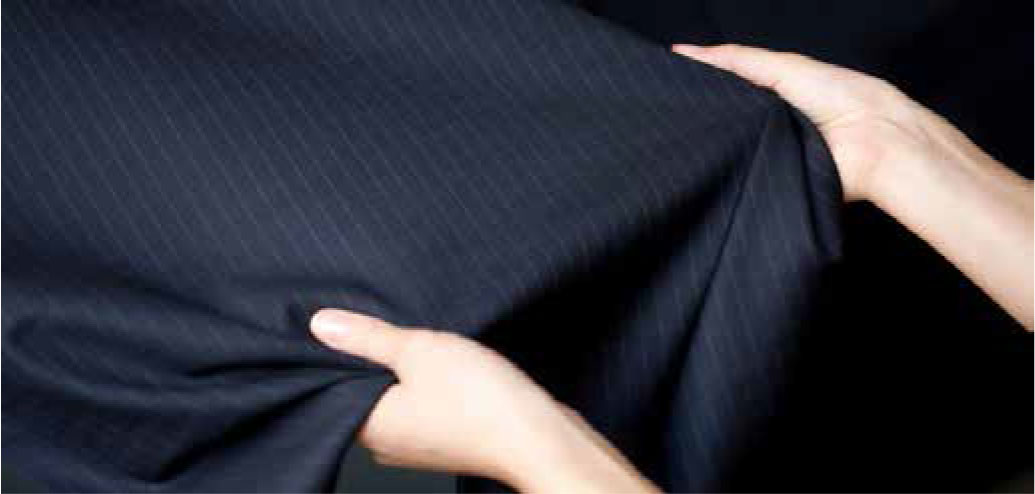
Subjective assessment of mechanical properties.
Kawabata Evaluation System (KES) is used to make objective measurements of hand properties. The KES instruments measure mechanical properties that correspond to the fundamental deformation of fabrics in hand manipulation. Five different tests can be performed using KES and the main mechanical characteristics are categorized under tensile, shear, bending, compression, and friction modes. After testing on all the KES-F instruments, the system measures totally 16 parameters in warp–way and weft–way direction for woven fabrics. Data are fed by the instrument in the equations that depend upon the end-use of fabric and the calculation software automatically generates primary handle values on 1–10 scale. Rating 1 indicates poor result and 10 indicates excellent result. The total hand value for summer and winter are estimated from the primary handle values. Figure 4 shows the set-up for KES-F measurements [11].
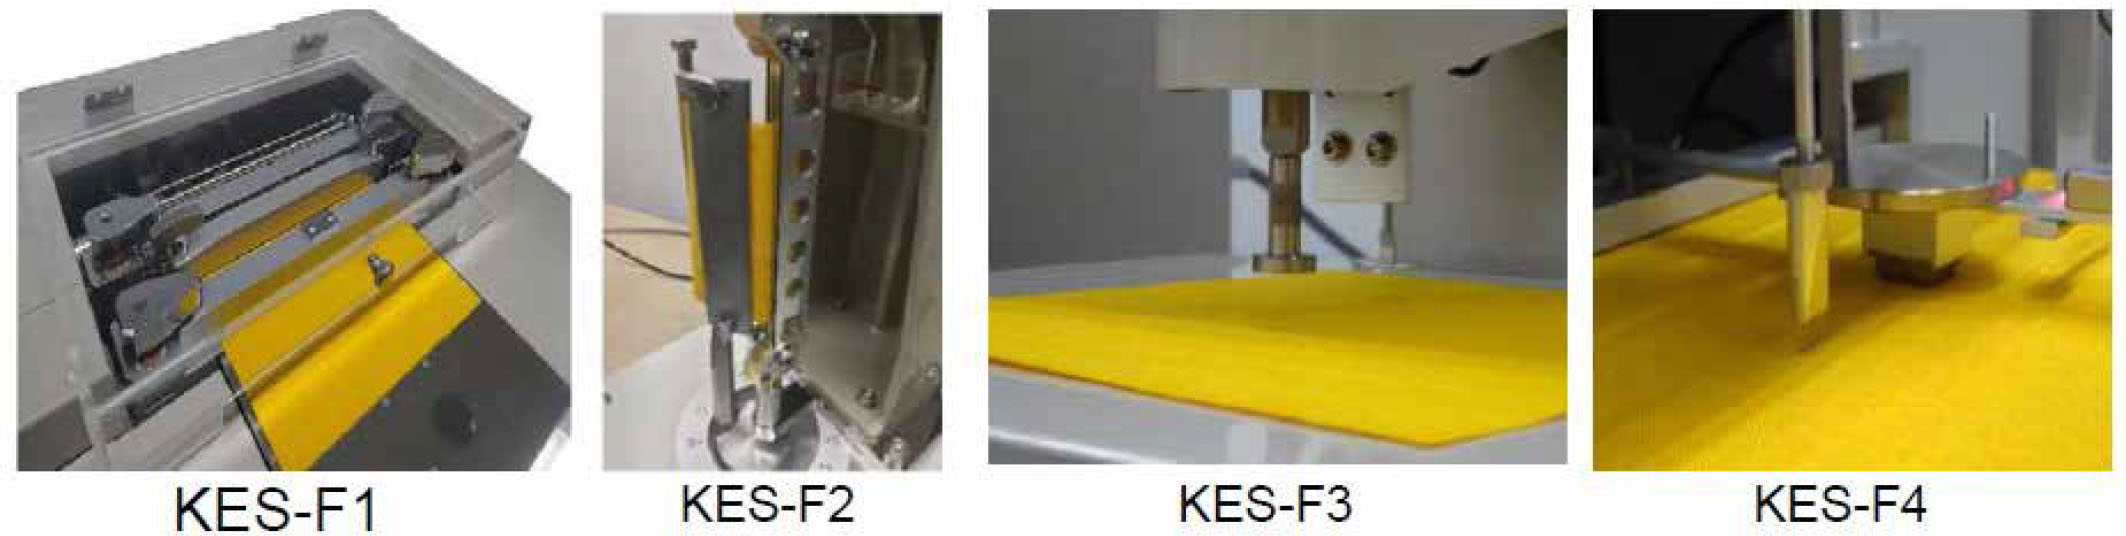
Objective assessment of mechanical properties by KES-F.
1.1.3 Psychological quality attributes
The appearance of a fabric mainly depends on the fabric design and characteristics of raw material used for it. The design of a fabric could be artistic design and/or engineering design. The artistic design includes weave structure, pattern, and color of the material, whereas the engineering design is mainly concerned with construction details. The weave design is also an integral part of the engineering design. However, the color selection for a given end use mainly depends on the users’ choice. The weave design, pattern, and fabric sett combined together attribute to texture of the cloth. Material characteristics along with engineering design specification determine fabric mechanical prosperities. The properties that directly link to the esthetic attributes are drape (mechanical properties), texture (constructional parameters), wrinkle (irregular surface deformations), and pilling (surface abrasion) [12]. Image analysis–based evaluation can be used to objectively quantify such attributes. The objective principle is shown in Figure 5.

Psychological/esthetic attributes.
2 Experimental
2.1 Materials
Twenty different woven fabric samples collected from the market were analyzed for their several quality parameters especially relating to consumer utility and satisfaction. The quality parameters evaluated through objective evaluation include esthetic attributes, e.g., drape, wrinkle, crease recovery, texture, and pilling and comfort parameters, e.g., air permeability, thermal insulation, and so on. The sample details are given in Table 1.
Details of fabric samples tested
| Sample no | Fiber composition | Ends/cm | Picks/cm | Warp (tex) | Weft (tex) | GSM (g.m−2) | Thickness (mm) |
|---|---|---|---|---|---|---|---|
| 1 | 100% cotton | 46 | 42 | 09 | 08 | 82.4 | 0.28 |
| 2 | 66% cotton + 34% polyester | 48 | 44 | 09 | 08 | 83.5 | 0.16 |
| 3 | 66% cotton + 34% polyester | 48 | 44 | 10 | 09 | 93.8 | 0.216 |
| 4 | 40% cotton + 60% polyester | 48 | 44 | 09 | 08 | 80.9 | 0.2 |
| 5 | 66% cotton + 34% viscose | 36 | 34 | 14 | 11 | 106.9 | 0.28 |
| 6 | 66% cotton + 34% viscose | 36 | 34 | 14 | 11 | 104.2 | 0.34 |
| 7 | 66% cotton + 34% polyester | 48 | 44 | 12 | 10 | 111.9 | 0.21 |
| 8 | 66% cotton + 34% polyester | 48 | 44 | 11 | 10 | 96.9 | 0.212 |
| 9 | 66% cotton + 34% polyester | 48 | 44 | 11 | 10 | 100.2 | 0.22 |
| 10 | 66% cotton + 34% polyester | 48 | 44 | 11 | 10 | 100.2 | 0.24 |
| 11 | 66% cotton + 34% viscose | 36 | 34 | 08 | 08 | 92.1 | 0.25 |
| 12 | 66% cotton + 34% viscose | 36 | 34 | 08 | 08 | 91.6 | 0.24 |
| 13 | 100% cotton | 46 | 42 | 08 | 07 | 82.1 | 0.31 |
| 14 | 30% cotton + 70% polyester | 52 | 44 | 10 | 09 | 97.5 | 0.19 |
| 15 | 30% cotton + 70% polyester | 52 | 44 | 11 | 10 | 102.1 | 0.21 |
| 16 | 66% cotton + 34% viscose | 48 | 48 | 07 | 07 | 63.8 | 0.37 |
| 17 | 66% cotton + 34% viscose | 48 | 48 | 12 | 11 | 103.8 | 0.3 |
| 18 | 20% viscose + 80% polyester | 56 | 45 | 07 | 07 | 62.1 | 0.13 |
| 19 | 30% cotton + 70% polyester | 52 | 44 | 07 | 06 | 55.0 | 0.23 |
| 20 | 30% cotton + 70% polyester | 52 | 44 | 06 | 06 | 47.6 | 0.17 |
2.2 Methods
ASTM and AATCC standards were used for all measurements. Drape coefficient was calculated using image analysis technique. The image analysis–based drape calculation is shown in Section 2.2.1. FX TextTest air permeability tester was used for measuring air permeability. Alambeta device was used for thermal properties. Martindale abrasion tester was used for abrasion resistance and pilling. The crease recovery was measured by AATCC method. All measurements were repeated 20 times and the average values are reported. The maximum CV% was restricted to 10%.
A group of 50 female consumers were selected for obtaining their subjective assessment with respect to quality parameters, e.g., esthetics and comfort. They constituted different age groups (10–20, 20–30, 30–40, 40–50, and 50–60 years). Their educational and social background also varied according to age groups. The results obtained from their opinion were termed as degree of satisfaction (DS).
2.2.1 Measurement of drape
Fabric drape can be defined as a description of the deformation of a fabric produced by gravity when only part of it is directly supported. It is also one of many factors that influence the esthetic appearance of a fabric and has an outstanding effect on the formal beauty of the clothing. The drapability of a fabric is quantified into a dimensionless value called “drape coefficient,” which is defined as the percentage of the area from an annular ring of the fabric covered by a vertical projection of the draped fabric. Several approaches have been reported where artificial neural network and principal component analysis are involved for prediction of drape [12, 13]. In this study, image analysis system is used, where a digital camera is interfaced with the computer software. The image of the shadow projected from the fabric is quantified into a binary image after being digitized. The threshold value that sets the criteria for converting a grey scale image into a black and white image can be controlled at the user interface of the system. For this reason, this image analysis method is not influenced by the fabric color. The digitized binary image is processed with a closing operation, which removes noise and segmentizes the shadow image of the draped fabric from the background image. The closing operation is a dilation operation followed by an erosion operation. This operation fills in single pixel object abnormalities. After digitizing the image of the draped fabric, the image analysis system searches the boundary between the fabric shadow and the central disc on the drape meter (between Ad and A1 of Figure 6) and the boundary between the fabric shadow and the outer region of the fabric shadow (between A2 and Ad).

Drape coefficient of fabric.
2.2.2 Pilling evaluation
Pills are localized minor disturbances, randomly distributed on the surface, whereas yarn floating points, which are part of the fabric structure, appear to be periodical and associated only with the pattern of interlacing. The periodic structure of a fabric will result in prominent peaks in its power spectrum, and nonperiodic components such as pills will generate frequency terms spreading in the background of the spectrum. Fast Fourier Transform (FFT) technique is used to determine the pills by image processing. Pills often appear in comparable brightness and size to those of floating yarns. Peaks are small, bright regions that can be detected by using a power threshold. The threshold usually needs to be set to a reasonably high value to prevent noisy areas from being detected. The pixels whose power is above the threshold are considered as the core part of peaks. The spectrum is now divided into two portions: peak portion and the nonpeak portion, which can be used in the inverse FFT to reconstruct two images. The image reconstruction through the nonpeak spectrum presents the nonperiodic structure including pills, and that from the peak spectrum shows the fabric weaving. In the nonperiodic image, pills appear to be solid circular regions; a template matching technique is suitable for the further detection of pills in the periodic image. A template is a pictorial representation of a known feature. For pill detection, the template is designed to be a small square that contains a centered white circle surrounded by black pixels. The size of the template should be equivalent to the size of the repeating units in the fabric. Template matching is the process of moving the template over the entire image and calculating the similarity between the template and the covered window on the image. The normalized correlation is one commonly used measure of similarity to determine match. If the image and the template are denoted as f(x, y) and t(x, y), the correlation coefficient at point (m, n) is given by
where fxy is the intensity of image pixels within the window that is translated across the entire image and t is the intensity of the template. The double summation is carried out over the moving template and the covered window. This equation can be further simplified to reduce redundant calculations in the program as follows:
where M is the number of pixels in the template and r(m, n) is the position of the pill in the matching map.
2.2.3 Wrinkle analysis
Wrinkles are defined as undesirable three-dimensional creases or short and irregular deformations on the fabric surface. These deformations depend on the viscoelastic properties of the fabric. They are three-dimensional versions of creases and formed when legs and sleeves are bent along the opposite direction and kept in a place for either a long period of time or intermittently. This property of a fabric is reflected in the criteria of a consumer's choice through the appearance of fabrics during ordinary wear [14, 15].
A computer vision system is used to measure the surface characteristics of the fabric, based on the method of image processing. The underlying assumption in this study is that the digitized intensities are proportionally related to the height and wrinkle of the surface features. A horizontal direction pixel is referred to as the X-axis and a vertical direction pixel as the Y-axis. The wrinkle properties can be judged by analyzing the grey level of images and are depicted using the distribution of grey level GSD. The standard deviation of grey level (GSD) is defined as:
where Z(i, j) is the grey level of point A(i, j), Z is the mean of data points and (m × n) are the pixels in the X direction and Y direction separately. A smooth fabric is expected to exhibit a uniform appearance, resulting in a narrow grey level histogram and a low standard deviation. When there are more wrinkles in the fabric, there are variations in the amount of light reflected at each point on the fabric surface resulting in a wide histogram and high standard deviation of the grey level.
3 Results and discussion
The results of fabric testing with respect to drape, air permeability, thermal insulation, abrasion resistance, pilling, crease recovery, and wrinkle are given in Table 2.
Results of quality parameters obtained through measurements
| Sample no | Drape coefficient | Air permeability (l/m/s) | Thermal resistance (m2.K/W) | Weight loss after abrasion (%) | Crease recovery angle (degrees) |
|---|---|---|---|---|---|
| 1 | 0.72 | 2066 | 7.64 | 10.07 | 64 |
| 2 | 0.31 | 1290 | 6.66 | 5.79 | 66 |
| 3 | 0.46 | 1236 | 7.5 | 4.15 | 67 |
| 4 | 0.41 | 1408 | 7.24 | 4.67 | 67 |
| 5 | 0.58 | 1264 | 8.74 | 5.79 | 74 |
| 6 | 0.68 | 844.4 | 9.42 | 9.27 | 69 |
| 7 | 0.63 | 246.4 | 5.74 | 3.32 | 73 |
| 8 | 0.26 | 770 | 6.56 | 5.62 | 67 |
| 9 | 0.66 | 588 | 6.62 | 3.67 | 68 |
| 10 | 0.64 | 678.4 | 6.36 | 4.16 | 70 |
| 11 | 0.69 | 931.6 | 7.28 | 3.87 | 66 |
| 12 | 0.60 | 1152 | 7.48 | 18.28 | 65 |
| 13 | 0.68 | 2318 | 9.05 | 10.06 | 60 |
| 14 | 0.62 | 952 | 5.63 | 1.88 | 67 |
| 15 | 0.75 | 989 | 6.11 | 1.86 | 66 |
| 16 | 0.42 | 3526 | 10.2 | 0.40 | 49 |
| 17 | 0.69 | 1166 | 8.58 | 4.62 | 68 |
| 18 | 0.64 | 3856 | 4.47 | 2.77 | 52 |
| 19 | 0.77 | 4294 | 8.2 | 6.70 | 48 |
| 20 | 0.89 | 4687 | 6.5 | 2.38 | 45 |
3.1 Drape
The drape coefficient was calculated for the samples using Equation 1. Consumer survey was conducted with several volunteers to obtain an opinion about the grading for drapability. The results are shown in Figure 7. A very high correlation was obtained between the calculated drape coefficient and the results of opinion survey from the consumers.

Drape coefficient and grading by consumers.
3.2 Air permeability
One of the most important characteristics for wearing comfort of clothing is the ability to allow air of adequate amount to pass through. The air permeability for all the samples was evaluated using FX Texttest 3300 equipment. The consumer survey was also made with respect to their preference about breathability and wearing comfort in a hot and humid condition. The results of measurement and consumer survey are shown in Figures 8 and 9.
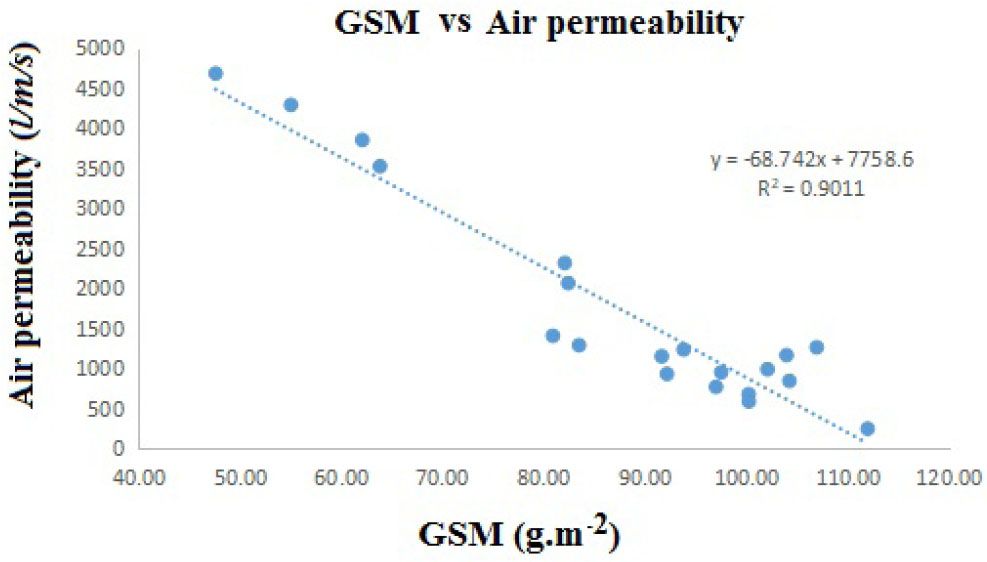
Relation of air permeability with fabric GSM.

Air permeability and wearing comfort.
It is found that the fabrics become less permeable to air with increasing areal mass or GSM. Therefore a low GSM fabric would be more suitable for summer applications.
It can be seen that the air permeability has an exponential relation to the wearing comfort. The consumers’ opinion about comfort in a hot and humid summer climate demand very high level of openness in the structure and permeability for air.
3.3 Thermal resistance
Thermal insulation is an essential requirement for clothing in winter and in cold climate. The insulation is a function of overall porosity. The geometrical parameters responsible for fabric porosity are GSM and thickness. For the same GSM, a thicker fabric is more porous and offers higher level of thermal insulation. The results of thermal insulation can be seen in Figure 10. It can be understood that the thermal resistance holds proportionality with the fabric thickness.

Fabric thickness and thermal resistance.
The consumer analysis was also carried out for determining the importance of thermal insulation of ladies dress material in relation to comfort in cold climate and hot and humid climate. Direct proportionality shows higher importance of heat insulation in winter application. On the other hand, a high insulation is an undermining property for dress used in hot and humid atmosphere. The results of survey show that insulation is not very essential in summer climate. Consumers would prefer a crisp, light, thin, and low insulating dress material in such climate condition. The results of consumer opinion are depicted in Figure 11a and b.
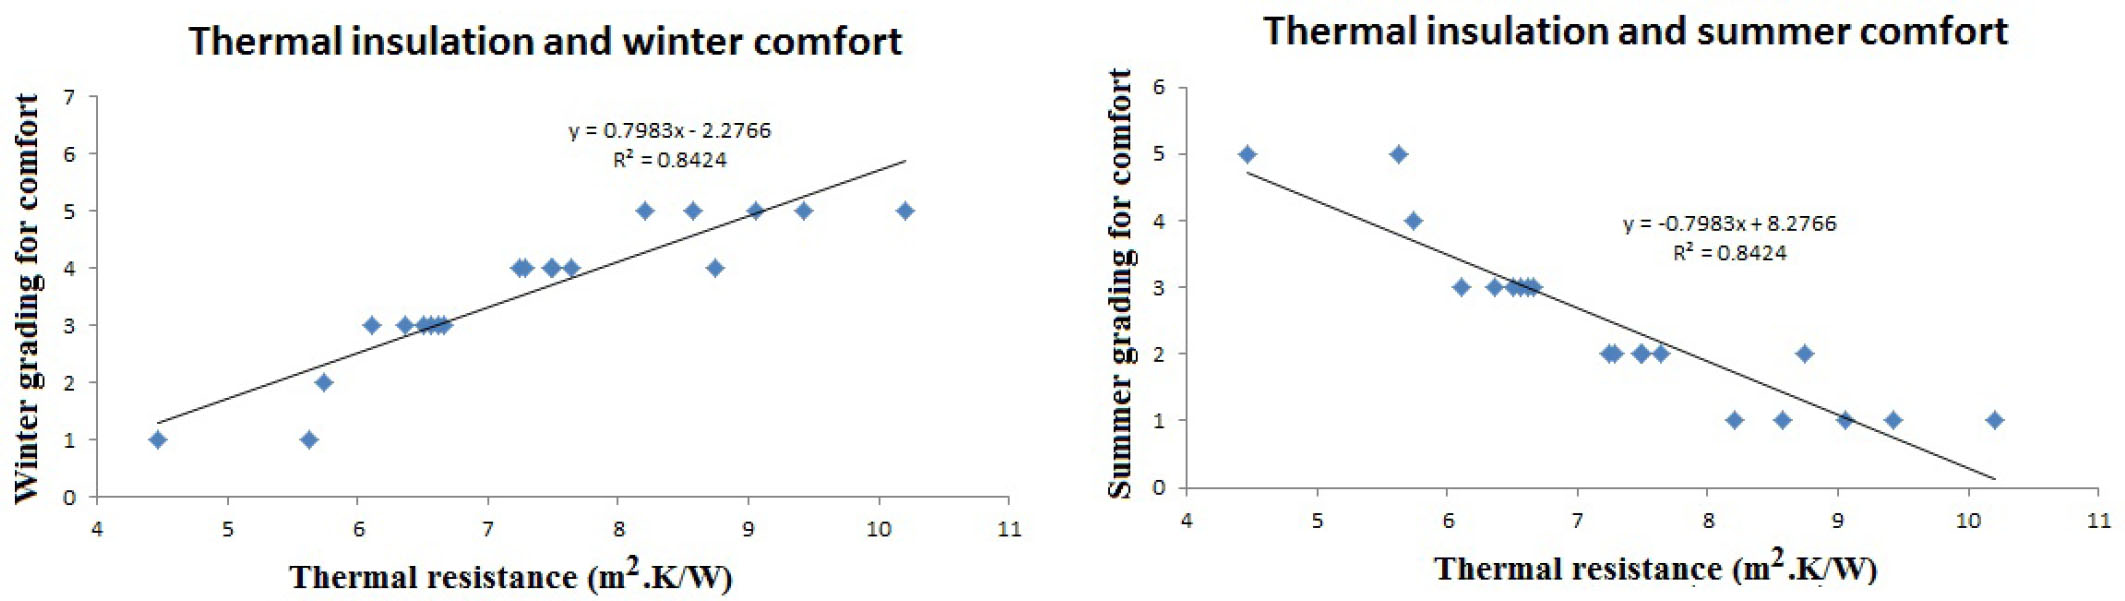
Influence of thermal insulation on (a) winter and (b) summer comfort for consumers.
3.4 Abrasion resistance and pilling
The durability of a dress material and its appearance during use critically depends on the resistance to wear and tear. During wearing and several body movements by the consumers, the clothing undergoes tremendous amount of surface abrasion. These abrasive forces not only hamper the durability and longevity of the clothing, but substantially affect its esthetic appearance. The abraded surface generates broken fibers and their entanglements. Such entanglements are termed as pills. The pilling propensity of a cloth material is one of most negative characters. It is more prominent in synthetic fiber–based materials due to generation of static electricity during abrasion. The abrasion resistance and pilling was studied using Martindale abrasion tester. Grading was done based on AATCC standards. Consumers were asked to give their opinion regarding pilling appearance. Results are shown in Figure 12.

Weight loss after abrasion and pilling.
As is visible from the figure, the pilling appearance deteriorates with higher weight loss. A higher proportion of fiber damage and abrasive damage is also associated with more pill formation. The tendency is more prominent in synthetic rich dress materials compared to cotton rich materials.
3.5 Crease recovery and wrinkle
Creasing or wrinkle formation is another shortcoming in many light weight dress materials. In application fields as clothing, the wearer squeezes and presses the clothing in several directions and orientations. Thus, wrinkle formation is a common behavior. The crease or wrinkle substantially lowers the overall reflectivity of the surface and poor appearance is resulted. The bending stiffness of the fabric is critically responsible for this kind of deformation behavior. As the fabric areal mass is responsible to decide the bending rigidity, the study of its influence is important. The results of such analysis are shown in Figure 13.

Effect of GSM on crease recovery angle.
The end users/consumers were also asked to rate the fabrics with respect to their wrinkling grade. The results of grading are shown in Figures 14a and b.

Dependence of wrinkle grades on (a) GSM and (b) crease recovery angle.
From the figure, it can be concluded that the crease recovery depends on fabric bending stiffness, which ultimately depends on the GSM. The wrinkling tendency is lower for heavier fabrics compared to lighter fabrics. Ability to recover from the creasing improves the overall wrinkle appearance.
3.6 Multicriteria-based complex quality index (CQI) and DS
Each of the quality parameters is quantified based on scientific principles using statistical analysis and integrated together to estimate a parameter called DS as follows [7]:
where n is the total number of properties, ui is nonlinear transformation of the grade Ai of the ith property obtained by consumer survey, and Wi is the fractional contribution of the ith property. A one side bounded characteristic can be obtained to calculate degree of consumer satisfaction as shown in Figure 15.

One side bounded characteristic of DS.
The DS varies from 0 to 1. Higher the value of DS, better is the CQI. In order to determine the fractional contribution of each attribute, an expert panel was constituted and a survey was conducted to decide the contribution of each element to the CQI.
Samples of fabrics were evaluated by using the calculated DS and CQI evaluated by fabric experts subjectively. The Bootstrap type technique described in book [7] has been applied for computation of the statistical characteristics of DS. This technique is based on the assumption that for attribute Aj the mean value xj and variance s2j are determined by standard treatment of the measured data. The procedure of the statistical characteristics of DS estimation is divided to the following parts:
Generation of x(k)j (j = 1, … m) values having normal distribution with mean values xMj and variances s2j. The pseudo-random number generator built in MATLAB is used.
Calculation of the DS(k) using the relation (5).
The steps I and II are repeated for k = 1, … n (usually n = 3,600 is chosen).
Construction of a histogram from the values DS(k) (k=1, … n) and computation of the estimators of E(DS), D(DS).
The core of Bootstrap is generations of artificial samples from proper distribution. The generation based on the normal distribution is used. It is generally useful if the only mean values xMj of all attributes are given. The variability is expressed as coefficient of variation, CV (CV = 10% is used). For generation of simulated samples, the random numbers N(0,1) generated by random number generator are used. These values are transformed to the individual attributes mean xj by relation xj = xMj (1 + CV/100) where CVj are variation coefficients. As robust characteristics of total mean from all simulated samples E(U), the median value is used and as robust alternative of standard deviation, the difference between 97.5% and 2. 5% of all bootstrap sample quantiles divided by 1.394 are calculated.
The CQI obtained through such analysis was correlated to the degree of consumer satisfaction (DS) of selected consumers. Results are shown in Figure 16.

Complex quality index and degree of satisfaction.
The strong correlation between CQI and DS is indicative of the statistical significance of the evaluation tool. For the samples, it is satisfactorily concluded that a higher CQI will ascertain better DS for the consumer.
4 Conclusion
In this research, a set of ladies dress materials were selected for objective evaluation of their consumer-related properties. The CQI was defined and determined based on pure statistical approach. To determine the fractional contribution of each attribute, an expert panel was constituted and also consumer survey was conducted to decide the contribution of each element to the CQI. Samples of fabrics were evaluated by using the calculated DS and CQI evaluated by fabric experts subjectively. CQI is estimated with weighted combination of all the contributing parameters and total quality index is calculated. The grades given by consumers correlated well with objectively measured quality parameters. A high degree of correlation was obtained between the CQI and consumer DS. Such CQI can be evaluated for each kind of clothing material based on their applications.
Acknowledgments
This work was supported by the Ministry of Education, Youth and Sports of the Czech Republic and the European Union—European Structural and Investment Funds in the frames of Operational Programme Research, Development and Education—project Hybrid Materials for Hierarchical Structures (HyHi, Reg. No. CZ.02.1.01/0.0/0.0/16_019/0000843), project “Modular platform for autonomous chassis of specialized electric vehicles for freight and equipment transportation”, Reg. No. CZ.02.1.01/0.0/0.0/16_025/0007293 and SGS grant No. 21159 of Technical University of Liberec.
References
[1] Murofushi, T. (1992). A technique for reading fuzzy measures (I): the Shapley value with respect to a fuzzy measure. In 2nd Fuzzy Workshop, Nagaoka, Japan, October, 39–48.Search in Google Scholar
[2] Abdelaziz, F. B., Olfa, M. (2015). Unstable interaction in multiple criteria decision problems. Journal of Multi-Criteria Decision Analysis, 22, 167–174.10.1002/mcda.1535Search in Google Scholar
[3] Allmendinger, R., Emmerich, M. T. M., Hakanen, J., Jin, Y., Rigoni, E. (2017). Surrogate-assisted multicriteria optimization: complexities, prospective solutions, and business case. Journal of Multi-Criteria Decision Analysis, 24, 5–24.10.1002/mcda.1605Search in Google Scholar
[4] Lolli, F., Ishizaka, A., Gamberini, R., Rimini, B. (2017). A multicriteria framework for inventory classification and control with application to intermittent demand. Journal of Multi-criteria Decision Analysis, 24, 275–285.10.1002/mcda.1620Search in Google Scholar
[5] Wakker, P. P. (1989). Additive representations of preferences: a new foundation of decision analysis, Vol. 4. Springer (Netherlands).10.1007/978-94-015-7815-8Search in Google Scholar
[6] Weber, M. (1985). A method of multi-attribute decision making with incomplete information. Management Science, 31(11), 1365–1371.10.1287/mnsc.31.11.1365Search in Google Scholar
[7] Meloun, M., Militky, J. (2011). Statistical data analysis (Meloun, M., Militky, J. ed.). Woodhead Publishing India Pvt. Ltd. (New Delhi).10.1533/9780857097200Search in Google Scholar
[8] Behera, B. K., Mishra, R. (2007). Comfort properties of non-conventional light weight worsted suiting fabrics. Indian Journal of Fiber and Textile Research, 32(1), 72–79.Search in Google Scholar
[9] Kothari, V. K., Bal, K. (2005). Development of an instrument to study thermal resistance of fabrics. Indian Journal of Fiber & Textile Research, 30, 357–362.Search in Google Scholar
[10] Hes, L. (2008). Non-destructive determination of comfort parameters during marketing of functional garments and clothing. Indian Journal of Fiber and Textile Research, 33, 239–245.Search in Google Scholar
[11] Kawabata, S., Niwa, M. (1991). Objective measurement of fabric mechanical property and quality: its application to textile and clothing manufacturing. International Journal of Clothing Science and Technology, 3(1), 7–18.10.1108/eb002968Search in Google Scholar
[12] Behera, B. K., Mishra, R. (2008). Measurement of fabric wrinkle using digital image processing. Indian Journal of Fiber and Textile Research, 31(1), 30–36.Search in Google Scholar
[13] Ghith, A., Hamdi, T., Fayala, F. (2015). Prediction of drape coefficient by artificial neural network. Autex Research Journal, 18(4), 266–274.10.1515/aut-2015-0045Search in Google Scholar
[14] Hamdi, T., Ghith, A., Fayala, F. (2014). A principal component analysis (PCA) method for predicting the correlation between some fabric parameters and the drape. Autex Research Journal, 14(1), 22–27.10.2478/v10304-012-0046-0Search in Google Scholar
[15] Behera, B. K., Mishra, R. (2007). Effect of crease behaviour, drape and formability on appearance of light weight worsted suiting fabrics. Indian Journal of Fiber and Textile Research, 32(3), 319–325.Search in Google Scholar
© 2020 Srabani Misra et al., published by Sciendo
This work is licensed under the Creative Commons Attribution-NonCommercial-NoDerivatives 4.0 International License.
Articles in the same Issue
- Fuzzy Logic Method for Predicting the Effect of Main Fabric Parameters Influencing Drape Phenomenon
- The Study on Effects of Walking on the Thermal Properties of Clothing and Subjective Comfort
- A Study on Improving Dyeability of Polyester Fabric Using Lipase Enzyme
- The Impact and Importance of Fabric Image Preprocessing for the New Method of Individual Inter-Thread Pores Detection
- Influence of Tensile Stress on Woven Compression Bandage Structure and Porosity
- Application of Silica Aerogel in Composites Protecting Against Thermal Radiation
- Multicriteria Decision-Making in Complex Quality Evaluation of Ladies Dress Material
- A Study of the Consumption of Sewing Threads for Women's Underwear: Bras and Panties
- Study of the Properties and Cells Growth on Antibacterial Electrospun Polycaprolactone/Cefuroxime Scaffolds
- How High-Loft Textile Thermal Insulation Properties Depend on Compressibility
- Lyocell Fabric Dyed with Natural Dye Extracted from Marigold Flower Using Metallic Salts
- Evolution of Physicochemical Structure of Waste Cotton Fiber (Hydrochar) During Hydrothermal Carbonation
- Analysis of the Thermal Insulation of Textiles Using Thermography and CFD Simulation Based on Micro-CT Models
- Circular Fashion – Consumers’ Attitudes in Cross-National Study: Poland and Canada