The Study on Effects of Walking on the Thermal Properties of Clothing and Subjective Comfort
-
Ivana Špelić
 ,
Dubravko Rogale
,
Dubravko Rogale

Abstract
Former studies done by other authors investigated the first- and second-layered air gaps beneath the clothing garments. None of the previous studies reported multidisciplinary clothing design testing approach linking both the objective measuring methods and subjective responses, while testing the thermal properties linked to a microclimatic volume formed between the layers of garments forming the ensemble. Neither was determined the limiting value of the microclimatic volume for outerwear garments, after which the thermal insulation will start to decrease due to convection. By taking the advantage of the precise three-dimensional (3D) body scanning technology and reverse engineering 3D CAD tool, the volume of the microclimatic air layers formed under outerwear garments was determined to study the impact of the ensemble’s microclimatic volume on the overall insulation value, measured by means of the thermal manikin. The jacket with the smaller microclimatic volume provided 5.2–13.5% less insulation than wider jackets, while the ensembles with tighter jackets showed 0.74–1.9% less insulation in static and 0.9–2.7% more insulation in dynamic conditions, thus proving that the limiting value of the microclimatic volume is greater than previously reported for three-layered ensembles. The effective thermal insulation value was reduced in average by 20.98–25.34% between standing and moving manikins. The thermal manikins are designed for steady-state measurements and do not work well under transient conditions, so three human subjects were employed as evaluators of the clothing thermal quality. In cooler climatic conditions, the measured physiological parameters and subjects’ grades pointed to discomfort while wearing ensembles with tighter jackets.
1 Introduction
The study on the effects of walking on the thermal properties of clothing and subjective comfort requires multidisciplinary testing approach, but so far only a negligible number of studies have tried to link the limiting value of the microclimatic volume for outerwear garments, after which the thermal insulation will start to decrease due to convection. Garments create a certain microclimate around the body, [1, 2] affecting the thermal comfort felt by humans [3]. The average microclimatic air layer thickness plays an important role in the heat transfer between the body and the environment, especially when considering the trapped, still air in steady state [1, 4, 5, 6]. A small change by 5 mm in the air gap thickness will noticeably increase both thermal and evaporative resistances of the garment in the steady-state conditions [7, 8]. However, after exceeding a certain limiting volume or thickness, the air becomes an ineffective insulator [9, 10] as increased convective airflow potential enhances the inhomogeneous heat and mass transfer in clothing [6, 7, 8]. The body motion and wind will further increase the potential for heat transfer [11, 12, 13, 14, 15] while forcing the convection, which prevents the linear increase of total dry heat loss [6, 16, 17, 18, 19, 20, 21]. The standardized methods for measuring thermal insulation of clothing tend to neglect the local air gap thickness, the contact area, and the spatial variations due to body shape, posture, movement, and clothing draping [6, 7, 8, 15].
By selecting the appropriate fabric type and the design of ease allowances, one can adjust the garment’s comfort level [22] since the additional air spaces formed under outerwear garments appear to dominate the overall thermal properties of clothing ensembles [23]. Former studies investigated only the microclimatic air layers formed under first- and second-layer ensembles [4, 9, 20, 22, 24, 25, 26, 27, 28]. Previously, the decrease in thermal insulation was reported when the air gap volume was greater than 6 [24] and 11.9 dm3 [27].
Since the three-dimensional (3D) scanning is currently the most reproducible and precise method for quantifying the air volume formed under clothing [4], in this study, the volume was determined by 3D scanner and calculated by the reverse engineering CAD suite Geomagic. The method for the quantification of the microclimatic volume is adopted from the study by Psikuta et al. [15, 25], differing in the overall volume quantification under third microclimatic layer scanning three male subjects. The determination of air gap thickness is usually done on stationary manikins using advanced 3D scanning and post-processing methods, since processing 3D data of moving human body is still in its infancy. It requires the same post-processing procedure to get the 3D animation even when using multiple high-quality 3D scanners to capture all sides of the moving object and temporal-3dMD systems [29].
Although few started investigating the triple-layer composite arrangements for reducing thermal burden [6, 30], studies covering the three-layered ensembles with outerwear garments are rarely reported. This study investigates the impact of the walking on the decrease of thermal insulation in accordance with the volume of the air trapped inside the clothing microclimate formed under the outerwear layers (three-layered ensembles) and afterward the comfort state of subjects.
2 Materials and test methods
The objective testing methods were covered in the first part of the experimental study. This involved the material testing, the jacket construction, the 3D scanning, the scan preparation, and the thermal manikin testing. Previous studies on the microclimatic volume affecting the clothing insulations were mostly obtained with manikin stationary [9, 20, 27, 28, 31]. However, since the ventilation when walking forces the insulation reduction ([12, 32, 33, 34, 35, 36]), the multidisciplinary approach with moving thermal manikin was used.
The second part of the experimental study covered the wear trials with the subjective judgments expressed by the human subjects and simultaneous evaluation of physiological parameters. The human subjects, dressed into selected ensembles, were scanned in the 3D scanner. After scan post-processing, the clothing’s area and the volume were computed. Since Psikuta et al. [25] proved the low variability of the air gap thickness and such variability leading to less than 1% change in the thermal resistance of the air gap beneath the garment, only the overall volume of microclimatic air layer was measured.
In this study, the impact of the microclimatic air volume on the overall insulation value was tested under dynamic condition in order to fully understand the impact of the air currents and ventilation of the air inside the clothing microclimate on the insulation decrease due to the corresponding bellows effect set to motion during walking.
2.1 Objective measuring methods
2.1.1 Material testing and clothing selection
The three-layered laminate was used to produce the outer shell. It consisted of the 100% polyester (PES) as outer layer and inner lining and the middle layer was polytetrafluorethylene (PTFE) membrane protected with polyurethane (PU) particles. The 100% PES fabric was used as lining, while the underlying garments were composed of 100% cotton (such as jeans trousers and shirts) and produced in size 50.
The material testing was performed as follows:
Mass per unit area according to ISO 3801 [37]
Thickness (h) according to ISO 5084 [38]
Air permeability (AP) according to ISO 9237 [39]
Water vapor resistance (Ret) and thermal resistance (Rct) according to ISO 11092 at relative humidity (RH) = 60% (1993) [40].
Table 1 summarizes the structural and physical characteristics of the materials used to produce the selected garments [41].
Structural and physical characteristics of materials selected for jacket production and garments [41]
| Selected materials | Mass per unit area (g/m2) | H (mm) | AP (l/m2s) | Ret (m2Pa/W) | Rct (m2K/W) |
|---|---|---|---|---|---|
| Jacket outer fabric being a three-layer laminate in twill weave | 189.20 | 0.3800 | 0 | 9.3767 | 0.0706 |
| Jacket lining in plain weave | 54.58 | 0.0776 | 121.4 | 10.0148 | 0.0677 |
| Knitted fabric for undershirts | 157.14 | 0.8636 | 1895.2 | 8.6573 | 0.1151 |
| Knitted fabric for underpants | 134.19 | 0.7347 | 1121.2 | 7.9647 | 0.1124 |
| Fabric for shirts in plain weave | 121.28 | 0.4557 | 331.8 | 7.3747 | 0.0839 |
| Jeans fabric in twill weave | 425.62 | 1.1287 | 48.4 | 11.1716 | 0.0985 |
The underwear composed of 100% cotton was used to provide good moisture wicking with minimal heat retention in mild-to-cool ambient conditions in order to avoid eventual discomfort during wear trials since the cotton fibers are breathable and absorbent and thus provide feeling of comfort while wearing such fabrics in close contact with body [42, 43]. The jackets as outerwear garments have greater values of the ease allowances added and correspondingly provide greater microclimatic volume, which will foster an increase in forced convection. Thus, the four variants of the male bomber jacket were constructed by CAD Lectra Systemes and produced from the same materials, differing from one to another in the amount of the ease allowance added strictly to the chest (100 cm) and the waist circumference (82 cm) as proposed by Amirova and Sakulina [44], leaving all the other dimensions unaffected (the shoulder seam, the neck opening, the hip circumference, the length of the sleeves, and the length of the jacket; Table 2). Large ease allowances were added according to studies by Moll and Wright [45], who deduced the maximum value of chest expansion while breathing of 11.8 cm for males aged 25–34 years, and Myers-McDevitt [46], who stated that more than 20.32 cm of ease should be added to chest circumference for loose-fitting garment. The jackets’ chest circumference varied from 122 to 126 cm, while waist circumference varied from 118 to 134 cm [41].
Values of the chest circumference, the waist circumference, and the area of pattern parts of the produced male bomber jackets [41]
| Measurement designation | Dimensions (cm) | |||
|---|---|---|---|---|
| Jacket variant | CG 1 | CG 2 | CG 3 | CG 4 |
| Chest circumference (cm) | 122 | 126 | 134 | 138 |
| Ease allowance value added to chest circumference (cm) | 22 | 26 | 34 | 38 |
| Waist circumference (cm) | 118 | 122 | 130 | 134 |
| Ease allowance value added to waist circumference (cm) | 36 | 40 | 48 | 52 |
| Pattern part | Area (cm2) | |||
| Back | 3410 | 3463 | 3563 | 3619 |
| Lower part of the sleeve | 874 | 874 | 953 | 991 |
| Upper part of the sleeve | 1428 | 1428 | 1428 | 1428 |
| Front | 1419 | 1444 | 1494 | 1523 |
| Total area of the jacket (cm2) | 10852 | 10955 | 11313 | 11503 |
The abbreviation used in the paper to describe jacket variant is CG, while the abbreviation for entire clothing ensemble is CE.
The area of the lower part of the sleeve changed according to the slight changes in the depth of the armhole, following the extension of the chest girth. The area of each pattern part was calculated using the 2D/3D Optitex software. Between jacket variant CG 1 and CG 2, the increase in the ease allowance was 18.2%. The increase in the ease allowance between jackets CG 2 and CG 3 was 30.8% and between CG 3 and CG 4 the ease allowance value increased by 11.7%. The initial area calculation of each pattern part was shown in order to compare the results with Geomagic Verify calculations on whole garments.
The above-described garments (undershirt, underpants, shirt, jeans, socks) and jackets formed the testing ensembles, where the ensembles varied only in the jacket variant added. The clothing ensemble CE 0 is the control ensemble without the jacket added to the combination. The ensemble CE 1 had jacket variant CG 1 added, ensemble CE 2 had jacket variant CG 2 added, ensemble CE 3 had jacket CG 3 added, and ensemble CE 4 had CG 4 jacket added.
2.1.2 The 3D quantification of the microclimatic volume
The procedure of the quantification of the microclimatic volume, formed between the layers of garments, initially started by the 3D laser body scanning the human subjects. The scanner used is Vitus Smart (Human Solutions GmbH). First, the subjects were scanned in a tight underwear in order to quantify the initial volume of the human body. Afterward, the scanning of subjects dressed in the selected clothing ensembles in an upright standing position was conducted. The latter step was performed in order to quantify the overall volume of each selected clothing ensemble.
Since the scanning technology enables the polygonal mesh generation thus reducing the point cloud data without compromising the surface quality, the rendering and determination of volume and surface area can be obtained [47]. The scanned human subjects were imported by the Geomagic Design X software in the obj. format, and the multiple scans were simultaneously processed, aligned, combined into a single fused mesh, and finally reconstructed manually through stages to restore many of the surface features of the clothing complicated geometry. The Geomagic Design X software is used as a powerful 3D CAD tool for the scan modeling, design, engineering, and preparation for the manufacturing.
The stages of the manual scan processing involve healing defects, reconstruction of the mesh features using the remaining polygons, re-meshing and rewrapping, and finally the surface smoothing. After the scans have been edited and processed manually, they are finished by the mesh buildup wizard option and exported to the Geomagic Verify to calculate the volume and the area.
2.1.3 Thermal insulation measurements
The dry heat loss was measured performing the manikin test at the constant skin temperature [9, 19, 28, 33, 36, 48].
The official international standard applied during thermal manikin measurements proposes specific climatic conditions inside climatic chamber and measuring protocol [49]. Since, the air temperature should be set at 12° below the manikin’s mean surface temperature, the ambient air temperature inside the climatic chamber was set to ta = 20 ± 0.2°C with the spatial variations not exceeding ± 1°. The RH was set to 30–70% with the spatial variations not exceeding ± 10%, and the air speed was set to va = 0.4 ± 0.1 m/s with the spatial variations not exceeding ± 50% of the mean value within 0.5 m of the manikin surface. The system should always reach the steady-state conditions and constant values before the testing.
The walk of the thermal manikin simulates the usual human walking rate with the arms and the legs moving in a counter phase under the walking speed of 0.95 m/s (corresponds to 45 ± 2 double steps/arm movements per minute). At the beginning of each manikin trial, the nude manikin test was conducted to test the resistance of the air layer. After the jackets’ insulation was determined in static conditions, the ensembles’ insulation was measured in both static and dynamic conditions. The dynamic conditions refer to the thermal manikin moving, while the static conditions refer to the thermal manikin stationary. The duration of a single thermal manikin measurement was 20 minutes, providing 240 single values in order to automatically calculate the average values of the effective thermal insulation.
According to ISO 15831 [49], the thermal insulation values can be expressed as the effective and total thermal insulation in the static and dynamic conditions. The Iclu is the jackets’ effective thermal insulation, It is the total jacket's thermal insulation value, and Icle is the effective thermal insulation of the ensemble, acquired by the resting thermal manikin. Icler is the effective thermal insulation of the ensemble, and Itr is the total thermal insulation of the ensemble, acquired by the thermal manikin moving [49].
2.2 Wear trials: subjective judgments and physiological data
The thermal manikin imitates an adult male with the height of 185 cm and chest girth of 100 cm, and correspondingly three male subjects of resembling body proportions were scanned and laboratory trials were performed. The subjects of the same age (23 years), with the height of 184 cm, chest girth ranging from 98 to 102 cm, and body mass varying from 77 to 79 kg, were scanned in compliance to ISO 13402 – 3 [50] and ISO/TR 10652 [51]. Since thermal manikins are designed for steady-state measurements, they do not work well under transient environmental conditions [52] and the human subjects were employed as evaluators of the clothing thermal quality during short-term test trials [53]. Simultaneously, the skin temperature and RH were measured for Li's study during environmental transients, pointed to the relation between the comfort perception to the skin temperature and microclimatic RH [54].
After scanning, the same subjects conducted a series of the laboratory trials according to ISO 10551 [55]. The subjects did one trial at the time in specific set of conditions throughout all three phases and were exposed to three sets of the climatic conditions to better correspond to the real conditions of wearing selected garments in the different cool and the moderate workplace environments.
The wear trials are important in order to define a range of ambient temperatures in which clothing can be worn. The basic intention of the produced jackets is to give the appropriate thermal protection under cool environments. The clothing's effective thermal insulation (Icle) is required to have a minimum value of 0.190 m2/KW and resultant effective thermal insulation (Icler) of 0.170 m2K/W in order to protect against cool environments [56], with ambient temperatures −5°C < ta < 15°C [57]. The three sets of the climatic conditions varied in the value of the air temperature (ta), while the RH = 50% and the air speed (va=1.2 m/s) remained the same. In the climatic condition A, air temperature was set to 20°C (in order to test the thermal comfort felt by humans in warmer environments and to compare the results to the standardized values of the climatic conditions during the thermal manikin testing), in B it was set to 15°C, and in C to 10°C (in order to simulate the cool environments).
The wind speed of 1.2 m/s was chosen since Havenith et al. [12] proved that the windup to 4 m/s has a small effect on the intrinsic clothing insulation, because it does not penetrate materials and thus does not disturb the entrapped air layers.
In this study, different activities (walking and resting) and ensembles (CE 2 to CE 5) were combined to examine the insulation values and the subjective judgments. During each laboratory trial, which lasted for altogether for 70 minutes and was divided into three phases, the questionnaires were filled thrice, at the end of each trial phase, under artificially designed ambient conditions (A, B, or C) in the computer-controlled climatic chamber (Figure 1).

Phases of wear trials
The cold exposure starts with a cooling period of 20–40 minutes, since the heat content of the body tissues is reduced, particularly the skin and the extremities. For the calculation of the heat balance and for some comparisons between conditions and the heart rate were averaged over 10 and 20 minutes during the subjective ratings. The purpose of the selected time interval for averaging was to describe the most constant phases of each experiment and to reduce the effects of small variations during the period [58]. The thermal equilibrium is then restored for the values of the mean skin temperature.
Special questionnaire was developed, and the subjects were asked to fill it during trials. The objective of the questionnaire was to determine the influence of the thermal environment and the clothing on the overall thermal state of the subjects in the transient conditions. The answers to the questions were given in the form of the evaluative judgment scale which is one pole scale consisting of 5°, where 0 stands for point of origin and 1, 2, 3, and 4 are degrees describing intensity. Grade 0 was taken as the complete comfort and corresponds to the satisfaction of 100%, while grade 4 corresponds to 0% of satisfaction or a complete lack of comfort felt by the subject. The grades have only positive values.
The physiological parameters have been measured simultaneously. The physiological reactions during wear trials can be objectively measured as a change of the physiological parameters or perceived subjectively, based on the assessment of the thermal comfort using the subjective judgment scales [55].
In order to validate the evaporation of the sweat from the surface of the skin, a body mass loss (Δmsw) due to sweating was calculated according to ISO 9886 [59]:
where Δmg is the gross body mass loss (kg), Δmsw is the body mass loss due to sweat loss during the time interval (kg), Δmres is the body mass loss due to evaporation in the respiratory tract (kg), Δmo is the mass loss due to the mass difference between carbon dioxide and oxygen (kg), Δmwat is the mass variation of the body due to intake and excretions of water (kg), Δmso is the mass variation of the body due to intake and excretions of solids (kg), Δmclo is the mass variation due to variation of clothing or sweat accumulation in the clothing (kg).
The evaluation of the thermal strain due to sweat loss was calculated as an amount of sweat evaporated from the body and condensed into the clothing. The overall amount of sweat excreted was calculated from the difference in the gross body mass of the test subjects (Δmg), the mass variation due to variation of clothing or to sweat accumulation in the clothing (Δmclo), and the amount of sweat evaporated to the environment. The electronic scale TPT3 (Libela, Celje) with the accuracy of ±2g was used to measure the garment’s weight, and the electromechanical scale E 2100/5 (Libela, Celje) with accuracy of ±5 g was used to measure the subject’s weight. Since there was no intake of fluids or food and no excretions of urine or solids, the mass variation of the body due to intake and excretions of water (Δmwat) and the mass variation of the body due to intake and excretions of solids (Δmsol) were equal to 0. The body mass loss due to evaporation in the respiratory tract (Δmres) and the mass loss due to the mass difference between carbon dioxide and oxygen (Δmo) were calculated on the basis of the average metabolic rate (M = 115 W/m2 under walking phase and 60 W/m2 under resting phase) [60], the respiratory quotient (R = 0.80), and the DuBois and DuBois body area (2.029 m2) [61].
The measurement of body temperature is another important parameter to determine the thermal state of the human body [62] but implies the maintenance of body temperature within relatively narrow limits [63]. When the mean skin temperature falls below 31°C, discomfort occurs as the effect of cooling in the cold [64]. Another study by Liz et al. concluded even higher values of the mean skin temperature of resting person who feels thermal comfort. The mean skin temperature of 32.6°C is the limit between cool discomfort and comfort, and 33.7°C is the limit between comfort and warm discomfort [65].
The mean skin and the skin’s RH were deduced by a modular signal recorder MSR 12 (MSR Electronics GmbH, Switzerland). The average or the mean skin temperature (tsk) was measured at the skin’s surface with 8 external digital waterproof temperature sensors encased in an epoxy (the working range −40 to 125°C, the resolution 0.0625°C, the accuracy ±0.5°C at −10 to 85°C). Although accurate measurement of the body temperature with temperature sensors encased in an epoxy is less precise [66], noninvasive measuring methods were used. The accumulation of moisture to clothing was measured during trials by weighting clothing before and after trials, since during activities human body starts sweating. The evaporated sweat penetrates the fabric [67] in close contact with the skin and can cause the subjects to feel uncomfortable [68].
The mean skin temperature is the mean value of the skin over the whole body according to ISO 9886 [59], and the weighting scheme according to 8 measuring points was selected. It was calculated by weighting each of the local temperatures with the coefficients corresponding to the relative surface of the body area that each measuring point represented [59]:
2.3 Statistical analysis
The statistical analysis was performed using MS Excel and the statistical software STATISTICA. The average mean skin’s temperature (tsk [°C]) and the average skin’s RH (RHsk [%]) between different climatic conditions and for the selected clothing ensembles were calculated.
The statistical analysis of each scale was assigned by the standard ISO 10551 [55]. Since this is the preliminary research of the volume impact on the insulation of the three-layered clothing, only three subjects were chosen to perform wear trials.
The percentage of judgments expressing discomfort was calculated for the answered questions. The values have been converted to the percentage and analyzed. Since Li’s study [24] pointed to the relation between the comfort perception to skin a temperature and microclimatic RH during environmental transients, the multiple regression analysis was performed.
The correlation was performed between the percentage of judgments expressing discomfort and the thermal state.
The multiple regression analysis was performed to analyze the connection between the percentage of judgments expressing discomfort (Dex [%]), the mean skin temperature (tsk [°C]) and skin’s (RHsk [%]). The similar analysis was done to compare the mutual influence of the ensemble’s microclimatic volume (Vml [dm3]) on the effective thermal insulation of clothing ensemble in static conditions (Icle [m2 K/W]) or in dynamic conditions (Icler [m2 K/W]) and the percentage of judgments expressing discomfort (Dex [%]).
3 Results and discussion
3.1 Volume calculations and their impact on the effective thermal insulation values
The Geomagic Verify Viewer software following the scan reconstruction calculated the volumes and the surface areas of the naked body and the clothed body. As summarized in Table 3, the volume (VCE) and the area (ACE) of the selected clothing ensembles were calculated initially, and later the increase in the ease allowance value in comparison to jacket CG 1 was calculated, while Table 4 summarizes the volume of the microclimatic air layer under the selected clothing ensembles (VML,CE) and jackets (VML,CG). The average (
 ) and standard deviation (σ) values are summarized in Tables 3 and 4 as calculated by previous study [31].
Calculation of the overall ensemble volume (VCE), the overall ensemble area (ACE) using the Reverse Engineering software Geomagic Verify Viewer together with calculated average (
) and standard deviation (s) values
| Scanned object | Statistics | VCE (dm3) | ACE (m2) |
|---|---|---|---|
| Naked body | | 78.58 | 1.95 |
| s | 0.0205 | 0.0094 | |
| Body dressed in CE 0 (no jacket is added as outer garment) | | 97.83 | 2.26 |
| s | 0.0544 | 0.0125 | |
| Body dressed in CE 1 (jacket variant CG 1 added as outer garment) | | 109.34 | 2.32 |
| s | 0.0321 | 0.0102 | |
| Body dressed in CE 2 (jacket variant CG 2 added as outer garment) | | 111.39 | 2.36 |
| s | 0.0267 | 0.0055 | |
| Body dressed in CE 3 (jacket variant CG 3 added as outer garment) | | 112.15 | 2.40 |
| s | 0.0163 | 0.0125 | |
| Body dressed in CE 4 (jacket variant CG 4 added as outer garment) | | 112.69 | 2.43 |
| s | 0.0090 | 0.0060 |
Calculation of the microclimatic air volume for the selected jackets (VML,CG) and clothing ensembles (VML,CE) using the Reverse Engineering software Geomagic Verify Viewer together with calculated average (
) and standard deviation (s) values
| Jacket variant | Increase in ease allowance (%) | VML,CG (dm3) | Clothing ensemble | VML,CE (dm3) |
|---|---|---|---|---|
| – | – | – | CE 0 | 19.25 |
| CG 1 | – | 11.51 | CE 1 | 30.76 |
| CG 2 | 18.2 | 13.56 | CE 2 | 32.81 |
| CG 3 | 54.6 | 14.32 | CE 3 | 33.57 |
| CG 4 | 72.7 | 14.86 | CE 4 | 34.11 |
As summarized in Table 3, the average overall ensemble volume is much bigger than previously reported [4, 69, 70], but do roughly correspond to study done by McQuerry et al. [71], although this study was done on three-layer combinations for fire protection with much bigger ease allowances added. This was expected since most of the studies do not report the measurements for three-layered ensembles.
The results listed in Table 4 also point to much bigger values of the microclimatic air volume than previously reported by any other studies [24, 27].
There was a small difference in the calculated volume (VCE) and the area (ACE) between the clothing ensembles CE 2, CE 3, and CE 4. This is due to fabric folding and overlapping, regardless of the actual ease allowance value added to the jacket construction [20]. Fabric drape of the textile materials is directly related to the sense of fullness and graceful appearance of a garment during wear [72]. Loose-fitting clothing provides a larger surface area as well as a greater clothing microenvironment volume [73], but provides more draping. When compared to the area of the pattern parts as summarized in Table 2, there is a distinguished difference between the area of the scanned jackets and the area of the two-dimensional (2D) patterns. This difference is the consequence of overlapping and wrinkling of the fabric when the garments are worn over the body.
Since previous studies verified the strong influence of wind and human moving on the thermal insulation value of clothing, the insulation values were compared between static (thermal manikin standing) and dynamic conditions (thermal manikin moving).
The average total and effective insulation values, together with the calculated variance (s2), for the selected clothing garments, are summarized in Table 5. The maximum thermal insulation with the thermal manikin stationary was measured for jacket’s microclimatic volume of 13.56 dm3 [31].
Calculation of the average total and effective insulation value for the selected clothing garments together with the calculated variance (s2)
| Jacket variant |  |  | s2 |
|---|---|---|---|
| CG 1 | 0.1472 | 0.0728 | 5.05×10−05 |
| CG 2 | 0.1569 | 0.0826 | 7.66×10−05 |
| CG 3 | 0.1561 | 0.0817 | 4.80×10−05 |
| CG 4 | 0.1510 | 0.0766 | 1.93×10−05 |
The average total and effective insulation values, together with the calculated variance (s2), for the selected clothing ensembles are summarized in Table 6. For ensembles’ microclimatic volumes up to 33.57 dm3 in static [31] and up to 30.76 dm3 in dynamic conditions, the insulation enlargement was measured as summarized in Table 6. There was an obvious change in the insulation value due to the effects of walking.
Calculation of the average total and effective insulation value for the selected clothing ensembles together with the calculated variance (s2)
| Ensemble variant | |  | s2 |  |  | s2 |
|---|---|---|---|---|---|---|
| CE 0 | 0.4042 | 0.0627 | 1.25×10−04 | 0.3814 | 0.0591 | 3.69×10−05 |
| CE 1 | 0.6052 | 0.0938 | 2.01×10−04 | 0.5002 | 0.0775 | 7.97×10−05 |
| CE 2 | 0.6094 | 0.0945 | 2.79×10−04 | 0.4862 | 0.0754 | 1.27×10−04 |
| CE 3 | 0.6165 | 0.0956 | 2.50×10−04 | 0.4953 | 0.0768 | 5.66×10−05 |
| CE 4 | 0.6100 | 0.0945 | 3.67×10−04 | 0.4943 | 0.0766 | 5.21×10−05 |
For microclimatic volume of 33.57 dm3 formed under ensembles with corresponding 14.32 dm3 of air volume formed under jacket, the maximum thermal insulation in static conditions was measured [31]. For dynamic conditions, the maximum insulation was measured for ensemble's microclimatic volume of 30.76 dm3 (with 11.51 dm3 of air volume under jacket). The jacket with smallest microclimatic volume provided 5.2–13.5% less insulation than wider jackets with larger microclimatic volume.
The ensembles’ insulation ranged 0.0938 < Icle < 0.0956 and 0.0754 < Icler < 0.0775, thus pointing to conclusion that subjects will start to feel discomfort during rest when exposed to lower ambient temperatures (10°C and 15°C).
The ensembles with tighter jackets added as the outerwear garments showed 0.74–1.9% less insulation in static conditions [31] and 0.9–2.7% more insulation in dynamic conditions. The ensembles’ insulation increased by 49.6–52.4% with jacket added on top of underlying garments in static conditions and by 27.6–31.1% in dynamic conditions. There was a significant fall in the effective thermal insulation values of the ensembles in static and dynamic conditions.
The increase in the ease allowance value caused simultaneous air volume amplification in the microclimatic area. The percentage of the volume and insulation increase for ensembles was calculated in comparison to nude body as shown in Figure 2.

The percentage of the increase for the microclimatic volume and the effective thermal insulation of the ensembles
Between CG 1 and CG 2, there was an increase in the ease allowance for 18.2%, which caused ensemble's microclimatic volume increase by 17.3% (CE 2) and this volume enlargement accounted for 51.8% increase in ensemble's insulation value during rest and for 26.45% insulation increase in dynamic conditions. Additional ease allowance increase in jackets in amount of 36.4% (between CG 2 and CG 3) caused the overall ensemble's volume enlargement for another 0.97% (between CE 2 and CE 3) and the corresponding insulation increase by 1.81% in static conditions and by 2.28% in dynamic conditions. Further 18.1% ease allowance increase between jackets CG 3 and CG 4 caused the overall ensemble's volume increased by 0.69% (CE 4), thus providing ensemble's insulation decrease by 1.7% in static conditions and 0.24% insulation decrease in dynamic conditions. In other words, the enlargement of the microclimatic volume causes the insulation increase in both jackets and ensembles up to a certain critical point. It also causes corresponding ensembles’ insulation decrease with the thermal manikin moving.
The correlation analysis showed moderate positive linear relationship between the volume of ensembles to effective thermal insulation measured at static conditions (r = 0.7) but weak negative linear relationship to effective thermal insulation measured at dynamic conditions (r = −0.44).
The effective thermal insulation value was reduced by 20.98% between the standing and moving manikins for CE 1. For CE 2, the reduction in the effective thermal insulation in dynamic conditions in comparison to the static conditions was 25.34%. The overall reduction in insulation value decreased from 25.34% to 24.48% for CE 3, and even further insulation reduction to 23.41% was shown for CE 4.
If the main intention is to provide the smaller reduction in the effective thermal insulation value during activities, increase in the ease allowance of the outerwear clothing should be either smaller than 47% or bigger than 153% if we presume the value of ease allowance in amount of 15 cm to be the reference point. The highest effective thermal insulation value was observed for the jacket's ease allowance value of 34 cm with thermal manikin stationary. However, in dynamic conditions, with the thermal manikin moving, the highest effective thermal insulation value was recorded for jacket with 22 cm of the ease allowance added. The smaller the increase in the ease allowance value, the smaller the reduction in the effective thermal insulation in dynamic conditions.
3.2 Wear trials: the subjects’ physiological data and grade analysis
The physiological data, recorded simultaneously during the wear trials in controlled simulated laboratory environments, are important mean by which the ergonomist can control whether or not the subjects feel comfortable during testing. They also test the influence the different human sensations on the overall thermal comfort perception under different activity levels and different environment conditions. In this section, the mean temperature and the RH of skin are analyzed. The secreted sweat was also calculated in order to see the average body mass loss and sweat accumulation into clothing during actual clothing usage. The average mean skin temperature and RH were calculated for each climatic condition, worn ensemble, and trial phase separately.
The average mean skin's temperature values (tsk [°C]) for each subject's dresses in selected clothing ensembles are shown in Figure 3 during all trial phases in different climatic conditions. In the climatic condition A with the highest ambient temperature of 20°C, the average value of the mean skin temperature at rest was 32.10°C, at first walking phase was 32.25°C and 31.84°C at second walking phase. With the drop of the ambient temperature for 5° in the climatic condition B, the average mean skin values decreased for about 0.91° in the first phase, for about 1.23° in the second and 1.67 in the third phase. With further drop of the ambient temperature for another 5°, the mean skin temperature in the first phase decreased for about 0.31°, for about 0.57° in the second and 0.85 in the third phase. The mean skin temperature generally ranged from minimum 28.52°C to maximum 33.65°C in the climatic condition C, from 29.03°C to 34.09°C in the climatic condition B, and from 29.61 to 33.30°C in the climatic condition A.
![Figure 3 The average mean skin's temperature (tsk [°C]) and variances (s2) for each ensemble during all trial phases in different climatic conditions](/document/doi/10.2478/aut-2019-0016/asset/graphic/j_aut-2019-0016_fig_003.jpg)
The average mean skin's temperature (tsk [°C]) and variances (s2) for each ensemble during all trial phases in different climatic conditions
Since the mean skin value of 30–32°C is considered comfortable, pointing to conclusion that subjects are exposed to neutral comfort zone. This also points to conclusion that the perceptual adaptation was fully achieved at ambient temperature of 20°C. When the mean skin temperatures falls below 31°C, discomfort occurs [64] as seen with temperature decrease in phases 2 and 3 at ambient temperature of 15°C and through all phases at ambient temperature of 10°C.
Generally, the highest mean skin temperature values were recorded for CE 4 at the climatic condition A during all three phases. In the climatic conditions B and C, the highest recorded values of the mean skin temperature were while wearing CE 1. Generally, conditions, the highest mean skin temperatures, were recorded at the first walking phase during all climatic conditions.
The recorded values of the skin's RH are presented in Figure 4. The highest values of RH were recorded for the climatic condition A, especially at the resting phase while the second highest values of the humidity were measured in the coldest environment during the first walking phase. Overall, the highest recorded values were shown for CE 2 in the climatic condition A, for CE 3 in the climatic condition B and CE 4 in the climatic condition C.
![Figure 4 The average skin's relative humidity (RHsk [%]) and variances (s2) for each ensemble during all trial phases in different climatic conditions](/document/doi/10.2478/aut-2019-0016/asset/graphic/j_aut-2019-0016_fig_004.jpg)
The average skin's relative humidity (RHsk [%]) and variances (s2) for each ensemble during all trial phases in different climatic conditions
In the climatic condition A with the highest ambient temperature of 20°C, the average value of the skin's RH at rest was 77.8%, 75.6% at first walking phase and 74.0% at second walking phase. With the drop of the ambient temperature for 5° in the climatic condition B, the average skin's RH values decreased for about 22.1% in the first phase, for about 26.4% in the second and 31.6% in the third phase. With further drop of the ambient temperature for another 5°, the skin's RH started increasing for about 11.7% in the first walking phase, for about 13.8% in the second and 16.3% in the third phase.
The values of the body mass loss due to sweating were also calculated (Figure 5), but the measurements were taken after each trial, so the values were not given for each phase separately. The highest values of the body mass loss due to sweating were calculated for CE 4 in the climatic conditions A (203.6 g) and C (188.9 g) as expected since the measured values of the mean skin temperature and RH were also high.

Calculation of the average body mass loss due to sweating (Δmsw) with the average difference in ensemble’s weight (Δmcl) shown as numeric value for the selected clothing ensembles
The garment's weight was measured before subjects entered climatic chamber and after they completed trials. The average difference in total ensemble's weight points to sweat accumulation into clothing which is particularly pronounced at lower ambient temperatures as shown in Figure 5. Under coolest climatic conditions, the skin's RH increased, causing subjects to accumulate sweat into their clothing, especially while wearing tighter jackets.
The subjects filling-in questionnaires expressed no or little dissatisfaction with the environmental conditions or the clothing. The grades leaning toward discomfort were shown for the lowest ambient temperature at resting phase although the subjects stated that the thermal environment is generally acceptable considering the grades given to question 3. The grades are in the range of the thermal neutrality. The slight discomfort was determined only for the clothing ensembles CE 1 and CE 3 (Figure 6).
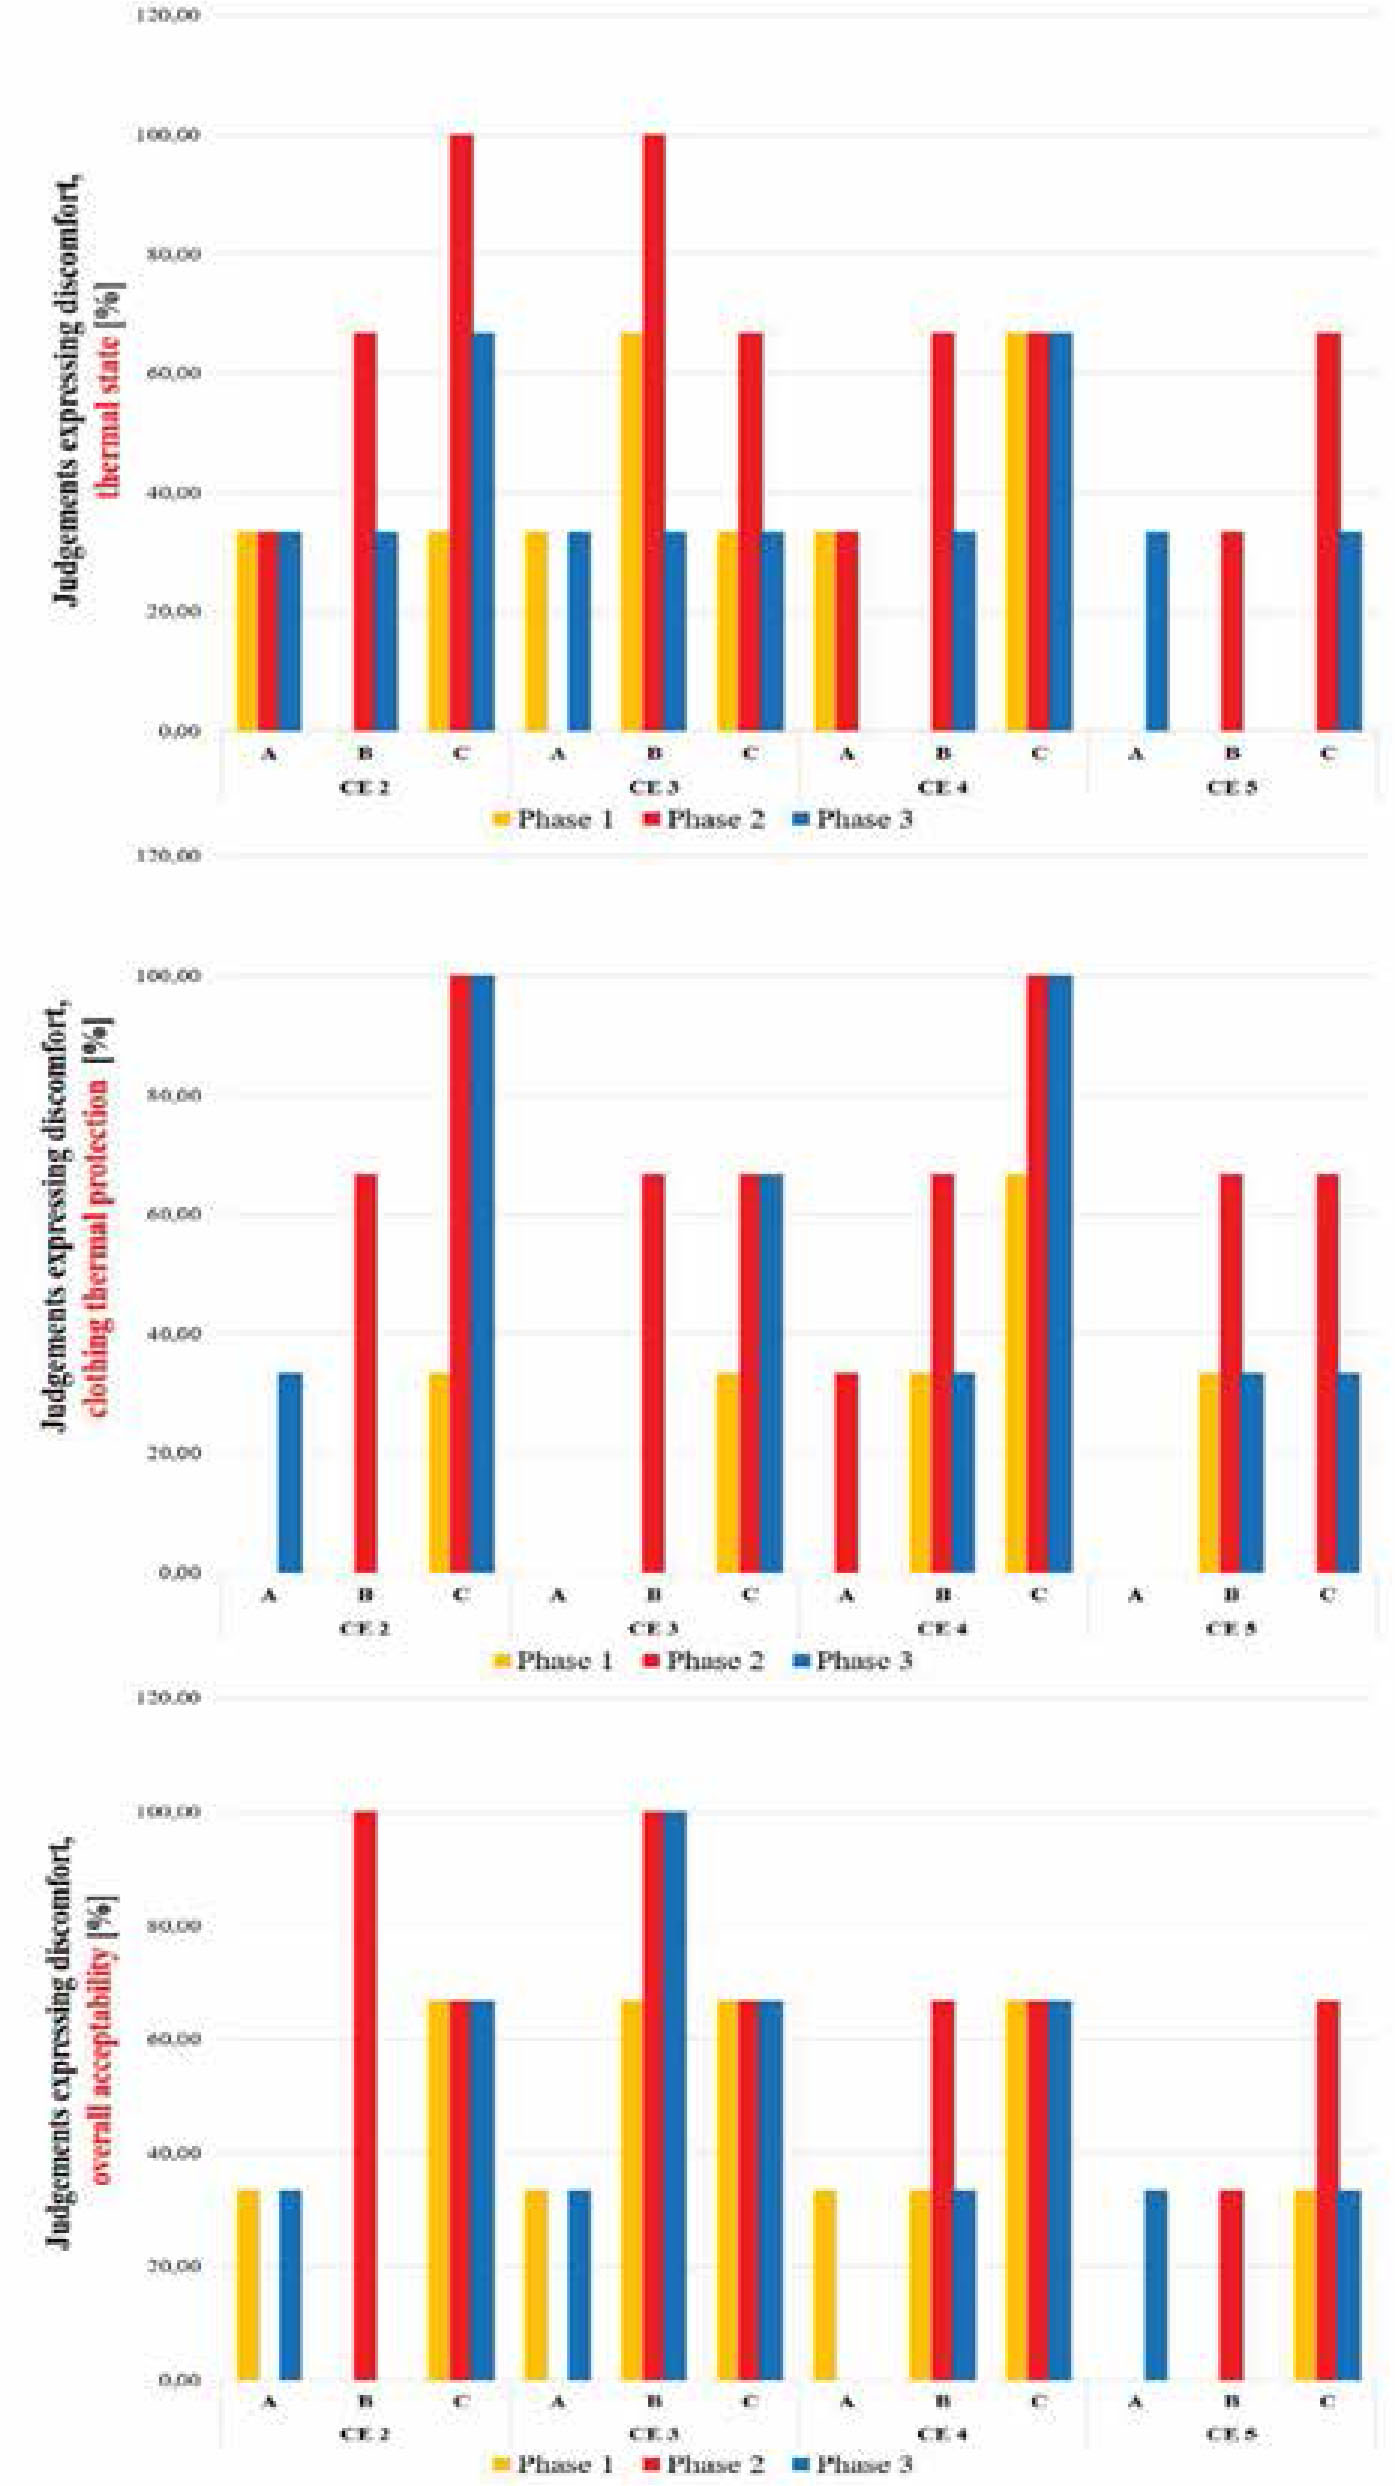
The percentage of judgments expressing discomfort with the thermal state (question 1), the thermal protection provided by the clothing (question 2), and the overall acceptability (question 3)
Generally, the highest grades were given while wearing CE 4 (the outerwear was jacket with the highest value of the ease allowance and consequently the greatest volume of the microclimatic air layer inside the ensembles). The lowest grades were displayed for CE 1 and 3. When sweat starts to condense into clothing, it will cause the subjects to feel uncomfortable.
The subjects exposed to lower ambient temperatures (the ambient conditions B and C) gave lower grades to the ensembles with the tighter jackets. Although CE 4 did not have the highest value of the effective thermal insulation in the dynamic conditions, it was judged as the best clothing ensemble by the subjects in the climatic conditions C (ta = 10°C).
The percentage of judgments expressing discomfort was calculated for the questions 1, 2, and 3. The highest percentage of judgments expressing discomfort was given under the climatic conditions B and C in the resting phase (phase 2) for all of the questions, especially for CE 1 and CE 2. There was almost no or negligible percentage of dissatisfied subjects in the first walking phase under all environmental conditions except while wearing CE 3 under the condition C. In the third walking phase, the highest percentage of judgments expressing discomfort was found for CE 1 and CE 3 under the condition C (Figure 6). The highest percentage of the comfort was given for CE 4 throughout all the climatic conditions. As previously reported, discomfort occurs when the mean skin temperature falls below 31°C. Decrease in the mean skin temperature below that value was accompanied with a higher percentage of judgments expressing discomfort during exposures to cool environments.
The percentage of judgments expressing discomfort with the thermal state negatively correlates with ensemble's volume through all phases of trials and all climatic conditions. Strong negative linear relationship was proven during resting phase at ta = 10°C (r = −0.9). Moderate linear relationship during resting phase at ta = 10°C was also proven to effective thermal insulation measured at static (−0.7) and dynamic conditions (0.8).
Since Li's study [24] pointed to the relation between the comfort perception to skin a temperature and microclimate RH during environmental transients, the multiple regression analysis was performed. It showed that 42.43% of the variation to the percentage of judgments expressing discomfort (Dex [%]) with the clothing thermal protection is explained by the variation of the skin's (RHsk [%]) and the mean skin temperature (tsk [°C]):
In order to compare the results and to examine the relationship between several independent and criterion variables, the multiple regression analysis has been performed. The criterion variable was the percentage of judgments expressing discomfort (Dex [%]). Since the multiple regression can be used to find relationship between variables, the comparison was performed to the measured values of the microclimatic volume (Vml [dm3]), the effective thermal insulation of clothing ensemble in static conditions (Icle [m2 K/W]), and the effective thermal insulation of clothing ensemble in dynamic conditions (Icler [m2 K/W]).
From Table 8, the observed F-test statistics for all comparisons has the p-value (significant F) greater than 0.05, except in the case of climatic condition A when comparing the percentage of judgments expressing discomfort to the measured values of the microclimatic volume and the effective thermal insulation of clothing ensemble in static conditions. Since the p-value is not less than 0.05, we do not reject the null hypothesis that the regression parameters are zero at significance level 0.05. We reject the null hypothesis only in the abovementioned example and can conclude that the regression parameters are not zero at significance level 0.05.
Multiple regression summary
| Climatic condition | A | B | C | A | B | C |
|---|---|---|---|---|---|---|
| Comparing Dex to | Icler and Vml | Icler and Vml | Icler and Vml | Icle and Vml | Icle and Vml | Icle and Vml |
| Multiple R | 0.93 | 0.92 | 0.69 | 0.99 | 0.38 | 0.97 |
| R2 | 0.8674 | 0.8522 | 0.4730 | 0.9981 | 0.1422 | 0.9420 |
| Adjusted R2 | 0.60 | 0.56 | −0.58 | 0.99 | −1.57 | 0.83 |
| Standard error | 5.72 | 15.25 | 20.96 | 0.69 | 36.75 | 6.95 |
| F-value | 3.27 | 2.88 | 0.45 | 259.8 | 0.08 | 8.12 |
| Significant F | 0.36 | 0.38 | 0.73 | 0.04 | 0.93 | 0.24 |
Summary of multiple regression parameters
| Coefficients | Estimated standard deviation | t-statistic | p-value | |
|---|---|---|---|---|
| Climatic condition A | ||||
| Intercept | 198.89 | 366.25 | 0.54 | 0.68 |
| Vml | −5.72 | 2.50 | −2.28 | 0.26 |
| Icler | 141.82 | 4212.36 | 0.03 | 0.99 |
| Climatic condition B | ||||
| Intercept | 2365.88 | 976.39 | 2.42308 | 0.25 |
| Vml | −11.18 | 6.68 | −1.6738 | 0.34 |
| Icler | −25635.51 | 11229.89 | −2.28279 | 0.26 |
| Climatic condition C | ||||
| Intercept | −373.57 | 1341.55 | −0.27846 | 0.83 |
| Vml | −4.69 | 9.17 | −0.51151 | 0.69 |
| Icler | 7578.55 | 15429.76 | 0.491165 | 0.71 |
| Climatic condition A | ||||
| Intercept | −297.13 | 62.20 | −4.77673 | 0.13 |
| Vml | −7.89 | 0.38 | −21.0435 | 0.03 |
| Icle | 6115.20 | 740.96 | 8.25308 | 0.08 |
| Climatic condition B | ||||
| Intercept | −686.50 | 3319.64 | −0.21 | 0.87 |
| Vml | −8.14 | 20.03 | −0.41 | 0.75 |
| Icle | 10462.04 | 39543.32 | 0.26 | 0.84 |
| Climatic condition C | ||||
| Intercept | −1721.02 | 627.97 | −2.74 | 0.22 |
| Vml | −15.0906 | 3.79 | −3.98 | 0.16 |
| Icle | 23984.72 | 7480.34 | 3.21 | 0.19 |
When observing the computed p-values of the regression parameters as summarized in Table 8, one can conclude that the parameters are jointly statistically insignificant at the significance level of 0.05 for most of the comparisons, although the percentage of the mutual influences are high. Only in the case of the climatic condition A, when comparing the values of the percentage of judgments expressing discomfort to the measured values of the microclimatic volume and the effective thermal insulation of clothing ensemble in static conditions, the observed coefficient of Vml has estimated the standard error of 0.38, t-statistic of −21.0435, and p-value of 0.03. It is therefore statistically significant at significance level a = 0.05 as p < 0.05.
The multiple regression of the ensemble's microclimatic volume (Vml [dm3]) to the effective thermal insulation of clothing ensemble in static conditions (Icle [m2 K/W])) and the percentage of judgments expressing discomfort (Dex [%]) shows that 99.8% of the variation of Dex is explained by the regression of Vml and Icle only for climatic condition A.
The observed results point to conclusion that this preliminary study should be further expanded involving more subjects to analyze the impact of the microclimatic air volume formed under the ensembles to the subjective judgments expressed by the subjects on the thermal comfort felt during wear trials and thermal insulation decrease due to movements.
4 Conclusions
The aim of this study is to present the preliminary data on the impact of the microclimatic volume expansion under outerwear garments on the overall ensemble's thermal insulation and human satisfaction under walking. The previous studies covering the three-layered ensembles were not reported; thus, this study covered the ensembles accompanied by jackets of different fit, as the outerwear garments, to investigate the impact of the microclimatic volume on the ensembles’ thermal insulation. It came to light that additional air volume created by the outerwear does indeed dominates the overall ensembles’ thermal properties, especially during walking.
The impact of the microclimatic air volume on the overall insulation value was tested under dynamic condition. The insulation decrease under dynamic conditions proved that the impact of the air currents and ventilation of the air inside the clothing microclimate is much bigger under greater values of the microclimatic air layers. The prediction is that the observed insulation decrease is due to pronounced bellows effect set to motion during walking, especially with greater microclimatic volumes.
Thermal insulation of the ensembles increased by 49.6–52.4% with the jacket added as the outerwear garment in static conditions and by 27.6–31.1% in dynamic conditions. The overall ensembles insulation reduction in dynamic conditions ranged from 21% to 25%, affirming that the loose-fitting ensembles entrap more air thus showing the larger effect of the movement when compared to the tight-fitting ensembles [12]. The thermal insulation decreased significantly due to walking, which was more pronounced with higher values of the microclimatic air layers trapped inside the jacket's microclimate.
The smaller the increase in the jacket's microclimatic volume provides the smaller the reduction in the effective thermal insulation in dynamic conditions. However, the jacket with the smallest microclimatic volume provided 5.2–13.5% less insulation than wider jackets with larger microclimatic volume. In general, the ensembles with tighter jackets showed 0.74–1.9% less insulation in static conditions [31] and 0.9–2.7% more insulation in dynamic conditions. The percentage of judgments expressing discomfort with the thermal state negatively correlates with ensemble's volume through all phases of trials and all climatic conditions pointing to conclusion that the comfort state of subjects was greatly influenced with the jacket's fit. It also points that measured thermal insulation values are not high enough to provide adequate thermal protection during resting phases and lower ambient temperatures.
This paper verified that the increase in the ease allowance, and simultaneously the size of an air gap quantified as overall microclimatic volume, induces increase in the effective thermal insulation value up to a certain threshold volume. The main novelty of the study is that the microclimatic volume value, after which the thermal insulation begins to decrease as a result of convection, is greater than previously reported by other authors. The limiting value is greater than previously reported by Li et al. [24] and Zhang and Li [27], but proved MacRea's report that the outerwear and additional air spaces appear to dominate the overall thermal properties of clothing ensembles (2011).
The ensembles’ insulation enlargement was measured for microclimatic volumes up to 33.57 dm3 in static [31] and up to 30.76 dm3 (volume of 11.51 dm3) in dynamic conditions. Although the ensemble with tighter jacket had the highest measured insulation, subjects declared greater discomfort in colder environments. It points to conclusion that the persons deduce their satisfaction on both the clothing's insulation and wearing comfort. However, evidence is lacking for other types of outerwear garments and more research is needed. Future research should investigate larger selection of outerwear models, subjects, and body postures to provide better understanding on the impact of the microclimatic volume formed under the outerwear garments and the impact on human thermal comfort.
Acknowledgments
This work is a part of a PhD work of the first author. On behalf of all the authors, the corresponding author states that there is no conflict of interest.
Competing interests
The authors declare that they have no competing interests.
References
[1] Taya, Y., Ohno, S., Mihira, K. (1982). Measurements of the clothing microclimate volumes (part I) – a method of measurement of clothing microclimate volumes and its evaluation. Journal of Home Economics of Japan, 33(7), 374–379, DOI: 10.11428/jhej1951.33.374.Search in Google Scholar
[2] Parkova, I., Vilumsone, A. (2011). Microclimate of smart garment. Scientific Journal of Riga Technical University, 6, 99–103Search in Google Scholar
[3] Özdemir, H. (2017). Thermal comfort properties of clothing fabrics woven with polyester/cotton blend yarns. AUTEX Research Journal, 17(12), 135–14110.1515/aut-2016-0012Search in Google Scholar
[4] Daanen, H., Hatcher, K., Havenith, G. (2002). Determination of clothing microclimate volume. In: Proceedings of the 10th International Conference on Environmental Ergonomics. Tochihara, Y., Ohnaka. T. (Ed.). Kyushu Institute of Design (Fukuoka, Japan), 665–668.Search in Google Scholar
[5] Mert, E., Böhnisch, S., Psikuta, A., Bueno, M.-A., Rossi, R. M. (2016). Contribution of garment fit and style to thermal comfort at the lower body. International Journal of Biometeorology, 60(12), 1995–2004, DOI: 10.1007/s00484-016-1258-0.Search in Google Scholar PubMed
[6] McQuerry et al. (2018)Search in Google Scholar
[7] Frackiewicz-Kaczmarek, J., Psikuta, A., Bueno, M.-A., Rossi, R. M. (2015). Effect of garment properties on air gap thickness and the contact area distribution. Textile Research Journal, 85(18), 1907–1918. doi: 10.1177/0040517514559582.Search in Google Scholar
[8] Frackiewicz-Kaczmarek, J., Psikuta, A., Bueno, M.-A., Rossi, R. M. (2015). Air gap thickness and contact area in undershirts with various moisture contents: influence of garment fit, fabric structure and fiber composition. Textile Research Journal, 85(20), 2196–2207, DOI: 10.1177/0040517514551458.Search in Google Scholar
[9] Lee, Y., Hong, K., Hong, S. A. (2007). 3D quantification of microclimate volume in layered clothing for the prediction of clothing insulation. Applied Ergonomics, 38, 349–355.10.1016/j.apergo.2006.04.017Search in Google Scholar PubMed
[10] Spencer-Smith, J. L. (1977). The physical basis of clothing comfort, part 2: Heat transfer through dry clothing assemblies. Clothing Research Journal, 5(1), 3–17.Search in Google Scholar
[11] Nielsen, R., Olesen, B. W., Fanger, P. O. (1985). Effect of physical activity and air velocity on the thermal insulation of clothing. Ergonomics, 28(12): 1617–1631, DOI: 10.1080/00140138508963299Search in Google Scholar PubMed
[12] Havenith, G., Heus, R., Lotens, W. A. (1990). Resultant clothing insulation: a function of body movement, posture, wind, clothing fit and ensemble thickness. Ergonomics, 33(1), 67–84.10.1080/00140139008927094Search in Google Scholar
[13] Havenith, G. (2002). The interaction of clothing and thermoregulation, Exogenous Dermatology 1(5): 221–230.10.1159/000068802Search in Google Scholar
[14] Morrissey, M. P., Rossi, R. M. (2013). The effect of wind, body movement and garment adjustments on the effective thermal resistance of clothing with low and high air permeability insulation. Textile Research Journal, 84(6), 583–592, DOI: 10.1177/0040517513499431.Search in Google Scholar
[15] Psikuta, A., Mert, E., Annaheim, S., Rossi, R. M. (2018). Local air gap thickness and contact area models for realistic simulation of human thermo-physiological response. International Journal of Biometeorology, 62(7), 1121–1134. doi: 10.1007/s00484-018-1515-5.Search in Google Scholar PubMed
[16] Clark, R. P., de Calcina-Goff, M. L. (2009). Some aspects of the airborne transmission of infection. Journal of the Royal Society Interface, 6(6), 767–782.10.1098/rsif.2009.0236.focusSearch in Google Scholar PubMed PubMed Central
[17] Ersting's Aviation Medicine, Fourth edition. (2006). Rainford, D. J., Gradwell, D.P. (Ed.). Hodder Education (London, UK), ISBN 978-0-340-81319-5.10.1201/b13238Search in Google Scholar
[18] Havenith, G. (2005). Clothing heat exchange models for research and application. In: Proceedings of 11th International Conference on Environmental Ergonomics. Holmer, I., Kuklane, K., Gao, C. (Ed.). Lund University (Ystad, Sweden), 66–73.Search in Google Scholar
[19] International Encyclopaedia of Ergonomics and Human Factors, Volume 1, 2nd edition. (2006). Karwowski, W. (Ed.). CRC Press, Taylor & Francis Group (Florida, USA), ISBN 978-0-415-30430-6.Search in Google Scholar
[20] Mert, E., Psikuta, A., Bueno, M.-A., Rossi, R. M. (2015). Effect of heterogenous and homogenous air gaps on dry heat loss through the garment. International Journal of Biometeorology, 59, 1701–1710, DOI: 10.1007/s00484-015-0978-x.Search in Google Scholar PubMed
[21] Studies in Environmental Science 10: Bioengineering, thermal physiology and comfort. (1981). Cena, K., Clark, J.A. (Ed.). Elsevier Scientific Publishing Company (Amsterdam, The Netherlands), ISBN 0-444-99761-X.Search in Google Scholar
[22] Mert, E., Böhnisch, S., Psikuta, A., Bueno, M. A. (2015). Determination of the air gap thickness underneath the garment for lower body using 3D body scanning. In: Proceedings of the 6th International Conference on 3D Body Scanning Technologies. D’Apuzzo, N. (Ed.). Homometrica Consulting (Lugano, Switzerland), 114–119.10.15221/15.114Search in Google Scholar
[23] MacRea, B. A., Laing, R. M., Wilson, C. A. (2011). Importance of air spaces when comparing fabric thermal resistance. Textile Research Journal, 81(19), 1962–1965, DOI: 10.1177/0040517510395995.Search in Google Scholar
[24] Li, J., Zhang, Z., Wang, Y. (2013). The relationship between air gap sizes and clothing heat transfer performance. The Journal of the Textile Institute, 104(12), 1327–1336, DOI: 10.1080/00405000.2013.802080.Search in Google Scholar
[25] Psikuta, A., Frackiewicz-Kaczmarek, J., Frydrych, I., Rossi, R. M. (2012). Quantitative evaluation of air gap thickness and contact area between body and garment. Textile Research Journal, 82(14), 1405–1413, DOI: 10.1177/0040517512436823.Search in Google Scholar
[26] Zhang, Z.-H., Li, J. (2010). The relationship of garment fit and thermal comfort. In: TBIS 2010 - Textile Bioengineering and Informatics Symposium Proceedings. Li, Y., Qui, Y. P., Luo, X. N., Li, J. - S. (Ed.). Textile Bioengineering and Informatics Society Limited (Hong Kong), 1–3, 1333–1337, ISSN 1942 – 3438.Search in Google Scholar
[27] Zhang, Z., Li, Y. (2011). Volume of air gaps under clothing and its related thermal effects. Journal of Fiber Bioengineering & Informatics, 4(2), 137–144.10.3993/jfbi06201104Search in Google Scholar
[28] Zhang, Z., Li, J., Wang, Y. (2015). Improving garment thermal insulation property by combining two non – contact measuring tool. Indian Journal of Fibre and Textile Research, 40, 392–398.Search in Google Scholar
[29] Mert, E., Psikuta, A., Arévalo, M., Charbonnier, C., Luible-Bär, C., Bueno, M.-A., Rossi, R. M. (2018). A validation methodology and application of 3D garment simulation software to determine the distribution of air layers in garments during walking. Measurement, 117, 153–164, DOI: 10.1016/j.measurement.2017.11.042.Search in Google Scholar
[30] Jussila, K., Kekäläinen, M., Simonen, L., Mäkinen, H. (2015). Determining the optimum size combination of three-layered cold protective clothing in varying wind conditions and walking speeds: thermal manikin and 3D Body Scanner Study. Journal of Fashion Technology & Textile Engineering, 3(2), DOI: 10.4172/2329-9568.1000120.Search in Google Scholar
[31] Špelić, I. (2018). Changes in Ensembles’ Thermal Insulation According to Garment's Fit and Length Based on Athletic Figure. Fibers and Polymers 2018, 19(6), 1278–1287, DOI 10.1007/s12221-018-1074-8Search in Google Scholar
[32] Holmér, I., Gavhed, C. E., Grahn, S., Nilsson, H. O. (1992). Effects of wind and body movements on clothing insulation – measurement with a moveable thermal manikin. In: Proceedings of the 5th international conference on environmental ergonomics. Lotens, W., Havenith, G. (Ed.), TNO-Intstitute of Perception (Soesterberg, The Netherlands), 66–67, ISBN 90-6743-227-X.Search in Google Scholar
[33] Holmér, I., Nilsson, H., Meinander, H. (1996). Evaluation of clothing heat transfer by dry and sweating manikin measurements. In: Performance of protective clothing, fifth volume, ASTM 1237. Johnson, J. S., Mansdorf, S. Z. (Ed.). American Society for Testing and Materials International (Philadelphia, USA).10.1520/STP14080SSearch in Google Scholar
[34] Holmér, I., Nilsson, H. O., Anttonen, H. (2002). Prediction of wind effects on cold protective clothing. In: RTO HFM Symposium on “Blowing Hot and Cold: Protecting Against Climatic Extremes”, RTO/NATO (Neuilly-sur-Seine Cedex, France), ISBN 92-837-1082-7.Search in Google Scholar
[35] Lim, J., Choi, H., Roh, E. K., Yoo, H., Kim, E. (2015). Assessment of airflow and microclimate for the running wear jacket with slits using CFD simulation. Fashion and Textiles, 2 (1), DOI: 10.1186/s40691-014-0025-2Search in Google Scholar
[36] Wagner, A., Dorawa, P. (2016). Research on biophysical properties of protective clothing. AUTEX Research Journal, 16(4), 236–240.10.1515/aut-2016-0030Search in Google Scholar
[37] ISO 3801:1977 Textiles - Woven fabrics - Determination of mass per unit length and mass per unit area. ISO-International Organization for Standardization, 1977Search in Google Scholar
[38] ISO 5084:1996 Textiles - Determination of thickness of textiles and textile products. ISO-International Organization for Standardization, 1996Search in Google Scholar
[39] ISO 9237:1995 Textiles – Determination of the permeability of fabrics to air. ISO-International Organization for Standardization, 1995Search in Google Scholar
[40] ISO 11092:1993 Physiological effects – Measurement of thermal and water – vapour resistance under steady – state conditions (Sweating guarded – hotplate test). ISO-International Organization for Standardization, 1993.Search in Google Scholar
[41] Špelić, I. (2016). Impact of construction parameters on thermal properties of clothing. Ph.D. Thesis. University of Zagreb, Faculty of Textile Technology (Zagreb, Croatia)Search in Google Scholar
[42] Stanković, S. B., Popović, D., Poparić, G. B. (2008). Thermal properties of textile fabrics made of natural and regenerated cellulose fibers. Polymer Testing, 27, 41–4810.1016/j.polymertesting.2007.08.003Search in Google Scholar
[43] Pan, N., Gibson, P. (Ed.). (2006). Thermal and moisture transport in fibrous material. Woodhead Publishing Ltd. (Cambridge, United Kingdom), ISBN 978-1-84569-057-1.Search in Google Scholar
[44] Amirova, Z. K., Sakulina, O. V. (1985). Izgotovlenie spetsialnoi i sportivnoi odezhdy. Legprombytizdat (Moskva, Russia).Search in Google Scholar
[45] Moll, M. J., Wright, V. (1972). An objective clinical study of chest expansion. Annals of the Rheumatic Diseases, 31(1), 1–8.10.1136/ard.31.1.1Search in Google Scholar PubMed PubMed Central
[46] Myers-McDevitt, P. J. (2009). Complete guide to size specification and technical design. Fairchild Books (New York, United States of America).Search in Google Scholar
[47] Yoon, S.-H., Lee, J. (2016). Computing the surface area of three-dimensional scanned human data, Symmetry, 8 (67), DOI: 10.3390/sym8070067Search in Google Scholar
[48] Zhang, Z. H., Wang, Y., Li, J. (2011). Model for predicting the effect of an air gap on the heat transfer of a clothed human body. Fibres & Textiles in Eastern Europe, 19(4), 105–110.Search in Google Scholar
[49] ISO 15831:2004 Clothing - Physiological effects - Measurement of thermal insulation by means of a thermal manikin. ISO-International Organization for Standardization, 2004.Search in Google Scholar
[50] ISO 13402 - 3:2004 Size designation of Clothes, Part 3: Measurements and intervals, ISO - International Organization for Standardization, 2004.Search in Google Scholar
[51] ISO/TR 10652:1991 Technical report: Standard sizing system for clothes, 1st ed. ISO - International Organization for Standardization, 1991.Search in Google Scholar
[52] McCullough, E. A. (2009). Evaluation of cold weather clothing using manikins, ch. 11. In: Textiles for cold weather apparel. Woodhead Publishing in Textiles: No. 93. Williams, J.T. (Ed.). Woodhead Publishing Ltd. (Cambridge, United Kingdom), 244–255, ISBN 978-1-84569-411-1.10.1533/9781845697174.2.244Search in Google Scholar
[53] Lotens, W. A., Havenith, G. (1991). Calculation of clothing insulation and vapour resistance. Ergonomics, 34 (2), 233–254, DOI: 10.1080/00140139108967309Search in Google Scholar
[54] Li, Y. (2005). Perceptions of temperature, moisture and comfort in clothing during environmental transients. Ergonomics, 48(3), 234–248, DOI: 10.1080/0014013042000327715.Search in Google Scholar PubMed
[55] ISO 10551:2001 Ergonomics of the thermal environment - Assessment of the influence of the thermal environment using subjective judgment scales, ISO - International Organization for Standardization, 2001.Search in Google Scholar
[56] Protective Clothing: Managing Thermal Stress. (2014). Woodhead Publishing Series in Textiles: No. 154. (2014). Wang, F., Gao, C. (Ed.). Woodhead Publishing Ltd. (Cambridge, United Kingdom), ISBN 978-1-78242-032-3.Search in Google Scholar
[57] ISO 14058:2004 Protective clothing - Garment for protection against cool environments. ISO-International Organization for Standardization, 2004.Search in Google Scholar
[58] Gavhed, D. (2003). Human response to cold and wind. NR 2003:4. National Institute for Working Life & authors (Stockholm, Sweden).Search in Google Scholar
[59] ISO 9886:2004 Ergonomics-Evaluation of thermal strain by physiological measurements, ISO-International Organization for Standardization, 2004.Search in Google Scholar
[60] ASHRAE Handbook Fundamentals (SI ed.). Atlanta, United States of America: American Society of Heating, Refrigerating, and Air Conditioning Engineers Inc. (2005). ISBN 1931862702.Search in Google Scholar
[61] Du Bois, D., Du Bois, E.F. (1916). A formula to estimate the approximate surface area if height and weight be known. Archives of Internal Medicine, 17(6), 863–871, DOI: 10.1001/archinte.1916.00080130010002.Search in Google Scholar
[62] Niedermann, R., Psikuta, A., Rossi, R. M. (2014). Prediction of body temperature in humans using noninvasive measurement methods. International Journal of Biometeorology. 58(1), 7–15, DOI: 10.1007/s00484-013-0687-2.Search in Google Scholar PubMed
[63] Boguslawska-Baczek, M., Hes, L. (2013). Effective water vapour permeability of wet wool fabric and blended fabrics. Fibres & Textiles in Eastern Europe, 21(1), 67–71.Search in Google Scholar
[64] Lotens, W. A. (1988). Comparison of thermal predictive models for clothed humans. ASHRAE Transactions, 91, 1321–1340.Search in Google Scholar
[65] Liz, W., Lian, Z., Deng, Q. (2015). Use of mean skin temperature in evaluation of individual thermal comfort for a person in a sleeping posture under steady thermal environment. Indoor and Built Environment, 24 (4), 489–499.10.1177/1420326X14527975Search in Google Scholar
[66] Lenhardt, R., Sessler, D.T. (2006). Estimation of mean – body temperature from mean – skin and core temperature. Anesthesiology, 105(6), 1117–1121.10.1097/00000542-200612000-00011Search in Google Scholar PubMed PubMed Central
[67] Hes, L., Ursache, M. (2011). Effect of composition of knitted fabrics on their cooling efficiency at simulated sweating. Short Communication. Indian Journal of Fibre & Textile Research, 36, 281–284.Search in Google Scholar
[68] Ilmarrinen, R., Tammela, E. (1997). Functional cold protective clothing – a combination of many properties. In: Report of 4th seminar on personal protective equipment in Europe. Jurvelius, H. (Ed.). Finnish Institute of Occupational Health (Kittilä, Finland), 137–144.Search in Google Scholar
[69] Lu, Y., Song, G., Li, J. (2014). A novel approach for fit analysis of thermal protective clothing using three-dimensional body scanning. Applied Ergonomics, 45(6), 1439e–1446.10.1016/j.apergo.2014.04.007Search in Google Scholar PubMed
[70] Wang, F., Peng, H., Shi, W. (2016). The relationship between air layers and evaporative resistance of male Chinese ethnic clothing. Applied Ergonomics, 56, 194–202, DOI: 10.1016/j.apergo.2016.04.005.Search in Google Scholar PubMed
[71] McQuerry, M., DenHartog, E., Barker, R. (2016). Evaluating turnout composite layering strategies for reducing thermal burden in structural firefighter protective clothing systems. Textile Research Journal, 87(10), 1217–1225, DOI: 10.1177/0040517516651101.Search in Google Scholar
[72] Ng, S. F., Hui, C. L., Tam, F. Y. (2002). Analysis of fabric drape and garment drape. Research Journal of Textile and Apparel, 6(2), 65–74, DOI: 10.1108/RJTA-06-02-2002-B006Search in Google Scholar
[73] Kakitsuba, N., Michna, H., Mekjavić, I. B. (1987). Clothing surface area as related to body volume and clothing microenvironment volume. Aviation, Space and Environmental Medicine, 58(5), 411–416.Search in Google Scholar
[74] Improving comfort in clothing. (2011). Song, G. (Ed.). Woodhead Publishing Ltd. (Cambridge, United Kingdom), ISBN 9781845695392.10.1533/9780857090645Search in Google Scholar
[75] Jhanji, Y., Gupta, D., Kothari, V. K. (2015). Thermo-physiological properties of polyester–cotton plated fabrics in relation to fibre linear density and yarn type. Fashion and Textiles, 2(16), DOI: 10.1186/s40691-015-0041-x.Search in Google Scholar
[76] Psikuta, A., Frackiewicz-Kaczmarek, J., Mert, E., Bueno, M. A., Rossi, R. M. (2015). Validation of a novel 3D scanning method for determination of the air gap in clothing. Measurement 67, 61–70, DOI: 10.1016/j.measurement.2015.02.024.Search in Google Scholar
© 2020 Ivana Špelić et al., published by Sciendo
This work is licensed under the Creative Commons Attribution-NonCommercial-NoDerivatives 4.0 International License.
Articles in the same Issue
- Fuzzy Logic Method for Predicting the Effect of Main Fabric Parameters Influencing Drape Phenomenon
- The Study on Effects of Walking on the Thermal Properties of Clothing and Subjective Comfort
- A Study on Improving Dyeability of Polyester Fabric Using Lipase Enzyme
- The Impact and Importance of Fabric Image Preprocessing for the New Method of Individual Inter-Thread Pores Detection
- Influence of Tensile Stress on Woven Compression Bandage Structure and Porosity
- Application of Silica Aerogel in Composites Protecting Against Thermal Radiation
- Multicriteria Decision-Making in Complex Quality Evaluation of Ladies Dress Material
- A Study of the Consumption of Sewing Threads for Women's Underwear: Bras and Panties
- Study of the Properties and Cells Growth on Antibacterial Electrospun Polycaprolactone/Cefuroxime Scaffolds
- How High-Loft Textile Thermal Insulation Properties Depend on Compressibility
- Lyocell Fabric Dyed with Natural Dye Extracted from Marigold Flower Using Metallic Salts
- Evolution of Physicochemical Structure of Waste Cotton Fiber (Hydrochar) During Hydrothermal Carbonation
- Analysis of the Thermal Insulation of Textiles Using Thermography and CFD Simulation Based on Micro-CT Models
- Circular Fashion – Consumers’ Attitudes in Cross-National Study: Poland and Canada