Evaluation of the water soluble extractive of astragali radix with different growth patterns using 1H-NMR spectroscopy
-


Abstract
Astragali radix (AR), known in China as huangqi, is commonly used in traditional Chinese medicine. Water soluble extractive (WSE) values play an important role in the quality evaluation of herbal drugs. In this study, WSE of wild and cultivated AR were compared systematically. The WSE value of cultivated AR was significantly higher than that of the wild AR, and their UV-absorbance in the range of 250–400 nm was also different. The chemical compositions of different WSE were further compared by 1H NMR spectroscopy combined with multivariate analysis. Results from the principal component analysis and the hierarchical cluster analysis showed a clear separation between the WSEs of wild and cultivated AR. The differential metabolites responsible for the separation were identified by orthogonal projections to latent structures discriminant analysis and recursive support vector machine. The WSE of wild AR contained more arginine, valine, threonine, asparagine, succinate, and glutamine, while the cultivated AR contained more sucrose. Thus, the WSE can be used as a simple and reliable method for discrimination of wild and cultivated ARs, and the results obtained in this study extend the potential use of WSE in the quality evaluation of herbal drugs.
1 Introduction
Astragali radix (AR), known in China as huangqi, is a well-known traditional folk medicine, also used in other Asian countries such as Korea, Japan, Mongolia, and Siberia. It is derived from the dried root of Astragalus membranaceus (Fisch.) Bge. or A. membranaceus var. Mongholicus (Bge.), both of which belong to the Fabaceae family. Extensive pharmacological studies have shown that AR possesses immunostimulant, hepatoprotective, tonic, diuretic, antidiabetic expectorant, analgesic, and sedative properties [1–6]. In addition to medicinal use, AR is also used in nutraceutical products such as herbal teas, soft drinks, soups, and trail mixes [7].
AR is obtained from A. membranaceus growing either in the wild or in cultivation [8, 9]. In the Shanxi province of China, wild and cultivated A. membranceus are found in northern areas, including Hunyuan, Yingxian, and Wuzai. As the chemical compositions of the herbal drugs are always influenced by weather, geographic location, soil conditions, and cultivation patterns, ARs from wild and cultivated plants differ not only in appearance, but also in chemical compositions. The growth cycle for wild A. membranaceus is more than 5 years, but only 2 years for cultivated plants. The price and quality of wild AR is much higher than cultivated AR. Due to the increasing demands for wild AR, the alteration of cultivated AR is frequently encountered in the market place.
Bioactive chemical components present in herbal drugs can be dissolved in solvents, such as water, ether, and alcohol. For AR, the water soluble extractive (WSE) value should be no less than 17%, according to the Chinese Pharmacopoeia [10]. However, due to the limited information that can be provided by the WSE content value, chemical comparison between drugs cannot be further conducted. As the WSE is a complex mixture of diverse compounds, a technique able to cover a wide range of metabolites should be used. Previously, Ma et al. [11] have used HPLC analysis of isoflavonoids and astragalosides to identify AR adulterants. An NMR-based fingerprint approach coupled with multivariate analysis can provide a wealth of qualitative and quantitative information for the components present in a complex mixture, and have been used to analyze a number of medicinal plants such as Tussilago farfara [12], Glycyrrhiza glabra [13], and Magnolia biondii [14].
In this study, the WSE value of wild and cultivated AR collected from Northern Shanxi province was determined, and their chemical composition was further compared by an NMR-based chemical fingerprinting approach alongside multivariate analysis. The results obtained will extend and prove the potential use of WSE in the quality evaluations of herbal drugs.
2 Materials and methods
2.1 Plant materials
Astragalus membranaceus plants were collected in two locations of North Shanxi Province, China, Hunyuan (39°72′N, 113°68′E) and Wuzhai (40°01′N, 113°21″E). All plant materials were authenticated by Prof. Xue-Mei Qin of Shanxi University, with the voucher specimens deposited in the herbarium in the Center of Modern Research for Traditional Chinese Medicine of Shanxi University, China. All samples were air-dried and ground into fine powder with a pestle and mortar for analysis. Three biological replicates were used in all experiments.
2.2 Solvents and chemicals
Deuterium oxide (D2O) was obtained from Merck (Darmstadt, Germany). Sodium 3-trimethlysilyl [2, 2, 3, 3-d4] propionate (TSP) was obtained from Cambridge Isotope Laboratories Inc. (Andover, MA, USA), and deuterated sodium hydroxide (NaOD) was purchased from Armar (Döttingen, Switzerland).
2.3 WSE value determination
The WSE values of AR were determined according to the procedures described in the appendix XA of Chinese Pharmacopoeia [10]. Four grams of air-dried, coarsely powdered material were transferred to a glass-stoppered conical flask. One hundred milliliters of H2O was added, and the flask was weighed. The flask was shaken for 6 h and then allowed to stand for 18 h. The contents were then filtered rapidly through a dry filter. Twenty milliliters of the filtrate was transferred to an evaporating dish of pre-determined weight, and evaporated in a water bath to dryness. The filtrate was dried at 105 °C for 3 h, cooled in a desiccator for 30 min, and then weighed as soon as possible. The percentage of WSE value was calculated with reference to the air-dried drug. Three replicates were used for all experiments.
2.4 UV absorption spectroscopy
Filtrates of the extract were diluted 25-fold for UV detection. Absorption spectroscopy was performed using a UV-Vis Spectrophotometer (Varian Cary 50, Agilent, Santa Clara, CA, USA) in the wavelength range from 250 to 800 nm. The raw data were transferred to a microcomputer and peaks were analyzed with software provided by the manufacturer.
2.5 Sample preparation for NMR and measurements
The above-obtained WSE (25 mg) was transferred into a 1.5 mL centrifuge tube, and 800 μL KH2PO4 buffer in D2O (adjusted to pH 6.0 by 1 N NaOD) containing 0.05% TSP was added. After centrifuging for 10 min at 16,060 g, the supernatant (600 μL) was transferred into a 5 mm NMR tube for NMR analysis. 1H-NMR spectra were recorded at 25 °C on a Bruker 600-MHz AVANCE III NMR spectrometer 600.13 MHz proton frequency (Billerica, MA, USA). D2O was used for internal lock purposes. 1H-NMR spectra were acquired using the 1D NOESY pulse sequence, and each 1H-NMR spectrum consisted of 64 scans, requiring 5 min acquisition time with the following parameters: 0.18 Hz/point, pulse width (PW) 12.7 μs, and relaxation delay (RD)=5.0 s. Free induction decay was Fourier transformed with LB=0.3 Hz. The resulting spectra were manually phased and baseline-corrected, and calibrated to TSP at 0.00 ppm.
2.6 Data analysis and quantification
The 1H-NMR spectra were processed using MestReNova (version 8.0.1, Mestrelab Research, Santiago de Compostella, Spain). The spectra were scaled to TSP and reduced into integrated regions of equal width (0.04 ppm) for the region of 0.00–10.00. The regions of 4.70–5.02 were excluded from the analysis because of the residual signal of H2O. Principal component analysis (PCA) and orthogonal projections to latent structures discriminant analysis (OPLS-DA) was performed with the SIMCA-P software (version 13.0, Umetrics, Umeå, Sweden) using the Pareto scaling method. A 7-fold cross validation of the OPLS-DA was applied to test and verify the model. Six of seven samples were used as a training set and the remaining were used as a testing set. To test the model, test samples were defined as unknown samples. This process was conducted seven times. Every sample was defined as a training and testing set, then R2 and Q2 were used for evaluating this model’s fitting and prediction ability [15–17]. Hierarchical cluster analysis (HCA) was performed in SPSS (version 11.5.0, USA). The imported data were then Pareto-scaled for the multivariate analysis. Recursive support vector machine (R-SVM) and heatmap were performed by MetaboAnalyst 2.0 (Edmonton, Alberta, Canada; www.metaboanalyst.ca), a comprehensive tool suite for analyzing metabolomic data. For the relative quantification, the peak areas of the TSP were integrated manually for all the samples as an internal standard for quantification of metabolites.
3 Results
3.1 WSE values
The water soluble extractive of AR should be no less than 17%, as stated in the Chinese Pharmacopoeia [10]. As can be seen in Table 1, the WSE value of cultivated AR is significantly higher than that of the wild AR (p<0.01).
Information on AR samples and their WSE values.
| No. | Specimen No. | Producing area | Growth years | Planting pattern | WSE (%) n=3 |
|---|---|---|---|---|---|
| 1 | HQ-SX-88 (WZC) | Shanxi Wuzhai | 2 | Cultivated | 37.36±1.99 |
| 2 | HQ-SX-92 (HYC) | Shanxi Hunyuan | 2 | Cultivated | 36.11±0.33 |
| 3 | HQ-SX-83 (WZW) | Shanxi Wuzhai | >5 | Wild | 33.04±0.58 |
| 4 | HQ-SX-91 (HYW) | Shanxi Hunyuan | >5 | Wild | 32.90±3.24 |
1, Cultivated AR of Shanxi Wuzhai (WZC); 2, cultivated AR of Shanxi Hunyuan (HYC); 3, wild AR of Shanxi Wuzhai (WZW); 4, wild AR of Shanxi Hunyuan (HYW). All samples were collected in the field.
3.2 UV-absorbance
Figure 1 illustrates the filtrates obtained from the preparation of WSE, with the color of wild AR very different from that of the cultivated AR. Comparison of their UV- absorbance in the range of 250–800 nm suggests that the UV-absorbance of wild AR between 250 and 400 nm is stronger than that of the cultivated AR (Figure 2), which can be used as a simple method to distinguish the wild and cultivated ARs.
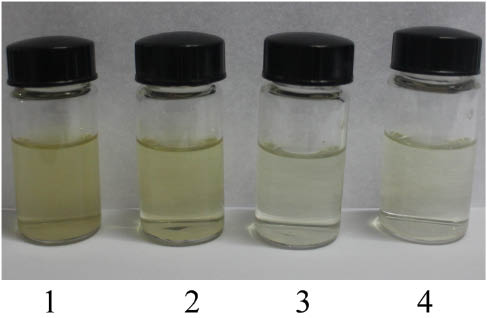
The filtrates of water soluble extractives (WSE) obtained from four groups of astragali radix (AR). 1, Wild AR of Shanxi Wuzhai (WZW); 2, wild AR of Shanxi Hunyuan (HYW); 3, cultivated AR of Shanxi Wuzhai (WZC); 4, cultivated AR of Shanxi Hunyuan (HYC).
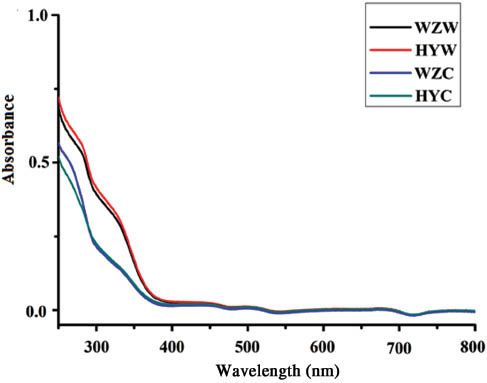
Absorbance of the filtrates of WSE in the range of 250–800 nm.
3.3 Metabolite identification
The representative 1H NMR spectra of four groups of WSE is shown in Figure 3. The compounds were identified by analysis of the chemical shift, coupling constant, and comparison with the authentic standards, as well as other reported data [18, 19]. Most of the metabolites identified in the WSE were primary metabolites such as sugars, amino acids, organic acids, choline, and adenine. Sucrose was the major compound in the WSE of four groups of AR. The identified compounds as well as the characteristic chemical shifts are listed in Table 2.
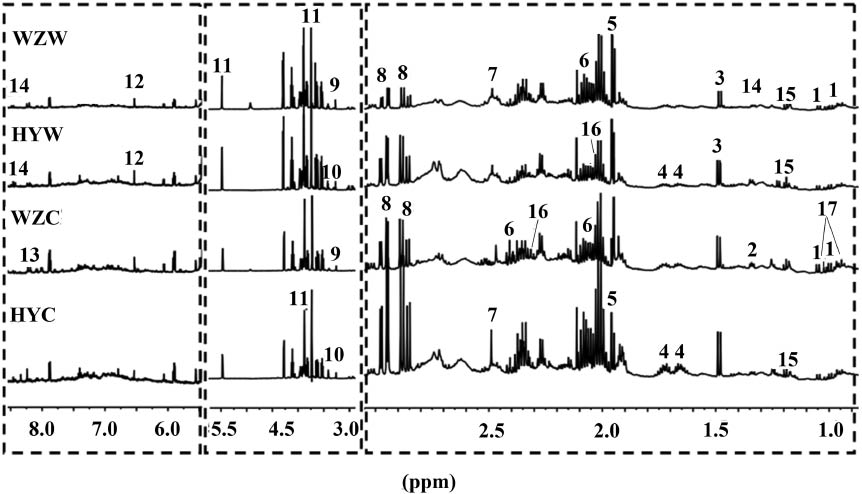
Representative 600 MHz 1H NMR spectra of WSE from the four groups of AR.
1H NMR assignments of major metabolites in WSE of astragali radix.
| Key | Metabolites | Moieties | δ1H (ppm) | Multiplicitya | J (Hz) | Number of Hs |
|---|---|---|---|---|---|---|
| 1 | Valine | γCH3 | 1.00 | d | 7.0 | 3H |
| γ′CH3 | 1.04 | d | 7.0 | 3H | ||
| 2 | Threonine | H5 | 1.34 | d | 6.6 | 1H |
| 3 | Alanine | βCH3 | 1.49 | d | 7.3 | 3H |
| 4 | Arginine | CH2 | 1.68 | m | 2H | |
| CH2 | 1.90 | m | 2H | |||
| 5 | Acetic acid | CH3 | 1.94 | s | 3H | |
| 6 | Glutamine | βCH2 | 2.15 | m | 2H | |
| γCH2, | 2.46 | m | 2H | |||
| 7 | Succinate | H2, H2′, H3, H3′ | 2.49 | s | 4H | |
| 8 | Asparagine | β′CH | 2.96 | dd | 3.7; 17.5 | 1H |
| βCH | 2.87 | dd | 8.8; 17.5 | 1H | ||
| 9 | Choline | N-(CH3)3 | 3.23 | s | 9H | |
| 10 | Taurine | CH2SO3 | 3.25 | t | 6.6 | 2H |
| CH2NH2 | 3.42 | t | 6.6 | 4H | ||
| 11 | Sucrose | α-D-Glc H1 | 5.42 | d | 3.8 | 1H |
| 12 | Fumaric acid | αCH | 6.53 | s | 2H | |
| 13 | Adenine | 7H | 8.22 | s | 1H | |
| 2H | 8.24 | s | 1H | |||
| 14 | Formic acid | CH | 8.46 | s | 1H | |
| 15 | 1-O-Ethyl-β-D-glucoside | CH3 | 1.20 | t | 7 | 3H |
| CH2 | 3.65 | m | 2H | |||
| 16 | Proline | γCH, γ′CH | 2.01 | m | 2H | |
| βCH | 2.04 | m | 1H | |||
| β′CH | m | 1H | ||||
| 17 | Isoleucine | δCH3 | 0.93 | t | 7.4 | 3H |
| γ′ | 1.00 | d | 7 | 3H |
aMultiplicity: s, Singlet; d, doublet; t, triplet; dd, doublet of doublets; ddd, doublet of doublet of doublets; m, multiplet.
3.4 Multivariate analysis
Because visual inspection indicated that the WSE of four groups of AR had very similar 1H NMR spectra, multivariate analysis was used to uncover any subtle differences among them. Principal component analysis (PCA), one of the most common multivariate analysis methods, was used first to identify differences or similarities among the samples. As seen in the score plot of PC1 versus PC2 (Figure 4) with a total 70.7% of variance explained, most of the wild AR were located in the negative range of the PC1, while most of the cultivated samples were located in the positive range of PC1. The cultivation patterns may have greater impact on the chemical composition of WSE than the growing regions. In addition to PCA, all samples were further analyzed by hierarchical cluster analysis (HCA), another unsupervised clustering method. An HCA dendrogram of all the samples was calculated using squared Euclidean distance methods, which grouped the samples into two clusters according to their growth patterns, and the results were consistent with that of the PCA analysis.
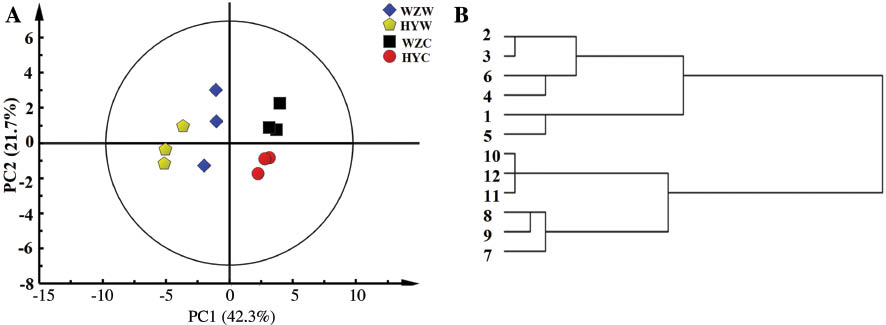
Score (PC 1 vs. PC 2) plot of PCA (A) and HCA (B) results obtained from 1H NMR spectra of the WSE from four groups of AR. 1–3, Wild AR of Shanxi Wuzhai (WZW); 4–6, wild AR of Shanxi Hunyuan (HYW); 7–9, cultivated AR of Shanxi Wuzhai (WZC); 10–12, cultivated AR of Shanxi Hunyuan (HYC).
Supervised methods, including partial least squared discriminant analysis (PLS-DA), orthogonal partial least squares discriminant analysis (OPLS-DA) and R-SVM were then applied to the same bucketed 1H NMR data to find the differential metabolites between the WSE of wild and cultivated AR. In the score plot of PLS-DA, clear separation between the two groups of AR was observed. In order to evaluate the validity of the model, permutation tests (permutation number: 200) were performed. All Q2 and R2 values were lower in the permutation tests than those in the real model, revealing great predictability and goodness of fit. OPLS-DA was then applied, and the R2 (0.709) and Q2 (0.96) values proved the good model quality (Figure 5A). Cross-validated analysis of variance further confirmed the validity of the model (p=0.024). The S-plot of OPLS-DA (Figure 5B) showed that the WSE of the wild AR contained higher levels of arginine, valine, threonine, asparagine, succinate, glutamine, and taurine, while the WSE of the cultivated AR contained a higher sucrose content.
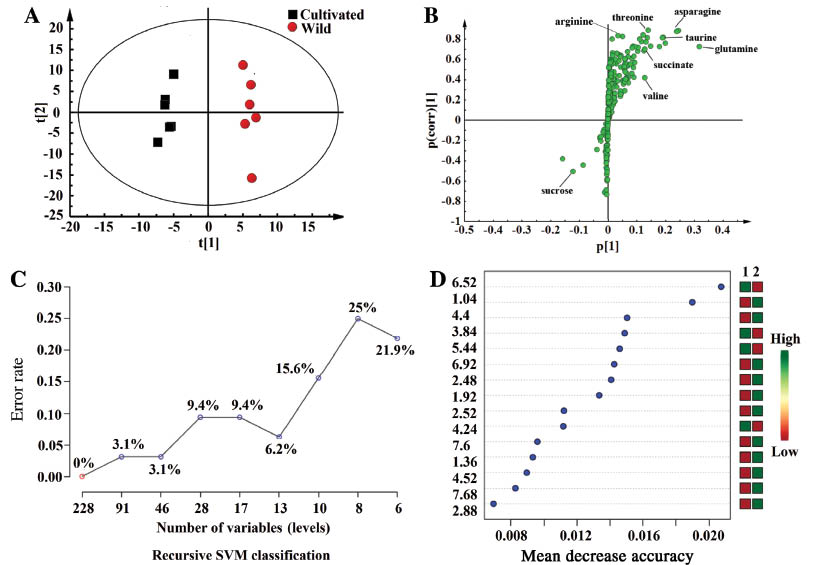
Scores plot (A), loadings plot (B), R-SVM classification plot (C) and variable importance plot (D) of the OPLS-DA and R-SVM analysis of NMR data of astragali radix.
R-SVM is a classification of different feature subsets, which are selected by their relative contribution to the classification using cross-validation error rates. This process creates a series of R-SVM models. The features used by the best model are plotted [20–22]. Figure 5C shows that when the number of feature subsets was 228, the error rate was 0%. The error rate increased to 0.03 when there were 46–91 feature subsets, suggesting that an NMR fingerprint can correctly distinguish WSE of wild and cultivated AR. As seen in Figure 5D, integrated regions were mostly occupied by the characteristic peaks of valine, threonine, arginine, glutamine, succinate, asparagine, and sucrose, and unknown peaks in integrated regions 6.52, 6.92, 7.6, 7.68 were important in distinguishing the two different varieties of AR. Most of the metabolites identified by R-SVM were consistent with those of OPLS-DA, indicating that different statistical methods should be used to obtain accurate results.
3.5 Relative quantification of metabolites
The seven differential compounds revealed above, i.e. arginine, valine, threonine, asparagine, succinate, glutamine, and sucrose, were relatively quantified based on the measurement of the average peaks of the characteristic resonances. The t-test confirmed several compounds contributing to the separation of wild and cultivated AR. The results were generated as a heat map (Figure 6), with the red indicating high intensity and the green indicating low intensity. It is obvious that arginine, valine, threonine, asparagine, succinate, glutamine, and sucrose were the metabolites differing most significantly between the WSE of the two kinds of AR.
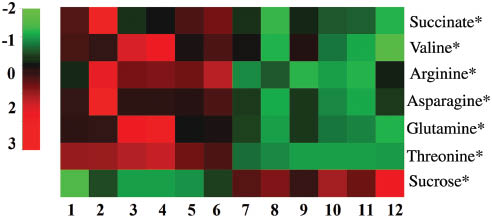
Heatmap of relative qualification of key metabolites. 1–3, Wild AR of Shanxi Wuzhai (WZW); 4–6, wild AR of Shanxi Hunyuan (HYW); 7–9, cultivated AR of Shanxi Wuzhai (WZC); 10–12, cultivated AR of Shanxi Hunyuan (HYC). *p<0.05, **p<0.01.
4 Conclusion
In this study, wild and cultivated AR growing in the same sites of Northern Shanxi were collected, and their WSE values were compared. The results showed that both the WSE values and their chemical composition differed significantly. The wild AR showed stronger UV absorbance than the cultivated AR in the range of 250–400 nm, which may be due to the flavonoids contained in wild AR. The NMR-based metabolic fingerprinting approach indicate that sucrose is the major metabolite in the WSE of AR, and that arginine, valine, threonine, asparagine, succinate, glutamine, and sucrose are the metabolites of differential abundance in the chemical composition of WSE of wild and cultivated AR. The results obtained in this study indicate that the WSE can be used as a simple method for quality evaluation of AR, and that the results obtained in this study extend the potential use of WSE in the quality evaluation of herbal drugs.
Acknowledgments
This study was financially supported by the Outstanding Innovative Teams of Higher Learning Institutions of Shanxi Province, the National Twelfth Five-year Science and Technology Support Program (No. 2011BA107B01), and Science and Technology Innovation Team of Shanxi Province (No. 2013131015).
Conflict of interest statement: The authors confirm that this article content has no conflict of interest.
References
1. Chen X, Peng LH, Li N, Li QM, Li P, Fung KP, et al. The healing and anti-scar effects of astragaloside IV on the wound repair in vitro and in vivo. J Ethnopharmacol 2012;139:721–7.10.1016/j.jep.2011.11.035Search in Google Scholar
2. Ren S, Zhang H, Mu Y, Sun M, Liu P. Pharmacological effects of Astragaloside IV: a literature review. J Trad Chin Med 2013;33:413–6.10.1016/S0254-6272(13)60189-2Search in Google Scholar
3. Chen XJ, Bian ZP, Lu S, Xu JD, Gu CR, Yang D, et al. Cardiac protective effect of Astragalus on viral myocarditis mice: comparison with perindopril. Am J Chinese Med 2006;34:493–502.10.1142/S0192415X06004028Search in Google Scholar PubMed
4. Yin X, Zhang Y, Wu H, Zhu X, Zheng X, Jiang S, et al. Protective effects of Astragalus saponin I on early stage of diabetic nephropathy in rats. J Pharmacol Sci 2004;95:256–66.10.1254/jphs.FP0030597Search in Google Scholar PubMed
5. Lau KM, Lai KK, Liu CL, Kwok HF, Lau CP, Ko CH, et al. Synergistic interaction between astragali radix and rehmanniae radix in a Chinese herbal formula to promote diabetic wound healing. J Ethnopharmacol 2012;141:250–6.10.1016/j.jep.2012.02.025Search in Google Scholar PubMed
6. Liu J, Hu X, Yang Q, Yu Z, Zhao Z, Chen H. Comparison of the immunoregulatory function of different constituents in radix astragali and radix hedysari. J Biomed Biotechnol 2010;24:103–5.10.1155/2010/479426Search in Google Scholar PubMed PubMed Central
7. Sheih IC, Fang TJ, Wu TK, Chang CH, Chen RY. Purification and properties of a novel phenolic antioxidant from radix astragali fermented by Aspergillus oryzae M29. J Agric Food Chem 2011;59:6520–5.10.1021/jf2011547Search in Google Scholar PubMed
8. Montoro P, Teyeb H, Masullo M, Mari A, Douki W, Piacente S. LC-ESI-MS quali-quantitative determination of phenolic constituents in different parts of wild and cultivated Astragalus gombiformis. J Pharm Biomed Anal 2013;72:89–98.10.1016/j.jpba.2012.09.014Search in Google Scholar PubMed
9. Tan Y, Liang Z, Shao H, Du F. Effect of water deficits on the activity of anti-oxidative enzymes and osmoregulation among three different genotypes of radix astragali at seeding stage. Colloid Surface B 2006;49:60–5.10.1016/j.colsurfb.2006.02.014Search in Google Scholar PubMed
10. Chinese Pharmacopoeia Commission, Pharmacopoeia of the People’s Republic of China. China Medical Science Press: Beijing, 2010.Search in Google Scholar
11. Ma XQ, Shi Q, Duan JA, Dong TT, Tsim KW. Chemical analysis of radix astragali (huangqi) in China: a comparison with its adulterants and seasonal variations. J Agric Food Chem 2002;50:4861–6.10.1021/jf0202279Search in Google Scholar PubMed
12. Li ZY, Zhi HJ, Xue SY, Sun HF, Zhang FS, Jia JP, et al. Metabolomic profiling of the flower bud and rachis of Tussilago farfara with antitussive and expectorant effects on mice. J Ethnopharmacol 2012;140:83–90.10.1016/j.jep.2011.12.027Search in Google Scholar PubMed
13. Farag MA, Porzel A, Wessjohann LA. Comparative metabolite profiling and fingerprinting of medicinal licorice roots using a multiplex approach of GC-MS, LC–MS and 1H NMR techniques. Phytochemistry 2012;76:60–72.10.1016/j.phytochem.2011.12.010Search in Google Scholar PubMed
14. Qi Y, Qu L, Wu Y, Fan G. A plasma metabonomic investigation into the intervention of volatile oil of Magnolia biondii Pamp on rat model of acute inflammation. J Ethnopharmacol 2011;137:487–94.10.1016/j.jep.2011.05.045Search in Google Scholar PubMed
15. Fotakis C, Christodouleas D, Kokkotou K, Zervou M, Zoumpoulakis P, Moulos P. NMR metabolite profiling of Greek grape marc spirits. Food Chem 2013;138:1837–46.10.1016/j.foodchem.2012.11.128Search in Google Scholar PubMed
16. Lee JE, Lee BJ, Polissiou MG, Chung JO, Kim HN, Kim EH, et al. NMR metabolite profiling of Greek grape marc spirits. Food Chem 2015;173:890–6.Search in Google Scholar
17. Petrakis EA, Cagliani LR, Polissiou MG, Consonni R, Zoumpoulakis P. NMR metabolite profiling of Greek grape marc spirits. Food Chem 2015;173:890–6.10.1016/j.foodchem.2014.10.107Search in Google Scholar PubMed
18. Shin YS, Bang KH, In DS, Sung JS, Kim SY, Ku BC, et al. Fingerprinting differentiation of Astragalus membranaceus roots according to ages using 1H-NMR spectroscopy and multivariate statistical analysis. Biomol Ther 2009;17:133–7.10.4062/biomolther.2009.17.2.133Search in Google Scholar
19. Xiao C, Dai H, Liu H, Wang Y, Tang H. Revealing the metabonomic variation of rosemary extracts using 1H NMR spectroscopy and multivariate data analysis. J Agric Food Chem 2008;56:10142–53.10.1021/jf8016833Search in Google Scholar PubMed
20. Zhong Y, Zhang JH. Operator functional state classification using least-square support vector machine based recursive feature elimination technique. Comput Meth Prog Bio 2014;113:101–15.10.1016/j.cmpb.2013.09.007Search in Google Scholar PubMed
21. Ding SF, Hua XP. Recursive least squares projection twin support vector machines for nonlinear classification. Neurocomputing 2014;130:3–9.10.1016/j.neucom.2013.02.046Search in Google Scholar
22. Lee JH, Lee S, Choi S. In silico classification of adenosine receptor antagonists using Laplacian-modified naïve Bayesian, support vector machine, and recursive partitioning. J Mol Graph Model 2010;28:883–90.10.1016/j.jmgm.2010.03.008Search in Google Scholar PubMed
©2015 by De Gruyter
Articles in the same Issue
- Frontmatter
- Chemical characterization, antioxidant and cytotoxic activities of the methanolic extract of Hymenocrater longiflorus grown in Iraq
- Preventive effect of total glycosides from Ligustri Lucidi Fructus against nonalcoholic fatty liver in mice
- Synthesis of platinum(II) complexes of 2-cycloalkyl-substituted benzimidazoles and their cytotoxic effects
- cDNA cloning and functional characterisation of four antimicrobial peptides from Paa spinosa
- Evaluation of the water soluble extractive of astragali radix with different growth patterns using 1H-NMR spectroscopy
- SPME collection and GC-MS analysis of volatiles emitted during the attack of male Polygraphus poligraphus (Coleoptera, Curcolionidae) on Norway spruce
- Selective nematocidal effects of essential oils from two cultivated Artemisia absinthium populations