Crystal structures of phases from the solid solutions DyNiIn1−xSn x
-
Galyna Nychyporuk
 ,
Yana Vilchynska
,
Yana Vilchynska

Abstract
The interaction of components in the system DyNiIn-DyNiSn was studied by powder X-ray diffraction and scanning electron microscopy in the full concentration range at T = 870 K. The limited solubility of the p-elements in the parent compounds of equiatomic composition with the formation of substitutional solid solutions with the following compositions was established: DyNiIn1.0–0.5Sn0–0.5 (ZrNiAl-type structure; hexagonal space group P
1 Introduction
The vast majority of ternary systems with the rare earths (RE), transition metals (T) and p-elements (X = In, Sn) are characterized by the formation of compounds with the equiatomic composition RETX. 1 , 2 , 3 , 4 , 5 , 6 , 7 , 8 , 9 , 10 , 11 , 12 , 13 , 14 , 15 They have been intensively studied due to a number of interesting physical properties, such as the Kondo effect, superconductivity, spin fluctuations, valence instabilities, heavy fermion systems, metamagnetism, etc. 7 , 8 , 9 , 10 , 11 , 12 , 13 , 14 , 15 For example, DyNiIn is a ferromagnet with ТС ∼ 30 K, 9 and for the non-stoichiometric solid solutions DyNi1–xIn1+x, a change in magnetic properties from ferromagnetic (х = 0.1; ТС = 15 K) to antiferromagnetic (х = 0.25; ТN = 12.5 K) was found. 10 GdNiSn, TbNiSn, and DyNiSn compounds are characterized by antiferromagnetic ordering at low temperatures. 13 , 14 , 15
In order to study the effect of lanthanide substitution on the stability of hydrides based on the RENiIn compounds (RE = Pr, Nd), the authors 16 investigated the interaction of hydrogen with the phases PrNiIn0.8Sn0.2 and NdNiIn0.8Sn0.2 and showed that, at a pressure of 3 MPa, they are hydrogen adsorbents and are stable at the compositions PrNiIn0.8Sn0.2H1.33 and NdNiIn0.8Sn0.2H1.26, while preserving the metal substructure of the initial phase.
The aim of the present work is the investigation of the interactions of the components in the solid solutions DyNiIn1−xSn x at T = 870 K, a study of the possibility of mutual substitution of the p-elements In and Sn and its effect on the crystal structure of these phases.
2 Experimental details
To study the interaction of the components in the solid solutions DyNiIn1−xSn x , samples of 11 alloys with a weight up to 1 g with the corresponding stoichiometric compositions, were prepared by arc melting of the pure elements (all with stated purities better than 99.9 %) under an argon atmosphere (purified using titanium sponge). The alloys were sealed in evacuated quartz ampoules and annealed at 870 K for a month, followed by quenching in cold water without breaking the ampoules. Annealed and as-cast samples are resistant to the environment for a long time. The samples were analyzed by powder X-ray diffraction using a DRON 2.0M (FeKα radiation) diffractometer. Phase analysis of the samples was performed using the programs PowderCell 17 and STOE WinXPOW, 18 structural calculations were done using the program FullProf. 19 Some alloys were examined on a Tescan Vega 3 LMU scanning electron microscope equipped with an Oxford Instruments SDD X-MaxN20 detector. Single crystals were selected from the annealed samples and investigated on a SuperNova Rigaku Oxford Diffraction diffractometer (MoKα radiation) at the Technical University of Dresden (Dresden, Germany) in order to check the crystal quality. An array of experimental hkl reflections was collected at room temperature using the same diffractometer. The crystal structures were refined using the Jana2006 software. 20
The qualitative and quantitative composition of the single crystals was determined based on the results of EDX analysis (Zeiss EVO MA 15 scanning electron microscope) at the Leibniz Institute for Solid State and Materials Research (Dresden, Germany).
CCDC 2429678 (DyNiIn0.7Sn0.3) and CCDC 2429677 (DyNiIn0.1Sn0.9) contain the supplementary crystallographic data for this paper. These data can be obtained free of charge from The Cambridge Crystallographic Data Centre via www.ccdc.cam.ac.uk/data_request/cif.
3 Results and discussion
According to the results of the phase analysis of the samples, the partial solubility of the fourth component (both Sn and In) in the parent compounds of equiatomic composition with the formation of two limited substitutional solid solutions with the following compositions was established: DyNiIn1.0–0.5Sn0–0.5 (ZrNiAl-type structure;
21
hexagonal space group P
Backscattered electron images of the sample surfaces and the composition of the phases according to the results of the EDX analysis are shown in Figure 1. The powder diffraction patterns of three samples are shown in Figure 2. The refined unit cell parameters of the phases with the ZrNiAl and TiNiSi-type structures in the solid solutions DyNiIn1−xSn x are listed in Table 1.

Back-scattered electron images of the sample surfaces of the solid solutions DyNiIn1−xSn x (samples annealed at T = 870 K; scanning electron microscope TescanVega 3 LMU).
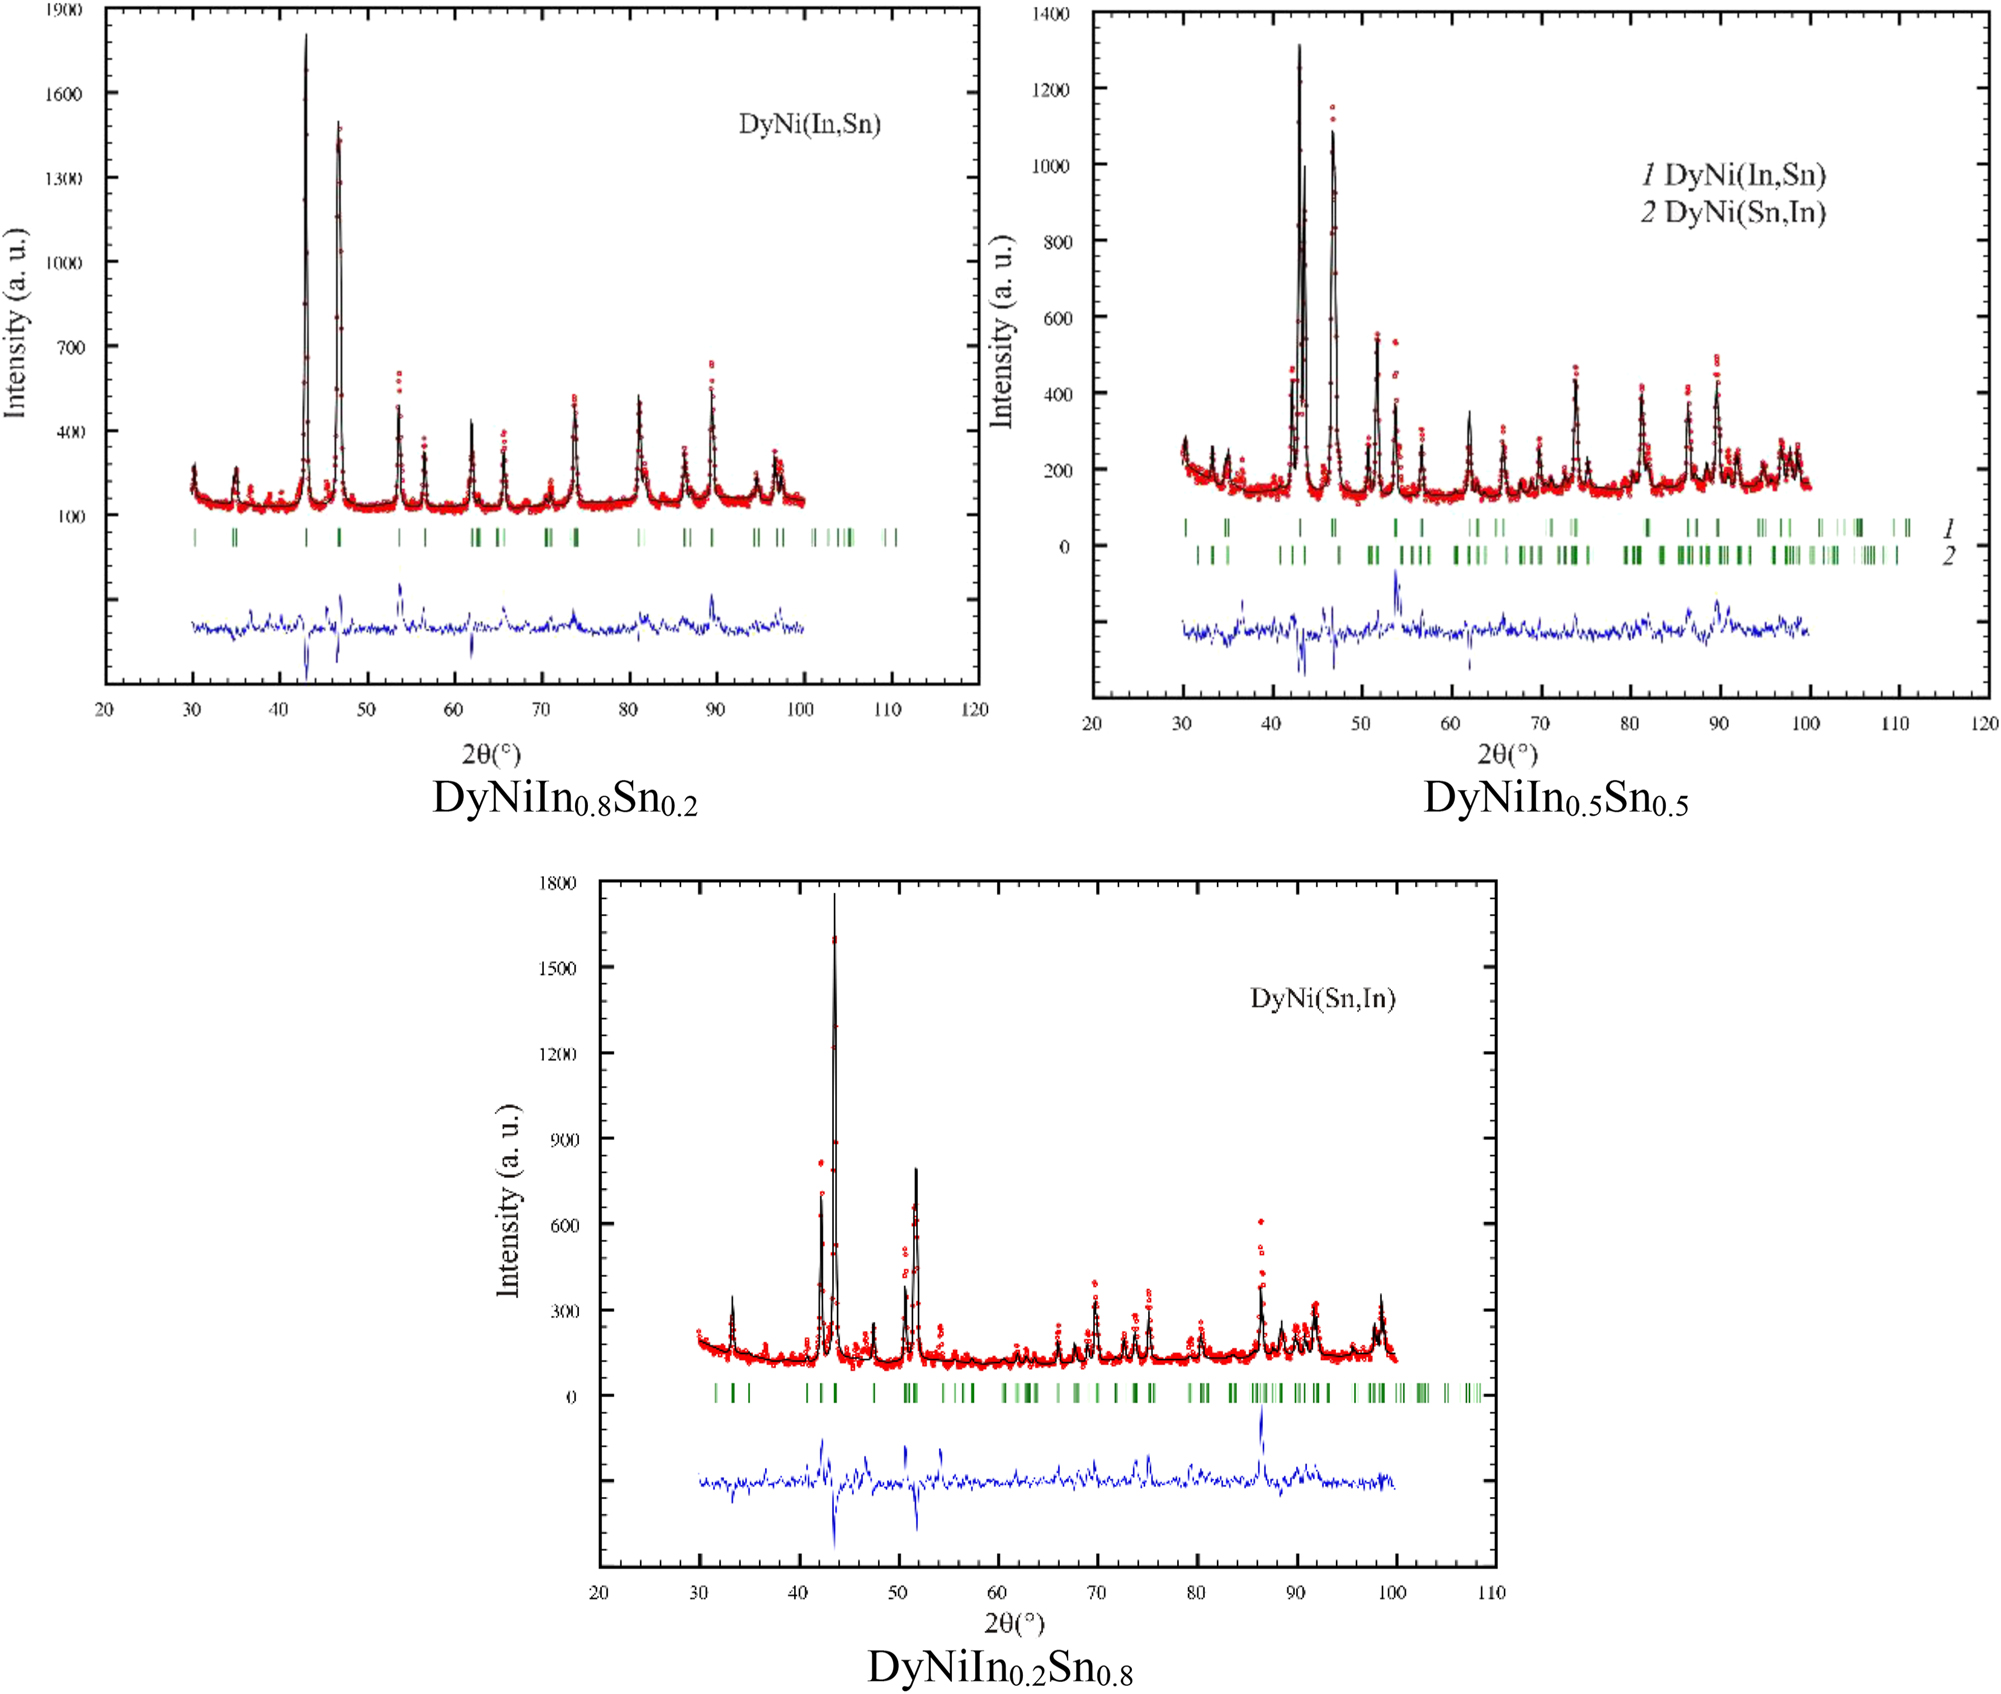
Experimental (circles), calculated (continuous line) and difference (lowest line) powder X-ray diffraction patterns of samples of the solid solutions DyNiIn1−xSn x (diffractometer DRON 2.0M, FeKα radiation).
Lattice parameters of samples within the solid solutions DyNiIn1−xSn x .
| Sample | a (nm) | b (nm) | c (nm) | V (nm3) |
|---|---|---|---|---|
| DyNiIn1–0.5Sn0–0.5 (ZrNiAl type, space group P
|
||||
| DyNiIn | 0.74480(9) | a | 0.37811(5) | 0.18165(4) |
| DyNiIn0.9Sn0.1 | 0.74504(6) | 0.37705(4) | 0.18126(3) | |
| DyNiIn0.8Sn0.2 | 0.74444(6) | 0.37656(4) | 0.18073(3) | |
| DyNiIn0.7Sn0.3 | 0.74484(6) | 0.37605(4) | 0.18067(3) | |
| DyNiIn0.6Sn0.4 | 0.74402(6) | 0.37612(4) | 0.18031(3) | |
| DyNiIn0.5Sn0.5 | 0.74323(6) | 0.37635(4) | 0.18004(3) | |
| DyNiIn0.2–0Sn0.8–1 (TiNiSi type, space group Pnma) | ||||
| DyNiIn0.2Sn0.8 | 0.71145(7) | 0.44572(4) | 0.76787(9) | 0.24350(4) |
| DyNiIn0.1Sn0.9 | 0.71151(9) | 0.44557(5) | 0.76660(11) | 0.24303(5) |
| DyNiSn | 0.71011(8) | 0.44496(4) | 0.76464(8) | 0.24159(5) |
The extension and structure of the solid solutions are influenced by both the type of structure of the parent compounds and the electronic structure of the atoms of the p-elements. The extension of the formed solid solutions is different, since the atoms of indium (group IIIa) and tin (group IVa) differ in their electronic structure, and the parent compounds crystallize in different structure types making the comparison meaningless. The schematic diagram of the distribution of phases in the solid solutions RENiIn1−xSn x (RE = La, Ce, Nd, Gd, Dy) 25 , 26 , 27 (Figure 3) shows the same dependencies for all investigated systems. Similar regularities of the replacement of indium by tin atoms can be observed in the solid solutions RE2T2In1–xSn x (RE = La, Ce; T = Ni, Cu), 28 where the limited substitutional solid solutions with different lengths based on the parent compounds are formed.

The range of the solid solutions RENiIn1−xSn x .
In order to define the crystal structure of the phases in the solid solutions DyNiIn1−xSn
x
, single-crystal studies were performed. Several single crystals with high quality of annealed samples of Dy0.33Ni0.33In0.24Sn0.10 and Dy0.33Ni0.33In0.03Sn0.31 were selected. Hexagonal symmetry was confirmed for the first crystal and orthorhombic symmetry for the second one. An array of experimental hkl reflections was collected at room temperature with MoKα radiation. The structure was refined using the Jana2006 program package
20
with the ZrNiAl-type
21
structure as the model for the DyNiIn0.7Sn0.3 phase (P
The details of the experiment and the crystal structure refinement results for the DyNiIn1–xSn x phases.
| Formula | DyNiIn0.7Sn0.3 | DyNiIn0.1Sn0.9 |
| Structure type | ZrNiAl | TiNiSi |
| Crystal system | Hexagonal | Orthorhombic |
| Space group | P
|
Pnma |
| Unit cell parameters | ||
| a, nm | 0.74454(7) | 0.71086(2) |
| b, nm | =a | 0.44508(1) |
| c, nm | 0.37569(4) | 0.76560(2) |
| Cell volume, nm3 | 0.18036(3) | 0.24223(1) |
| Temperature T, K | 297 | 298 |
| Radiation/λ, nm | MoKα/0.071073 | MoKα/0.071073 |
| Density calcd., g cm−3 | 9.31 | 9.31 |
| Absorption coeff., mm−1 | 47.8 | 47.9 |
| F(000), e | 430 | 576 |
| θ range, deg | 3.16–38.2 | 3.91–33.81 |
| hkl range | ±12, ±12, ±6 | ±10, ±6, ±11 |
| No. of reflections | 3,534 | 4,323 |
| Independent refl./param. | 401/15 | 497/20 |
| Reflections with I > 2σ(I) | 399 | 477 |
| R1/wR2 for I > 2σ(I) | 0.0202/0.0506 | 0.0220/0.0575 |
| R1/wR2 for all data | 0.0203/0.0506 | 0.0232/0.0580 |
| Goodness-of-fit F2 | 1.67 | 1.87 |
| Flack parameter | −0.02(2) | – |
| Max. diff. peak/hole, ×103 e nm−3 | 1.39/−2.66 | 1.81/−2.07 |
Atomic coordinates and anisotropic displacement parameters for phases of the solid solutions DyNiIn1−xSn x .
| Atom | Wyckoff | x | y | z | U 11 | U 22 | U 33 | U 12 | U eq |
|---|---|---|---|---|---|---|---|---|---|
| DyNiIn0.7Sn0.3 | |||||||||
|
|
|||||||||
| Dy | 3f | 0.5910(1) | 0 | 0 | 0.0111(2) | 0.0132(2) | 0.0094(2) | 0.0066(1) | 0.0110(1) |
| Ni1 | 1a | 0 | 0 | 0 | 0.0132(5) | U 11 | 0.0136(8) | 0.0066(3) | 0.0133(4) |
| Ni2 | 2d | 1/3 | 2/3 | 1/2 | 0.0103(3) | U 11 | 0.0117(5) | 0.0052(2) | 0.0108(3) |
| M a | 3g | 0.2559(1) | 0 | 1/2 | 0.0104(2) | 0.0106(2) | 0.0119(2) | 0.0053(1) | 0.0109(2) |
| Atom | Wyckoff | x | y | z | U 11 | U 22 | U 33 | U 13 | U eq |
|---|---|---|---|---|---|---|---|---|---|
| DyNiIn0.1Sn0.9 | |||||||||
|
|
|||||||||
| Dy | 4c | 0.0115(1) | 1/4 | 0.7026(1) | 0.0094(2) | 0.0083(2) | 0.0103(2) | 0.0001(1) | 0.0093(1) |
| Ni | 4c | 0.2995(1) | 1/4 | 0.4147(1) | 0.0156(4) | 0.0079(4) | 0.0103(4) | 0.0009(3) | 0.0113(2) |
| M b | 4c | 0.1913(1) | 1/4 | 0.0864(1) | 0.0112(2) | 0.0061(2) | 0.0090(2) | 0.0004(1) | 0.0088(1) |
-
aM = 0.7 In + 0.3 Sn (the composition is fixed); U13 = U23 = 0. bM = 0.1 In + 0.9 Sn (the composition is fixed); U12 = U23 = 0.
In the structure of the DyNiIn0.7Sn0.3 compound (as well as in other RENiIn compounds with ZrNiAl-type structure), coordination polyhedra for the RE atoms are pentagonal prisms with centred side faces, and atoms of the statistic mixture located in the distorted tetragonal prisms with centred side faces. The smallest atoms (nickel) are in the centers of trigonal prisms with centered side faces (CN = 9). In the structure of the DyNiIn0.1Sn0.9 compound (TiNiSi-type structure) the dysprosium atoms are located in the centers of pentagonal prisms with six additional atoms opposite to the side faces (CN = 16). The coordination polyhedra for the nickel atoms and the mixture of Sn/In atoms are trigonal prisms with four additional atoms (CN = 10). The structures of the DyNiIn0.7Sn0.3 (ZrNiAl-type structure) and DyNiIn0.1Sn0.9 (TiNiSi-type structure) phases can be described as two-dimensional homologues based on the AlB2-type structure, 29 , 30 where the key structural components are trigonal prisms centered by nickel atoms. The ZrNiAl-type structure contains six-membered rings formed by Dy atoms surrounding an isolated prism formed by the atoms of a statistical mixture [NiM6], arranged as in the TiNiSi-type structure with the zig-zag chains of trigonal prisms [NiDy4M2] connected through common edges (Figure 4).

Trigonal prisms in the structures of the phases DyNiIn0.7Sn0.3 (ZrNiAl-type structure, left) and DyNiIn0.1Sn0.9 (TiNiSi-type structure, right). The mixed-occupied sites are emphasized by segments.
If one compares the shortest interatomic distances in the structures of the DyNiIn1–xSn x phases (Table 4), we can trace a general trend: almost all distances are larger for phases with higher indium content, which is in good agreement with the sizes of the In and Sn atoms. 31
The shortest distances (nm) between different types of atoms in the structures of DyNiIn, 10 DyNiIn0.7Sn0.3, DyNiIn0.1Sn0.9 and DyNiSn. 15
| DyNiIn | DyNiIn0.7Sn0.3 | DyNiIn0.1Sn0.9 | DyNiSn | |
|---|---|---|---|---|
| (ZrNiAl type) | (ZrNiAl type) | (TiNiSi type) | (TiNiSi type) | |
| a = 0.7417 | a = 0.74454(7) | a = 0.71086(2) | a = 0.7041 | |
| c = 0.3775 | c = 0.37569(4) | b = 0.44508(1) | b = 0.4418 | |
| c = 0.76560(2) | c = 0.7616 | |||
| Dy–Dy | 0.3775 | 0.3757 | 0.3628 | 0.3587 |
| Dy–M | 0.3130 | 0.3123 | 0.3105 | 0.3045 |
| Dy–Ni1 | 0.2929 | 0.2934 | 0.3009 | 0.2961 |
| Dy–Ni2 | 0.3049 | 0.3045 | – | – |
| Ni1–M | 0.2657 | 0.2675 | 0.2586 | 0.2524 |
| Ni2–M | 0.2822 | 0.2815 | – | – |
| Ni–Ni | 0.3775 | 0.3757 | 0.3845 | 0.3812 |
| M–M | 0.3240 | 0.3299 | 0.3755 | 0.3765 |
4 Summary
The existence of substitutional DyNiIn1–xSn x solid solutions with the ZrNiAl- and TiNiSi-type structures of the initial compounds was established and the change in the unit cell parameters was refined. Partial substitution of In by Sn atoms was confirmed by single-crystal studies of the compounds DyNiIn0.7Sn0.3 (ZrNiAl type) and DyNiIn0.1Sn0.9 (TiNiSi type). The characteristics of the substitutional solid solutions of DyNiIn1–xSn x are compared with those of closely related solid solutions. The new structural data presented herein is a valuable mosaic stone which will help to understand the crystal chemistry of the intermetallic systems.
Funding source: Simons Foundation
Award Identifier / Grant number: PD-Ukraine-00014574
Acknowledgments
We are grateful to Prof. Dr. Thomas Doert and Lic. Cs. Eduardo Carrillo (both TU Dresden, Germany) for access to the facilities and support during single-crystal data measurements, Rowena Wachtel (IFW Dresden, Germany) for help with the EDX analysis of the single crystal.
-
Research ethics: Not applicable.
-
Informed consent: Not applicable.
-
Author contributions: All the authors have accepted responsibility for the entire content of this submitted manuscript and approved submission.
-
Use of Large Language Models, AI and Machine Learning Tools: None declared.
-
Conflict of interest: The authors declare no conflicts of interest regarding this article.
-
Research funding: We are grateful for the financial support of the Simons Foundation (Award ID: PD-Ukraine-00014574).
-
Data availability: Data is available from the corresponding author on well-founded request.
References
1. Kalychak, Y. M.; Zaremba, V. I.; Pöttgen, R.; Lukachuk, M.; Hoffmann, R.-D. Rare Earth-Transition Metal-Indides. In Handbook on the Physics and Chemistry of Rare Earths; GschneidnerJr.K. A.; Pecharsky, V. K.; Bünzli, J.-C., Eds.; Elsevier: Amsterdam, Vol. 34, 2005, chapter 218; pp. 1–133.10.1016/S0168-1273(04)34001-8Search in Google Scholar
2. Dwight, A. E.; Mueller, M. H.; ConnerJr.R. A.; Downey, J. W.; Knott, H. W. Trans. Metall. Soc. AIME 1968, 242, 2075–2080.Search in Google Scholar
3. Ferro, R.; Marazza, R.; Rambaldi, G. Z. Metallkd. 1974, 65, 37–39. https://doi.org/10.1515/ijmr-1974-650106.Search in Google Scholar
4. Rossi, D.; Marazza, R.; Ferro, R. J. Less-Common Met. 1985, 107, 99–104. https://doi.org/10.1016/0022-5088(85)90245-0.Search in Google Scholar
5. Skolozdra, R. V. Stannides of Rare Earth-Transition and Transition Metals. In Handbook on the Physics and Chemistry of Rare Earths; Gschneidner, K. A.; Eyring, L., Eds.; Elsevier: Amsterdam, 1997; chapter 164; pp. 399–517.10.1016/S0168-1273(97)24009-2Search in Google Scholar
6. Dwight, A. E. J. Less-Common Met. 1983, 93, 411–413. https://doi.org/10.1016/0022-5088(83)90195-9.Search in Google Scholar
7. Gupta, S.; Suresh, K. G. J. Alloys Compd. 2015, 618, 562–606. https://doi.org/10.1016/j.jallcom.2014.08.079.Search in Google Scholar
8. Gondek, Ł.; Żukowski, J.; Balanda, M.; Kaczorowski, D.; Szytuła, A. Mater. Sci. Pol. 2008, 26, 815–820.Search in Google Scholar
9. Lapolli, A. L.; Saxena, R. N.; Mestnik-Filho, J.; Leite, D. M. T.; Carbonari, A. W. J. Appl. Phys. 2007, 101, 09D510. https://doi.org/10.1063/1.2709421.Search in Google Scholar
10. Tyvanchuk, Y. B.; Kalychak, Y. M.; Gondek, L.; Rams, M.; Szytuła, A.; Tomkowicz, Z. J. Magn. Magn. Mater. 2004, 277, 368–378.10.1016/j.jmmm.2003.11.018Search in Google Scholar
11. Zhang, H.; Xu, Z. Y.; Zheng, X. Q.; Shen, J.; Hu, F. X.; Sun, J. R.; Shen, B. G. J. Appl. Phys. 2011, 109, 123926. https://doi.org/10.1063/1.3603044.Search in Google Scholar
12. Romaka, V. V.; Hlil, E. K.; Romaka, L.; Fruchart, D.; Horyn, A. Chem. Met. Alloys 2008, 1, 298–302. https://doi.org/10.30970/cma1.0069.Search in Google Scholar
13. Kawano, S.; Andoh, Y.; Kurisu, M. J. Phys. Chem. Solids 1999, 60, 1205–1207. https://doi.org/10.1016/s0022-3697(99)00085-2.Search in Google Scholar
14. Skolozdra, R. V.; Koretskaya, O. E.; Gorelenko, Y. K. Inorg. Mater. 1984, 20, 520–523.Search in Google Scholar
15. Szytula, A.; Penc, B.; Ressouche, E. J. Alloys Compd. 1996, 244, 94–98. https://doi.org/10.1016/s0925-8388(96)02437-1.Search in Google Scholar
16. Ardeleani, O.; Blanitai, G.; Filoti, G.; Palade, P. J. Phys.: Conf. Ser. 2009, 182, 012045. https://doi.org/10.1088/1742-6596/182/1/012045.Search in Google Scholar
17. Nolze, G.; Kraus, W. Powder Diffr. 1998, 13, 256–259.10.1017/S0885715600020856Search in Google Scholar
18. WinXPOW (version 1.2). STOE & Cie GmbH: Darmstadt (Germany), 2001.Search in Google Scholar
19. Rodríguez-Carvajal, J. Recent Developments of the Program FULLPROF. In Commission on Powder Diffraction of the IUCr, Newsletter, Vol. 26, 2001; pp. 12–19.Search in Google Scholar
20. Petříček, V.; Dušek, M.; Palatinus, L. Z. Kristallogr. 2014, 229, 345–352.10.1515/zkri-2014-1737Search in Google Scholar
21. Krypyakevych, P. I.; Markiv, V. Y.; Mel’nyk, E. V. Dopov. Akad. Nauk Ukr. RSR, Ser. A 1967, 750–753.Search in Google Scholar
22. Brink, C.; Shoemaker, D. P. Acta Crystallogr. 1965, 18, 900–905. https://doi.org/10.1107/s0365110x65002189.Search in Google Scholar
23. Tyvanchuk, Y. B.; Zaremba, V. I.; Akselrud, L. G.; Szytula, A.; Kalychak, Y. M. J. Alloys Compd. 2017, 704, 717–727.10.1016/j.jallcom.2017.02.023Search in Google Scholar
24. Romaka, V. V.; Rogl, P.; Romaka, L.; Melnychenko, N. J. Alloys Compd. 2009, 485, 275–279. https://doi.org/10.1016/j.jallcom.2009.06.077.Search in Google Scholar
25. Nychyporuk, G.; Dominyuk, N.; Muts, I.; Zelinskiy, A.; Pöttgen, R.; Zaremba, V. Z. Naturforsch. 2023, 78b, 427–433.10.1515/znb-2023-0036Search in Google Scholar
26. Nychyporuk, G.; Horiacha, M.; Hudzo, O.; Zelinskii, A.; Wurmehl, S.; Zaremba, V. Book of Abstracts of XXI Intern. Conf. Inorg. Chem. Ukraine (XXII CICU); Publishing House of UzhNU “Hoverla”: Uzhhorod, Ukraine, 2024; pp 1–164.Search in Google Scholar
27. Nychyporuk, G.; Horiacha, M.; Vilchynska, Ya.; Zelinskiy, A. V.; Zaremba, V. Visn. Lviv Univ. Series Chem. 2025, 66.Search in Google Scholar
28. Chumalo, N.; Demchuk, V.; Nychyporuk, G.; Zaremba, V. Visn. Lviv Univ. Series Chem. 2010, 51, 24–30.Search in Google Scholar
29. Hoffmann, W.; Jäniche, W. Naturwissenschaften 1935, 23, 851. https://doi.org/10.1007/bf01491990.Search in Google Scholar
30. Hoffmann, R.-D.; Pöttgen, R. Z. Kristallogr. 2001, 216, 172–145.10.1524/zkri.216.3.127.20327Search in Google Scholar
31. Emsley, J. The Elements, 2nd ed.; Clarendon Press: Oxford, 1991.Search in Google Scholar
© 2025 Walter de Gruyter GmbH, Berlin/Boston
Articles in the same Issue
- Frontmatter
- In this issue
- Research Articles
- A MEMS-based gas sensor for H2S detection with enhanced performance using a Ni–In2O3/ZnO nano-composite
- Ultra-sensitive and rapid response H2S microsensor based on Co–ZnO with ppm level detection
- Crystal chemistry and structural phase transition in CaLa2Zn1–x Ca x Ti2O9 (x = 0.00, 0.15, 0.30, 0.45, 0.90 and 1.00)
- RE 10Co3In10 (RE = Y, Gd, Tb, Dy, Ho, Er, Tm) – a new intergrowth structure with CsCl- and AlB2-type slabs
- Crystal structures of phases from the solid solutions DyNiIn1−xSn x
- Tricyanomethanides of the scandium group obtained from aqueous solution: syntheses, crystal structures and Raman spectra of Sc[C(CN)3]3(H2O)3, Y[C(CN)3]3(H2O)2 and La[C(CN)3]3(H2O)4
- Three pnictides with Sm6Rh30Si19-type structure: Sm6Rh30P19, Lu6Rh30P19 and Eu6Rh30Sb19
- The compound (NH4)0.64B4.36O6.72(OH)0.28(NH3)0.36 representing the first ammine/ammonium borate
- Extended investigations on the pressure stability of AlB4O6N:Cr3+
- Synthesis and crystal structures of new phases in the system Hf–Ta–O–N