New bioactive metabolites from Penicillium purpurogenum MM
-
Mohamed Shaaban
 ,
Mohammad Magdy El-Metwally
,
Mohammad Magdy El-Metwally

Abstract
Three new bioactive compounds, namely (S)-tenellic acid B dimethyl acetal (1a), (3R,3′R/S)-isotalarone (2), and (3R,5R)-cis-5-methyl-3-(2-oxobutyl)-dihydrofuran-2-one (3), were isolated from the terrestrial fungus Penicillium purpurogenum MM, together with 15 known metabolites: talaroflavone, pestalasin A, altenuene, penicillide, 3′-O-methyl-dehydroisopenicillide, rubralactone, tenellic acid B, diaporthin, butyrolactone 1, butyrolactone-V, 4-hydroxy-2-methoxyacetanilide, ergosterol, ergosterol peroxide, linoleic acid, and glycerol monolinoleate. The chemical structures of the three new compounds were confirmed by extensive one- and two-dimensional NMR and electron spray ionization high-resolution mass spectra measurements and by comparison with literature data. The absolute configurations of the new compounds, and of talaroflavone (4a) and tenellic acid B (2b), were determined by ab initio calculations of ECD, ORD, and NMR data. The antimicrobial and cytotoxic activities of the crude extract and of the isolated compounds were studied using a set of microorganisms and brine shrimp assay, respectively. The isolation and taxonomic characterization of P. purpurogenum MM is reported.
1 Introduction
Fungi are producers of potent secondary metabolites [1] that act as antibiotics [2], antimycotics [3], antiviral [4], and anticancer agents [5] or are pharmacologically active in other ways [6]. However, there are still many potential sources of new bioactive natural products from fungi, as many habitats remained unexplored [7, 8].
In the course of this work, the terrestrial fungus Penicillium purpurogenum MM, isolated from deteriorated cotton textile, was investigated. Chemical studies of this isolate afforded three structurally diverse new compounds, named (S)-tenellic acid B dimethyl acetal (1a), (3R,3′R/S)-isotalarone (2), and (3R,5R)-cis-5-methyl-3-(2-oxobutyl)-dihydrofuran-2-one (3) along with 15 known metabolites (Fig. 1). Details of the strain’s taxonomy, antimicrobial activity, and brine shrimp lethality and of the isolation and structure elucidation of compounds 1–3 are presented here.
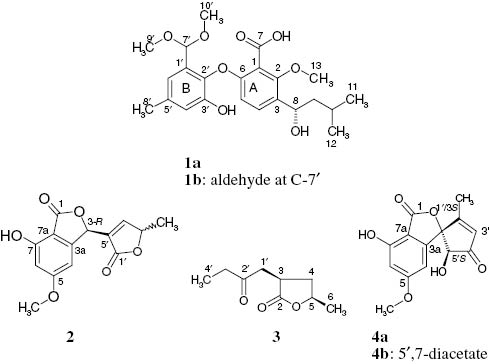
Structural formula of compounds 1–4.
2 Results and discussion
The fungal isolate, P. purpurogenum MM, was obtained from moldy cotton clothing and was cultured for 6 days on M2 medium containing malt extract, yeast extract, and glucose. The ethyl acetate extract of the culture exhibited moderate activity against Gram-positive bacteria, microalgae, and phytopathogenic oomycetes and caused increased mortality in the brine shrimp test. By thin layer chromatography (TLC), the fungal extract exhibited numerous bands in a wide polarity range. Some of these showed a bright blue UV fluorescence at 365 nm and stained pink to blue with anisaldehyde-sulfuric acid, whereas others were faint yellow on TLC and turned yellowish-brown with anisaldehyde-sulfuric acid. A third group of non-UV-absorbing compounds was detected as intensive violet to blue bands after spraying with anisaldehyde-sulfuric acid. Separation using a series of chromatographic techniques afforded 19 bioactive compounds, among them three new metabolites, named (S)-tenellic acid B dimethyl acetal (1a), (3R,3′R/S)-isotalarone (2), and (3R,5R)-cis-5-methyl-3-(2-oxobutyl)-dihydrofuran-2-one (3). In addition to compounds 1–3, the extract afforded 15 known compounds: talaroflavone (4a) [9], tenellic acid B (1b), pestalasin A [11], altenuene [12], penicillide [13], 3′-O-methyl-dehydroisopenicillide [14, 15], rubralactone [16], diaporthin [17], butyrolactone 1 [18], butyrolactone V [18], 4-hydroxy-2-methoxyacetanilide [19], ergosterol [18], ergosterol peroxide [20], linoleic acid [21], and glycerol monolinoleate [22]. The structures of the known compounds were identified using AntiBase [1] and confirmed by comparison with literature data. The physico-chemical properties of the new compounds 1–3 are presented in Table 1. In addition, the absolute configurations of 4a and 1b were determined.
Physico-chemical properties of (S)-tenellic acid B dimethyl acetal (1a), (3R,3′R/S)-isotalarone (2), and (3R,5R)-cis-5-methyl-3- (2-oxobutyl)-dihydrofuran-2-one (3).
| (S)-Tenellic acid B dimethyl acetal (1a) | (3R,3′R/S)-Isotalarone (2) | (3R,5R)-cis-5-Methyl-3-(2-oxobutyl)-dihydrofuran-2-one (3) | |
|---|---|---|---|
| Appearance | Yellow solid | Colorless solid | Colorless oil |
| Rfa | 0.35b | 0.44c | 0.52d |
| Anisaldehyde-sulfuric acide | Intensive yellowish brown | Bright blue and later violet | Bright blue and later violet |
| Molecular formula | C23H30O8 (434) | C14H12O6 (276) | C9H14O3 (170) |
| (+)-ESI-MS: m/z (%) | 457 [M+Na]+ | 299 (20) [M+Na]+ 575 (100) [2M+Na]+ | 193 (37) [M+Na]+ 363 (100) [2M+Na]+ |
| (–)-ESI-MS: m/z (%) | 433 (100) [M–H]− 867 (5) [2M–H]− | ||
| (+)-ESI-HRMS: m/z; (–)-ESI-HRMS: m/z | |||
| Found | 457.1810 [M+Na]+ 891.3733 [2M+Na]+ 433.1868 [M–H]− | 299.0530 [M+Na]+ 275.0561 [M–H]− | 193.0843 [M+Na]+ 363.1782 [2M+Na]+ |
| Calcd. | 457.1833 [C23H30O8Na]+ 891.3778 [C46H60O16Na]+ 433.1868 [C23H29O8]− | 299.0526 [C14H12O6Na]+ 275.0561 [C14H11O6] | 193.0808 [C9H14O3Na]+ 363.1772 [C18H28O6Na]+ |
| –9.3° (c = 0.15) | +13.9° (c = 0.115) | –22.0° (c = 0.25) | |
| UV/Vis: λmax (log ε) | MeOH: 223 (4.33), 271 (3.84), 326 (3.47); MeOH-HCl: 219 (4.31), 283 (3.85); MeOH-NaOH: 225 (4.34), 280 (3.87), 333 (3.47) nm | MeOH: 225 (4.21), 256 (4.14), 293 (3.75), 322 (3.38), 350 (3.05); MeOH-HCl: 224 (4.20, 257 (4.16), 293 (3.79), 350 (2.97); MeOH-NaOH: 239 (4.23), 321 (3.93) nm | – |
aSilica gel 60 F254, Merck; bCH2Cl2-15 % MeOH; cCH2Cl2-10 % MeOH; dCH2Cl2-5 % MeOH; ecolor with staining reagent after heating.
2.1 (S)-Tenellic acid B dimethyl acetal
Compound 1a, a polar yellowish solid, appeared on TLC as yellow band with a yellowish green UV fluorescence at 366 nm and turned intense yellow to brown on spraying with anisaldehyde-sulfuric acid followed by heating. The UV spectrum of 1a displayed three maxima, at λmax = 223, 271, and 326 nm, indicating an aromatic compound. The molecular formula of 1a was determined as C23H30O8 by (+)- and (–)-electron spray ionization high-resolution mass spectra (ESI HRMS) (Table 1), indicating the presence of nine double-bond equivalents.
The 1H NMR spectrum of 1a (Table 2) showed two o-coupled and two m-coupled proton signals in the aromatic region, pointing to two independent ring systems. Three methoxy signals appeared in the aliphatic region. According to the HMBC spectrum, one of these was bound to an aromatic ring at the δ = 155.5 ppm carbon, whereas the other two at δ = 3.26 ppm were gem-dimethoxy (acetal) groups, connected to the methine carbon at δ = 101.4 ppm. Moreover, an aromatic-bound methyl group (s, δ = 2.28 ppm) and two methyl doublets (δ = 0.94, 0.92 ppm, J = 6.6 Hz) were found. The latter formed an isopropyl system with the vicinal methine at δ = 1.71 ppm. This methine and a further oxymethine proton (δ = 5.05 ppm) showed COSY correlations with a methylene group (δ = 1.61, 1.43 ppm), so that a 3-methylbutan-1-ol partial structure resulted (Fig. 2). Owing to the observed HMBC correlations, the aliphatic chain was determined to be connected to carbon 3 of benzene ring A, whereas the methoxy group was established to occupy position 2, and the o-coupled protons were confirmed in positions 4 and 5. This follows from the correlation of H-8 with C-2 (carrying the methoxy group) and C-4, whose proton coupled with C-2, 8, and an additional phenolic carbon (C-6). The assignment was confirmed by 3J correlations of H-5 and H-9 with C-3. The high-field shift of H-5 and its 2J correlation with C-6 confirmed a phenolic carbon at C-6. The substituent at C-1 remained uncertain at this point.
13C (125 MHz) and 1H NMR (300 MHz, CD3OD) data of (S)-tenellic acid B dimethyl acetal (1a).
| C | δC | δH (J in Hz) | C | δC | δH (J in Hz) |
|---|---|---|---|---|---|
| 1 | 121.9 | – | 1′ | 133.4 | – |
| 2 | 155.5 | – | 2′ | 139.2 | – |
| 3 | 133.7 | – | 3′ | 150.8 | – |
| 4 | 128.5 | 7.27 (d, 8.9) | 4′ | 119.1 | 6.75 (d, 1.5) |
| 5 | 111.2 | 6.33 (d, 8.9) | 5′ | 137.2 | – |
| 6 | 155.6 | – | 6′ | 119.3 | 6.85 (d, 1.5) |
| 7 | 172.2 | – | 7′ | 101.4 | 5.37 (s) |
| 8 | 66.5 | 5.05 (dd, 8.3, 5.0) | 8′ | 21.3 | 2.28 (s) |
| 9 | 48.7 | 1.61 (m), 1.43 (m) | 9′ | 54.9 | 3.26 (s) |
| 10 | 26.0 | 1.71 (m) | 10′ | 54.9 | 3.26 (s) |
| 11 | 23.7 | 0.92 (d, 6.7) | |||
| 12 | 22.4 | 0.94 (d, 6.7) | |||
| 13 | 63.1 | 3.92 (s) |
Chemical shifts δ are given in ppm.
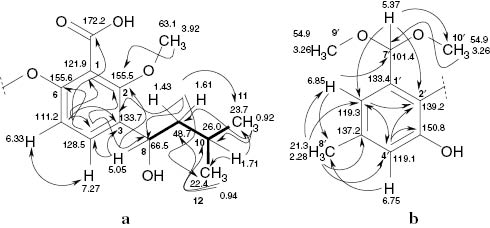
H,H COSY (▬) and selected HMBC (→) correlations of (S)-tenellic acid B dimethyl acetal (1a, partial structures).
In a similar way, ring B was determined as 2,3-dioxygenated 5-methyl-benzaldehyde dimethyl acetal, as the aromatic methyl protons coupled with the methine carbons C-4′,6′. The respective methine protons gave cross signals with the methyl group and with two phenolic carbons, and one of these (δH = 6.85 ppm) coupled with the acetal group and vice versa. The remaining carbon and the missing DBE were assumed to be due to a carbonyl group, as cyclization via two oxygen atoms was not possible on the basis of the empirical formula. The respective carbonyl signal of an acid or ester was found at δ = 172.2 ppm, but it was surprisingly weak. It gave, however, a 4J correlation with H-5 and delivered the missing substituent at C-1.
A search for both substructures A and B in AntiBase [1] afforded 15 hits, all of which were biphenyl ethers. Among these hits was tenellic acid B (1b), which was also isolated in the current study as one of the known compounds. As the 1H NMR shifts of the new metabolite and of 1b were nearly congruent, the most plausible structure for this compound was therefore determined as tenellic acid B dimethyl acetal (1a). No trace of 1a could be found by chromatographic comparison with the original total extract so that 1a appears to be most likely an artifact derived from tenellic acid B (1b). Apparently, 1a was formed from 1b in the presence of methanol during chromatographic purification on silica gel [23]. Indeed, 1a is formed easily from 1b in methanol in the presence of acid traces, as indicated by the 7′-H signal at δ = 5.37 ppm. This facile conversion also explains the disappearance of the dimethyl acetal NMR signals by OCH3/OCD3 exchange and the appearance of a signal due to free CH3OH at lower field on standing in deuterated methanol. The stereochemistry of 1a was determined as (S) by calculation of the optical rotation as described above (
2.2 (3R,3′S)-Isotalarone
Compound 2 was obtained as a moderately polar colorless solid with blue UV fluorescence at 365 nm on TLC. The TLC band stained bright blue and later violet on spraying with anisaldehyde-sulfuric acid. (+)-ESI HRMS confirmed the molecular formula as C14H12O6, indicating the presence of nine DBE (Table 1).
In the HMBC spectrum (see Supplementary Information and Table 3), the doublet at δ = 7.59 ppm coupled weakly with an sp2 carbon at δ = 131.2 ppm and strongly with a carbonyl group at δ = 172.9 ppm, so that an α-substituted α,β-unsaturated acid or ester was assumed. Based on the COSY spectrum, the doublet splitting was determined to be due to coupling with an oxymethine proton (δH-3′ = 5.18 ppm, δC = 80.4 ppm), which itself coupled with a methyl group at δ = 1.42 ppm (C-6′). In addition, H-4′ showed on HMBC a coupling with an oxymethine carbon at δ = 75.4 ppm (C-3). The proton of the latter coupled, among others, backward with C-1′ and 5′. The resulting 4-oxypentenoic acid fragment was therefore determined to be connected at C-5′ with C-3 (Fig. 3).
13C (125 MHz) and 1H NMR data (600 MHz, CD3OD) of (3R,3′R/S)-isotalarone (2).
| C | δC | δHa (J in Hz) | HMBC correlations | C | δCa | δH (J in Hz) | HMBC correlations |
|---|---|---|---|---|---|---|---|
| 1 | 170.7 | – | 1′ | 172.9 | – | ||
| 3 | 75.4 | 6.15 (s) | 1, 3a, 4, 5, 7a, 1′, 4′, 5′ | 3′ | 80.4 | 5.18 (quint, 7.1) | 4′, 5′, 6′ |
| 3a | 152.6 | – | 4′ | 155.7 | 7.59 (dd, 7.0, 0.9) | 3, 3′, 1′, 5′ | |
| 4 | 100.7 | 6.64 (s) | 3, 5, 6, 7a | 5′ | 131.2 | – | |
| 5 | 168.7 | – | 6′ | 18.8 | 1.42 (d, 7.0) | 3′, 4′ | |
| 6 | 103.1 | 6.42 (d, 1.4) | 1, 4, 5, 7, 7a | ||||
| 7 | 159.1 | – | |||||
| 7a | 105.3 | – | |||||
| 8 | 56.6 | 3.82 (s) | 5 |
Chemical shifts δ are given in ppm.
aAll carbon signals are accompanied by the satellite signal of the (3R,3′S/R)-diastereomer in a shift difference of Δδ ≈ 0.005–0.1 ppm.
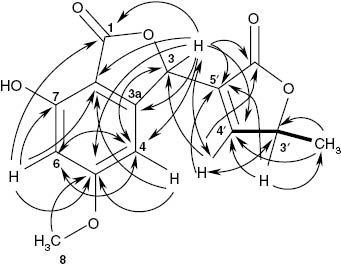
H,H COSY (▬) and HMBC correlations (→, ↔) of (3R,3′R/S)-isotalarone (2).
The remaining aromatic fragment showed two m-coupled aromatic proton signals. Their upfield shift was an indication of one (δ = 6.64 ppm) or two (δ = 6.42 ppm) adjacent oxygen atoms. This was confirmed by HMBC correlations of both protons with a methoxy-bearing carbon at δ = 168.7 ppm that must be in between both protons. The high-field proton coupled further with a phenolic carbon that must be in the o-position of the latter; otherwise, the anellation with a further ring as required by the number of double-bond equivalents would not be possible. H-4 and H-6 both coupled with a second carbonyl at δ = 170.7 ppm. Together with further correlations of H-4, a 7-hydroxy-5-methoxy-phthalide resulted; the position of the methoxy group at C-5 was clearly confirmed by the expected HMBC correlations of C-5 with H-4 and H-6 (see Fig. 3). To fulfill the formula and the number of DBE, it was assumed that the 4-oxypentenoic acid fragment must also be cyclized, forming a butenolide. Further HMBC correlations (Fig. 3) suggested structure 2.
As a final check, the experimental data for compound 2 were processed using the two-dimensional (2D) NMR structure elucidation program Cocon [24]. This resulted in 153 isomers fitting the 2D data; however, only six of these possessed benzene rings with protons in m-position. Four of these alternatives had bridged ring systems and were most unlikely because of their high strain energies. Only structure 2 and one further plausible structure remained (see Supplementary Information, Fig. S9), however in the latter structure, the expected shift for one of the carbonyls (C-1 in 3) was far beyond the experimental values, unequivocally confirming structure 2 as a new natural product. It remained, however, a matter of debate, why all 13C NMR signals of 2 appeared as pairs of nearly equal intensity in the distance of Δδ = 0.005–0.15 ppm to each others.
According to ab initio calculations of CD and ORD data and by comparison with the experimental results, compound 2 is (3R,3′R)- or (3R,3′S)-configured. The (3R) configuration is also in good agreement with the prediction on basis of the exciton chirality method [25], using the positive CD effect in the experimental spectrum. For both diastereomers, DFT calculations indicated positive ORD data, as found in the experiment. The 3′-methyl group influenced, however, neither the CD nor the ORD data sufficiently to distinguish both diastereomers (Supplementary Information, Fig. S16). Ab initio calculations demonstrated that >99 % of all conformers are occupying the expected trans-oxygen orientation (3,3′-s-trans, with respect to the oxygen atoms in the 5-membered rings; see Fig. 4); NMR shift differences for the (3R,3′R) and (3R,3′S) diastereomers were expected therefore. Elevated ab initio NMR calculations [26] delivered, however, identical shift values within ±0.1 ppm. This explains the signal pairs of nearly equal intensity in the 13C NMR spectrum of 2. As their distance was not changed on heating, conformer equilibria were excluded, and the natural product 2 was elucidated as an inseparable 0.8:1 mixture of the (3R,3′R) and (3R,3′S) diastereomers.

Aligned two least energy conformations (Σ Boltzmann factors = 0.9985) of (3R,3′S)-isolalarone (2), according to ab initio calculations with Spartan‘14 (DFT B3LYP, 6-311G*).
In the group of more than 250 microbial phthalides, the only metabolite that is closely related to compound 2 is talaroflavone (4a), an antifungal agent from Verticillium dahliae [9]. Therefore, we named compound 2 as isotalarone to indicate the similarity with 4a, while avoiding any misleading connection to flavones.
As we also isolated talaroflavone (4a) from P. purpurogenum MM, we took the opportunity to determine its absolute configuration, which had not been published before. Ayer and Racok [9] reported a positive plain ORD curve for compound 4a. Ab initio calculation of the optical rotations for the (3S,5′R)- and (3S,5′S)-diastereomers afforded positive leading signs at different wavelengths (see Supplementary Information, Table S3), so that the natural product must have one of these configurations. (For better comparison, compound 5 was numbered according to Ayer and Racok [9]). Our experimental CD spectrum showed, however, only a weak (positive) Cotton effect that was insufficient to distinguish between both diastereomers (Supplementary Information, Fig. S9). Discrimination was possible, however, on the basis of Ayer and Racok’s arguments and their NMR spectra of the diacetate 4b [9]. By molecular modeling, we confirmed that the methyl group of the 5′-acetate residue will be located inside the shielding cone of the aromatic ring in the rel-(3S,5′S) but not in the rel-(3S,5′R) isomer, explaining the observed upfield shift of the aliphatic acetate-methyl group (δH = 1.82); ab initio calculations of the 1H and 13C NMR spectra afforded data in full agreement with the experimental values (see Supplementary Information, Table S4). The absolute configuration of 4a was therefore determined as (3S,5′S).
2.3 (3R,5R)-cis-5-Methyl-3-(2-oxobutyl)-dihydrofuran-2-one
Compound 3, a moderately polar colorless oil, appeared on TLC as a UV non-absorbing zone that turned intense blue, and later to violet, on spraying with anisaldehyde-sulfuric acid. The molecular formula of 3 was established by (+)-ESI HRMS as C9H14O3, indicating the presence of three DBE. The 13C NMR spectrum showed a keto and an acid/ester carbonyl, but no olefinic signals. Thus, compound 3 was assumed to be monocyclic.
A butanone fragment was derived from the 2D spectra (Table 4 and Fig. 5), as the 2H quartet of a methylene group and the triplet of a vicinal methyl group (δ = 2.41, 1.00 ppm, J = 7.3 Hz) showed HMBC correlations with the ketocarbonyl group at δ = 208.2 ppm. The latter was flanked on the other side by a methylene group, as the respective correlations with proton signals at δH = 2.95 and 2.54 ppm (δC = 42.0 ppm) showed. Further, a methyl doublet coupled with an oxymethine multiplet at δ = 4.47 ppm was present. Thus, with reference to the empirical formula, a substituted butanolide must be assumed. It is worth mentioning that no HMBC correlation between H-5 and the lactone carbonyl C-2 was seen. It was not easy to differentiate between the postulated 5-methyl-3-(2-oxobutyl)-γ-valerolactone (3) and the alternative 5-methyl-4-(2-oxobutyl) isomer on the basis of the NMR and NOE data (see Supplementary Information, Fig. S23), as the 13C shifts of C-3 and C-4 and also the proton shifts of 3-H/1′-Ha and 4-Ha/1′-Hb were identical within the error limits. The isomer 3 was finally confirmed by a strong HMBC cross signal between 4-Hb (δ = 1.43 ppm) and the methyl group C-6 (δ = 20.6 ppm). This indicated that C-5 is neighbored by a methylene and not by the methine group at δ = 2.99 ppm (3-H). Further confirmation of the structure was achieved by calculating the IR spectra of all four possible pairs of enantiomers, where the 4,5- and 3,5-disubstituted furan-2-ones differed clearly from each other, favoring structure 3 (see Supplementary Information, Fig. S24–S27).
13C (125 MHz) and 1H NMR (300 MHz, CDCl3) of (3R,5R)-cis-5-methyl-3-(2-oxobutyl)-dihydrofuran-2-one (3).
| No | δC | δH (J in Hz) |
|---|---|---|
| 2 | 178.2 | – |
| 3 | 36.93 | 2.99 (m) |
| 4 | 36.90 | 2.54 (m), 1.43 (m) |
| 5 | 75.3 | 4.47 (m) |
| 6 | 20.6 | 1.36 (d, 6.1) |
| 1′ | 42.0 | 2.97 (m), 2.54 (m) |
| 2′ | 208.2 | – |
| 3′ | 35.8 | 2.44, 2.39 (ABX, 7.4, 3.2) |
| 4′ | 7.5 | 1.00 (t, 7.4) |
Chemical shifts δ are given in ppm.
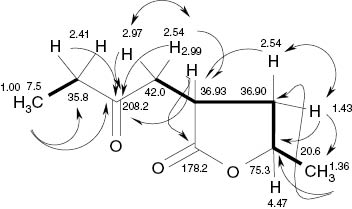
H,H COSY (▬, ↔) and HMBC (→) correlations of (3R,5R)-cis-5-methyl-3-(2-oxobutyl)-dihydrofuran-2-one (3).
The strong NOEs of the oxymethine proton at δ = 4.47 ppm (5-H) with the signals at δ = 2.54 (4-H) and 2.99 ppm (3-H) and between the latter two signals agree best with a syn-facial orientation of 3-H, 4-Ha, and 5-H. This was further confirmed by NOESY correlations of 6-H3 (δ = 1.36 ppm) with 1′-Ha (δ = 2.97 ppm) and 4′-H3 (δ = 1.00 ppm), resulting in the cis orientation of the substituents [(3R,5R) or (3S,5S) configuration]. The absolute configuration of 3 was finally determined as (3R,5R) by the calculation of the ORD data, where this enantiomer afforded a positive optical rotation at 589 nm and a negative CD effect, as found experimentally (Fig. 6).
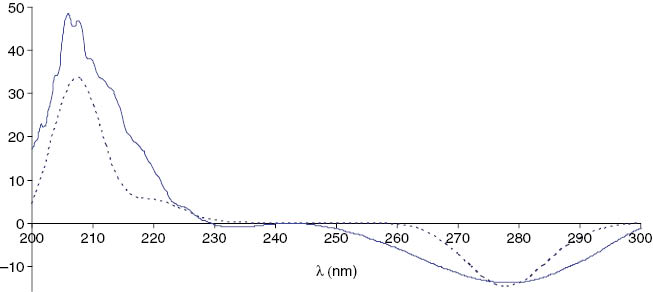
Experimental CD spectrum of (3R,5R)-cis-5-methyl-3-(2-oxobutyl)-dihydrofuran-2-one (3) in methanol (─) and the calculated spectrum of the (3R,5R)-cis-isomer (·····).
Among the rather large group of butanolides in the literature, the 2,4- and 3,4-dialkyl substituted derivatives are very rare microbial metabolites. Only a few compounds structurally related to 3 have been published [19, 27]. Surprisingly, however, compound 3 has been obtained as a side product during the synthesis of 2,33-dihydro-4-oxo-murisolin [28]. The identity of the NMR data is further confirming our structure including the stereochemistry.
2.4 Biological activities
Antimicrobial activity testing of the crude extract of the terrestrial fungus P. purpurogenum MM was carried out, together with the three new compounds 1–3, against 11 microorganisms using the agar diffusion technique. The crude extract showed high toxicity against brine shrimps (95 % at 100 μg/mL), in addition to a moderate to high antimicrobial activity (100 μg/disk) against Gram-positive bacteria [Bacillus subtilis, 11 mm; Staphylococcus aureus, 18 mm; Streptomyces viridochromogenes (Tü 57), 20 mm], microalgae (Chlorella vulgaris, 11 mm; Chlorella sorokiniana, 12 mm; Scenedesmus subspicatus, 13 mm), and phytopathogenic oomycetes (Pythium ultimum, 12 mm; Aphanomyces cochlioides, 20 mm), whereas it showed no activity against Gram-negative bacteria, fungi, and yeast (see Table 5). Compound 1a was inactive in all tests and compound 2 exhibited moderate activity against Gram-positive bacteria [B. subtilis, 15 mm; S. viridochromogenes (Tü 57), 16 mm], whereas compound 3 showed weak-to-moderate activity against Gram-positive bacteria (B. subtilis, 12 mm; S. aureus, 12 mm), Candida albicans (11 mm), and Mucor miehei (12 mm) (40 μg/disk). Compounds 1–3 exhibited no activity against oomycetes and algae. Compounds 1a and 2 showed weak toxicity against brine shrimps (8–11.5 %, 10 μg/mL), whereas compound 3 exhibited the highest toxicity (85 % lethality, 10 μg/mL).
Antimicrobial activities and brine shrimp lethality of the crude extract of P. purpurogenum and the new compounds 1–3.
| Agar diffusion test (40 μg/disk; Ø 9 mm); diameter of inhibition zones (in mm) | Brine shrimp lethality (%) (10 μg/mL) | ||||||||||||
|---|---|---|---|---|---|---|---|---|---|---|---|---|---|
| BSa | SAb | SVc | ECd | CAe | MMf | CVg | CSh | SSi | RSj | PUk | ACl | ||
| Crude extract | 11 | 18 | 20 | – | – | – | 11 | 12 | 13 | – | 12 | 20 | 95 |
| 1a | – | – | – | – | – | – | – | – | – | – | – | – | 10 |
| 2 | 15 | – | 16 | – | – | – | – | – | – | – | – | – | 8.8 |
| 3 | 12 | 12 | – | – | 11 | 12 | – | – | – | – | – | – | 85 |
| Nystatin | – | – | – | – | 25 | – | – | – | – | – | – | – | – |
| Gentamycin | 22 | 21 | ND | 22 | – | – | – | – | – | – | – | – | – |
| Actinomycin D | – | – | – | – | – | – | – | – | – | – | – | – | 100 |
aBacillus subtilis, bStaphylococcus aureus, cStreptomyces viridochromogenes (Tü 57), dEscherichia coli, eCandida albicans, fMucor miehei, gChlorella vulgaris, hChlorella sorokiniana, iScenedesmus subspicatus, jRhizoctonia solani, kPythium ultimum, and lAphanomyces cochlioides; ND, not determined.
3 Experimental section
3.1 General experimental procedure
For the IR spectra, an FT/IR-4100 Infrared Spectrometer (Jasco, Easton, MD, USA) was used. NMR spectra were measured on Varian Unity 300 and Varian Inova 600 spectrometers. For the optical rotations, a polarimeter (model 343; Perkin-Elmer) was used. For the ESI HRMS, Finnigan LCQ ion trap mass spectrometer coupled with a Flux Instruments (Basel, Switzerland) quaternary pump Rheos 4000 and an HP 1100 HPLC (Nucleosil column EC 125/2, 100-5, C 18) with autosampler (Jasco 851-AS; Jasco) and a diode array detector (Finnigan Surveyor LC System) were used. HRMS were recorded by ESI MS on an Apex IV 7 Tesla Fourier-Transform Ion Cyclotron Resonance Mass Spectrometer (Bruker Daltonics, Billerica, MA, USA). UV/Vis spectra were recorded on a Perkin-Elmer Lambda 15 UV/Vis spectrometer. Rf values were determined on Polygram SIL G/UV254 (Macherey & Nagel, Düren, Germany). Size exclusion chromatography was performed on Sephadex LH-20 (Lipophilic Sephadex; Amersham Biosciences, purchased from Sigma-Aldrich Chemie, Steinheim, Germany).
3.2 Isolation and taxonomy of the producing strain
The terrestrial P. purpurogenum MM was isolated from deteriorated cotton textile by placing textile parts on a water agar medium (20 g agar-agar/L of tap water) and incubating at 28 °C for 7 days. The developing colonies were then transferred to Czapek-Dox agar medium (g/L: 30 sucrose, 3 NaNO3, 1 K2HPO4, 0.5 KCl, 0.5 MgSO4, 0.01 FeSO4, and 20 agar-agar) and incubated at 28 °C for 14 days. Colonies on Czapeck-Dox agar medium grew rather restrictedly, attaining a diameter of only 1.5–2.5 cm in 12 days. These colonies consisted of yellow to orange-red mycelia bearing abundant conidial structures that were deep red to dark reddish purple shaded from the underside, whereas the surrounding agar was lighter in color. Under a light microscope, conidiophores arising from the substrate and measuring up to 100–150 μm in length by 2.5 to 3.5 μm in diameter were observed. These were biverticillate, symmetrical, and compact, as is typical for Penicillium. Conidia were subglobose, irregularly roughened, and thick-walled, with 3.0–3.5 × 2.5–3.0 μm dimensions. Based on its cultural and morphological features, and according to Raper and Fennel [29], the fungus was identified as P. purpurogenum. The strain is deposited in the collection of Dr. M. M. El Metwally, Mycology Laboratory, Botany and Microbiology Department, Damanhour University, Damanhour, Egypt.
3.3 Fermentation, extraction, and isolation
The P. purpurogenum isolate MM was inoculated from well grown agar plates with dark green sporulating colonies into 100 one-liter Erlenmeyer flasks, each containing 300 mL of M2 medium (g/L): malt extract (10), peptone (4), glucose (4), and demineralized water. The pH was adjusted to 7.8 using 2 N NaOH before sterilization. Fermentation was carried out on a linear shaker for 6 days at 28 °C (110 rpm). After cultivation, the culture broth was filtered over Celite under pressure. The mycelium was macerated in methanol (3×), and the methanol extract was then concentrated in vacuo. The remaining aqueous residue was re-extracted with ethyl acetate and concentrated, affording 2.1 g of a dark green crude extract.
The filtrate from the culture broth was extracted with XAD-16 resin, and the adsorbed organic material was eluted with methanol. The methanol extract was evaporated in vacuo and the residual water was extracted with ethyl acetate followed by concentration to afford 5.1 g of a second dark green extract. Both crude organic extracts were combined, as TLC showed identical compositions.
The combined extract (7.14 g) was separated by column chromatography on silica gel (40 × 10 cm) with a cyclohexane-CH2Cl2-MeOH gradient [0.2 L cyclohexane, 0.5 L cyclohexane-CH2Cl2 (1:1), 0.5 L CH2Cl2, 0.5 L CH2Cl2-MeOH (97:2), 1 L CH2Cl2-MeOH (95:5), 0.5 L CH2Cl2-MeOH (93:7), 1 L CH2Cl2-MeOH (90:1), 0.5 L CH2Cl2-MeOH (80:20), 0.5 L CH2Cl2-MeOH (50:50); 0.5 L MeOH]. According to TLC monitoring, four fractions were obtained: F-I (0.57 g), F-II (1.26 g), F-III (4.5 g), F-IV (0.2 g). Further column chromatography of fraction II on silica gel with a CH2Cl2-MeOH gradient afforded two sub-fractions, MSSP1 (0.22 g) and MSSP2 (0.32 g). Purification of MSSP1 using Sephadex LH-20 (CH2Cl2-40 % MeOH) afforded linoleic acid as a colorless oil (150 mg). Fraction III afforded on silica gel (column 100 × 2 cm with a cyclohexane-CH2Cl2-MeOH gradient) five sub-fractions F-IIIa (0.1 g), F-IIIb (0.2 g), F-IIIc (1.8 g), F-IIId (1.1 g), and F-IIIe (0.8 g) after monitoring by TLC. Sub-fraction F-IIIa delivered on silica gel and Sephadex LH-20 (CH2Cl2-40 % MeOH) a further 35 mg of linoleic acid as a colorless oil. In a similar way, sub-fraction F-IIIc afforded talaroflavone (4a, 10 mg), pestalasin A (10 mg), altenuene (5 mg), penicillide (11 mg), and rubralactone (4 mg) as colorless solids.
Sub-fraction F-IIId yielded in the same way glycerol monolinoleate (40 mg), diaporthin (11 mg), altenuene (6 mg), butyrolactone 1 (7 mg), 4-hydroxy-2-methoxyacetanilide (2 mg), ergosterol peroxide (7 mg), and butyrolactone-V (2 mg). Purification of sub-fraction F-IIIe using silica gel (CH2Cl2-MeOH gradient), followed by PTLC and Sephadex LH-20 (CH2Cl2-40 % MeOH) delivered ergosterol (10 mg), 3′-O-methyl-dehydroisopenicillide (3 mg), (3R,3′R/S)-isotalarone (2, 3 mg), and (3R,5R)-cis-5-methyl-3-(2-oxobutyl)-dihydrofuran-2-one (3, 12 mg). Finally, fraction F-IV (0.2 g) afforded on Sephadex LH-20 (MeOH) tenellic acid B (1b, 6 mg) and (S)-tenellic acid B dimethyl acetal (1a, 7 mg) as yellow solids.
3.4 Antimicrobial assay using agar diffusion test
Antimicrobial assays were conducted utilizing the agar diffusion method [30] against diverse sets of microorganisms. The P. purpurogenum MM extract and the pure compounds 1–3 were dissolved in CH2Cl2-MeOH (9:1), and paper disks with a diameter of 9 mm (no. 2668; Schleicher & Schüll, Dassel, Germany) were impregnated with 40 μg of the pure compounds and 1 mg of the crude extract, respectively. The disks were dried for 1 h under sterile conditions, placed on pre-made agar test plates, and incubated for 24 h at 38 °C for bacteria and 48 h (30 °C) for the fungal strains, whereas the algae were incubated at ~22 °C in daylight for 8–10 days. Nystatin was used as positive control at 40 μg/paper disk for C. albicans (giving an inhibition zone diameter of 25 mm), and gentamycin for bacteria (giving a diameter of inhibition zone of 22 mm for B. subtilis and E. coli and 21 mm for S. aureus).
3.5 Brine shrimp microwell cytotoxicity assay
The cytotoxic assay was performed according to Takahashi et al. [31] and Sajid et al. [32]. Actinomycin D (10 μg/mL) was used as a positive control, and DMSO (10 μL) was used as the blank value.
3.6 Quantum-mechanical calculations
The least-energy conformations of the investigated compounds were determined with semi-empirical methods, using PM3 (Parameterized Model number 3), implemented in Spartan‘14 [26]. Depending on the respective structure, between ~15 (5a) and ~31.000 (2a), conformers were optimized. All structures within an energy range of 7 kcal/mol above the respective least energy value were further optimized with Gaussian 09 [33] using DFT calculations with the B3LYP functional and the 6-311G (2d, p) basis set. The ECD spectra of all conformers with Boltzmann factors ≥0.001 were calculated on the same level of theory; ORD data were obtained with WB97XD/6-311G(d,p); IR spectra were calculated with the B3LYP functional and the dgdzvp basis set. For the calculation of NMR data, see Table 1.
4 Supplementary information
NMR spectra and other supporting data associated with this article can be found in the online version (DOI: 10.1515/znb-2015-0185).
Dedicated to: Prof. Dr. A. Zeeck on the occasion of his 75th birthday.
Acknowledgments
The authors are thankful to Dr. H. Frauendorf and Mr. R. Machinek for the spectral measurements, Miss F. Lissy for biological activity testing, Mr. A. Kohl for his technical assistance, and Dr. S. Hickford for careful language polishing. Special thanks to Dr. Sean Ohlinger and Dr. Warren Hehre (Wavefunction, Irvine, CA, USA) for valuable discussions and for helping us to make better use of Spartan. Dr. Warren Hehre also contributed most of the NMR calculations. This research project was financed by the PPP Egypt 09 Program (German Egyptian Scientific Projects of the German Academic Exchange Service).
References
[1] H. Laatsch, AntiBase, A Data Base for Rapid Structural Determination of Microbial Natural Products (Annual Updates), Wiley-VCH, Weinheim, 2014.Search in Google Scholar
[2] M. S. Butler, J. Nat. Prod. 2004, 67, 2141.10.1021/np040106ySearch in Google Scholar
[3] S. F. Brady, J. Clardy, J. Nat. Prod. 2000, 63, 1447.10.1021/np990568pSearch in Google Scholar
[4] S. B. Singh, D. L. Zink, Z. Guan, J. Collado, F. Pelaez, P. J. Felock, D. J. Hazuda, Helv. Chim. Acta2003, 86, 3380.10.1002/hlca.200390281Search in Google Scholar
[5] H. W. Zhang, Y. C. Song, R. X. Tan, Nat. Prod. Rep. 2006, 23, 753.10.1039/b609472bSearch in Google Scholar
[6] Y. C.Song, H. Li, Y. H. Ye, C. Y. Shan,Y. M. Yang, R. X. Tan, FEMS Microbiol. Lett. 2004, 241, 67.10.1016/j.femsle.2004.10.005Search in Google Scholar
[7] G. Strobel, B. Daisy, Microbiol. Mol. Biol. Rev. 2003, 67, 491.10.1128/MMBR.67.4.491-502.2003Search in Google Scholar
[8] A. E. H. A. Hassan, Dissertation, University of Düsseldorf, Düsseldorf, Germany, 2007.Search in Google Scholar
[9] W. A. Ayer, J. S. Racok, Can. J. Chem. 1990, 68, 2085.10.1139/v90-318Search in Google Scholar
[10] H. Oh, T. O. Kwon, J. B. Gloer, L. Marvanová, C. A. Shearer, J. Nat. Prod.1999, 62, 580.10.1021/np980496mSearch in Google Scholar
[11] J. Xu, J. Kjer, J. Sendker, V. Wray, H. Guan, R. Edrada, W. E. G. Müller, M. Bayer, W. Lin, J. Wu, P. Proksch, Bioorg. Med. Chem.2009, 17, 7362.10.1016/j.bmc.2009.08.031Search in Google Scholar
[12] C. H. Turner, T. A. Crabb, N. L. Bradburn, R. D. Coker, G. Blunden, Phytochemistry1994, 35, 665.10.1016/S0031-9422(00)90583-1Search in Google Scholar
[13] S. I. Komai, T. Hosoe, T. Itabashi, K. Nozawa, T. Yaguchi, K. Fukushima, K. I. Kawai, J. Nat. Med. 2006, 60, 185.10.1007/s11418-005-0028-9Search in Google Scholar
[14] Y. Zhang, X. M. Li, Z. Shang, C.-S. Li, N. Y. Ji, B. G. Wang, J. Nat. Prod. 2012, 75, 1888.10.1021/np300377bSearch in Google Scholar
[15] H. Kawamura, T. Kaneko, H. Koshino, Y. Esumi, J. Uzawa, F. Sugawara, Nat. Prod. Lett.2000, 14, 477.10.1080/10575630008043788Search in Google Scholar
[16] Y. Kimura, T. Yoshinari, H. Koshino, S. Fujioka, K. Okada, A. Shimada, Biosci. Biotechnol. Biochem.2007, 71, 1896.10.1271/bbb.70112Search in Google Scholar
[17] J. P. Harris, P. G. Mantle, Phytochemistry2001, 57, 165.10.1016/S0031-9422(01)00004-8Search in Google Scholar
[18] M. M. S. Nagia, M. M. El-Metwally, M. Shaaban, S. M. El-Zalabani, A. G. Hanna, Org. Med. Chem. Lett. 2012, 2, 1.10.1186/2191-2858-2-9Search in Google Scholar
[19] J. A. Findlay, G. Li, J. D. Miller, T. O. Womiloju, Can. J. Chem. 2003, 81, 284.10.1139/v03-044Search in Google Scholar
[20] C.-N. Lin, S.-H. Kuo, S.-J. Won, Phytochemistry1993, 32, 1549.Search in Google Scholar
[21] M. Shaaban, Dissertation, Georg-August University, Göttingen, Germany, 2004.Search in Google Scholar
[22] Z. Lin, J. Wen, T. Zhu, Y. Fang, Q. Gu, W. Zhu, J. Antibiot. 2008, 61, 81.10.1038/ja.2008.114Search in Google Scholar
[23] A. G. Hanna, N. M. M. Shalaby, N. A. M. Morsy, A. Simon, G. Toth, S. Malik, H. Duddeck, Magn. Reson. Chem.2002, 40, 599.10.1002/mrc.1057Search in Google Scholar
[24] T. Lindel, J. Junker, M. Köck, Eur. J. Org. Chem. 1999, 1999, 573.10.1002/(SICI)1099-0690(199903)1999:3<573::AID-EJOC573>3.0.CO;2-NSearch in Google Scholar
[25] H.-U. Humpf in Bioactive Natural Products (Eds.: S. M. Colegate, R. J. Molyneux), CRC Press, Boca Raton, FL, 2008, p. 191.Search in Google Scholar
[26] Spartan‘14, Wavefunction, Irvine, CA (USA), 2014.Search in Google Scholar
[27] C. Pathirana, R. Dwight, P. R. Jensen, W. Fenical, A. Delgado, L. S. Brinen, J. Clardy, Tetrahedron Lett. 1991, 32, 7001.10.1016/0040-4039(91)85024-YSearch in Google Scholar
[28] B. Figadère, J.-C. Harmange, L. X. Hai, A. Cavé, A. Tetrahedron Lett. 1992, 33, 5189.10.1016/S0040-4039(00)79129-5Search in Google Scholar
[29] K. B. Raper, D. I. Fennel, The Genus Aspergillus, Williams & Wilkins, Baltimore, MD, 1965.Search in Google Scholar
[30] P. R. Burkholder, L. M. Burkholder, L. R. Almodovar, Bot. Mar.1960, 2, 149.10.1515/botm.1960.2.1-2.149Search in Google Scholar
[31] A. Takahashi, S. Kurasawa, D. Ikeda, Y. Okami, T. Takeuchi, J. Antibiot. 1989, 32, 1556.10.7164/antibiotics.42.1556Search in Google Scholar
[32] I. Sajid, Y. C. B. Fondja, K. A. Shaaban, S. Hasnain, H. Laatsch, World J. Microbiol. Biotechnol.2009, 25, 601.10.1007/s11274-008-9928-7Search in Google Scholar
[33] M. J. Frisch, G. W. Trucks, H. B. Schlegel, G. E. Scuseria, M. A. Robb, J. R. Cheeseman, G. Scalmani, V. Barone, B. Mennucci, G. A. Petersson, H. Nakatsuji, M. Caricato, X. Li, H. P. Hratchian, A. F. Izmaylov, J. Bloino, G. Zheng, J. L. Sonnenberg, M. Hada, M. Ehara, K. Toyota, R. Fukuda, J. Hasegawa, M. Ishida, T. Nakajima, Y. Honda, O. Kitao, H. Nakai, T. Vreven, J. A. Montgomery, Jr., J. E. Peralta, F. Ogliaro, M. Bearpark, J. J. Heyd, E. Brothers, K. N. Kudin, V. N. Staroverov, R. Kobayashi, J. Normand, K. Raghavachari, A. Rendell, J. C. Burant, S. S. Iyengar, J. Tomasi, M. Cossi, N. Rega, J. M. Millam, M. Klene, J. E. Knox, J. B. Cross, V. Bakken, C. Adamo, J. Jaramillo, R. Gomperts, R. E. Stratmann, O. Yazyev, A. J. Austin, R. Cammi, C. Pomelli, J. W. Ochterski, R. L. Martin, K. Morokuma, V. G. Zakrzewski, G. A. Voth, P. Salvador, J. J. Dannenberg, S. Dapprich, A. D. Daniels, O. Farkas, J. B. Foresman, J. V. Ortiz, J. Cioslowski, D. J. Fox, Gaussian 09w (version 7.0), Gaussian, Wallingford, CT (USA), 2009.Search in Google Scholar
Supplemental Material:
The online version of this article (DOI: 10.1515/znb-2015-0185) offers supplementary material, available to authorized users.
©2016 by De Gruyter
Articles in the same Issue
- Frontmatter
- In this Issue
- Ferromagnetism in Fe3−x−yNixGeTe2
- A novel potentiometric sensor based on urease/ bovine serum albumin-poly(3,4-ethylenedioxythiophene)/Pt for urea detection
- Two new glycosidal metabolites of endophytic fungus Penicillium sp. (NO.4) from Tapiscia sinensis
- New bioactive metabolites from Penicillium purpurogenum MM
- Long-chain alkyl-substituted gentisic acid and benzoquinone derivatives from the root of Micronychia tsiramiramy (Anacardiaceae)
- A tetranuclear copper (II) complex with pyrazole-3,5-dicarboxylate ligands: synthesis, characterization and electrochemical properties
- Synthesis and structure of a cobalt coordination polymer based on 2,8-di(pyridin-4-yl)dibenzothiophene and 4,4-dicarboxydiphenylsulfone
- nBu4NI-catalyzed direct amination of benzoxazoles with tertiary amines using TBHP as oxidant under microwave irradiation
- Synthesis, single-crystal structure determination and Raman spectra of the tricyanomelaminates NaA5[C6N9]2 · 4 H2O (A = Rb, Cs)
- Synthesis of structural analogues of GGT1-DU40, a potent GGTase-1 inhibitor
- Note
- Crystal structure of a dimeric 1-benzothiepin