Structural and spectroscopic characterization of isotypic sodium, rubidium and cesium acesulfamates
-
Oscar E. Piro


Abstract
Three new acesulfamate salts, NaC4H4NO4S, RbC4H4NO4S and CsC4H4NO4S, were prepared by reactions in aqueous solutions and thoroughly characterized. Their crystal and molecular structures were determined by single crystal X-ray diffraction methods. They crystallize in the monoclinic space group P21/a with a = 7.2518(2), b = 8.9414(4), c = 10.5929(4) Å, β = 99.951(3)°, V = 676.52(4) Å3 for the Na salt; a = 7.4663(3), b = 9.6962(4), c = 10.4391(4) Å, β = 95.150(3)°, V = 752.68(5) Å3 for the Rb salt and a = 7.5995(4), b = 9.9439(4), c = 10.8814(6) Å, β = 91.298(5)°, V = 822.08(7) Å3 for the Cs salt, and Z = 4 molecules per unit cell. The three compounds are isotypic to each other and to the previously reported potassium salt. The metal ions are in irregular polyhedral coordination with six neighboring acesulfamate anions through their nitrogen and carbonyl and sulfoxide oxygen atoms. The FTIR spectra of the compounds were also recorded and are briefly discussed.
1 Introduction
Acesulfame-K, the potassium salt of 6-methyl-1,2,3-oxathiazin-4(3H)-one-2-2-dioxide, discovered by Clauss and Jensen [1, 2], is one of the most widely used non-caloric artificial sweeteners and has about 200 times the sweetening capacity of sucrose [2, 3]. Its general chemical and biological properties have been thoroughly investigated [1–3], and its crystal structure has also been determined [4].
From the chemical and structural points of view, the acesulfamate anion (Fig. 1) bears some resemblance to saccharin (1,2-benzothiazole-3(2H)-one-1,1-dioxide), whose coordination capacity has been intensively exploited during the past few years (for a recent review cf. [5]). The acesulfamate anion presents different potential coordination sites: the iminic nitrogen, the carbonylic oxygen and the two sulfonyl oxygen atoms, and it can act as a monodentate, bidentate or bridging ligand, in the same way as saccharinate, as demonstrated by a number of acesulfamato metal complexes reported during the last years [6–14].
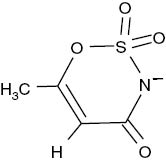
Formula drawing of the acesulfamate anion.
In order to contribute to better and wider knowledge of this interesting anion, it seemed valuable to investigate also some of its most simple salts. In this context, we have recently prepared and characterized ammonium acesulfamate [15], and, extending this work, we have now performed a similar study of the corresponding sodium, rubidium and cesium salts.
2 Results and discussion
2.1 Structural characteristics of the compounds
Crystals of the sodium, rubidium and cesium acesulfamates are isotypic to each other and to the corresponding potassium salt. An Ortep [16] plot of the rubidium salt is shown in Fig. 2, and the corresponding bond distances and angles within the acesulfamate anion are given in Table 1. These geometric parameters are representative of the full series as the rms deviation of the non-H atoms from the best least-squares fitting of any two molecules in the family (calculated by Kabsh’s procedure [17]) is < 0.1 Å. The observed bond distances and angles within the acesulfamate anions follow Organic Chemistry’s rules, in accordance with values reported for the ammonium [15] and choline [18] salts. Particularly, the short C3–C4 distance of 1.316(6) Å confirms the formal double bond character expected for this link. The carbonyl >C=O distance is 1.231(5) Å and the sulfoxide S=O distances are 1.415(3) and 1.421(3) Å. The ring single bond lengths are d(C–O) = 1.381(5) Å, d(O–S) = 1.619(3) Å, d(S–N) = 1.544(4) Å, d(C–N) = 1.351(6) Å and d(C–C) = 1.455(6) Å.
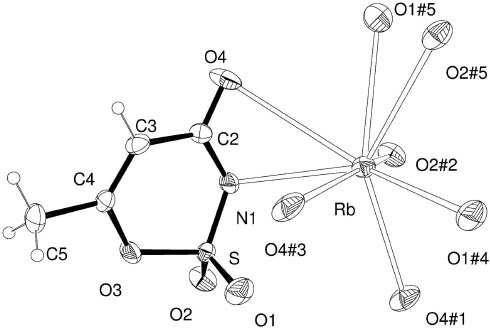
View of rubidium-acesulfamate salt showing the labeling of the non-H atoms and their displacement ellipsoids at the 30 % probability level. Metal-ligand short contacts up to 3.5 Å are indicated by dashed lines. Crystal symmetry operations: (#1) −x+ 1/2, y− 1/2, −z; (#2) x− 1/2, −y+ 1/2, z; (#3) −x+ 1/2, y+ 1/2, −z; (#4) −x+ 1, −y, −z; (#5) −x, −y, −z.
Intra-molecular bond distances (Å) and angles (°) of the acesulfamate anion in the rubidium salt.
| C(2)–O(4) | 1.231(5) | N(1)–C(2)–C(3) | 118.7(4) |
| C(2)–N(1) | 1.351(6) | C(4)–C(3)–C(2) | 124.6(4) |
| C(2)–C(3) | 1.455(6) | C(3)–C(4)–O(3) | 120.9(4) |
| C(3)–C(4) | 1.316(6) | C(3)–C(4)–C(5) | 128.3(4) |
| C(4)–O(3) | 1.381(5) | O(3)–C(4)–C(5) | 110.7(4) |
| C(4)–C(5) | 1.490(6) | C(2)–N(1)–S | 122.6(3) |
| N(1)–S | 1.544(4) | C(4)–O(3)–S | 118.9(3) |
| O(1)–S | 1.415(3) | O(1)–S–O(2) | 114.0(2) |
| O(2)–S | 1.421(3) | O(1)–S–N(1) | 113.4(2) |
| O(3)–S | 1.619(3) | O(2)–S–N(1) | 112.4(2) |
| O(1)–S–O(3) | 106.1(2) | ||
| O(4)–C(2)–N(1) | 119.6(4) | O(2)–S–O(3) | 101.8(2) |
| O(4)–C(2)–C(3) | 121.7(4) | N(1)–S–O(3) | 108.1(2) |
The mentioned bond lengths can be compared with those of the free acesulfamic acid. This crystallizes in two polymorphic forms: one triclinic, space group P1̅ with Z = 2, and the other monoclinic, space group P21/c with two crystallographically independent molecules per asymmetric unit (Z = 8) [19]. Referred to the better refined triclinic form, the major change in the bonding structure of the acesulfamate anion in the Rb salt occurs at the S–N bond, which upon deprotonation shortens in 0.085 Å (about 20 times the standard error σ). A much smaller shortening (−0.03 Å = −5σ) is observed in the N–C bond length. Other major bond length changes when going from the acid to the anion are observed in the ring S–O and O–C bonds (+ 0.026 Å = +8.5σ and +0.024 Å = + 5σ, respectively).
All three acesulfamate binding sites mentioned above are at short contacts with alkali cations. The sodium ion in the Na-acesulfamate salt is in a distorted square pyramidal environment, cis-coordinated at the basis to two carbonyl oxygen and two sulfoxide oxygen atoms, belonging to four neighboring acesulfamate anions. The pyramid apex is occupied by the N atom of a fifth ligand. As the radius of the alkali cations increases when going from sodium to rubidium and cesium, additional ligand atoms enter the coordination sphere and the cation (up to a sphere of 3.5 Å radius) is now in an irregular 8-fold polyhedral coordination with six neighboring acesulfamate anions through the nitrogen and carbonyl oxygen atoms of one molecule, both sulfoxide oxygen atoms of a second one, one sulfoxide oxygen of a third and fourth molecule, and one carbonyl oxygen atom of two other molecules. This coordination in Rb acesulfamate is shown in Fig. 2, and the corresponding metal–ligand short contact distances in M acesulfamate (M = Na, Rb, Cs) are detailed in Table 2. The strong correlation of these distances with the metal ion radius along the isotypic M-acesulfamates (M = Na, K, Rb, Cs) series [r(Na+) < r(K+) < r(Rb+) < r(Cs+)] can be clearly appreciated. In fact, M–N distances are 2.570(2), 2.826, 3.099(4) and 3.289(5) Å, respectively, for the Na, K [4], Rb and Cs salts; M–O(carb) distances are 2.345(2) and 2.352(2) Å for Na acesulfamate and in the intervals 2.776–3.282 Å (K), 2.849(3)–3.432(4) Å (Rb) and 3.105(4)–3.396(5) Å (Cs); M–O(sulf) distances are 2.379(2) and 2.398(2) Å for Na acesulfamate and in the ranges 2.724–3.053 Å (K), 2.882(3)–3.159(4) Å (Rb) and 3.054(5)–3.480(6) Å (Cs). This systematic increase in the metal–ligand distances with the ionic radius along the family members is reflected by the observed correlated increase in their crystal cell volumes, namely V(Na) < V(K) < V(Rb) < V(Cs), as shown in Table 3. The relatively large increase in the length of the b axis when going from Na+ to K+, Rb+ and Cs+ ions could possibly be traced to the relatively large increase in the ionic radii of K+, Rb+ and Cs+ as compared with the much smaller Na+ cation (about 35 % from Na+ to K+, only 9.4 % from K+ to Rb+ and 12 % from Rb+ to Cs+). As explained above, this results in an increase in the number of ligands within the metal coordination sphere from five (Na) to eight (Rb, Cs), a fact which could be related to the abrupt swelling of the crystal mostly along the b axis as only a smooth increase in the unit cell ac area along the series is observed (see again Table 3).
Short contacts up to 3.5 Å around the alkali cation in the isotypic sodium, rubidium and cesium acesulfamates.a
| Na acesulfamate | Rb acesulfamate | Cs acesulfamate | |||
|---|---|---|---|---|---|
| Na–N(1) | 2.570(2) | Rb–N(1) | 3.099(4) | Cs–N(1) | 3.289(5) |
| Na–O(4)#1 | 2.345(2) | Rb–O(4)#1 | 2.849(3) | Cs–O(4)#1 | 3.105(4) |
| Na–O(4)#2 | 2.352(2) | Rb–O(4)#2 | 2.902(4) | Cs–O(4)#2 | 3.114(5) |
| Na–O(1)#3 | 2.379(2) | Rb–O(1)#3 | 3.159(4) | Cs–O(1)#3 | 3.480(6) |
| Na–O(2)#4 | 2.398(2) | Rb–O(2)#4 | 2.882(3) | Cs–O(2)#4 | 3.054(5) |
| Rb–O(4) | 3.432(4) | Cs–O(4) | 3.396(5) | ||
| Rb–O(1)#5 | 2.964(3) | Cs–O(1)#5 | 3.082(4) | ||
| Rb–O(2)#3 | 3.142(4) | Cs–O(2)#3 | 3.322(5) | ||
aSymmetry transformations used to generate equivalent atoms: (#1) −x+1/2, y − 1/2, −z; (#2) x−1/2, −y+1/2, z; (#3) −x+1/2, y+1/2, −z; (#4) −x+1, −y, −z; (#5) −x, −y, −z.
Cell constants along the series of M-acesulfamate (M = Na, K, Rb, Cs) salts.
| Salt | a, Å | b, Å | c, Å | β, ° | V, Å3 | ac area, Å2 |
|---|---|---|---|---|---|---|
| Na acesulfamate | 7.2518(2) | 8.9414(4) | 10.5929(4) | 99.951(3) | 676.52(4) | 75.662(9) |
| K acesulfamatea | 7.283(3) | 9.483(5) | 10.797(4) | 103.11(5) | 726.3(8) | 76.59(8) |
| Rb acesulfamate | 7.4663(3) | 9.6962(4) | 10.4391(4) | 95.150(3) | 752.68(5) | 77.627(6) |
| Cs acesulfamate | 7.5995(4) | 9.9439(4) | 10.8814(6) | 91.298(5) | 822.08(7) | 82.672(9) |
aFrom [4] after interchanging the crystal axes a and c to transform the reported space group P21/c to P21/a used in this study.
2.2 Infrared spectra
In agreement with the fact that all three of the investigated acesulfamates are isostructural, their FTIR spectra are practically identical. These spectra are also comparable to that found for the potassium salt. In general, only very small differences in the position and/or intensity of some bands are observed. As an example, the spectrum of the rubidium salt, in the spectral range between 2000 and 400 cm−1, is shown in Fig. 3.
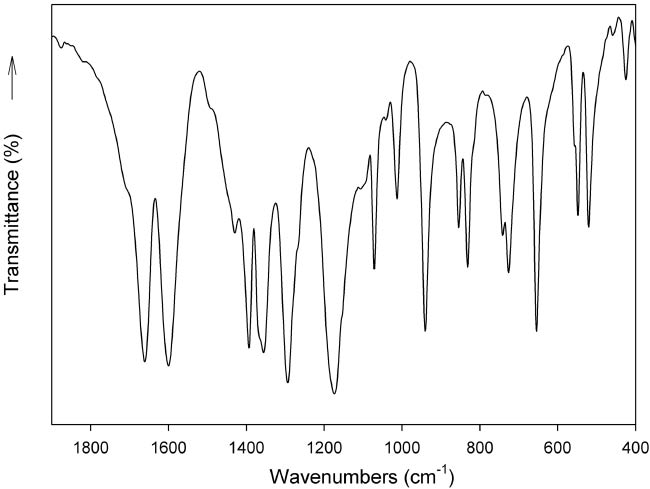
FTIR spectrum of rubidium acesulfamate in the spectral range between 2000 and 400 cm−1.
The proposed assignments are presented in Table 4. These assignments were performed on the basis of a recent experimental and density functional theoretical (DFT) study of potassium acesulfamate [20] and of our previous work on ammonium acesulfamate [15].
Assignment of the FTIR spectra of sodium, rubidium and cesium acesulfamates (band positions in cm−1).
| Na acesulfamate | Rb acesulfamate | Cs acesulfamate | Assignments |
|---|---|---|---|
| 1657 vs, 1595 vs | 1661 vs, 1598 vs | 1659 vs, 1594 vs | ν(C=O)+ ν(C–C)ring |
| 1501 vw | 1492 vw | 1495 vw | δ(CH3) |
| 1429 w/1392 vs | 1429 w/1393 vs | 1429 w/1392 s | δ(CH3) |
| 1360 vs | 1367 vs | 1358 s | νas(SO2) |
| 1296 vs | 1295 vs | 1295 vs | ν(CN)+ ν(OC)+ δ(CCH) |
| 1180 vs | 1180 vs | 1176 vs | νs(SO2)+ ν(SN) |
| 1076 s | 1074 s | 1075 m | δ(CH3) |
| 1013 s | 1013 s | 1012 m | ν(OC)+ ν(SN) |
| 942 vs | 941 vs | 940 s | ν(OC)+ ν(C–CH3) |
| 862 s | 855 s | 855 m | τ(ring) |
| 835 s | 832 s | 825 m | ν(SN)+ ν(CC)+ δ(NCO) |
| 746 m/728 s | 743 w/728 s | 745 m/728 s | τ(ring) |
| 655 vs/626 m | 655 vs | 654 s | δ(ring) |
| 560 m/546 s | 558 sh/547 s | 558 sh/547 m | δ(ring)+ δ(SO2) |
| 521 s | 521 s | 521 s | δ(ring) |
| 477 m | 456 w, 426 m | 452 vw, 428 w | δ(ring) |
vs, very strong; s, strong; m, medium; w, weak; vw, very weak; sh, shoulder.
As in the previously investigated cases, vibrational modes related to ν(C=O) and ν(C–C) vibrations are strongly coupled and result in two of the most intense IR bands.
The 1295 cm−1 IR band, which is also very strong, is probably dominated by the ν(CN) stretching vibration [20], coupled with some other motions.
Bands related to the vibrational modes of the sulfonyl moiety appear at somewhat higher energies than in sodium saccharinate and in other saccharinato complexes [5, 21, 22]. The corresponding νs(SO2) vibration is surely partially coupled with other vibrational modes [20], as also found in the case of saccharinato complexes [5, 21–23].
3 Experimental section
3.1 Materials and measurements
Potassium acesulfamate was supplied by Fluka (Sigma-Aldrich, Steinheim, Germany), rubidium and cesium carbonates by Aldrich (St. Louis, MO, USA), whereas all the other employed reagents were from Merck (Darmstadt, Germany), analytical grade, and were used as purchased. Elemental analysis of the compounds was performed with a Carlo Erba (Milano, Italy) model EA 1108 elemental analyzer. The infrared spectra were recorded on a FTIR-Bruker (Billerica, MA, USA) EQUINOX-55 spectrophotometer in the spectral range between 4000 and 400 cm−1, using the KBr pellet technique.
3.2 Synthesis of the compounds
Acesulfamic acid was prepared as described by Velaga et al. [19], as follows: to 5.00 g of potassium acesulfamate dissolved in a small portion of water (ca. 10 mL), 6 mL of concentrated HCl was added dropwise. The generated acid was extracted with 20 mL of ethyl acetate. After evaporation of the solvent in air, a colorless solid was deposited. It was re-crystallized twice from ethyl acetate, generating a deposit of needle-like colorless crystals, after slow evaporation of the solvent in air (m.p. 122–124 °C [19]).
For the synthesis of the Rb and Cs salts, 2.0 mmol of acesulfamic acid was dissolved in 15 mL of distilled water and heated to 75 °C. To this solution, 1.0 mmol of the corresponding alkali-metal carbonate (Rb2CO3 or Cs2CO3) was slowly added, under constant stirring. After this addition, the solution was stirred for another 30 min at the same temperature, and finally it was left to evaporate in air. After a few days, a colorless powder, highly soluble in water, was collected and re-crystallized from water (yield ca. 0.35 g for RbC4H4NO4S and ca. 0.45 g for CsC4H4NO4S). Attempts to prepare the Na salt by this methodology failed, as only an oily, highly hygroscopic residue was obtained. Therefore, a different methodology was used, as follows: 5.0 mmol of potassium acesulfamate was dissolved in 10 mL of distilled water and heated to 85 °C. To this solution 5.0 mmol of NaClO4 · H2O was slowly added, under constant stirring, and then the solution was kept for another 45 min at the same temperature. The solution was cooled to room temperature and then left in a refrigerator (−5 °C) for 30 min. The precipitated KClO4 was separated from the cold solution by filtration and the remaining solution was left to evaporate in air. After four days well-formed colorless crystals were deposited (yield ca. 0.50 g).
The purity of the salts was confirmed by elemental analysis: C4H4NNaO4S (185.13): calcd. C 25.93, H 2.16, N 7.56, S 17.32; found C 25.88, H 2.18, N 7.50, S 17.26; C4H4NO4RbS (247.61): calcd. C 19.38, H 1.61, N 5.65, S 12.95; found 19.33, H 1.66, N 5.60, S 12.97; C4H4CsNO4S (295.05): calcd. C 16.27, H 1.35, N, 4.74, S 10.87; found C 16.30, H 1.33, N 4.72, S 10.84. In all cases, single crystals adequate for X-ray diffraction studies were selected from the crystalline mass employing a microscope.
3.3 Crystal structure determinations
The measurements of Na–acesulfamate crystals were performed on an Enraf–Nonius Kappa-CCD diffractometer with graphite monochromated MoKα (λ = 0.71073 Å) radiation. Diffraction data were collected (φ- and ω-scans with κ-offsets) with Collect [24]. Integration and scaling of the reflections was performed with the HKL DENZO-SCALEPACK [25] suite of programs. The unit cell parameters were obtained by least-squares refinement based on the angular settings for all collected reflections using HKL SCALEPACK [25]. No absorption correction was applied as the linear absorption coefficient (μ) times the largest crystal dimension was 0.1.
Data collections on Rb- and Cs–acesulfamate crystals were carried out with an Oxford Xcalibur, Eos, Gemini CCD diffractometer with graphite-monochromatized MoKα radiation. X-ray diffraction intensities were collected (ω-scans with ϑ- and κ-offsets), integrated and scaled with the CrysAlisPro [26] suite of programs. The unit cell parameters were obtained by least-squares refinement (based on the angular settings for all collected reflections with intensities larger than seven times the standard deviation of measurement errors) using CrysAlisPro. Data were corrected empirically for absorption employing the multi-scan method implemented in CrysAlisPro.
The same space group and very close values of unit cell constants indicated that the sodium, rubidium and cesium salts were isotypic to one another and to the previously reported potassium salt [4]. In fact, an initial molecular model assuming the same positions of non-H atoms as in the potassium-containing crystal with the identity of the alkali ion changed to sodium, rubidium or cesium leads to smooth convergence of the structural parameters for the Na-, Rb- and Cs-acesulfamate salts during the least-squares refinement (with Shelxl-97 of the SHELX package [27, 28]) against the corresponding X-ray data set. The hydrogen atoms were positioned stereochemically and refined with the riding model. The methyl hydrogen atom locations were optimized during the refinement by treating them as rigid bodies which were allowed to rotate around the corresponding C–CH3 bond so as to maximize the residual electron density at their calculated positions. As a result, the methyl groups converged to staggered angular conformations. Crystal data, data collection procedure, structure determination methods and refinement results are summarized in Table 5.
Crystal data, X-ray diffraction data and refinement results for the isotypic sodium, rubidium and cesium acesulfamates.
| Na acesulfamate | Rb acesulfamate | Cs acesulfamate | |
|---|---|---|---|
| Empirical formula | C4H4NNaO4S | C4H4NO4RbS | C4H4CsNO4S |
| Formula weight | 185.13 | 247.61 | 295.05 |
| Crystal dimensions, mm3 | 0.20 × 0.19 × 0.16 | 0.23 × 0.12 × 0.04 | 0.33 × 0.31 × 0.07 |
| Crystal shape and color | colorless fragment; | colorless plate; | colorless plate; |
| Crystal system | monoclinic | monoclinic | monoclinic |
| Space group | P21/a | P21/a | P21/a |
| a, Å | 7.2518(2) | 7.4663(3) | 7.5995(4) |
| b, Å | 8.9414(4) | 9.6962(4) | 9.9439(4) |
| c, Å | 10.5929(4) | 10.4391(4) | 10.8814(6) |
| β, ° | 99.951(3) | 95.150(3) | 91.298(5) |
| Volume, Å3 | 676.52(4) | 752.68(5) | 822.08(7) |
| Z | 4 | 4 | 4 |
| Calculated density, g cm−3 | 1.82 | 2.19 | 2.38 |
| Absorption coefficient, mm−1 | 0.50 | 6.82 | 4.72 |
| F(000), e | 376 | 480 | 552 |
| θ-range data collection, ° | 3.00–26.00 | 3.45–26.50 | 3.75–27.00 |
| Index ranges hkl | −8 ≤ h ≤ 8 | −9 ≤ h ≤ 9 | −9 ≤ h ≤ 9 |
| −10 ≤ k ≤ 10 | −5 ≤ k ≤ 12 | −12 ≤ k ≤ 10 | |
| −13 ≤ l ≤1 2 | −12 ≤ l ≤ 13 | −12 ≤ l ≤ 13 | |
| Reflections collected | 5462 | 3038 | 3276 |
| Independent reflections/Rint | 1316/0.0403 | 1555/0.0389 | 1765/0.0303 |
| Observed reflections [I ≥ 2σ(I)] | 1212 | 1280 | 1392 |
| Absorption correction | Not applied | Semi-empirical from equivalent reflections | |
| Maximum/minimum transmission | 0.924/0.906 | 0.772/0.298 | 0.721/0.307 |
| Refinement method | full-matrix least-squares on F2 | ||
| Data/restraints/parameters | 1316/0/102 | 1555/0/101 | 1765/0/101 |
| R1/wR2 [I ≥ 2 σ(I)] | 0.0400/0.1145 | 0.0381/0.0859 | 0.0373/0.0753 |
| R1/wR2 (all data) | 0.0420/0.1166 | 0.0505/0.0924 | 0.0523/0.0889 |
| Goodness of fit on F2 | 1.122 | 1.020 | 1.071 |
| Largest peak/hole, e Å−3 | 0.41/−0.44 | 0.79/−0.61 | 0.87/−0.74 |
CCDC 1027264 (Na acesulfamate), CCDC 1009531 (Rb acesulfamate) and CCDC 1009532 (Cs acesulfamate) contain the supplementary crystallographic data for this paper. These data can be obtained free of charge from the Cambridge Crystallographic Data Centre viawww.ccdc.cam.ac.uk/data_request/cif.
Acknowledgments
This work was supported by the Universidad Nacional de La Plata, by CONICET (PIP 1529) and by ANPCyT (PME06 2804 and PICT06 2315) of Argentina and by FAPESP of Brazil. O.E.P., G.A.E. and B.S.P.-C. are members of the Research Career of CONICET.
References
[1] K. Clauss, H. Jensen, Angew. Chem., Int. Ed. Engl. 1973, 12, 869.10.1002/anie.197308691Suche in Google Scholar
[2] D. G. Mayer, F. H. Kemper (Eds.), Acesulfame-K, Marcel Dekker, New York, 1991.Suche in Google Scholar
[3] M. Kruger, K. Meister, R. Kava, Comprehens. Rev. Food Sci. Food Saf.2006, 5, 35.10.1111/j.1541-4337.2006.tb00081.xSuche in Google Scholar
[4] E. F. Paulus, Acta Crystallogr.1975, B31, 1191.Suche in Google Scholar
[5] E. J. Baran, V. T. Yilmaz, Coord. Chem. Rev.2006, 250, 1980.10.1016/j.ccr.2005.11.021Suche in Google Scholar
[6] H. Içbudak, A. Bulut, N. Cetin, C. Kazak, Acta Crystallogr.2005, C61, m1.10.1107/S0108270104028574Suche in Google Scholar
[7] A. Bulut, H. Içbudak, G. Sezer, C. Kazak, Acta Crystallogr.2005, C61, m228.10.1107/S0108270105008188Suche in Google Scholar
[8] N. Dege, H. Içbudak, E. Adiyaman, Acta Crystallogr.2006, C62, m401.10.1107/S0108270106027880Suche in Google Scholar
[9] H. Içbudak, E. Adiyaman, N. Cetin, A. Bulut, O. Buyukgungor, Transit. Met. Chem.2006, 31, 666.10.1007/s11243-006-0045-xSuche in Google Scholar
[10] H. Içbudak, E. Adiyaman, A. Uyanik, S. Cakir, Transit. Met. Chem. 2007, 32, 864.10.1007/s11243-007-0226-2Suche in Google Scholar
[11] N. Dege, H. Içbudak, E. Adiyman, Acta Crystallogr.2007, C63, m13.10.1107/S0108270106050591Suche in Google Scholar
[12] H. Içbudak, A. Uyanik, A. Bulut, C. Anci, D. Üllkü, Z. Kristallogr.2007, 222, 432.10.1524/zkri.2007.222.8.432Suche in Google Scholar
[13] Z. S. Sahin, H. Içbudak, S. Isik, Acta Crystallogr.2009, C65, m463.10.1107/S0108270109044515Suche in Google Scholar
[14] M. Cavicchioli, A. C. Massabni, T. A. Heinrich, C. M. Costa-Neto, E. P. Abrão, B. A. L. Fonseca, E. E. Castellano, P. P. Corbi, W. R. Lustri, C. Q. F. Leite, J. Inorg. Biochem. 2010, 104, 533.10.1016/j.jinorgbio.2010.01.004Suche in Google Scholar
[15] G. A. Echeverría, O. E. Piro, B. S. Parajón-Costa, E. J. Baran, Z. Naturforsch.2014, 69b, 737.10.5560/znb.2014-4061Suche in Google Scholar
[16] C. K. Johnson, Ortep-II: A Fortran Thermal-Ellipsoid Plot Program, Report ORNL-5318, Oak Ridge National Laboratory, Oak Ridge, TN (USA), 1976.Suche in Google Scholar
[17] W. Kabsch, Acta Crystallogr.1976, A32, 922.10.1107/S0567739476001873Suche in Google Scholar
[18] P. Nockemann, B. Thijs, K. Driesen, C. R. Janssen, K. van Hecke, L. van Meervelt, S. Kossmann, B. Kirchner, K. Binnemans, J. Phys. Chem. B2007, 111, 5254.10.1021/jp068446aSuche in Google Scholar
[19] S. P. Velaga, B. P. Vangala, S. Basavoju, D. Boström, Chem. Commun.2010, 40, 3562.10.1039/c0cc00028kSuche in Google Scholar
[20] A. D. Popova, E. A. Velcheva, B. A. Stamboliyska, J. Mol. Struct.2012, 1009, 23.10.1016/j.molstruc.2011.07.039Suche in Google Scholar
[21] G. Jovanovski, G. Tančeva, R. Šoptrajanov, Spect. Lett.1995, 28, 1095.10.1080/00387019508009449Suche in Google Scholar
[22] P. Naumov, G. Jovanovski, Curr. Org. Chem.2009, 5, 1059.10.2174/1385272013374851Suche in Google Scholar
[23] P. Naumov, G. Jovanovski, Spectrochim. Acta2000, 56A, 1305.10.1016/S1386-1425(99)00229-2Suche in Google Scholar
[24] R. Hooft, Collect, Nonius KappaCCD Data Collection Software, Nonius BV, Delft (The Netherlands), 1997–2000.Suche in Google Scholar
[25] Z. Otwinowski, W. Minor in Methods in Enzymology, Vol. 276,Macromolecular Crystallography, Part A (Eds.: C. W. Carter Jr, R. M. Sweet), Academic Press, New York, 1997, p. 307.10.1016/S0076-6879(97)76066-XSuche in Google Scholar
[26] CrysAlisPro (version 1.171.33.48, release 15-09-2009, CrysAlis171.NET), Oxford Diffraction Ltd. Abingdon, Oxford (UK) 2009.Suche in Google Scholar
[27] G. M. Sheldrick, Shelxl-97, Program for the Refinement of Crystal Structures, University of Göttingen, Göttingen (Germany) 1997.Suche in Google Scholar
[28] G. M. Sheldrick, Acta Crystallogr.2008, A64, 112.10.1107/S0108767307043930Suche in Google Scholar
©2015 by De Gruyter
Artikel in diesem Heft
- Frontmatter
- In this Issue
- EPR studies on carboxylic esters, 23 [1]. Preparation of new dialkyl azulenedicarboxylates and EPR-spectroscopic study of their radical anions
- Synthesis and crystal structure of a 3D copper(II)–silver(I) coordination polymer assembled through hydrogen bonding, π–π stacking and metal–π interactions, {[Cu(phen)2(CN)][Ag(CN)2] · 3H2O}n (phen = 1,10-phenanthroline)
- A polyoxometalate-based inorganic–organic hybrid material: synthesis, characterization structure and photocatalytic study
- Hydrogen-bonded assemblies of two organically templated borates: syntheses and crystal structures of [(1,10-phen)(H3BO3)2] and [2-EtpyH][(B5O6(OH)4]
- Catalytic activity of the nanoporous MCM-41 surface for the Paal–Knorr pyrrole cyclocondensation
- A new route for the synthesis of 4-arylacetamido-2-aminothiazoles and their biological evaluation
- Structural and spectroscopic characterization of isotypic sodium, rubidium and cesium acesulfamates
- Nd39Ir10.98In36.02 – A complex intergrowth structure with CsCl- and AlB2-related slabs
- Syntheses, structures and magnetic properties of two mononuclear nickel(II) complexes based on bicarboxylate ligands
- Synthesis and characterization of some new fluoroquinolone-barbiturate hybrid systems
- Synthesis of pyrazoles containing benzofuran and trifluoromethyl moieties as possible anti-inflammatory and analgesic agents